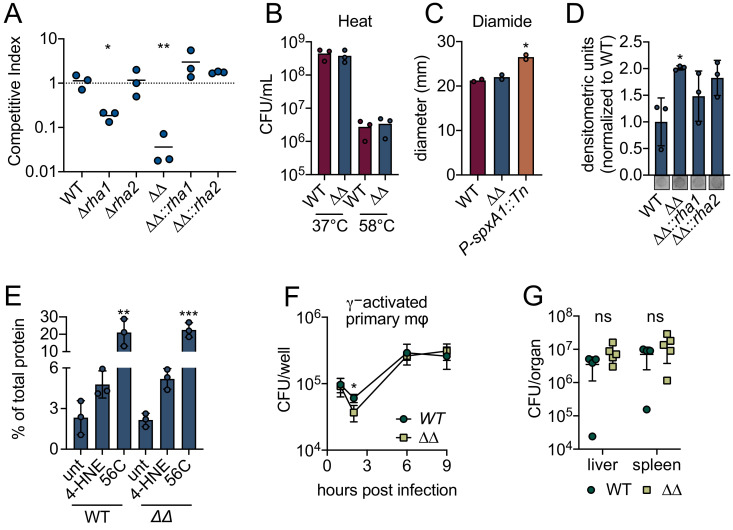
Figure 4. L. monocytogenes ∆rha1∆rha2 has reduced ability to survive 4-HNE toxicity.
(A) Competitive index of WT and mutant L. monocytogenes in PBS treated with 640 µM 4-HNE at 37°C for 1 hr. (B) CFU of WT and ∆rha1∆rha2 L. monocytogenes in TSB exposed to 58°C or 37°C for 15 min. (C) Diameter of zone of clearance by 1M diamide on lawns of WT, ∆rha1∆rha2 and positive control P-spxA1::tn L. monocytogenes on TSA plates as described in Reniere et al., 2016. (D) Accumulation of 4-HNE-adducted proteins in L. monocytogenes exposed to 640 µM 4-HNE for 3 hr in TSB media, assessed by dot blot and normalized to WT. Dot blot images below are representative. (E) Aggregated protein found in the insoluble fraction measured as percent of total protein in WT and ∆rha1∆rha2 L. monocytogenes. Untreated, 4-HNE treatment (640 µL for an hour) and heat shock (56°C for 10 min). (F) CFU/well of WT and ∆rha1∆rha2 L. monocytogenes in recombinant murine IFN-γ (100 ng) activated WT primary murine macrophages. (G) CFU/organ of WT and ∆rha1∆rha2 L. monocytogenes at 48 hr intravenous murine infection. Data in figures (A) and (D) are in technical triplicate, representative of at least three independent experiments. Data in (C) are two independent experiments, with two pooled biological duplicates within each experiment. Data in (B), (E), (F) and (G) are biological triplicate. Statistics in (A) are unpaired t-tests between WT and mutant L. monocytogenes competition pairs. Statistics in (C) are unpaired t-tests between WT and mutant L. monocytogenes. Statistics in (D) and (E) are an ordinary one-way ANOVA with a Dunnett’s multiple comparison test against WT (in D) or untreated sample (in E). Statistics in (F) are unpaired t-tests comparing WT and ∆rha1∆rha2 L. monocytogenes CFU at hour two post infection. Statistics in (G) are unpaired t-tests comparing WT and ∆rha1∆rha2 L. monocytogenes CFU within each organ. Error bars are mean ± SD. *p<0.05; **p<0.01; ***p<0.001. In figures (A) and (G), the line is drawn at the median of data.
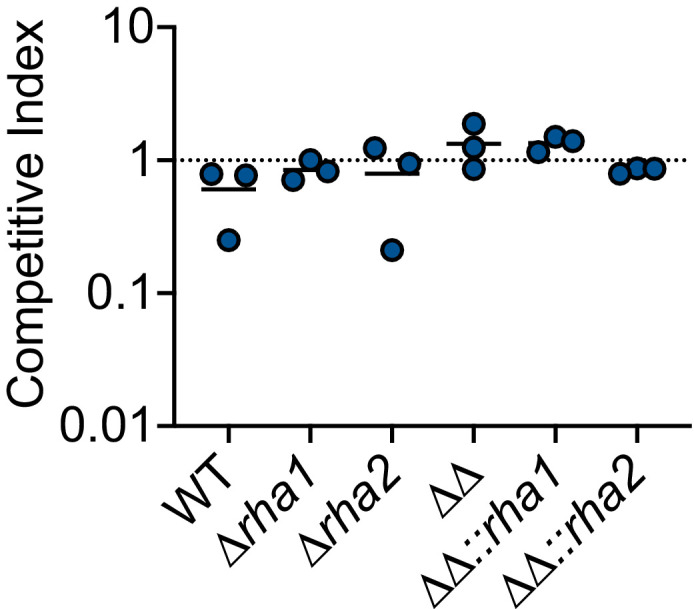
Figure 4—figure supplement 1. Impact of ∆rha1 and ∆rha2 on L. monocytogenes survival in PBS.


