

Abstract
There is a need for valves and pumps that operate at the microscale with precision and accuracy, are versatile in their application, and are easily fabricated. To that end, we developed a new rotary planar multiport valve to faithfully select solutions (contamination = 5.22 ± 0.06 ppb) and a rotary planar peristaltic pump to precisely control fluid delivery (flow rate = 2.4 ± 1.7 to 890 ± 77 μL/min). Both the valve and pump were implemented in a planar format amenable to single-layer soft lithographic fabrication. These planar microfluidics were actuated by a rotary motor controlled remotely by custom software. Together, these two devices constitute an innovative microformulator that was used to prepare precise, high-fidelity mixtures of up to five solutions (deviation from prescribed mixture = ±|0.02 ± 0.02| %). This system weighed less than a kilogram, occupied around 500 cm3, and generated pressures of 255 ± 47 kPa. This microformulator was then combined with an electrochemical sensor creating a microclinical analyzer (μCA) for detecting glutamate in real time. Using the chamber of the μCA as an in-line bioreactor, we compared glutamate homeostasis in human astrocytes differentiated from human-induced pluripotent stem cells (hiPSCs) from a control subject (CC-3) and a Tuberous Sclerosis Complex (TSC) patient carrying a pathogenic TSC2 mutation. When challenged with glutamate, TSC astrocytes took up less glutamate than control cells. These data validate the analytical power of the μCA and the utility of the microformulator by leveraging it to assess disease-related alterations in cellular homeostasis.
Keywords: Tuberous sclerosis complex (TSC), soft lithography, time-division multiplexing, electrochemistry, microclinical analyzer
Introduction:
Microfluidics conserve resources by performing experiments with lower volumes of reagents, thereby decreasing cost and facilitating a multiplicity of trials. This miniaturization also increases accessibility while reducing weight, volume, and device power requirements, enabling remote (point-of-care) field work and at-home testing. However, when creating formulations at the microscale, the difficulty in precisely controlling flow rate and accurately selecting solutions has traditionally resulted in decreased formulation fidelity, limiting the scope of experimentation.1,2 In applying microfluidics to biological systems, the drive to increase fidelity has resulted in a range of specialized microphysiological platforms, yet there is a need for versatile multi-valve fluidic platforms that are accurate, precise, modular, and accessible.3–5
Microphysiological systems research, an area of ever-increasing importance in pharmacology and toxicology, utilizes microbioreactors, also known as organs-on-chips or tissue chips, to recapitulate 2D or 3D tissues in vitro.6–11 These chips can be used independently to study a singular organ or they can be coupled to approximate organ systems. In particular, organs-on-chips can benefit from the application of cellular microphysiometry to measure dynamic changes in acidification12,13 or multiple analytes,14–17 but this will require the use of one or more pumps or valves dedicated to each experiment. In their operation, organs-on-chips are nourished by either intermittent media replacement or perfusion. Some organs require shear forces, and therefore perfusion, to achieve proper function. For perfusion, the flow of media is typically driven by syringe pumps or reservoirs pressurized by gravity, surface tension, or compressed gas although bio-pumps have also been created where contraction of cardiomyocytes drives fluid flow.18 In most cases, changing the media composition or adding a drug or toxin requires that the entire contents of the input reservoir be altered, the syringe replaced, or drug injected through a septum—valves are seldom used. Therefore, microphysiological systems can benefit from hardware that can automatically transition between media formulations, delivering drugs and toxins and removing samples for analysis.19
Creating a versatile multiport fluidic microformulation system relies on delivering precise and predictable flow that can seamlessly transition between different fluids, a task that requires both in-line flow and a multiport valve.20 Creating in-line flow, the first of these two requirements, allows fluid to be changed or replenished without stopping liquid flow, enabling continuous application of differential treatments. Many early microfluidic experiments using in-line flow were based on electrophoretic motivated flow. However, the high electric potential required for these experiments can interfere with analysis and the materials are limited and/or incompatible with cell culture. More recently, external peristaltic pumps can provide in-line flow, support cell culture, and even create the shear forces needed for differentiation in microphysiological systems.21,22 However, these pumps have traditionally been cumbersome, highly specialized, or expensive.12 Although examples of compact, versatile pumps can be found,21,23 there is unmet demand for easily integrated microfluidic pump-valve systems.
Previously reported microfluidic valves operate on a variety of actuation principles, including pneumatic, thermal, piezoelectric, magnetic, and mechanical.24,25 Perhaps the most commonly used valves are the pneumatically-actuated normally-open valves developed by Quake and co-investigators26 (normally-closed valves have been developed by Mathies and co-investigators27,28). One appeal of these valves is that three or four of them can operate in series as a peristaltic pump. To use these devices as either pumps or valves, pressurized air and multiple external solenoids and air lines are required. Additionally, no single one of these valves can select between multiple inputs and outputs, leading to a rapid proliferation of tubing and solenoids for any non-trivial fluidic logic or pump. Thus, microphysiological systems can similarly benefit from valves that can faithfully select between multiple inputs and/or outputs within a single, compact microfluidic device.
Relatively rare or phenotypically complex diseases, which are difficult to study by traditional methods such as epidemiology and animal models,29 are the focus of much of microphysiological systems research.30 Tuberous sclerosis complex (TSC) is an appropriate example: this rare genetic disease manifests itself by the appearance of “benign” hamartomas (tubers) in the brain and other vital organs, and seizures that adversely affect maternal and fetal outcome and as such is ill-suited for human drug trials.31 For many TSC patients, the most challenging symptom is epilepsy, a neurological disorder resulting from many different mechanisms. An emerging model of epilepsy places excitotoxicity from overstimulated glutamate receptors at the focal point.32 As glutamate transporters are predominately expressed in astrocytes, this suggests that altered astrocyte metabolic dynamics may play a role in the pathogenesis of epilepsy.
Here, we describe a new class of microfluidic pumps and valves that deliver precise control of flow rate and offer high fidelity sampling with compact, versatile, easily fabricated devices. The pump and valve were automated for efficiency and accuracy with the support of an intuitive user interface. This new platform was then coupled with electrochemical detection to automate analysis.20,33 We then used this innovative technology for real-time microphysiometry of glutamate metabolism in human astrocytes derived from a control subject and a TSC patient carrying a heterozygous loss-of-function mutation in the TSC2 gene.
Materials & Methods
Pump and Valve Fabrication.
The pump and valve were designed and built in-house utilizing technologies developed at the Vanderbilt Institute for Integrative Biosystems Research and Education (VIIBRE) (synopsis: http://cttc.co/technologies/rotary-planar-peristaltic-micropump-rppm-and-rotary-planar-valve-rpv-microfluidic-systems). Both pumps (See Pump Fabrication in supplemental materials) and valves (See Valve Fabrication in supplemental materials) were produced by combining a motor-driven actuator assembly with a custom fluidic chip (See Microfluidic Chip Fabrication in supplemental materials). Custom Automated Multi-Pump Experiment Running Environment (AMPERE) software operating on a notebook computer and a custom microcontroller unit automated the pump speed and valve position (see Automation: Hardware and Software Design in supplemental materials). The combination of five reservoirs connected to a five-port valve that was upstream of a pump comprised a microformulator. One of these microformulators with five sample vials (reservoirs) and an electrochemical sensor comprised a microclincal analyzer (μCA). These pumps and valves were used for all scalar, spectroscopic, and electrochemical measurements.
Pump and Valve Operation.
For operation of the rotary planar peristaltic micropump (RPPM), AMPERE rotated the pump actuator at a given number of revolutions per minute (rpm), so that when the inlet port on the microfluidic chip was connected to a liquid, it created flow within the fluidic channel. For operation of the five-port rotary planar valve (RPV), a one-time calibration procedure was required to set the valve actuator position relative to the ports. First, the valve was manually positioned so that the first port was open. Then, using AMPERE’s tare feature, the software set and stored that position as the 0° position in the non-volatile memory of the USB microcontroller (MCU) (Arduino Uno R3, Arduino). With the tare value set, the software can then rotate the actuator to 72°, 144°, 216°, or 288° to open other corresponding ports.
Microformulator Validation: Leakage.
To assess microformulator function, the pump and valve were visually inspected. The microformulator was primed with deionized water followed by a blank (4% w/v nitric acid, 12 hours) and visually inspected for leaks. Any devices that were visually distressed or leaking were removed from the study.
Pump Validation: Pressure Capacity and Stability.
The pressure capacity and stability of the pump was determined by connecting the pump to a pressure gauge. To do this, the pump’s input port remained unplumbed so that the pump could draw air from the room, and the output port was connected with Tygon tubing to a 2-inch adaptor vessel attached to a pressure gauge (Grainger, Lake Forest, IL) by way of a nut and ferrule connection. The pump was then set to run at 40 rpm until the air pressure no longer increased (less than 5 min). The pump was turned off and the air pressure at capacity was recorded. One pump was left under pressure and pressure stability was recorded over time.
Pump Validation: Flow Rate.
To assess pump flow rate fidelity, a pump was connected in line to a flow sensor (Sensirion, SLI-1000, Staefa, Switzerland) and programmed to sequentially increase actuator speed (0.1, 0.5, 1, 2, 5, 10, 15, 20, and 25 rpm for 600, 120, 60, 30, 30, 30, 30, 30, and 30 seconds, respectively). Real-time flow rate was recorded and plotted with one data point per second (each of these data points was an average of 1,000 data points). The average and standard deviation at each actuator speed was then plotted and linearly fit.
Valve Validation: Sample Fidelity.
Valve fidelity was quantified by assaying for sample contamination after passage through the microformulator. For this, a barium standard (100 ppm, 4% w/v nitric acid) was made from a concentrated metal solution (High-Purity Standards, Charleston, SC), Optima grade nitric acid (Fisher, Waltham, MA) and 18.2 MΩ deionized water. Then, four of the channels were filled (20 rpm) with this Ba solution and the remaining channel was flushed with a blank solution (4% nitric acid). The blank solution was sampled from the fifth port (288°), the farthest port from the common channel, so that the sample path flowed past each of the Ba-restraining ports before being collected. After flushing for 30 min, three consecutive aliquots of effluent (1 mL each) were collected from three devices and analyzed for Ba content through inductively coupled plasma optical emission spectroscopy (ICP-OES) on an Optima 7000 DV (Perkin Elmer, Waltham, MA) at 455.403 nm and percent valve contamination was calculated using the following formula, where conci is the initial concentration and concf is the final concentration.
| Equation 1. |
Microformulator Validation: Mixing.
To validate the microformulator’s delivery, mixtures were made and analyzed. The valve was programmed to open each of four ports sampling a metal-containing solution, thereby priming the lines with silver, barium, yttrium, and cadmium standards (0, 20, 100 ppm metal, 4% w/v nitric acid, 20 rpm). Then, each channel was opened (45 sec, 2 sec stop during valve change) to sample the metal-containing solutions, and the fifth channel was opened (5 min) to sample the blank (4% nitric acid). The resulting mixture was collected (five samples/device) for ICP-OES analysis. Each aliquot of this mixture was diluted 1/10 with 4% nitric acid and analyzed by ICP-OES at 371.029 nm, 233.527 nm, 214.440 nm, and 328.068 nm for Y, Ba, Cd, and Ag, respectively.
To compare port function, effluent from each of the ports was collected and the mass of the output was quantified. First, the valve was programmed to open each of the five ports (45 s each) and the pump was set to run at 20 rpm. After using this program to prime the lines, the output of each port was quantified by holding each channel open, and collecting and measuring the mass of the effluent (45 samples/device). These data were used to calibrate the flow rate for each port of the valve.
Electrochemical Measurements: AMPERE Program Validation and In-Line Mixing.
To demonstrate application of the microformulator and validate programming, the microformulator was integrated with an electrochemical detection system14 to either create in-line mixtures or achieve sample resolution.
First, the sensor was modified with a standard reference material and an enzyme, making it sensitive and selective to glutamate.34 The sensor consisted of a platinum screen-printed electrode array that was designed in house and made by Pine Research (Durham, NC). This array featured five electrodes: three platinum disk electrodes and two band electrodes. The larger of the two band electrodes (A = 19 mm2) was used as an Ag/AgCl quasi-reference, while the other (A = 0.08 mm2) was not used. The three platinum disk electrodes (A = 1.8 mm2) were used for glutamate detection. The electrode was made sensitive to glutamate by drop-casting a mixture of glutamate oxidase enzyme on the electrode array. Glutamate oxidase from Streptomyces (CAS # 39346–34-4, Sigma Aldrich, St. Louis, MO) was dissolved in 800 mg/mL bovine serum albumin (BSA, Sigma Aldrich) in minimal buffer (2 mM PBS, pH 7) to 10 mg/mL and stored for up to one month at −18°C until use. When required, these glutamate oxidase solutions were thawed, glutaraldehyde was added to 0.25% wt/v, and the mixture was vortexed for approximately five seconds. After mixing, the glutamate oxidase solution was quickly drop-cast by pipetting 1.0 μL onto the platinum disk electrode surface. This solution was allowed to dry under ambient conditions for one hour. For the automated electrochemical glutamate calibrations, the electrodes were used as is. For the cellular microphysiometry experiments, a 1.0 μL droplet of Nafion (5% v/v) was deposited on top of the glutamate oxidase to coat the electrode surface and exclude potential interferents. The layered device was allowed to dry for an additional 45 minutes before use. If not used immediately, electrodes were stored in the dark and in buffer (2 mM PBS/120mM KCl, pH 7).
These sensors are first-generation sensors that rely on the recognition of glutamate by the enzyme glutamate oxidase. When glutamate is encountered, the enzyme’s oxidase function converts glutamate to α-ketoglutarate and, as a side product, O2 gets converted to H2O2. This side product, H2O2, can be oxidized directly at the electrode surface, providing a signal that can be monitored electrochemically.
To investigate in-line mixing, the microformulator was integrated with the electrochemical detection cell, and electrochemical measurements were performed at varying sampling intervals and pump speeds programmed into AMPERE using a tabulated command sequence. The electrochemical detection cell (26 μL)—consisting of a fluidic housing and the hardware to seal the glutamate sensor within it—was connected to the microformulator using Tygon tubing, creating the microclinical analyzer (μCA). Using AMPERE, a tabulated command sequence was created to vary pump speeds and port designations. The valve was set to oscillate between 0 and 80 μM glutamate (port 1 and 2), with either 15, 30, or 60 sec between port switches. During the time the valve was set to oscillate, the pump was programmed to pump at either 5, 10, 20 or 40 rpm, switching off for 1 sec at each valve change. The electrical contacts on the SPE were then connected to a CHI-1440 multi-channel multipotentiostat (CH Instruments, Austin, TX) and it was set to hold +0.6 V vs. Ag/AgCl and the current was monitored.
Electrochemical Measurements: Automated Enzymatic Sensor Calibration.
To demonstrate the power of automation, the μCA was set up and a calibration protocol was programmed into AMPERE and executed. To do this, the five valve input ports were connected to five calibrant reservoirs (0, 20, 40, 80, and 160 μM glutamate, each in 2 mM PBS, 120 mM KCl, and pH 7.0) and the common valve output port was connected to the pump, whose fluidic output passed through a debubbler and then to the electrochemical detection cell. Using AMPERE, the microformulator was programmed to sample the five calibrants and administer them to the downstream electrochemical glutamate sensor. Experiments were run at flow rate of 20 μL/min (pump speed of 0.5 rpm). Before calibration, buffer was run through the system for the first 5 minutes while the baseline established. Then, calibrants were sampled for 240 sec each with 240 sec of buffer (2 mM PBS, 120 mM KCl, pH 7.0) in between each calibrant to re-establish the baseline. In between each calibration, the flow rate remained the same and buffer was run through the system. The program was set to loop and run a calibration every four hours and measured 19 glutamate calibrations over 76 hours. Data presented are for one glutamate sensor. Relative change in sensitivity was calculated by dividing the slope of the line for a give calibration by the slope of the first calibration and multiplied by 100. Experiments were run at ambient conditions.
Derivation, Validation, and Differentiation of hiPSCs into Astrocytes.
Two hiPSC lines were used in this study: CC-3, a previously published cell line derived from a control female subject,35 and TSP8–15, a cell line derived from a female patient with TSC and epilepsy (chromosome 16 C to G mutation at position 2131735 causing a premature stop codon). Human dermal fibroblasts were obtained by skin biopsy after patient consent/assent granted under an approved IRB protocol (Vanderbilt #080369) and reprogrammed by electroporation with the CXLE plasmid vectors using the Neon Transfection System (Life Technologies, Carlsbad, CA) following published methods.36,37 Normal karyotypes and lack of plasmid integration into the genomic DNA were confirmed for both lines. Pluripotency was validated by Pluritest,38 and/or immunostaining for pluripotency markers and their capacity to differentiate into cells derived from all three germ layers as well as into mature neural lineages.37,39–41
Differentiation of hiPSCs into astrocytes was performed by differentiating hiPSCs into cortical glutamatergic neuronal cultures, followed by a gradual enrichment of astrocytes in these cortical cultures. In brief, neural precursor cells (NPCs) were derived using a 11 day dual SMAD inhibition method as described by Chambers et al. 2009, except that 0.4 μM LDN-193189 (Stemgent, Lexington, MA) was used instead of noggin.21 On day 11, NPCs were transferred into neural differentiation medium, which corresponds to the neural maintenance medium described by Shi, Kirwan, and Livesey,43 except no additional insulin (other than what is already present in the N2 supplement) was included, for further differentiation and maturation.44,45 Between day 140–160 the medium was changed to BrainPhys Neuronal Medium (StemCell Technologies, Cambridge, MA) and the cultures were regularly propagated until pure astrocytic cultures were obtained. Cultures differentiated for about 300 days were assessed for glutamate uptake.
Astrocyte Culture for Glutamate Homeostasis Experiments.
To assess glutamate homeostasis of control (CC-3) and TSC-patient (TSP8–15) astrocytes, cells were harvested and replated at equal density onto filters of 12 well Transwell plates (Corning #3462, Corning, NY). Immunohistochemistry and glutamate uptake were quantified once the astrocyte cultures had reached confluency.
Immunocytochemistry.
Immunocytochemical analysis was performed on astrocytes plated into 96 well μclear plates (Greiner Bio-One, Monroe, NC) or on 12 well Transwell filters (Corning #3462, Corning, NY) as described by Neely et al. 2012. Briefly, the cells were fixed in PBS containing 4% paraformaldehyde (Electron Microscopy Sciences, Hatfield, PA) for 30 min at room temperature, permeabilized with 0.2% Triton-X100 for 20 min at room temperature and then incubated in PBS containing 5% donkey serum (Jackson ImmunoResearch, West Grove, PA) and 0.05% Triton-X100 for 2 hours at room temperature or overnight at 4°C. The following primary antibodies were used: mouse anti-glial fibrillary acidic protein (GFAP) antibody (diluted 1:1000, Cell Signaling Technology, #3670, Danvers, MA) and rabbit anti-S100 (diluted 1:500, Dako, #Z 0311, Troy, MI). Secondary antibodies conjugated to DyLight 488 or DyLight 549 (diluted 1:800, Jackson ImmunoResearch, Westgrove, PA) were incubated either for 2 hours at room temperature or overnight at 4°C. Images were obtained with a Zeiss ObserverZ1 microscope and AxioVs40 software (version 4.7.2).
Cellular Microphysiometry.
Online electrochemical analysis was done as before,34 with some modifications.
After making the electrode selective to the glutamate, it was loaded into the μCA housing for calibration. First, glutamate oxidase modified electrodes were sealed against the closed-cell polymethylmethacrylate housing (external dimensions w = 43 mm, l = 43 mm, h = 23 mm, internal dimensions r = 6 mm, h = 0.23 mm) with an O-ring, aligned with magnets, and compressed with screws. Then, calibrations were performed within an incubator by monitoring the current generated by five solutions ranging from 0–500 μM glutamate in BrainPhys media. Calibrants were sampled through a valve and pulled by the pump at a flow rate of 20 μL/min, and monitored by a CHI 1440 potentiostat held at +0.6 V vs. Ag/AgCl until a steady state was reached (~4 min). Each calibrant was interspersed with buffer (2 mM PBS, 120 mM KCl, pH 7.0) to provide a baseline. All calibrations were conducted at 37°C, and 5% CO2. Finally, a linear regression of the calibration data was used to calculate astrocytic glutamate uptake in the experiments below.
After sensor calibration, a Transwell membrane with astrocytes (8–12 days in culture) was removed from its ridged plastic support with a paring knife and transferred to the μCA bioreactor. To transfer the membrane, the electrode housing was opened and a membrane was placed on top of the electrode with the cells facing up. A second 0.3 μm membrane was placed on top to secure the cells in place. The two membranes were aligned with the electrode and the O-ring by the magnets on either side of the housing and compressed with the screws to seal the cell chamber. During treatment, the bioreactor chamber was amperometrically monitored by three different glutamate-sensitive electrodes along the cell-containing membrane at 0.6 V vs. Ag/AgCl. First, the cells were allowed to equilibrate in BrainPhys without N2A and SM1 supplements (10 min) before 50 μM glutamate in the same medium was passed over the cells (10 min). Then, BrainPhys was passed over the cells again (10 min) before challenging the cells with 500 μM glutamate (10 min). Flow was stopped for two seconds in between treatments to prevent pressure backup during the valve change, otherwise a flow of 20 μL/min was maintained for both the treatments and calibrations. Calibrations were performed before every one to two experiments. All calibrations and treatments were done at 37°C and 5% CO2. Using the current generated by the sample and the slope and intercept of the calibration curve, the glutamate concentration for a given current response was calculated. Then, the cellular uptake was calculated from the difference between the measured glutamate concentration and the glutamate concentration applied to the cells (50 μM or 500 μM).
Results:
Microformulator (Pump and Valve) Design, Fabrication, and Validation.
The valve is an innovative bistable design in that it has two stable resting positions—normally-open and normally-closed—depending on the actuator position (Figure 1B), that can maintain the valve settings for all ports without the need for continuous electrical power, vacuum, or pressure. The pump was designed so that rotation of the actuator peristaltically drives liquid flow through the microfluidic channel (Figure 1A). The microformulator (pump and valve assembly) weighed less than 1 kg, occupied ~500 cm3, and cost less than $18 in materials and labor to fabricate [pump and valve are pictured in Figure 2 and their design is detailed in Supplemental Figures 1 (pump) and 2 (valve)]. Both microfluidic chip configurations were approximately the size of a credit card (30–34 × 50 mm, Supplemental Figure 3) and accommodated low volume requirements (pump chip = 40 μL, average valve channel = 20 μL). These chips have endured over eight months of continuous use and 57 million actuator revolutions, with a single pump chip recirculating over 1,930 liters of water before failure.
Figure 1. Design and principle behind the rotary planar pump and the bistable rotary planar multiport valve.

Drawings of A) the rotary planar pump and B) the bistable multiport valve showing both the normally-open and normally-closed configurations that result from rotating the actuator. A) In the assembled rotary planar pump, the motor’s drive shaft turns the rollers over the pump chip to create fluid flow. Inset, as the actuator moves the rollers, the fluidic channel goes from closed to open, peristaltically advancing fluid along the channel. B) The valve operates by the drive shaft positioning the actuator groove over the ball and allowing the ball to rise, thereby relieving pressure on the valve chip and opening the channel. Inset: as the actuator rotates clockwise, the groove moves to the left past valve port one and port one closes.
Figure 2. Photographs of the microformulator.

A) The fully assembled microformulator: pump, valve, and sample vials with the electrochemical detection system (microclinical analyzer) with the inset showing a drawing of the electrodes and the sample chamber. B) The rotary planar peristaltic pump showing rollers positioned against the channels in the pump chip. C) The rotary planar multiport valve showing the five balls positioned against the channels of the valve chip. The valve actuator is mostly hidden by the black H-shaped ball fixture.
Microfluidic Pump Validation.
To quantify flow characteristics, the pump was integrated with an in-line flow sensor and flow rate was monitored at different actuator speeds. Flow rate correlated linearly with actuator speed (R2= 0.999) and had predictable flow from 2.4 ± 1.7 μL/min (0.1 rpm) to 890 ± 77 μL/min (25 rpm, Figure 3). At 0.5 rpm, used for biological tests, the flow rate was 20.7 μL/min with a standard error of the mean of ±0.2 μL/min. This pump weighed less than 0.5 kg and occupied ~250 cm3.
Figure 3: Pump flow rate analysis at different actuator speeds.
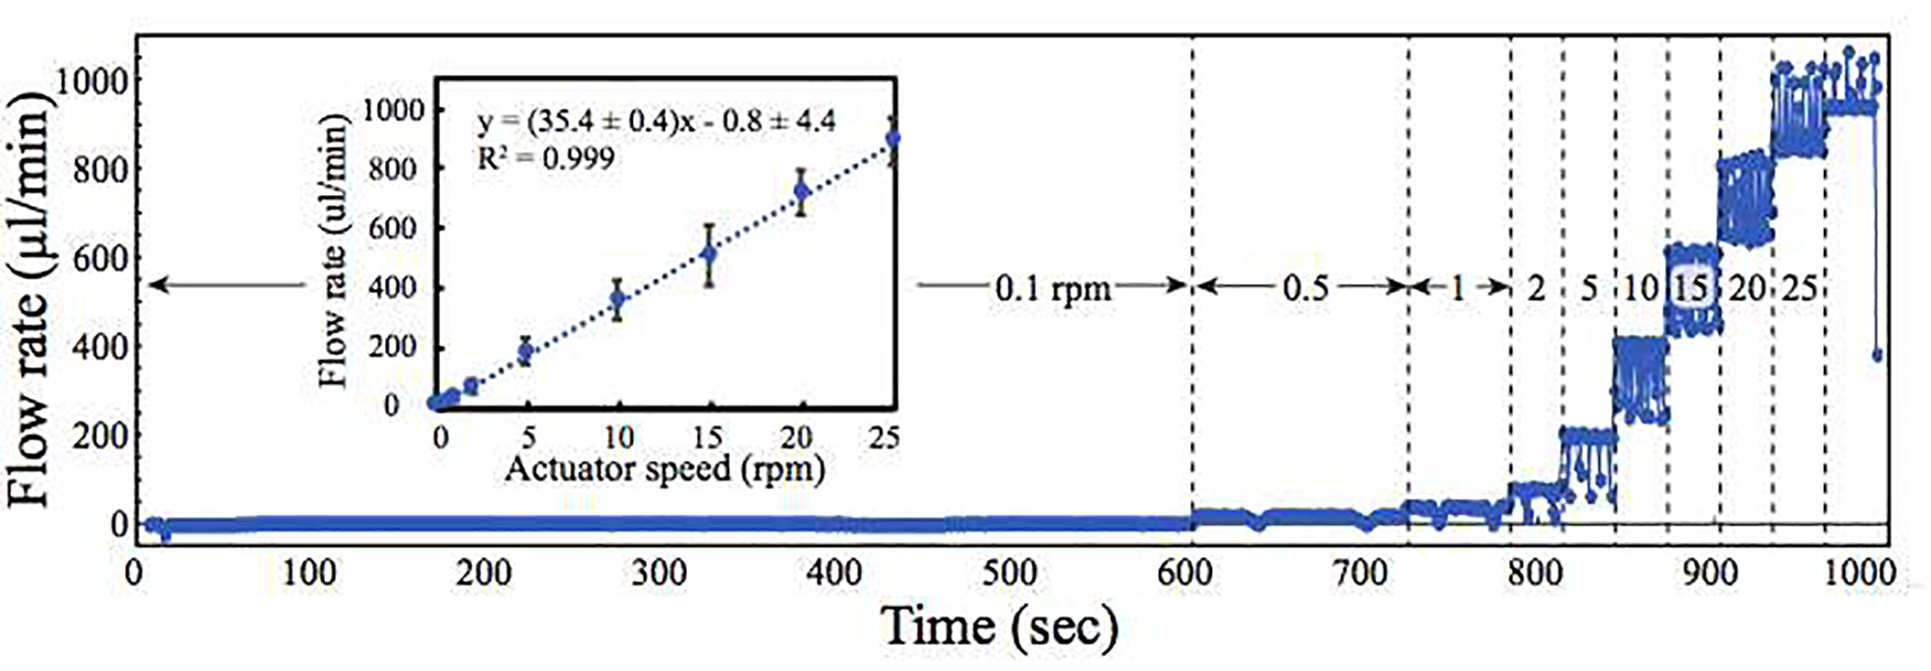
Flow rate vs. time plot showing an increase in flow rate with increasing actuator speed. For each speed tested (0.1, 0.5, 1, 2, 5, 10, 15, 20, and 25 rpm), the flow rate was monitored using a flow sensor for at least one actuator revolution. Transient decreases in flow rate are seen when the actuator roller departed from the channel. At speeds above 25 rpm (far right), the flow exceeded the dynamic range of the sensor, which was no longer able to measure flow accurately. Inset. Plot of average flow rate vs. actuator speed showing a linear increase in flow rate with increasing pump speed. Data are presented as means and standard deviations. All experiments were conducted under ambient conditions.
Pump Validation: Pressure Capacity and Stability.
The maximum pressure, Pmax, that the pump chips produced was determined by pumping air into a pressure gauge and measuring the maximum pressure achieved. The average value of Pmax for the pump chips tested was 256 ± 47 kPa, n=3. When the pumps reached Pmax, the pressure gauge showed slight fluctuations (~14 kPA) at the same frequency of the rollers departing the channel. In a test of one pump, when the pump was stopped and pressure was left in the pump chip, the pressure decreased over time (t= 0, 296 kPa; t=30 min, 283 kPa; t=1 hr 262 kPa; t=2 hr, 214 kPa).
Microfluidic Valve Validation: Sample Fidelity.
The ability of the microformulator to deliver one sample at a time with high purity was tested by sampling fluid from the 5th port of the valve and assaying for barium content. Upon analysis, contamination levels were found to be low (0.00522 ± 0.00006 % or 5.22 ± 0.06 ppb of Ba, mean and standard deviation, n=9, three devices).
Microformulator Validation: Mixing.
The microformulator’s ability to deliver a given prescribed mixture was tested using ICP-OES. When each metal was sampled for an equal amount of time, concentrations in the resulting mixtures showed strong agreement between the expected and measured values, ranging from −0.02 ± 0.02 % to 0.02 ± 0.02 % relative to one another (Figure 4A, n=5, average deviation of all ports and devices = 0.009 ± 0.019 %, n=60) when corrected for flow rate. Then, to test the effect of port switching on mixture fidelity, the microformulator alternated between sampling barium and a blank. The microformulator was most precise operating under port switching periods greater than ten seconds (deviation between expected and measured values = 0.01 ± 0.02 % at 1.2 switches per minute and 0.02 ± 0.03 % at six switches per minute, Figure 4B). When switching every second, the agreement between the expected and measured values decreased significantly (0.12 ± 0.10 %, p< 0.05).
Figure 4. Capability of a multiport valve to formulate mixtures as determined by inductively coupled plasma - optical emission spectroscopy (ICP-OES).
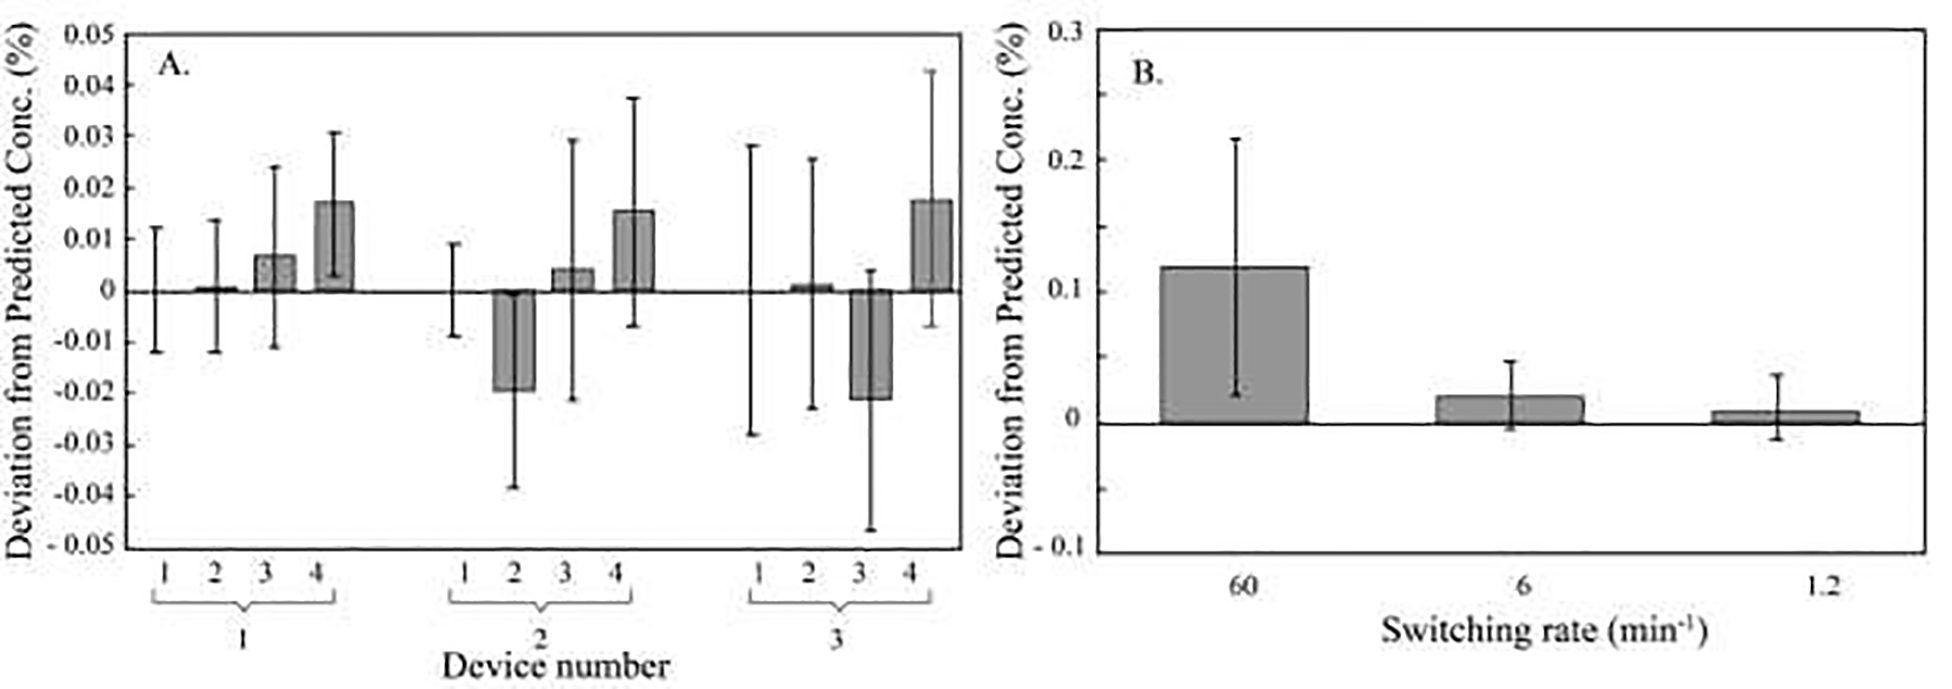
A) Deviation between expected and measured metal content from ports one through four relative to port one for three microformulators. To test the capabilities of the valve for formulation, mixtures were made from five inputs dispensing either dilute metal standards or a blank (4% nitric acid) and the composition of the resulting formulations was compared. For analysis, ICP-OES was performed for Y (port 1), Ba (port 2), Cd (port 3), and Ag (port 4) at 371.029 nm, 233.527 nm, 214.440 nm, and 328.068 nm, respectively, on an Optima 7000 DV. B) Deviation between expected and measured metal content at three switching frequencies. To test valve aptitude for formulation at different switching frequencies, effluent from an input holding a Ba solution (20 ppm Ba, 4% nitric acid) was sampled and mixed with a blank (4% nitric acid) at different valve switching frequencies (60, 10, and 1/min), collected and assayed for Ba content using ICP-OES at 455.403 nm. Data are represented as means and standard deviations, n=5, from three microformulators in ambient conditions.
Electrochemical Measurements: Program validation and in-line mixing.
Using AMPERE to control the microformulator, mixing in the electrochemical detection cell was investigated at varying switching speeds and flow rates. A current between that of the glutamate sample (~ −80 nA) and that of the buffer (~ 0 nA), was seen at lower flow rates and faster switching speeds (Supplementary Figure 4A, pump speed= 5 rpm, 15 sec pulse [orange trace]). Decreasing switching to a 30 sec interval (green trace) showed greater current oscillations. Further decrease of the switching speed to 60 sec (blue trace) shows larger changes in current. At this 60 second switching frequency, the peaks and valleys showed a flattening (Supplemental Figure 4B, blue trace). Further increase of pump speed to 20 rpm shows peak and valley flattening at both 60 sec and 30 sec switching speeds (Supplementary Figure 4C). Increasing the pump speed to 40 rpm shows close to full current oscillations at all switching intervals tested (Supplementary Figure 4D).
Electrochemical Measurements: Cyclic voltammetry of glutamate oxidation.
Glutamate oxidase was drop cast on an external Pt working electrode (without Nafion) in the same fashion as with the screen printed electrodes. Then, the Pt working electrode, Ag/AgCl reference electrode, and a Pt wire and mesh counter electrode were attached to a 1440 potentiostat and cyclic voltammetry scans were done in both 2 mM PBS, 120 mM KCl, and Brain Phys media with varying concentrations of glutamate (0, 0.05 and 4 mM). CV scans were done at 0.02 V/sec as two sweep segments with a sample interval of 0.001V and 2 sec of quiet time before the scan (Supplemental Figure 6). Based on the CVs, an overpotential of +0.6 V was chosen for amperometry experiments.
Electrochemical Measurements: Automated Enzymatic Sensor Calibration.
To demonstrate the utility of AMPERE automating fluid flow and selection, electrochemical calibrations of an enzymatic glutamate sensor were executed via a tabulated command sequence. Ampere successfully executed 456 individual command delivering samples necessary to calibrate the sensor every four hours for 76 hours. During this time the glutamate signal decreased, going from ~ −262 nA signal for 320 μM calibrant to ~ −227 nA for the same calibrant. A corresponding slope change from 0.803 at t=0 to 0.702 at t=72 hrs was seen (Figure 5).
Figure 5. Representative automated electrochemical glutamate calibration curves.
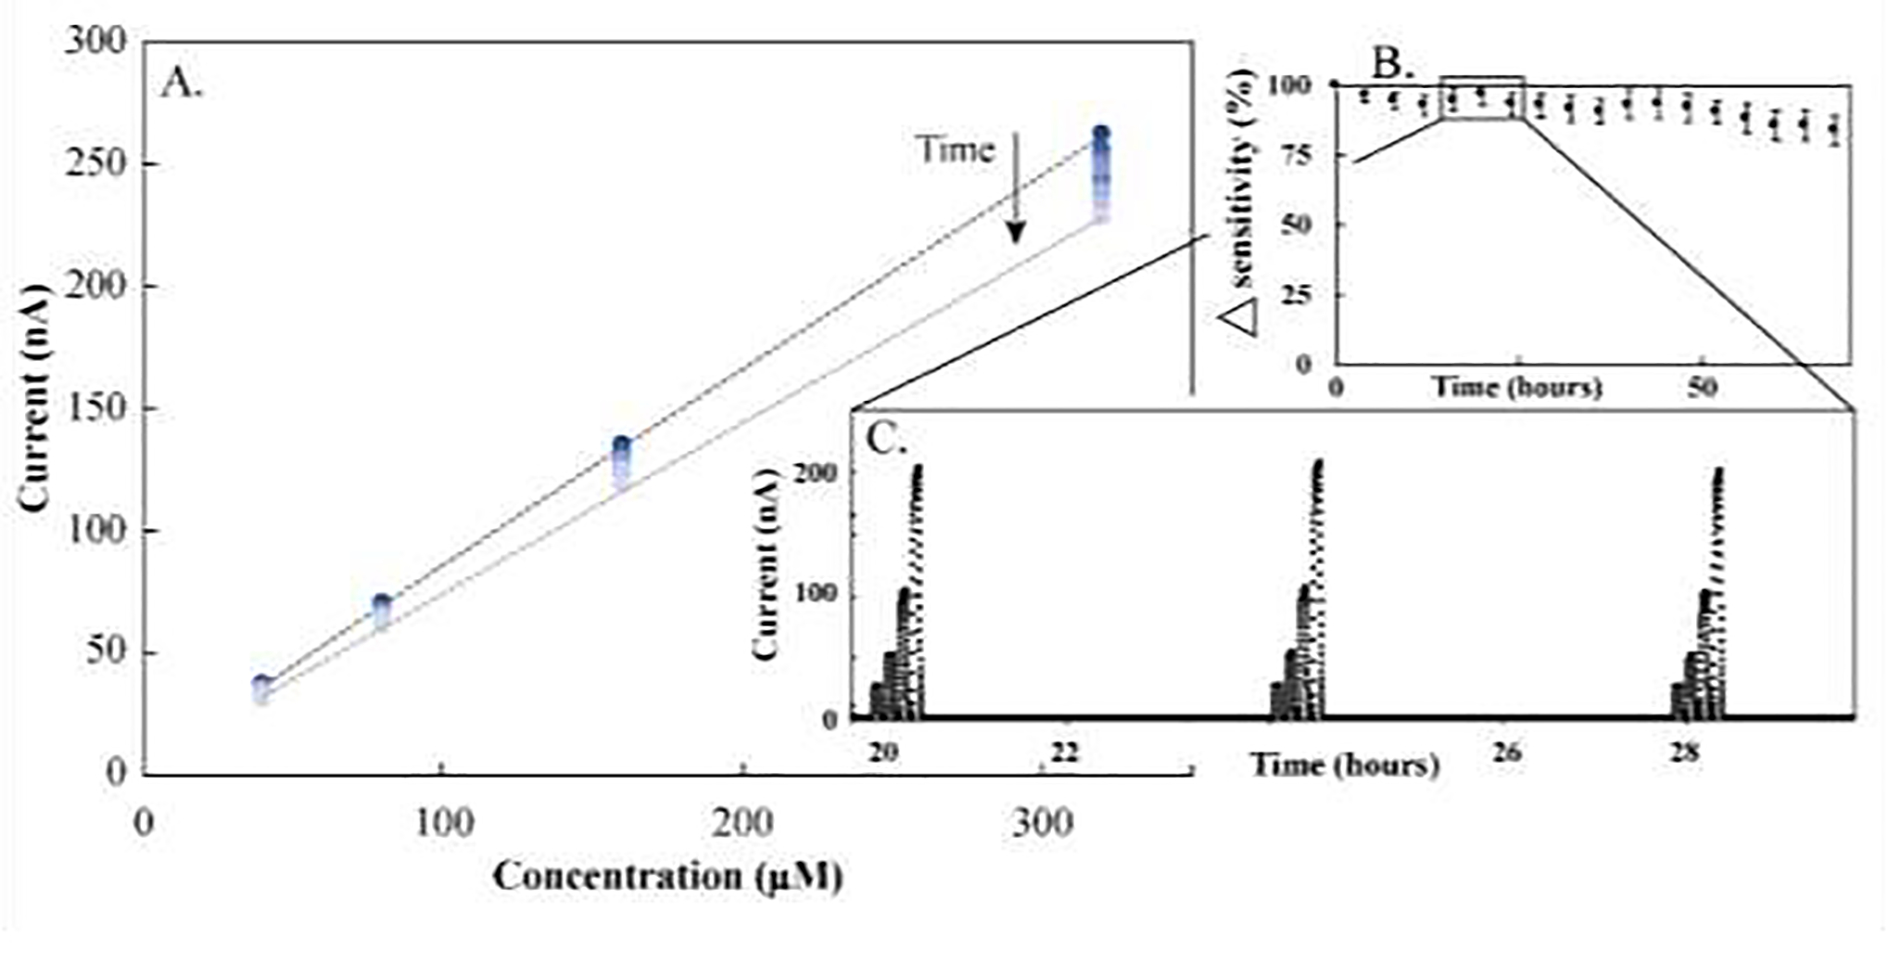
The microformulator was used to automate calibrations of an electrochemical glutamate sensor. These calibrations were run every four hours for 76 hours, resulting in a total of nineteen calibrations. Each calibration represents 16 pump commands and eight valve commands representing a total of 456 automated commands executed in one tabulated command sequence. A. Nineteen sequential calibrations plotted as current vs. concentration showing decrease in current magnitude over time. Darker data points represent earlier calibrations and lighter data points represent later calibrations, showing a difference in sensitivity from the first calibration (0.80 ± 0.01 nA/μM, n=3) and nineteenth calibration (0.70 ± 0.01 nA/μM, n=3) and therefore a decrease in sensor sensitivity with time. B. Relative change in sensitivity represented as a percent. C. Real-time data of three subsequent calibrations showing ~20,000 data points collected over these three calibrations and highlighting the benefit of automating electrochemical analysis. Calibrants (0, 40, 80, 160, and 320 μM glutamate in buffer [2 mM PBS, 120 mM KCl, pH 7.0]) were sampled at a flow rate of 20 μL/min for 240 sec/sample with 240 sec of buffer in between samples to establish baseline. Experiments were run at ambient conditions. Data are presented as the average current for one sensor at varying glutamate concentrations over time.
Differentiation of hiPSC -Derived Astrocytes.
hiPSCs derived from dermal fibroblasts of a control subject (CC-3) and a TSC patient (TSP8–15) with epilepsy were differentiated along a cortical glutamatergic neuronal lineage for 140–160 days. Astrocytes were purified from these cortical glutamatergic neuronal/astrocyte cultures as described in the methods section and fixed on day 353 of differentiation.
Cellular Microphysiometry.
To test glutamate homeostasis, human astrocytes differentiated from hiPSCs obtained from both a control subject and a TSC patient with epilepsy were transferred to the bioreactor and exposed to both 50 and 500 μM glutamate. Just before adding the cells to the bioreactor, the glutamate sensitive electrodes were calibrated (Supplemental Figure 7). During treatment, glutamate concentration was measured in real time (Figure 6A) and the average glutamate concentrations were quantified (Figure 6B). When challenged with 50 μM glutamate, control (CC-3) astrocytic cultures, took up 50% of this treatment (5.1 ± 0.7 μmoles glutamate, n=13), whereas TSC astrocyte cultures took up only 10% from a 50 μM glutamate exposure (1.0 ± 0.7 μmoles glutamate, n=7), significantly less than the control (CC-3) cultures (P<0.007, Figure 6B). When challenged with 500 μM glutamate, control cells (CC-3) took up 60% of the glutamate (64.5 ± 6.8 μmoles glutamate, n=13), whereas TSC astrocytes took up 40% of the glutamate (39.0 ± 4.9 μmoles glutamate, n=7), significantly less than the control (CC-3) astrocytes P<0.007 (Figure 6B).
Figure 6. Representative and average glutamate microphysiometry in TSC2 mutation and control human astrocytes.
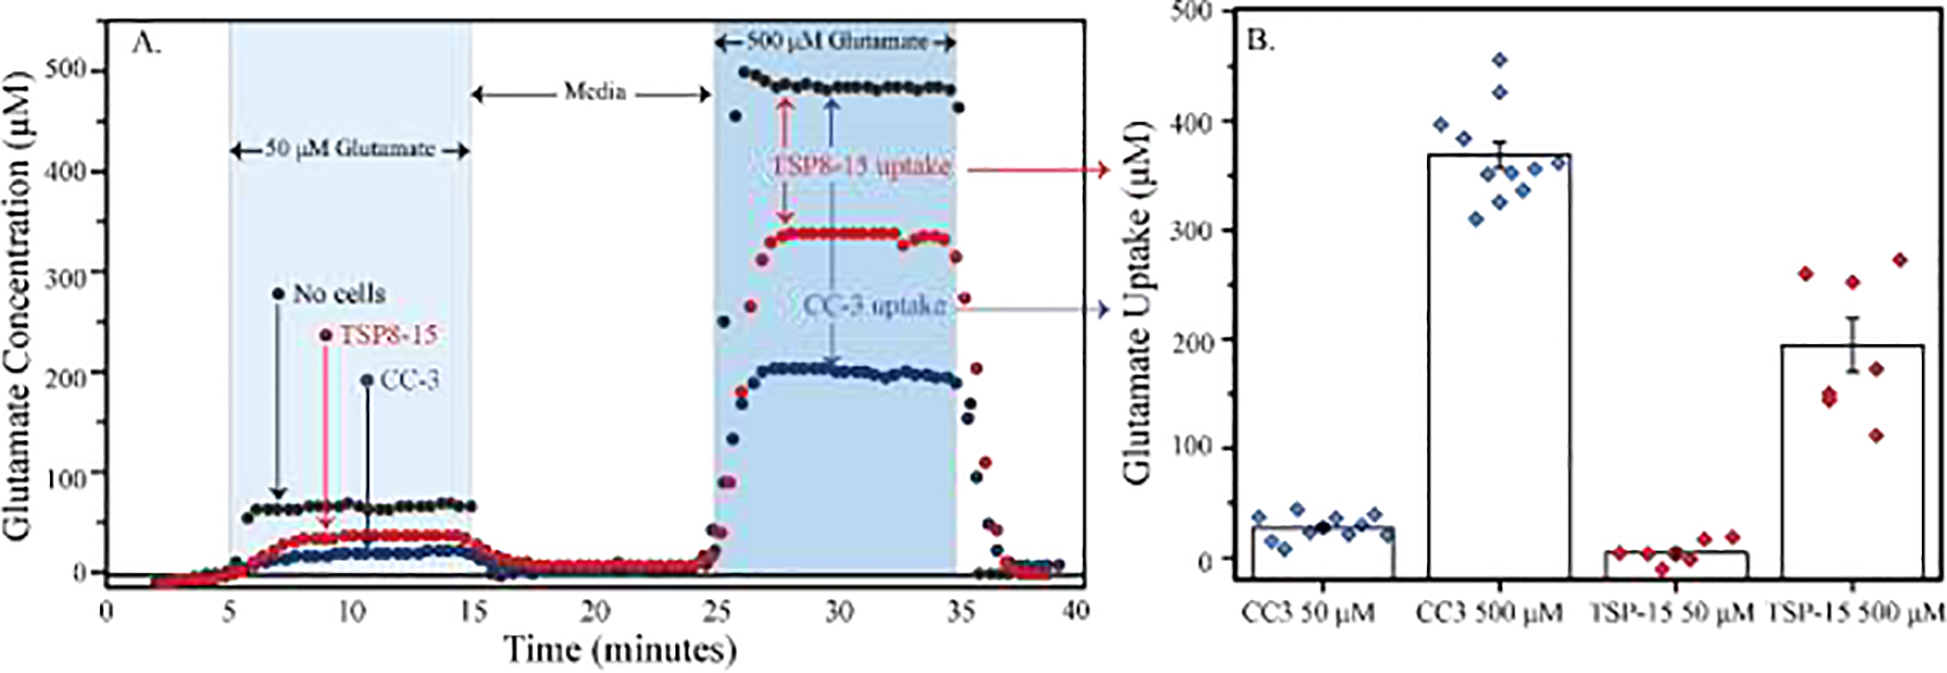
The μCA was used to monitor the response of control (CC-3) and TSC-disease (TSP8–15) astrocytes to glutamate stimulation in real time. A representative trace (A) and the average glutamate uptake (B) are plotted. A) Control (CC-3) and diseased astrocytes (TSP8–15) were grown on 12 well Transwell membranes for 8–12 days before they were loaded into the μCA bioreactor and treated with both 50 and 500 μM glutamate in BrainPhys media (represented with light and dark blue columns, respectively) and their response was measured in real time. B) Average glutamate uptake was calculated by subtracting the glutamate concentration measured from either TSP8–15 cells (red circles) or CC-3 cells (blue circles) from that with no cells (black circles). All experiments were performed at 20 μL/min, 37°C, and 5% CO2. Data are presented as mean and standard error for all measurements in (B), n= 7–11, P<0.001 resulting from a T-test with unequal variance.
Immunocytochemistry.
To test for astrocytic markers, both control (CC-3) and diseased (TSP8–15) cells were imaged. The large majority of cells in these cultures expressed the astrocytic markers GAFP and S100 (Supplemental Figure 8). No obvious difference in the expression of these two markers was observed between control and TSC astrocytes.
Discussion:
We developed a new class of microprocessor-controlled microfluidic pumps and valves to address the need of the organotypic culturing field for low-volume, automated systems for selecting and delivering solutions.3 The innovative bistable multi-port valve design was created so that all of the five valves internal to the device had two stable resting positions—normally-open and normally-closed—depending on the actuator position (design principle detailed in Figure 1B and assembly detailed in Supplemental Figure 2). The pump design also required rotation of its actuator. For the pump, rotation of the actuator peristaltically drove liquid flow through the microfluidic channel (design principle detailed in Figure 1A and assembly detailed in Supplemental Figure 1).
The microformulator used a modular microfluidic pump (Supplemental Figure 1) and valve (Supplemental Figure 2) that were designed to be easily fabricated, accessible, durable, and portable. The design of both the pump and the valve was centered around low-volume PDMS-based microfluidic chips (Supplemental Figure 3), although a variety of other materials could be used depending on the application.7,25,46,47 These chips were based on a planar format that was easily fabricated using single-layer soft lithography. Additionally, both chip configurations were approximately the size of a credit card (30–34 × 50 mm), accommodated low volume requirements (pump chip = 40 μL, average valve channels = 20 μL), and cost less than $18 in materials and labor to fabricate. The resulting pump and valve pair was light-weight and small, weighing less than a kilogram including motors and occupying ~500 cm3 when fully assembled. The common mode of fabrication, low cost, small size, longevity, and low-volume requirements make this system accessible for creating in-line flow and faithfully selecting solutions.
The rotary planar peristaltic pump was designed to deliver precise and predictable in-line flow at the microscale. Within the pump, flow was generated by positioning a pump chip between an actuator and a baseplate and applying compressive force to close the channels such that rotation of the actuator created in-line flow (Figure 1A and Supplementary Figure 1). To quantify flow characteristics, the pump was instrumented with an in-line flow sensor and flow rate was monitored at varying actuator speeds. Flow rate correlated linearly with actuator speed (R2= 0.999) and had predictable flow from 2.4 ± 1.7 μL/min (0.1 rpm) to 890 ± 77 μL/min (25 rpm, Figure 3). When an actuator roller departed from the channel, the flow showed a transient decrease in rate. For example, two momentary drop-offs in flow rate can be seen at a speed of 0.5 revolutions per minute over a two-minute period (600–720 sec, Figure 3), corresponding to each of the actuator rollers. Overall, these pumps endured over 57 million actuator revolutions and eight months of continuous use, with a single pump chip recirculating over 1,930 liters of water before failure. With these pumps, reliable in-line pressure-driven flow is available on demand for animating microphysiological systems and coupling them to analytic instrumentation.
In pressure-driven flow systems, it is important to know the maximum achievable pressure Pmax and stability of the system and operate within those limits. When tested by pressurizing a chamber with air, the pump chips were able to produce and hold 256 ± 47 kPa, about 2.5 atmospheres, or just above a common automobile tire pressure. At these pressures, the gauge showed slight fluctuations in sync with the rollers departing the channels, similar to the fluid flow rate drops seen (Figure 3). Because of these oscillations, the pressure limit is thought to be determined at the moment of approach and/or departure of the rollers to the channel. While running at Pmax, air may be able to escape past the roller and through the channel. The pressure of one pump chip was found to decrease 28% after 2 hrs. It is unclear if the pressure instability in the chips is due to air escaping around the rollers. Alternative rationales include air escaping at the Tygon tubing-PDMS junction, the Tygon tubing-pressure gauge junction, or through the bulk PDMS. Given that the viscosity of air is less than 1/50th of the viscosity of water, this air test is a good demonstration of the ability of a stationary pump to hold a back pressure. Using this fabrication process, the pump channels are closed by the actuator being lowered onto and depressing the pump chip until the channels close due to the pressure at the roller-chip interface. Therefore, depressing the rollers further may increase the pressure capacity although it may also shift the failure mode resulting in tears or delamination of the chip layers, for example. The flow resistance, and therefore pressure within the system, can increase by increasing the flow rate, increasing the viscosity of the substance flowing through the channels or changing the flow path in such a way that increases the flow resistance (sharper angles, smaller cross-sectional area, or larger surface area of an organotypic culture platform, for example). However, as long as the pressure against with the pump is normally pumping is much smaller than Pmax, the flow rate of the pump will be independent of back pressure. Shkolnikov et al. describe a miniature peristaltic pump that exhibits just such a characteristic, with a Pmax of 48 kPa.48 The pump described here demonstrated a Pmax that is five times higher (~250 kPA or 2.5 atmospheres), pumping to a pressure of 25 meters of water—far in excess of pressures typically used PDMS lab-on-a-chip devices. The relatively high Pmax, and stability of the pump in the microformulator allows for easy integration into a range of other systems.
Leveraging the same chip-based format as the pumps, we report a new multi-channel rotary planar valve. This valve was designed to select the flow path by combining an actuator that compresses an array of balls against a valve chip so that, depending on actuator positioning, the ports were either open or closed, selecting samples with high fidelity (Figure 1B, and Supplemental Figure 2). Sample fidelity, expressed here as contamination levels, was tested by sampling from the last port of the valve and assaying for barium content. In this configuration, the barium-free sample traveled the full length of the common channel and passed four barium-restraining ports and, thereby, was exposed to multiple sources of potential contamination, including valve leakage, absorption/desorption, and stagnant regions. Still, contamination was low (0.00522 ± 0.00006 % or 5.22 ± 0.06 ppb of Ba, mean and standard deviation, n=9, three devices, Figure 4). Using this five-port rotary planar valve, one sample at a time was delivered with high purity within a single compact microfluidic device. Pairing in-line flow with faithful selection between multiple inputs enables continuous differential treatment, a powerful fluid-handling tool.
The combination of predictable flow with high-fidelity sampling is foundational in creating accurate and precise mixtures and, therefore, microscale systems testing.8 To create a mixture using the microformulator, four ports were loaded with different metal standards and sampled, and the resulting mixture was collected and analyzed using ICP-OES. When each metal was sampled for an equal amount of time, concentrations in the resulting mixtures from all five ports showed strong agreement between the expected and measured values, ranging from −0.02 ± 0.02 % to 0.02 ± 0.02 % relative to one another (Figure 4A, n=5, average deviation of all ports and devices = 0.009 ± 0.019 %, n=60) when corrected for flow rate. To investigate how mixture fidelity changes with port switching speed, the valve was set to oscillate between two ports at different oscillation frequencies. When switching every second, the agreement between the expected and measured values decreased significantly (0.12 ± 0.10 %, p< 0.05). The microformulator was most precise operating under port-switching periods greater than ten seconds (deviation between expected and measured values = 0.01 ± 0.02 % at 1.2 switches per minute and 0.02 ± 0.03 % at six switches per minute, Figure 4B). The five-port rotary planar valve used in-line flow and alternated between solutions to successfully create mixtures with high fidelity. While 10 s switching is adequate for many applications, refinements to the valve design could provide high fidelity delivery with sub-second switching. Such refinements might include using absolute rather than indexing encoders on the valve to allow the valve to reverse rather than turn in one direction only and operating the motors at transiently higher currents to provide higher torques at high switching speeds. For operation, the pump should be turned off (<1s) while switching the valve. Additionally, changes in the pump design could also increase accuracy in fluid delivery by reducing pulsatility.
To demonstrate the power of direct coupling and analysis, rapid, in-line switching between samples was observed in real time. For real-time analysis, the microformulator was paired with an electrochemical detection cell, creating the μCA, although a variety of built-in sensors could be used.49–51 Electrochemical analysis was chosen because the samples do not need any preprocessing, and the sensitivity of this technique supports microscale testing. Using the μCA, switching speed was quantified downstream of the microformulator by an electrochemical sensor. In any system with continuous in-line flow and time-varying concentrations, samples are not isolated from each other but delivered in series and separated by sample fronts that obey Poiseuille flow. The size of the sample front—a spatially and temporally defined region where mixing occurs—defines the experimentally accessible time frame and range of formulations.52 As pulses were administered by the valve, patterns with 15-, 30-, and 60-second periodicity (corresponding to the valve switching frequency) were reported by the electrode (Supplementary Figure 4). Because of the geometry of the μCA chamber (radius=6 mm) relative to that of the sample input tubing (r= 0.25 mm), the sample front was expected to expand significantly upon entry into the analytical chamber (volume = 26 μL). Therefore, oscillating the microformulator between different sample inputs can create mixtures in real time or allow for full sample resolution depending on pump speed and sampling time interval. By setting the pump to run at relatively low flow rates (5 rpm) and setting the valve to rapidly oscillate between samples (15 second switching frequency), mixing can be achieved in the electrochemical cell (Supplementary Figure 4A). Decreasing switching speed to a 30 sec interval (green trace), or 60 sec interval (blue trace) showed greater resolution between the two samples being drawn through the system. Holding the switching frequency at 60 sec and increasing the pump speed, showed flattening at the peaks and valleys of the blue trace, indicating full resolution of the two samples (Supplementary Figure 4B). Further increase of pump speed showed peak and valley flattening at more rapid switching speeds (Supplementary Figure 4C and D). Therefore, depending on flow rate and the rate of oscillations between different sample inputs, the microformulator can either provide sample resolution or create mixtures in real time, enabling sequential treatments, calibrations or gradients to be created and delivered. This μCA setup is ideal for real-time monitoring but is one example of how the microformulator can be integrated with hardware for in-line, real-time analysis. Moving forward, the scope of analytical instrumentation used with the microformulator can be expanded to include biochemical, spectroscopic, and spectrometric techniques.9,49,53
All of the microformulator features described thus far—predictable flow, sample selection, mixture fidelity, in-line mixing, and analytical coupling for real-time analysis—are of limited use without automation to ensure proper execution. Although reducing the risk of human error and increasing reliability often provide the initial impetus for automating systems, enhancing productivity by freeing researchers to perform other tasks is a welcome collateral benefit. For example, one time-intensive requirement of accurate electrochemical detection is the need for sensor calibration. With the support of the intuitive user interface provided by the Automated Multi-Pump Experiment Running Environment (AMPERE, Supplemental Figure 5), enzymatic glutamate calibrations were automated to execute every four hours for 76 hours (Figure 5). AMPERE was used to design and execute efficient and repeatable workflows for calibration by automating pump and valve operation. For example, the automated electrochemical glutamate calibration (Figure 5) included 456 different pump and valve settings that could be reexecuted with a single AMPERE command. Pump and valve protocol parameters (pumping speed, valve port designation, and duration) were defined in this software as a command sequence, which was then successfully executed. With each subsequent calibration, the lactate signal decreased slightly, going from − 262 nA to −227 nA over the course of 19 calibrations and 76 hours of continuous use. Decreases in signal strength are typical for enzymatic electrochemical sensors, and serves as a motivating force for automation, since with frequent calibration, electrochemical sensors can operate accurately for extended periods. Additionally, decreasing user interactions can facilitate a broad range of experiments, including those requiring temperature regulation, light deprivation, and sterile conditions. Automation also grants access to temporal ranges previously inaccessible due to either the speed (sub-second) or duration (days to years) of the experiment. Automation makes this system a versatile and effective tool for microscale experimentation—including animating microphysiological systems.
With automated fluid flow and sample selection in place, organotypic culturing and experimentation can be efficiently executed to answer complex questions about health and disease. One open question with regard to TSC is if the aberrant glutamate homeostasis observed in Tsc1-astrocyte specific knock-out mice translates to humans. To address this question and demonstrate the utility of the microformulator and the μCA, control (CC-3) and diseased (TSP8–15) astrocytes (pictured in Supplemental Figure 8) were placed in the electrochemical detection chamber, and the chamber was sealed and connected to the microformulator pump and valve. Then using the electrochemical detection cell as a bioreactor, astrocytic response to glutamate challenge was measured in real time (Figure 6A). When challenged with a high dose of glutamate (500 μM), TSC astrocytes only took up 60% of the glutamate that control astrocytes removed (P<0.007, Figure 6B). Although more experiments are required to identify the mechanism of glutamate uptake responsible, this decrease in astrocytic glutamate uptake may result in increased glutamate in patients with TSC. If this is the case, it may cause aberrant neuronal activity, which is hypothesized to translate to epilepsy. When lower concentrations of glutamate (50 μM) were used as a challenge, TSC astrocytes removed only 20% of the glutamate that was removed by control astrocytes (P<0.007, Figure 6B). Because this aberrant metabolism persists under a range of glutamate concentrations, further research into its effect on neurocognition, learning, and memory may also prove fruitful. In future studies, the microclinical analyzer can be used to evaluate the mechanism responsible for the difference in glutamate uptake seen here.54 With experiments like these, we can not only model and assess the physiological underpinnings of rare or phenotypically complex diseases, but also investigate their response to drugs and toxins.
Conclusion:
This work describes an innovative microfluidic control and measurement system that is versatile and portable, delivers low volumes with accuracy and precision, and facilitates the efficient use of personnel at an accessible price. Using the designs presented here, new in-line rotary planar pumps and bistable multiport valves were created that incorporated fluidic chips with a stepper motor to drive an actuator that either moved liquid or directed flow with precision and accuracy. The capabilities reported here are versatile: the microformulator can be easily integrated with a range of analytical instrumentation and organotypic cultures. This system is also accessible: it weighs less than a kilogram, occupies around 500 cm3, can pump to pressures of 256 kPa (i.e., ~2.5 atmospheres), and costs under $18 in materials and labor to fabricate. To demonstrate the utility of the microformulator and to address current questions about health and disease, we compared the physiology of hiPSCs derived from a healthy individual and one with TSC. To this end, automated electrochemical analysis was used to measure, in real time, the metabolism of astrocytes that had been derived using hiPSCs from both individuals. When challenged with glutamate, TSC astrocytes took up significantly less glutamate than did control cells. These differences in glutamate homeostasis may make TSC patients more vulnerable to glutamate-induced cytotoxicity, epilepsy, and decreased mental faculties. However, the systems presented here go beyond the investigation of TSC, as they can be routinely incorporated into a wide range of experimentation, including the testing of chemicals, drugs, cosmetics, and food ingredients.
Supplementary Material
Research Highlights.
Design, fabrication and validation of a new class of microfluidic pumps and valves.
Precise control of both flow rate and faithful selection of microscale solutions.
Automated, real-time inline electrochemical monitoring of cellular microphysiology.
Astrocyte differentiation from hiPSCs for both a control subject and a TSC patient.
First report of altered glutamate metabolism in human astrocytes.
Acknowledgements
This work was supported in part by Intelligence Advanced Research Projects Activity grant number 2017-17081500003, National Institutes of Health (NIH) training grant number ES007028, NIH awards UG3TR002097 (J.P.W., K.C.E., M.D.N., A.B.B.), R01ES07331 (A.B.B.), R01ES010563 (A.B.B.), R01ES016931 (A.B.B.), 1U01CA202229 (D.A.M. and J.P.W.), and UL1TR002243 and U01TR002383 (J.P.W.), Defense Threat Reduction Agency grant number CBMXCEL-XL1-2-001 through subcontract 468746 issued by Los Alamos National Laboratory (JPW), and using the resources of the Vanderbilt MicroFabrication Core operated by the Vanderbilt Institute for Integrative Biosystems Research and Education. The authors would like to thank Ronald Reiserer for his constructive feedback on the design and execution of the experiments and crafting of the manuscript, Philip Samson for his microfluidic insights, Sara Melow for assisting with the real-time electrochemical analysis, and Hunter Tidwell for his work on the valve design and microformulator prototyping.
Disclaimer. This article reflects the views of the authors and should not be construed to represent the views or policies of any of the funding agencies.
Author’s biography
Dusty Rose Miller, Ph.D. is a postdoctoral scholar at Vanderbilt University in Nashville, TN. Her research focuses on developing technology for investigating how pesticides effect the brain.
David K. Schaffer is the Director of the Vanderbilt Microfabrication Core, and a Research and Development Engineer at the Vanderbilt Institute for Integrative Biosystems Research and Education (VIIBRE). He specializes in design and fabrication of microfluidic systems.
M. Diana Neely is a Research Associate Professor at Vanderbilt University Medical Center. Her research efforts are focused on developing human CNS model systems that enable her to elucidate cellular and molecular mechanisms underlying the effects of genetic and environmental factors adversely affecting the development of the human nervous system.
Ethan McClain is a Graduate Research Assistant in the Department of Chemistry at Vanderbilt University. His current research focuses on the development and application of enzymatic biosensors in the investigation of neurotransmission.
Adam Ryan Travis, Ph.D. is a chemist for the Tennessee Department of Agriculture’s Consumer and Industry Services Lab in Nashville, TN.
Jennifer McKenzie is President of McKenzie Clinical Consulting. She is board-certified in Toxicological Chemistry from the National Registry of Certified Chemists and Molecular Diagnostics by the American Association of Bioanalysis and currently works in clinical laboratory management and as director of clinical laboratories.
Frank E. Block III is a Regulatory Health Project Manager and Senior Health Scientist in the Office of Strategic Partnerships and Technology Innovation at the US Food and Drug Administration and an Adjoint Assistant Professor of Biomedical Engineering at Vanderbilt University. His research focuses on the development of mechanical and electrical support systems for Organ-on-a-Chip and Microphysiological Systems. This article reflects the views of the authors and should not be construed to represent FDA’s views or policies.
Erik Werner is a Ph.D. candidate in the Department of Biomedical Engineering at the University of California Irvine. His research includes software development and mechanical and electrical engineering for Organ-on-a-Chip and Microphysiological Systems.
Laura Armstrong, M.D. Ph.D. is doing her residency in Child Neurology at Vanderbilt University Medical center. Her research focuses on modeling tuberous sclerosis complex using patient-derived cells.
Dmitry A. Markov, Ph.D. is a Research Assistant Professor in the Department of Biomedical Engineering and a faculty fellow of the Vanderbilt Institute for Integrative Biosystems Research and Education at Vanderbilt University. His research interests lie in development of microfluidic bioreactors for long-term organotypic cell culture, organs-on-a-chip, and the development of novel instrumentation for measurements, microenvironmental control and manipulation within microbioreactors to mimic in vivo conditions ex vivo.
Kevin Ess holds the Gerald M. Fenichel Chair in Neurology. He is Chief of the Division of Pediatric Neurology at Vanderbilt University Medical Center. His research focuses on neurogenetic disorders that affect children.
Aaron B. Bowman is Professor and Head of the School of Health Sciences at Purdue University in West Lafayette, IN, USA. His research explores gene by toxicant interactions underlying neurological disease and vulnerability to environmental neurotoxicants. His lab, among other methods, utilizes human stem cell derived neuronal model systems, other cellular models of neurological disease and in vivo mouse models.
David Cliffel is a Professor of Chemistry and holds a Cornelius Vanderbilt Chair in Chemistry, and the Deputy Director for Electrochemical Sensors and Biosensors within the Vanderbilt Institute for Integrative Biosystems Research and Education. His research explores bioanalytical electrochemistry, protein electrochemistry, and biosensors.
John Wikswo is the Gordon A. Cain University Professor, the A. B. Learned Professor of Living State Physics, and Professor of Biomedical Engineering, Molecular Physiology and Biophysics, and Physics at Vanderbilt University, and the founding Director of the Vanderbilt Institute for Integrative Biosystems Research and Education (VIIBRE). He received his PhD. from Stanford University. Dr. Wikswo has published more than 200 peer-reviewed papers, is a fellow of seven professional societies, and holds 36 patents.
Footnotes
Declaration of interests
The authors declare the following financial interests/personal relationships which may be considered as potential competing interests:
The technologies presented in this MS are the subject of multiple pending and issued patents. Licenses to some of the Vanderbilt pump and valve technologies have been issued to KIYATEC, Inc. and CN Bio Innovations, which has also licensed the Multiwell MicroFormulator. Our MicroClinical Analyzer patents have been licensed to Agilent. John Wikswo is an Inaugural Member of the Scientific Advisory Board of BiOasis Technologies, Inc.
Publisher's Disclaimer: This is a PDF file of an unedited manuscript that has been accepted for publication. As a service to our customers we are providing this early version of the manuscript. The manuscript will undergo copyediting, typesetting, and review of the resulting proof before it is published in its final form. Please note that during the production process errors may be discovered which could affect the content, and all legal disclaimers that apply to the journal pertain.
References:
- (1).Laser DJ; Santiago JG Topical Review: A Review of Micropumps. J. Micromechanics Microengineering 2004, 35–64. [Google Scholar]
- (2).Iverson B; Garimella S Recent Advances in Microscale Pumping Technologies: A Review and Evaluation. Microfluid. Nanofluidics 2008, 5 (2), 145–174. 10.1007/s10404-008-0266-8. [DOI] [Google Scholar]
- (3).Wikswo JP; Block FE; Cliffel DE; Goodwin CR; Marasco CC; Markov DA; McLean DL; McLean JA; McKenzie JR; Reiserer RS; et al. Engineering Challenges for Instrumenting and Controlling Integrated Organ-on-Chip Systems. IEEE Trans. Biomed. Eng 2013, 60 (3), 682–690. 10.1109/TBME.2013.2244891. [DOI] [PMC free article] [PubMed] [Google Scholar]
- (4).Hutson MS; Alexander PG; Allwardt V; Aronoff DM; Bruner-Tran KL; Cliffel DE; Davidson JM; Gough A; Markov DA; McCawley LJ; et al. Organs-on-Chips as Bridges for Predictive Toxicology. Appl. Vitr. Toxicol 2016, 2 (2), 97–102. 10.1089/aivt.2016.0003. [DOI] [Google Scholar]
- (5).Watson DE; Hunziker R; Wikswo JP Fitting Tissue Chips and Microphysiological Systems into the Grand Scheme of Medicine, Biology, Pharmacology, and Toxicology. Experimental Biology and Medicine. SAGE Publications Inc. October 1, 2017, pp 1559–1572. 10.1177/1535370217732765. [DOI] [PMC free article] [PubMed] [Google Scholar]
- (6).Morimoto Y; Kiyosawa M; Takeuchi S Three-Dimensional Printed Microfluidic Modules for Design Changeable Coaxial Microfluidic Devices. Sensors Actuators, B Chem 2018, 274, 491–500. 10.1016/j.snb.2018.07.151. [DOI] [Google Scholar]
- (7).Jellali R; Paullier P; Fleury MJ; Leclerc E Liver and Kidney Cells Cultures in a New Perfluoropolyether Biochip. Sensors Actuators, B Chem 2016, 229, 396–407. 10.1016/j.snb.2016.01.141. [DOI] [Google Scholar]
- (8).Liu MC; Ho D; Tai YC Monolithic Fabrication of Three-Dimensional Microfluidic Networks for Constructing Cell Culture Array with an Integrated Combinatorial Mixer. Sensors Actuators, B Chem 2008, 129 (2), 826–833. 10.1016/j.snb.2007.09.074. [DOI] [Google Scholar]
- (9).Walker GM; Ozers MS; Beebe DJ Cell Infection within a Microfluidic Device Using Virus Gradients. Sensors Actuators, B Chem 2004, 98 (2–3), 347–355. 10.1016/j.snb.2003.10.014. [DOI] [Google Scholar]
- (10).Verhaegen K; Baert K; Simaels J; Van Driessche W High-Throughput Silicon Microphysiometer. Sensors Actuators, A Phys 2000, 82 (1), 186–190. 10.1016/S0924-4247(99)00365-9. [DOI] [Google Scholar]
- (11).Hediger S; Fontannaz J; Sayah A; Hunziker W; Gijs MAM Biosystem for the Culture and Characterization of Epithelial Cell Tissues. Sensors Actuators, B Chem. 2000, 63 (1), 63–73. 10.1016/S0925-4005(00)00292-6. [DOI] [Google Scholar]
- (12).McConnell H; Owicki J; Parce J; Miller D; Baxter G; Wada H; Pitchford S The Cytosensor Microphysiometer: Biological Applications of Silicon Technology. Science (80-. ). 1992, 257 (5078), 1906–1912. 10.1126/science.1329199. [DOI] [PubMed] [Google Scholar]
- (13).Eklund Sven E.; Taylor Dale; Kozlov Eugene; Prokop Ales and; Cliffel David E.. A Microphysiometer for Simultaneous Measurement of Changes in Extracellular Glucose, Lactate, Oxygen, and Acidification Rate. 2003. 10.1021/AC034641Z. [DOI] [PubMed] [Google Scholar]
- (14).McKenzie JR; Cognata AC; Davis AN; Wikswo JP; Cliffel DE Real-Time Monitoring of Cellular Bioenergetics with a Multianalyte Screen-Printed Electrode. Anal. Chem 2015, 87 (15), 7857–7864. 10.1021/acs.analchem.5b01533. [DOI] [PMC free article] [PubMed] [Google Scholar]
- (15).Snider RM; Mckenzie JR; Kraft L; Kozlov E; Wikswo JP; Cliffel DE The Effects of Cholera Toxin on Cellular Energy Metabolism. Toxins (Basel). 2010, 2, 632–648. 10.3390/toxins2040632. [DOI] [PMC free article] [PubMed] [Google Scholar]
- (16).Eklund S; Snider R; Wikswo J; Baudenbacher. F; Prokop A; Cliffel D Multianalyte Microphysiometry as a Tool in Metabolomics and Systems Biology. J. Electroanal. Chem 2006, 587 (2), 333–339. 10.1016/j.jelechem.2005.11.024. [DOI] [Google Scholar]
- (17).Melow SL; Miller DR; Gizzie EA; Cliffel DE A Low-Interference, High-Resolution Multianalyte Electrochemical Biosensor. Anal. Methods 2020, 12 (31), 3873–3882. 10.1039/d0ay00528b. [DOI] [PubMed] [Google Scholar]
- (18).Pilarek M; Neubauer P; Marx U Biological Cardio-Micro-Pumps for Microbioreactors and Analytical Micro-Systems. Sensors and Actuators, B: Chemical. Elsevier; August 1, 2011, pp 517–526. 10.1016/j.snb.2011.02.014. [DOI] [Google Scholar]
- (19).Yang B; Lin Q Planar Micro-Check Valves Exploiting Large Polymer Compliance. Sensors Actuators, A Phys 2007, 134 (1), 186–193. 10.1016/j.sna.2006.07.016. [DOI] [Google Scholar]
- (20).Wikswo JP The Relevance and Potential Roles of Microphysiological Systems in Biology and Medicine. Exp. Biol. Med 2014, 239 (9), 1061–1072. 10.1177/1535370214542068. [DOI] [PMC free article] [PubMed] [Google Scholar]
- (21).Koch C; Remcho V; Ingle J PDMS and Tubing-Based Peristaltic Micropumps with Direct Actuation. Sensors Actuators, B Chem 2009, 135 (2), 664–670. 10.1016/j.snb.2008.10.019. [DOI] [Google Scholar]
- (22).Miller DR; McClain ES; Cliffel DE Electrochemical Microphysiometry Detects Cellular Glutamate Uptake. J. Electrochem. Soc 2018, 165 (12), G3120–G3124. 10.1149/2.0201812jes. [DOI] [Google Scholar]
- (23).Böhm S; Olthuis W; Bergveld P Plastic Micropump Constructed with Conventional Techniques and Materials. Sensors Actuators, A Phys 1999, 77 (3), 223–228. 10.1016/S0924-4247(99)00192-2. [DOI] [Google Scholar]
- (24).Oh KW; Ahn CH A Review of Microvalves. J. Micromechanics Microengineering 2006, 16 (5), R13–R39. 10.1088/0960-1317/16/5/R01. [DOI] [Google Scholar]
- (25).Zhang Y; Kato S; Anazawa T A Microchannel Concentrator Controlled by Integral Thermoresponsive Valves. Sensors Actuators, B Chem 2008, 129 (1), 481–486. 10.1016/j.snb.2007.08.015. [DOI] [Google Scholar]
- (26).Unger MA; Chou HP; Thorsen T; Scherer A; Quake SR Monolithic Microfabricated Valves and Pumps by Multilayer Soft Lithography. Science 2000, 288 (5463), 113–116. 10.1126/SCIENCE.288.5463.113. [DOI] [PubMed] [Google Scholar]
- (27).Kim J; Kang M; Jensen EC; Mathies RA Lifting Gate Polydimethylsiloxane Microvalves and Pumps for Microfluidic Control. Anal. Chem 2012, 84 (4), 2067–2071. 10.1021/ac202934x. [DOI] [PMC free article] [PubMed] [Google Scholar]
- (28).Grover WH; Skelley AM; Liu CN; Lagally ET; Mathies RA Monolithic Membrane Valves and Diaphragm Pumps for Practical Large-Scale Integration into Glass Microfluidic Devices. Sensors and Actuators 2003, 89 (3), 315–323. 10.1016/S0925-4005(02)00468-9. [DOI] [Google Scholar]
- (29).Olson H; Betton G; Robinson D; Thomas K; Monro A; Kolaja G; Lilly P; Sanders J; Sipes G; Bracken W; et al. Concordance of the Toxicity of Pharmaceuticals in Humans and in Animals. Regul. Toxicol. Pharmacol 2000, 32 (1), 56–67. 10.1006/RTPH.2000.1399. [DOI] [PubMed] [Google Scholar]
- (30).Low LA; Tagle DA Organs-on-Chips: Progress, Challenges, and Future Directions. Exp. Biol. Med 2017, 242 (16), 1573–1578. 10.1177/1535370217700523. [DOI] [PMC free article] [PubMed] [Google Scholar]
- (31).Sharma N; Sharma S; Thiek JL; Ahanthem SS; Kalita A; Lynser D Maternal and Fetal Tuberous Sclerosis: Do We Know Enough as an Obstetrician? J. Reprod. Infertil 2017, 18 (2), 257–260. [PMC free article] [PubMed] [Google Scholar]
- (32).Pajarillo E; Rizor A; Lee J; Aschner M; Lee E The Role of Astrocytic Glutamate Transporters GLT-1 and GLAST in Neurological Disorders: Potential Targets for Neurotherapeutics. Neuropharmacology 2019. 10.1016/J.NEUROPHARM.2019.03.002. [DOI] [PMC free article] [PubMed] [Google Scholar]
- (33).Lima EA; Snider RM; Reiserer RS; McKenzie JR; Kimmel DW; Eklund SE; Wikswo JP; Cliffel DE Multichamber Multipotentiostat System for Cellular Microphysiometry. Sens. Actuators. B. Chem 2014, 204, 536–543. 10.1016/j.snb.2014.07.126. [DOI] [PMC free article] [PubMed] [Google Scholar]
- (34).Miller DR; McClain ES; Cliffel DE Electrochemical Microphysiometry Detects Cellular Glutamate Uptake. J. Electrochem. Soc 2018, 165 (12), 3120–3124. 10.1149/2.0201812jes. [DOI] [Google Scholar]
- (35).Neely MD; Davison CA; Aschner M; Bowman AB From the Cover: Manganese and Rotenone-Induced Oxidative Stress Signatures Differ in IPSC-Derived Human Dopamine Neurons. Toxicol. Sci 2017, 159 (2), 366–379. 10.1093/toxsci/kfx145. [DOI] [PMC free article] [PubMed] [Google Scholar]
- (36).Okita K; Matsumura Y; Sato Y; Okada A; Morizane A; Okamoto S; Hong H; Nakagawa M; Tanabe K; Tezuka K; et al. A More Efficient Method to Generate Integration-Free Human IPS Cells. Nat. Methods 2011, 8 (5), 409–412. 10.1038/nmeth.1591. [DOI] [PubMed] [Google Scholar]
- (37).Tidball AM; Bryan MR; Uhouse MA; Kumar KK; Aboud AA; Feist JE; Ess KC; Neely MD; Aschner M; Bowman AB A Novel Manganese-Dependent ATM-P53 Signaling Pathway Is Selectively Impaired in Patient-Based Neuroprogenitor and Murine Striatal Models of Huntington’s Disease. Hum. Mol. Genet 2015, 24 (7), 1929–1944. 10.1093/hmg/ddu609. [DOI] [PMC free article] [PubMed] [Google Scholar]
- (38).Müller F; Schuldt B; Williams R; Mason D; Altun G; Papapetrou E; Danner S; Goldmann J; Herbst A; Schmidt N; et al. A Bioinformatic Assay for Pluripotency in Human Cells. Nat. Methods 2001, 8, 315–320. 10.1038/nmeth.1580. [DOI] [PMC free article] [PubMed] [Google Scholar]
- (39).Aboud A; Tidball A; Kumar K; Han B; Ess K; Hong C; Erikson KM; Hedera P; Bowman AB. PARK2 Patient Neuroprogenitors Show Increased Mitochondrial Sensitivity to Copper. Neurobiol. Dis 2015, 73, 204–212. 10.1016/j.nbd.2014.10.002. [DOI] [PMC free article] [PubMed] [Google Scholar]
- (40).Kumar K; Lowe EJ; Aboud A; Neely M; Redha R; Bauer J; Odak M; Weaver C; Meiler J; Aschner M; et al. Cellular Manganese Content Is Developmentally Regulated in Human Dopaminergic Neurons. Sci. Rep 2014. 10.1038/srep06801. [DOI] [PMC free article] [PubMed] [Google Scholar]
- (41).Neely MD; Litt MJ; Tidball AM; Li GG; Aboud AA; Hopkins CR; Chamberlin R; Hong CC; Ess KC; Bowman AB DMH1, a Highly Selective Small Molecule BMP Inhibitor Promotes Neurogenesis of HiPSCs: Comparison of PAX6 and SOX1 Expression during Neural Induction. ACS Chem. Neurosci 2012, 3 (6), 482–491. 10.1021/cn300029t. [DOI] [PMC free article] [PubMed] [Google Scholar]
- (42).Chambers S; Fasano C; Papapetrou E; Tomishima M; Sadelain M; Studer L Highly Efficient Neural Conversion of Human ES and IPS Cells by Dual Inhibition of SMAD Signaling. Nat. Biotechnol 2009, 27, 275–280. 10.1038/nbt.1529. [DOI] [PMC free article] [PubMed] [Google Scholar]
- (43).Shi Y; Kirwan P; Livesey F Directed Differentiation of Human Pluripotent Stem Cells to Cerebral Cortex Neurons and Neural Networks. Nat. Protoc 2012, 7 (10), 1836–1846. 10.1038/nprot.2012.116. [DOI] [PubMed] [Google Scholar]
- (44).Brown JA; Codreanu SG; Shi M; Sherrod SD; Markov DA; Neely MD; Britt CM; Hoilett OS; Reiserer RS; Samson PC; et al. Metabolic Consequences of Inflammatory Disruption of the Blood-Brain Barrier in an Organ-on-Chip Model of the Human Neurovascular Unit. J. Neuroinflammation 2016, 13 (1), 306. 10.1186/s12974-016-0760-y. [DOI] [PMC free article] [PubMed] [Google Scholar]
- (45).Brown JA; Pensabene V; Markov DA; Allwardt V; Neely MD; Shi M; Britt CM; Hoilett OS; Yang Q; Brewer BM; et al. Recreating Blood-Brain Barrier Physiology and Structure on Chip: A Novel Neurovascular Microfluidic Bioreactor. Biomicrofluidics 2015, 9 (5), 054124. 10.1063/1.4934713. [DOI] [PMC free article] [PubMed] [Google Scholar]
- (46).Eddington DT; Puccinelli JP; Beebe DJ Thermal Aging and Reduced Hydrophobic Recovery of Polydimethylsiloxane. Sensors Actuators, B Chem 2006, 114 (1), 170–172. 10.1016/j.snb.2005.04.037. [DOI] [Google Scholar]
- (47).Berdichevsky Y; Khandurina J; Guttman A; Lo YH UV/Ozone Modification of Poly(Dimethylsiloxane) Microfluidic Channels. Sensors Actuators, B Chem 2004, 97 (2–3), 402–408. 10.1016/j.snb.2003.09.022. [DOI] [Google Scholar]
- (48).Shkolnikov V; Ramunas J; Santiago JG A Self-Priming, Roller-Free, Miniature, Peristaltic Pump Operable with a Single, Reciprocating Actuator. Sensors Actuators, A Phys 2010, 160 (1–2), 141–146. 10.1016/j.sna.2010.04.018. [DOI] [PMC free article] [PubMed] [Google Scholar]
- (49).Qintao Z; Ping W; Parak WJ; George M; Zhang G Novel Design of Multi-Light LAPS Based on Digital Compensation of Frequency Domain. Sensors Actuators, B Chem 2001, 73 (2–3), 152–156. 10.1016/S0925-4005(00)00696-1. [DOI] [Google Scholar]
- (50).Addae-Mensah KA; Kassebaum NJ; Bowers MJ; Reiserer RS; Rosenthal SJ; Moore PE; Wikswo JP A Flexible, Quantum Dot-Labeled Cantilever Post Array for Studying Cellular Microforces. Sensors Actuators, A Phys 2007, 136 (1), 385–397. 10.1016/j.sna.2006.12.026. [DOI] [Google Scholar]
- (51).Gilchrist KH; Giovangrandi L; Kovacs GT A. Analysis of Microelectrode-Recorded Signals from a Cardiac Cell Line as a Tool for Pharmaceutical Screening. In Transducers ‘01 Eurosensors XV; Springer; Berlin Heidelberg, 2001; pp 390–393. 10.1007/978-3-642-59497-7_93. [DOI] [Google Scholar]
- (52).Kamholz AE; Yager P Molecular Diffusive Scaling Laws in Pressure-Driven Microfluidic Channels: Deviation from One-Dimensional Einstein Approximations. Sensors Actuators, B Chem 2002, 82 (1), 117–121. 10.1016/S0925-4005(01)00990-X. [DOI] [Google Scholar]
- (53).Kockmann N; Kiefer T; Engler M; Woias P Convective Mixing and Chemical Reactions in Microchannels with High Flow Rates. Sensors Actuators, B Chem 2006, 117 (2), 495–508. 10.1016/j.snb.2006.01.004. [DOI] [Google Scholar]
- (54).Zhang Y; He X; Wu X; Lei M; Wei Z; Zhang X; Wen L; Xu P; Li S; Qu S Rapamycin Upregulates Glutamate Transporter and IL-6 Expression in Astrocytes in a Mouse Model of Parkinson’s Disease. Cell Death Dis 2017, 8 (2), 2611–2611. 10.1038/cddis.2016.491. [DOI] [PMC free article] [PubMed] [Google Scholar]
Associated Data
This section collects any data citations, data availability statements, or supplementary materials included in this article.