

Keywords: aquaporin-2, cellular remodeling, potassium, sexual dimorphism, vasopressin resistance
Abstract
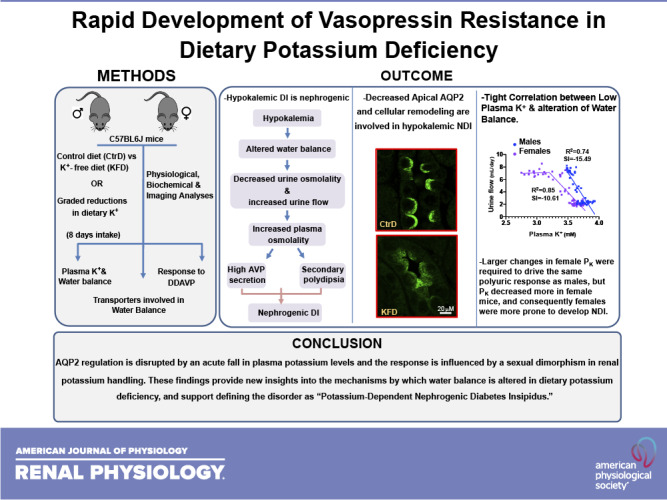
The association between diabetes insipidus (DI) and chronic dietary K+ deprivation is well known, but it remains uncertain how the disorder develops and whether it is influenced by the sexual dimorphism in K+ handling. Here, we determined the plasma K+ (PK) threshold for DI in male and female mice and ascertained if DI is initiated by polydipsia or by a central or nephrogenic defect. C57BL6J mice were randomized to a control diet or to graded reductions in dietary K+ for 8 days, and kidney function and transporters involved in water balance were characterized. We found that male and female mice develop polyuria and secondary polydipsia. Altered water balance coincided with a decrease in aquaporin-2 (AQP2) phosphorylation and apical localization despite increased levels of the vasopressin surrogate marker copeptin. No change in the protein abundance of urea transporter-A1 was observed. The Na+-K+-2Cl− cotransporter decreased only in males. Desmopressin treatment failed to reverse water diuresis in K+-restricted mice. These findings indicate that even a small fall in PK is associated with nephrogenic DI (NDI), coincident with the development of altered AQP2 regulation, implicating low PK as a causal trigger of NDI. We found that PK decreased more in females, and, consequently, females were more prone to develop NDI. Together, these data indicate that AQP2 regulation is disrupted by a small decrease in PK and that the response is influenced by sexual dimorphism in K+ handling. These findings provide new insights into the mechanisms linking water and K+ balances and support defining the disorder as “potassium-dependent NDI.”
NEW & NOTEWORTHY This study shows that aquaporin-2 regulation is disrupted by a small fall in plasma potassium levels and the response is influenced by sexual dimorphism in renal potassium handling. The findings provided new insights into the mechanisms by which water balance is altered in dietary potassium deficiency and support defining the disorder as “potassium-dependent nephrogenic diabetes insipidus.”
INTRODUCTION
Water balance in mammals is achieved by the coordinated actions of central thirst centers, the supraoptic nucleus in the hypothalamus, pituitary gland, and kidney loop of Henle and collecting duct. Small changes in plasma osmolality, detected in circumventricular organs (1, 2), trigger the thirst reflex and the release of arginine vasopressin (AVP) from the posterior pituitary gland. AVP then acts on the collecting duct to activate aquaporin-2 (AQP2) water channels and to increase water absorption to restore osmolality before overt dehydration can ensue. Diabetes insipidus (DI), a disorder characterized by polydipsia, polyuria, and decreased urinary concentrating ability, develops when any one of these processes becomes compromised. Disruption of the thirst centers causes dipsogenic DI. When vasopressin secretion is affected, the disorder is termed central diabetes insipidus. Nephrogenic DI (NDI) occurs when the kidney fails to adequately respond to vasopressin. Damage to the hypothalamus or pituitary gland, medications, or genetic mutations in AQP2, AVP, or AVP receptor (V2R) coding genes (3–5) can cause various forms of DI. The disorder can also result secondary to nephrotoxins, like lithium (6, 7), or to a variety of different electrolyte imbalances, including chronic hypokalemia (8, 9).
Although the deleterious effects of dietary K+ deprivation on water homeostasis have been well documented in human subjects (8), rats (10, 11), dogs (12), rabbits (13), and mice (14, 15), it is debated whether low-K+-provoked DI is initiated by impaired thirst, vasopressin release, or the vasopressin response (16). Amlal et al. (17) reported that rats fed a K+-free diet rapidly develop polyuria before polydipsia can be detected, but it was not determined if the polyuria was related to central DI or NDI. Current understanding of hypokalemic DI is largely drawn from studies that evaluated long-term responses and profound depletion of total body K+ provoked by a completely K+-free diet. Blunted central vasopressin secretion (12), renal resistance to vasopressin (16), medullary osmolality washout (8, 18), autophagy-associated AQP2 degradation (14, 19), and changes in the cellular composition of the medullary collecting duct (20, 21) have been described following chronic dietary K+ restriction. However, it remains unknown if these responses are initiated by compromised vasopressin release or vasopressin resistance. The development of tubulointerstitial disease with chronic hypokalemia (22–24) makes it especially difficult to know if renal resistance to vasopressin signaling (10, 12, 17) is a primary or secondary phenomenon.
Recent studies have described an important role of sexual dimorphisms in kidney physiology and disease, including electrolyte handling (25, 26), hypertensive kidney injury (27), acute kidney injury (28), and chronic kidney diseases (14). Water (29–31) and K+ (26) balances are both influenced by sex hormones, but a comparison of hypokalemia-induced DI in males and females is still missing.
Here, we characterized the initial development of DI over a spectrum of dietary K+ intakes in male and female mice. We found that disruption of water balance is tightly associated with a fall in K+ levels. Indeed, NDI develops rapidly, concomitant with the first detection of hypokalemia, using a definition of hypokalemia as the K+ concentration at the lower end of the natural distribution of plasma K+ (PK) where homeostasis becomes altered. Our data also indicate that females are more susceptible to develop hypokalemia under dietary K+ deprivation, rendering them more prone to DI.
MATERIALS AND METHODS
Mice and Dietary Manipulation
The experiments in this study were approved by the Johns Hopkins University Animal Care and Use Committee. C57BL/6J wild-type (WT) mice were purchased from Jackson Laboratory and housed in a temperature-controlled facility with a 12:12-h light-dark cycle within the Johns Hopkins School of Medicine. Food and water were available ad libitum. Animals (age = 11 − 15 wk) were acclimated to a control diet (1% K+, 0.3% Na+, and 1.4% Cl−, TD.190005) for at least 3 days before the beginning of the experiments and were then kept on the control diet or switched to a low-K+ diet. The electrolyte composition of the experimental diets used in this study is shown in Table 1. All diets were purchased from Envigo (Harlan Teklad), designed with the assistance of a Teklad-certified dietician, and matched for equal caloric intake to the control diet.
Table 1.
Electrolyte composition of the experimental diets used in this study
| Reference | TD.88239 | TD.190001 | TD.190002 | TD.190028 | TD.190004 | TD.190003 | TD.190005 |
|---|---|---|---|---|---|---|---|
| % K+ | ∼0 | 0.026 | 0.052 | 0.11 | 0.25 | 0.5 | 1 |
| % Na+ | 0.3 | 0.3 | 0.3 | 0.3 | 0.3 | 0.3 | 0.3 |
| % Cl− | 0.45 | 0.47 | 0.5 | 0.54 | 0.67 | 0.93 | 1.4 |
Metabolic Cage Experiments and Blood and Urine Measurements
Animals were placed in a diuresis metabolic cage for mice (Nalgene) and allowed to adapt for 3 days. Daily food and water consumption were measured, and urine samples were collected for an additional 8 days. Food and water were available ad libitum. For organ and blood collection, mice were anesthetized by intraperitoneal injection with ketamine-xylazine (100 mg/kg ketamine and 10 mg/kg xylazine). Blood samples were obtained by cutting the right common carotid artery and then using a 1-mL pipettor with a large bore tip containing heparin to quickly collect the blood that pooled near the cut artery. A portion of each sample (∼150 µL) was used immediately for electrolyte analysis (Carelyte Chemistry Analyzer and/or ISTAT-EC8+). After kidneys were removed, mice were euthanized by exsanguination. To establish reliable PK measuring methods, we compared PK values measured by two methods, Carelyate Chemistry Analyzer (Diamond Diagnostics) and ISTAT-EC8+ (No. 600–9007-25, Abaxis), by measuring the same samples simultaneously on both apparatuses. We found that both methods detected similar PK values under either control or K+-deprived conditions (Supplemental Fig. S3, A and B; all Supplemental Material is available at https://doi.org/10.6084/m9.figshare.14128517). The results presented in this report were obtained by using the Carelyte Chemistry Analyzer.
Plasma and urine osmolality were measured using a vapor pressure osmometer (Wescor-Vapro 5520). Plasma copeptin was measured using ELISA following the manufacturer’s protocol (CEA365Mu, Cloud-Clone). Electrolyte-free water clearance was calculated as V[1 − (Na+ + K+)urine/plasma Na+], where V is volume (32, 33).
Desmopressin Treatment
Pharmaceutical-grade desmopressin (DDAVP) was dissolved in 0.9% saline solution and administered via intraperitoneal injection at 10 ng in 100 µL of saline via intraperitoneal injection (34). Mice were treated with DDAVP on day 8 of K+ deprivation. Two injections separated by 4 h were given followed by spot urine collections (q2h) over the subsequent 8 h.
Western Blot Analyses
Cortex and medulla tissues were snap frozen in liquid nitrogen and then stored at −80°C until use. Frozen tissues were minced in lysate buffer [200 mM sucrose, 20 mM HEPES, 0.5 mM CaCl2, and phosphatase and protease inhibitor (PCC1010, Sigma)] and then homogenized by a Beadbug device using 1.5 mM zirconium bead-prefilled tubes (Z763799-50EA, Sigma). Detergents (2% SDS, 0.5% Triton X-100, and 0.5% Tween 20) were added, and the homogenate was incubated with rotation for 1 h at 4°C and then centrifuged at 15,000 g for 15 min at 4°C. The supernatant was collected, and protein concentration was measured using a Pierce BCA protein assay (No. 23225, Thermo Scientific). Proteins were separated on 4%−20% Mini-PROTEAN TGX Stain-Free Protein Gels (No. 4568096, Bio-Rad) and transferred to nitrocellulose membranes using Trans-Blot Turbo packs (No. 1704158, Bio-Rad). Membranes were blocked in 5% nonfat dry milk dissolved in Tris-buffered saline (TBS; pH 7.4, MFCD00132476, VWR) with 2% Tween 20 (No. 9005-64-5, VWR) and incubated overnight at 4°C with primary antibodies. Total AQP2 (1:2,000, AB3274, Millipore), phospho-Ser256 AQP2 (1:1,000, A0768, Assay BioTech), Na+-K+-2Cl− cotransporter (NKCC2; 1:10,000, PA5-80003, Thermo Scientific), and urea transporter (UT)-A1 (1:500, No. 77786, Invitrogen) were used. After a 1-h wash with TBS with 2% Tween 20, membranes were incubated for 2 h at room temperature with horseradish peroxidase-conjugated goat anti-rabbit IgG (1:5,000, No. 111-035-144, Jackson Immuno) and then washed for 1 h with TBS with 2% Tween 20. The signal was developed for 3 min using SuperSignal West Pico PLUS Chemiluminescent Substrate (No. 34579, ThermoFisher). Signal intensity was detected with an Azur 300 imaging system (Azure Biosystems, Dublin, CA) within the linear range as accessed by comparing signals of a 1.5× and a 0.5× dilution of control samples. Integrated band intensity was quantified using Fiji software and normalized to protein bands detected with the Stain-Free Protein Gel.
AQP2 Imaging and Quantification
Sections (5 μm thick) were prepared from paraffin-embedded kidneys and deparaffinized in hexane and absolute ethanol baths for 10 min each and rehydrated in a graded ethanol series to distilled water. Epitope retrieval was obtained by 20 min of heating at low pressure in Trilogy solution (No. 920 P-04, Cell Marque). Sections were then preincubated for 30 min with Image-iT blocking solution (No. 136933, Invitrogen) and for 1 h with homemade blocking solution (PBS, 1% BSA, 50 mM glycine, and 0.2% Na-azide, pH 7.2). Antibodies, prepared in incubation medium (PBS, 1% BSA, 1% Tween 20, 0.35 M NaCl, and 0.2% Na-azide), were applied overnight at 4°C. After 1 h of washing (4 times) with high-salt wash buffer (incubation medium plus 0.5 M NaCl), sections were mounted in mounting medium (H-1000, Vector). To avoid procedure-induced variability in AQP2 quantification, 1) immunofluorescence labeling was performed simultaneously in three control and three K+-free diet kidney sections, 2) labeled sections were conserved at −20 until imaging, and 3) imaging were performed for all samples within 2 days. Image acquisition was performed using a Zeiss LSM 700 confocal microscope, using the same laser power, pinhole, and acquisition settings. The fluorescence signal was quantified using Fiji plot profile analysis.
Statistical Analysis
Data are presented as means ± SE. Statistical analysis was performed using GraphPad PRISM 8. When single dependent variables were compared, the data were analyzed using an unpaired Student’s t test. The influence of two different independent variables (e.g., sex and diet) on one continuous dependent variable (e.g., metabolic data) was assessed using two-way ANOVA. Correction for multiple comparisons was obtained using Tukey’s test. Values were considered significant when P ≤ 0.05. Regression analysis was performed using GraphPad PRISM 8. The best fit model was developed based on the best goodness-of-fit values calculated by PRISM using F test comparison between models.
RESULTS
Hypokalemic DI Is Nephrogenic
C57BL/6J male and female mice were randomized to a control diet (1% K+) or nominally K+-free diet (0% K+) for 8 days, and PK and metabolic parameters were assessed. When K+ was eliminated from the diet, PK decreased, and the fall in PK started earlier and was more severe in females (Fig. 1A and Supplemental Fig. S1A). No major difference in food intake was observed (Supplemental Fig. S1E). In both sexes, the reduction in PK was accompanied by a decline in urine osmolality, which developed within 3 days of dietary K+ deprivation (Fig. 1B and Supplemental Fig. S1B). In both sexes, urinary flow rate (Uv) and water intake increased by day 4 of K+ restriction (Fig. 1, C and D, and Supplemental Fig. 1, C and D). Over this period, plasma osmolality increased and hypernatremia developed as electrolyte-free water clearance shifted to positive values (Fig. 1, E–G). Thus, polydipsia must be secondary to aquaresis. Consistent with this, plasma copeptin, a peptide produced during the proteolytic activation of vasopressin, increased following K+ restriction in both sexes (Fig. 1H). These data indicate that vasopressin synthesis and secretion appropriately respond to dehydration. In contrast, DDAVP treatment failed to increase urine osmolality or decrease urinary volume in the K+-deprived group, indicating renal resistance to vasopressin stimulation (Fig. 1, I and J). These data demonstrate that dietary K+ deficiency induces NDI in male and female mice within a few days and that polydipsia is a secondary effect.
Figure 1.

Dietary K+ deprivation rapidly induces nephrogenic diabetes insipidus. A−D: time course of changes in plasma K+ (A), urinary osmolality (urine osmo; B), urine flow (C), and water intake (D) measured over 8 days of control diet (CtrD) or nominally K+-free diet (KFD) in males and females. Groups are color coded as indicated. E−G: plasma osmolality (P. osmo; E), plasma Na+ (P. Na+; F), and electrolyte-free water clearance (eCH2O; G) in the same cohort of mice after 8 days of CtrD or KFD intake. Each data point represents the measurement in an individual mouse. Bars are means ± SE. H: plasma copeptin levels in KFD compared with CtrD groups over 8 days of diet intake. Each data point represents the measurement in an individual mouse. Bars are means ± SE. I and J: desmopressin (DDAVP) challenge. Urine flow (I) and urine osmolality (J) at the basal level (−) and after DDAVP treatment (+) were measured after 8 days of CtrD or KFD. Data are presented as bar and whisker plots. Significance symbols indicate P values of CtrD versus KFD within the same sex (see Supplemental Fig. S1A for sex differences) on the first day of significance, with all subsequent values being significant. ns, not significant. *P < 0.05. n = 6 mice/group. Statistical significance was evaluated with two-way ANOVA followed by Tukey’s test.
Tight Correlation between Low PK and Loss of Water Balance
To further characterize the relationship between NDI and disruption of K+ homeostasis, urine flow, urinary osmolality, and PK were measured in cohorts of male and female mice that were subjected to graded reductions in dietary K+ content, ranging from 0% to half of the control diet (0.5%). As shown in Fig. 2, ingestion of the K+-free diet or 0.026% diet increased urine flow rate and decreased urine osmolality within 4 days, followed by increased water intake by day 5 (Fig. 2, A–F), and these responses were similar in both sexes. NDI developed differently in males and females with consumption of low-K+ diets containing between 0.052% and 0.5% K+. The 0.052% diet induced NDI in females within 4 days but took 7 days to develop and was less severe in males. Reducing K+ intake to 0.11% caused NDI to develop in females but had no effect on water balance in males (P < 0.05; Fig. 2, A–F). K+ restriction also caused a decrease in body weight (Fig. 2, G and H), which was closely correlated with the extent of diuresis but not with food intake (Supplemental Fig. 2, A and B), reinforcing that urinary water loss exceeds increased water consumption. For any given reduction in dietary K+, the fall in PK was greater in females (P < 0.05; Fig. 2, I and J), and this correlated with the more profound development of NDI in females. Although the low-K+ diets also had lower levels of Cl−, no change in plasma Cl− levels was observed with any of the diets (Supplemental Fig. S2, C and D).
Figure 2.

Development of nephrogenic diabetes insipidus with graded reduction in K+ intake. A−H: time course of changes in urine flow rate (A and B), urine osmolality (urine osmo; C and D), water intake (E and F), and percent change in body weight (BW; G and H) in male and female mice fed a control diet (1% K+) or low-K+ diet ranging from 0.11% in males and 0.5% in females to 0%. Groups are color coded as indicated. Significance marks are presented on the curve at the first significant point; all subsequent points on the same curve are significant. I and J: plasma K+ levels in males and females after 8 days of diet intake. *P < 0.05, comparison of control with specific diet indicated by color code within the same sex. Each data point represents the measurement in an individual mouse (n = 6 mice/group). Statistical significance was evaluated with two-way ANOVA followed by Tukey’s test.
We found there was a steep linear relationship between the fall in PK and increase in UV (Fig. 3A) until PK fell below ∼3.25 mM, at which point Uv reached a new elevated steady state. The response was mirrored by the PK-urinary osmolality relationship (Fig. 3B). In the linear range, both slopes were steeper in males. NDI also developed at a higher PK level in males, if defined as a 50% increase in Uv and decrease in urinary osmolality. The threshold was PK ≤ 3.64 mM in males compared with PK ≤ 3.45 mM in females but was only due to the higher basal PK in males. Indeed, male and female mice both developed NDI after PK dropped by an equivalent amount (at least 0.17 mM). However, further analysis of responses as the change in PK (ΔPK) versus the change in UV (ΔUv) or change in urinary osmolality (Fig. 3, C and D) confirmed that males had steeper NDI responses to changes in PK than females. These differences in K+ sensitivity are small compared with sex difference in the overall NDI responses to reduction in dietary K+. Female mice displayed larger changes in PK than males for any given reduction in dietary K+, and NDI developed more easily despite the slightly greater sensitivity of the PK-Uv and PK-urinary osmolality relationships in males.
Figure 3.

Regression analysis of plasma K+ (PK) and water balance. A and B: regression analysis of PK versus urine flow rate (A) or urine osmolality (urine osmo; B) in males and females. C and D: regression analysis of ΔPK versus Δυrine flow (C) or Δurine osmolality (D). Each data point represents the measurement in an individual animal. Males are in blue; females are in purple.
Decreased Abundance and Phosphorylation of AQP2 and Cellular Remodeling
To evaluate the initial origins of K+-dependent NDI at the molecular level, we assessed the chief determinants of urinary concentrating ability, namely, AQP2, and the transporters responsible for establishing the countercurrent solute gradient, NKCC2 and UT-A1. Proteins were evaluated in cortical and medullary kidney tissues from both sexes after 8 days of a 0% K+ diet.
As shown in Fig. 4, A–E, the abundance of the maturely glycosylated form of AQP2 in the kidney cortex decreased in male and female mice after K+ deprivation, but the nonglycosylated form only decreased significantly in females. In the medulla (Fig. 5, A–E), a modest reduction in the maturely glycosylated form of AQP2 was observed in males but not in females. Phosphorylation of AQP2 at Ser256, which is crucial for AQP2 vasopressin-dependent membrane translocation (35–37), decreased in the cortex (Fig. 4, A–E) and medulla (Fig. 5, A–E) after K+ deprivation in both sexes, but phospho-Ser256 became almost undetectable in female mice.
Figure 4.
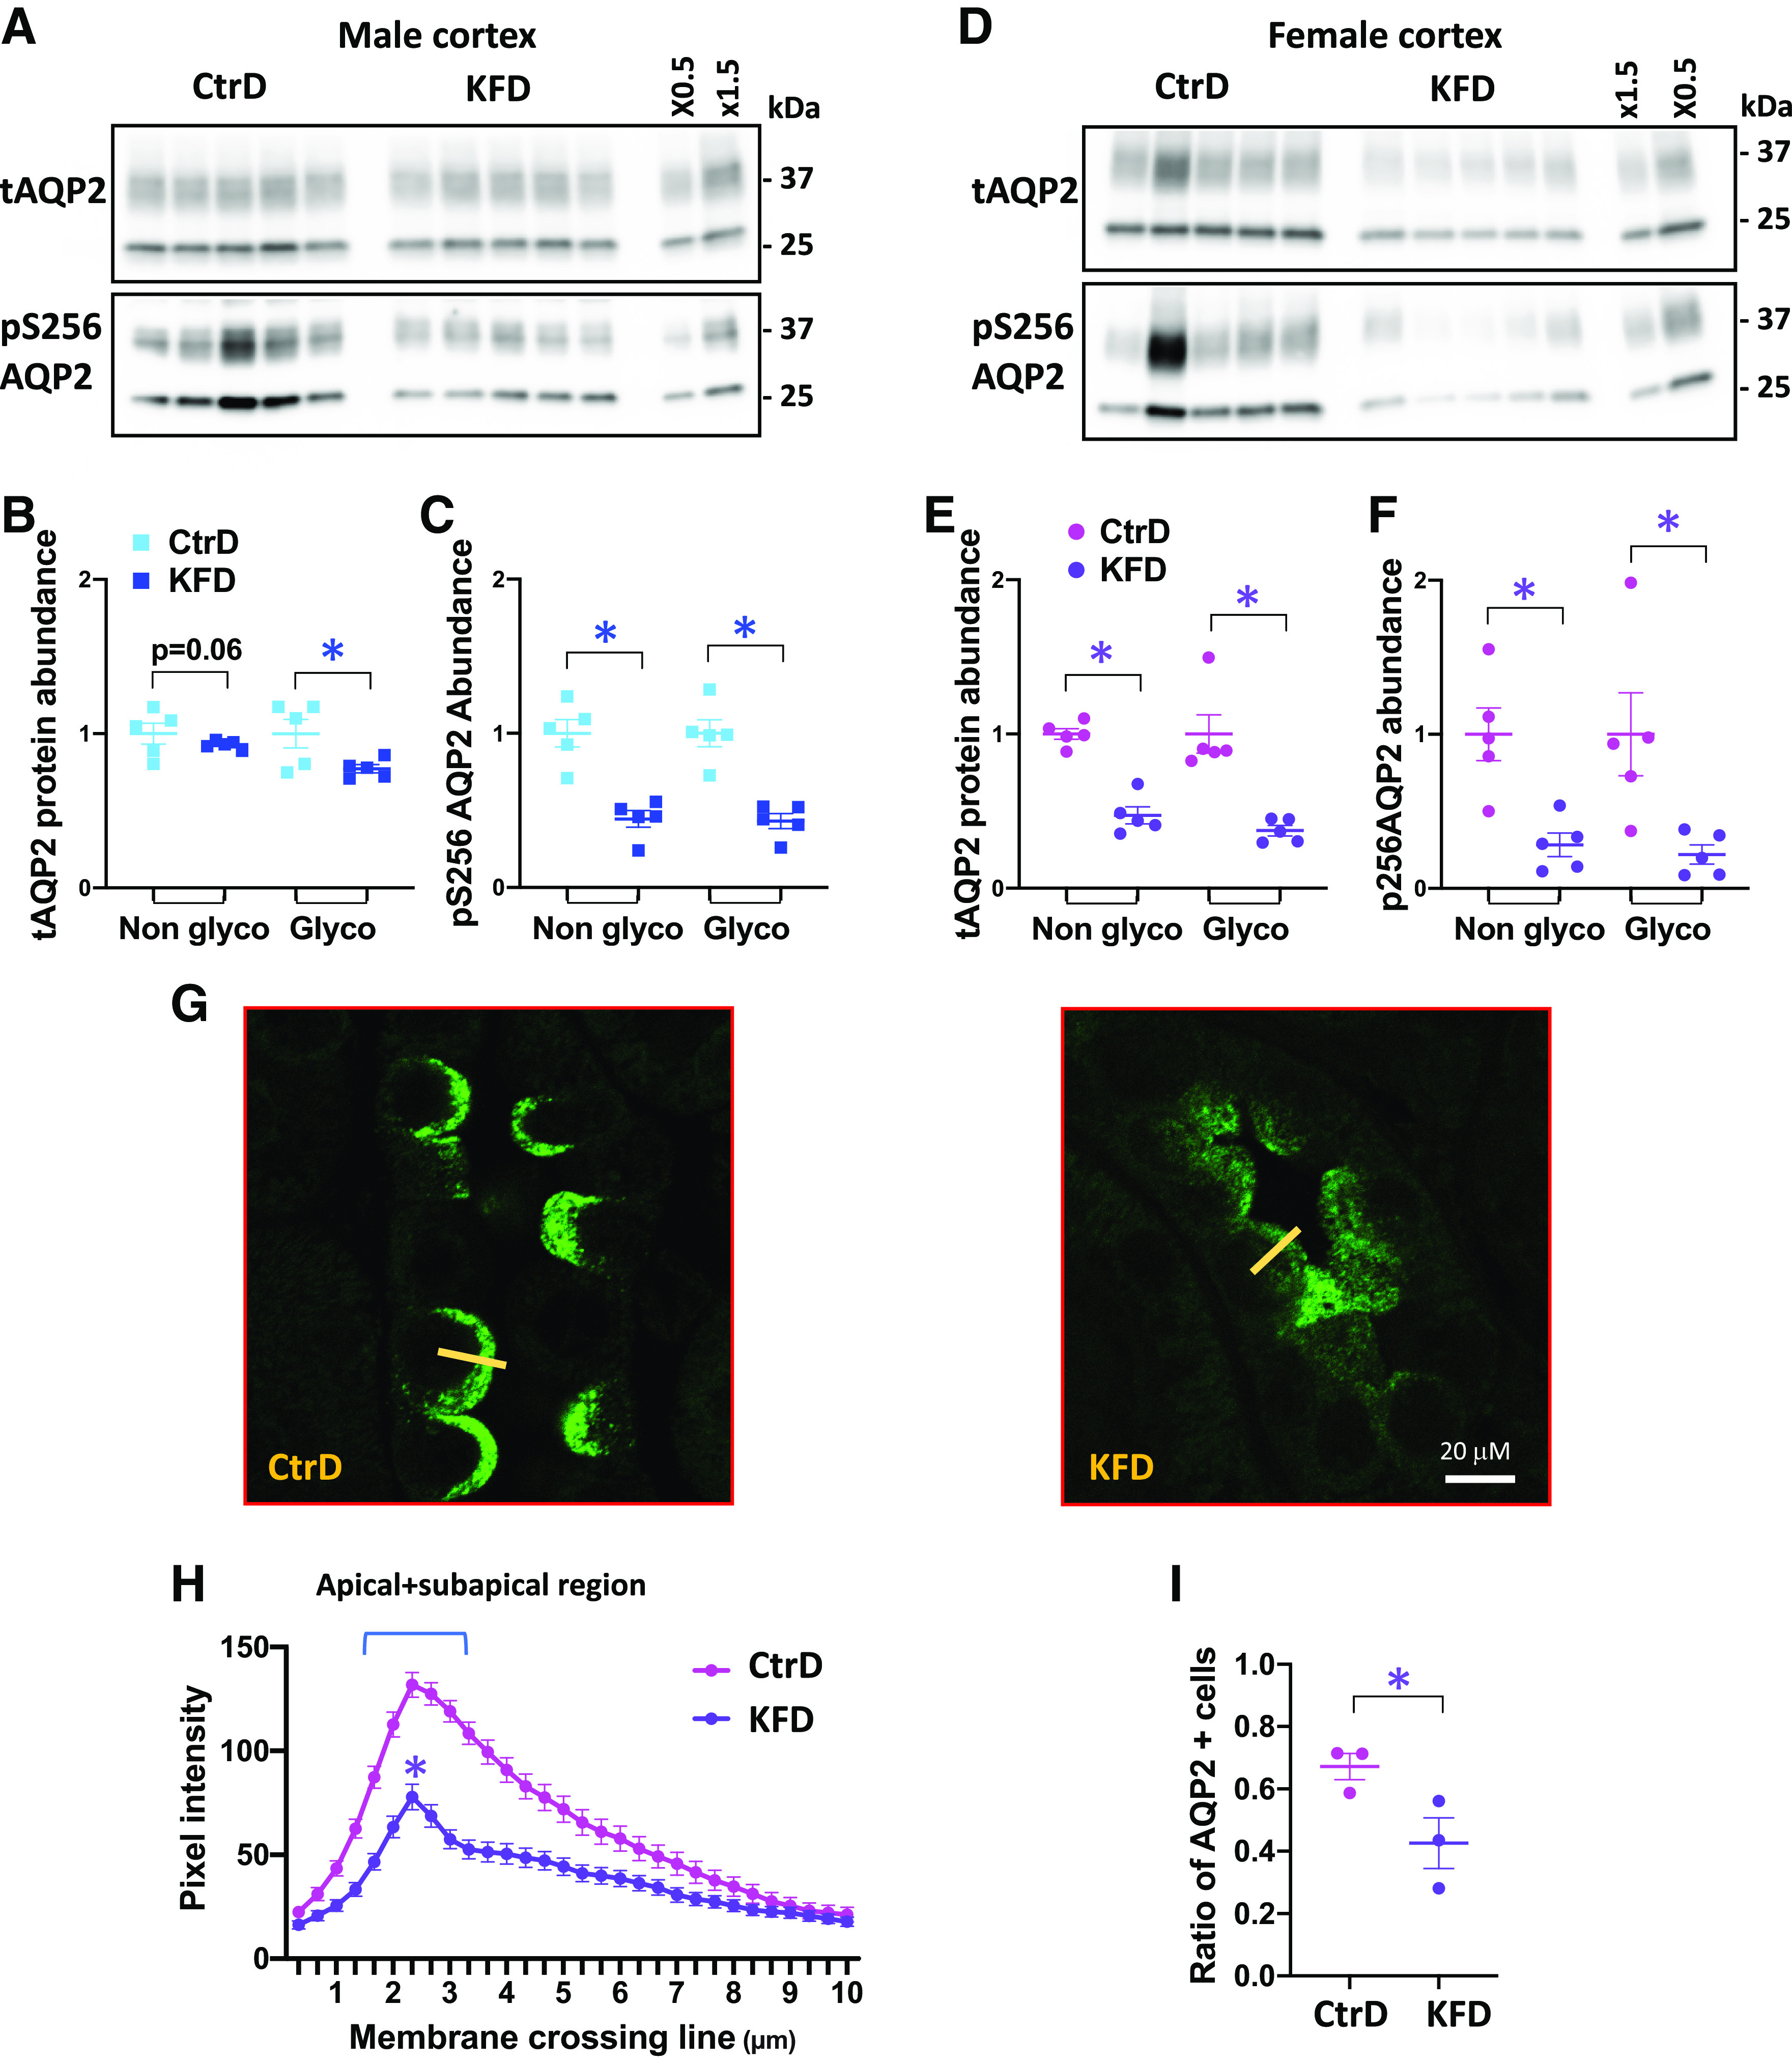
K+ restriction disrupts aquaporin-2 (AQP2) in the cortical collecting duct after 8 days of control diet (CtrD) or K+-free diet (KFD) intake. A and D: Western blot analyses of total AQP2 (tAQP2) and Ser256-phosphorylated AQP2 (pS256 AQP2) in males (A) and females (D). B and C: quantification of the Western blots shown in A. E and F: quantification of the Western blots shown in D. G: representative images from confocal microscopy of AQP2 immunostaining in the cortex from control and K+-deprived females. Magnification: ×600. H: AQP2 pixel intensity line plot transecting the apical membrane (10 µm long) from the lumen into the cytoplasm. The yellow line shows a typical line scan. n = 3 mice/group. Statistical significance was evaluated with two-way ANOVA. I: ratio of AQP2-expressing cells/total cell number from AQP2-expressing segments (n = 3 mice/group). *P < 0.05. Except for the results shown in H, statistical significance was evaluated with a t test.
Figure 5.

K+ restriction disrupts aquaporin-2 (AQP2) in the medullary collecting duct after 8 days of control diet (CtrD) or K+-free diet (KFD) intake. A and D: Western blot analyses of total AQP2 (tAQP2) and Ser256-phosphorylated AQP2 (pS256 AQP2) in males (A) and females (D). B and C: quantification of the Western blots shown in A. E and F: quantification of the Western blots shown in D. G: representative images from confocal microscopy of AQP2 immunostaining in the medulla from control and K+-deprived females. Magnification: ×600. H: AQP2 pixel intensity line plot transecting the apical membrane (10 µm long) from the lumen into the cytoplasm. The yellow line shows a typical line scan. n = 3 mice/group. Statistical significance was evaluated with two-way ANOVA. I: ratio of AQP2-expressing cells/total cell number from AQP2-expressing segments (n = 3 mice/group). *P < 0.05. Except for the results shown in H, statistical significance was evaluated with a t test.
Confocal immunofluorescence microscopy in female tissues revealed that the decrease in phospho-Ser256 AQP2 phosphorylation was, as expected, associated with decreased membrane targeting of the water channel in cortical (Fig. 4, G and H) and medullary collecting ducts (Fig. 5, G and H). As quantified by the number of AQP2-positive cells [3 control and 3 K+-deprived mice, >80 cortical collecting duct (CCD) cells per mouse], we found that dietary K+ restriction also reduced the number of AQP2-positive cells by 35% in the CCD (Fig. 4I) and by 22% in the medullary collecting duct (Fig. 5I), suggesting that a cellular remodeling process is also involved.
Given the critical roles of NKCC2 and UT-A1 in establishing the medullary osmotic gradient necessary for water reabsorption, we evaluated their protein levels in the medulla of males and females after 8 days of a K+-free diet. We detected no changes in UT-A1 protein levels in either male or female mice (Fig. 6, A–F). NKCC2 protein levels decreased in males but not in females (Fig. 6, A–F). Interestingly, NKCC2 dysregulation was also observed in males after 4 days of K+ deprivation (Fig. 6, G–J), suggesting that it might play a significant role in the male sensitivity to water imbalance.
Figure 6.

Western blot analyses of Na+-K+-2Cl− cotransporter (NKCC2) and urea transporter (UT)-A1 in the medulla of both sexes after 8 or 4 days of control diet (CtrD) or K+-free diet (KFD) intake. A and D: Western blot analyses of NKCC2 and UT-A1 in males (A) and females (D) after 8 days of diet intake. Note the 97-kDa and 119-kDa bands of UT-A1, which are attributable to distinct glycosylation patterns. B and C: quantification of the Western blots shown in A. E and F: quantification of the Western blots shown in D. G−I: Western blot analyses of NKCC2 in males (G) and females (I) after 4 days of diet intake. H and J: quantification of the Western blots shown in G and I, respectively. *P < 0.05; Statistical significance was evaluated with a t test.
DISCUSSION
Primary polydipsia (9, 10), central DI (12, 15), and NDI (13, 16) have been associated with chronic K+ deprivation, but the initiating mechanism has not been definitively established. Here, we evaluated the initial pathogenic cascade following graded reductions in dietary K+. Metabolic characterization of the response revealed that water intake and copeptin levels increase rapidly but occur secondary to polyuria and increased plasma osmolality. These observations exclude primary polydipsia and central DI as the initiators of K+-dependent DI. DDAVP challenge studies confirmed the development of vasopressin resistance. Together, these data indicate that dietary K+ deficiency induces an NDI state as soon as a fall in PK is detected. It is possible that K+ depletion also triggers a thirst response with increased water consumption contributing to polyuria, similar to what has been reported following chronic, 2-wk K+ deprivation in rats (38). However, the development of hypernatremia and reduction in body weight indicate that an increased thirst response is likely a physiological response, which is unable to match the NDI-induced polyuria.
We found that water excretion increases as quickly as hypokalemia develops in male and female mice. A similar response has been reported in male rats, which also develop an altered water balance before (17) or concomitantly (19) to the onset of hypokalemia. Although these observations point to low PK as the primary driver of the response, it should be pointed out that changes in dietary K+ can elicit many physiological and pathophysiological responses (39). A feedforward mechanism, termed the kaliuretic reflex, has been implicated in sensing dietary K+ load in the gut and communicating to the kidney through an undefined neurohormonal pathway to change renal K+ excretion accordingly (40). It is conceivable that the reflex also affects K+-dependent NDI, although this is unlikely because the pathway seems to work on an immediate timescale to augment K+ excretion upon ingestion of a K+ load without any changes in PK levels. Chronic K+ deficiency can affect many intrarenal signaling systems, including a host of vasoactive mediators, the renin-angiotensin system (41, 42), and oxidative stress (43), and these factors are believed to gradually drive kidney injury, inflammation, and microvascular and interstitial disease. These factors and responses have been typically observed on a chronic timescale of weeks to months, but it is conceivable that they also drive the more rapid NDI response to dietary K+. Nevertheless, based on the tight relationship between the decrease in PK and altered water balance that was found in this study, the most parsimonious explanation is that hypokalemia is the causal trigger. Although we cannot rule out the involvement of intracellular K+ store depletion (44, 45) as the causal driver, the close correlation with PK supports defining the disorder as “potassium-dependent nephrogenic diabetes insipidus.”
We found there are sex differences in the development of NDI. Even though it was not practical to determine the exact low PK levels that are required to produce complete vasopressin resistance, analysis of the available data revealed that the threshold of detectable increased diuresis and loss of urinary concentrating ability occurred at slightly higher PK concentrations in males. The relationship between the loss of water balance and reduction in PK was also steeper in males. However, female mice were prone to develop more profound hypokalemia than males, as observed in another study (26), and thus were more prone to develop K+-dependent NDI. Hypokalemia is more prevalent in females (4.3%) than males (1.7%) in the United States population (46), but it remains to be determined if hypokalemic NDI in humans is more frequently observed in females. It will be important to learn if water balance in humans can be disrupted as easily as mice by modest decreases in PK. It should be pointed out that extreme changes in dietary K+, >10-fold, were required to change PK in mice, similar to observations in male rats that are also able to maintain normal K+ and water balance when K+ intake was reduced by threefold (47). Furthermore, even complete dietary K+ restriction does not alter water balance in all mammals. Elephant seal and gray seal pups are able to adapt to prolonged K+-free fasting during their 6- to 12-wk postweaning period when food and water consumption are limited with little or no signs of dehydration (48, 49). These studies did not monitor PK, making one wonder if the adaptive mechanisms are in K+, water, or both.
Our study provides insights into the mechanisms by which low K+ drives the development of NDI, highlighting acquisition of vasopressin resistance. Upon binding to its ligand, activation of the vasopressin receptor V2R stimulates adenylyl cyclase to increase intracellular cAMP and activation of PKA (50) and other signaling pathways that cause rapid phosphorylation of AQP2 at four sites near the carboxyl terminus, resulting in traffic to the apical membrane (11, 36, 37, 51). Longer-term regulation of AQP2 protein abundance by vasopressin involves cAMP-dependent enhanced transcription (52) and increased protein stability (53, 54). We found that phosphorylation of AQP2 at Ser256, which reliably reports rapid signaling of activated V2R (55), was more broadly affected than protein abundance, being decreased in cortical and medullary collecting ducts in males and females, consistent with an alteration vasopressin signaling such as an impairment in vasopressin-dependent cAMP generation, which has been observed following long-term K+ deprivation (56). Since vasopressin increases Ser256 phosphorylation, even in the absence of PKA (57), other kinases can phosphorylate Ser256. Phosphorylation of another residue, Ser269, may correlate better with vasopressin action (58); however, we were unable to document phosphorylation of the residue with the available antibodies. Thus, while a parsimonious explanation of our results is that hypokalemia directly disrupts the rapid V2R-dependent signaling mechanism, other mechanisms should be considered. Future studies will be required to determine the involvement of other signaling pathways that impinge on AQP2 regulation, including NF-κB signaling (59), transforming growth factor-β signaling (60), PGE2 (61), and developmental signaling related to the Wnt pathway (62).
Future studies will be also required to unravel the most proximal steps in these signaling pathways that are affected by hypokalemia. It will be important to learn if altered signaling is provoked directly by changes in extracellular K+ through changes in membrane voltage, similar to the way that basolateral K+ channels control the with no lysine kinase-STE20/SPS1-related proline-alanine-rich protein kinase (WNK-SPAK) signaling system in the distal convoluted tubule (63) or by intracellular depletion of K + .
Hypokalemia also induced large changes in AQP2 protein abundance, but this response was confined to the CCD in the more hypokalemic female mice. Amlal et al. (17) reported similar observations in K+-deprived male rats where total AQP2 was decreased in the cortex earlier than in the medulla. These data suggest that the longer-term inhibitory pathway is more sensitive to K+ or more robust in CCD than the inner medullary collecting duct, contrasting similarity of AVP-mediated upregulation of AQP2 protein in the inner medullary collecting duct and in the CCD (64). Because the mature form of AQP2 decreased without alterations of the immature form, we speculate that hypokalemia specifically accelerates the degradation of the “post-Golgi” population of water channels, consistent with the idea that hypokalemia drives autophagy of AQP2 (14, 19, 65).
We also found that the number of AQP2-expressing cells decreased in response to dietary K+ deprivation, and the response was more severe (−35%) in the cortex than the medulla (−22%). Although this may simply reflect robust downregulation of AQP2 in a population of differentiated principal cells, a recent study using optical clearing of mouse kidneys in combination with advanced microscopy revealed that dietary K+ deprivation, even after 3 days, induces a massive cellular remodeling in several nephron segments including the connecting tubule and collecting duct (66). Chronic consumption of a K+-free diet has been reported to cause an increase in the number of intercalated cells at the expense of principal cells (20, 21). This has been suggested to involve transdifferentiation collecting duct cells, but other mechanisms need to be considered. For example, if V2R signaling maintains principal cell number by driving proliferation, similar to the way it does in renal carcinoma cells (67, 68), the principal cell population may collapse in a vasopressin-resistant state.
In addition to altered regulation of AQP2, a decrease in NKCC2 and UT-A1 protein levels has been described in several animal models of chronic K+ deprivation. Because these transporters are critical to generating the hyperosmotic medullary interstitium (50, 69, 70), their compromised expression is expected to contribute to polyuria. We found that the early development of K+-dependent NDI (at least during the first 4 days of K+ fall) does not involve UT-A1. Instead, NKCC2 protein is reduced in response to dietary K+ deficiency. But this only occurs in male mice, providing a possible explanation for the development of polyuria with smaller decreases in PK in males compared with females. In females, NKCC2 might be protected by ovarian hormones that stimulate expression of the transporter (71).
It should be pointed out that not all hypokalemic disorders are associated with NDI (72). The most noteworthy of these are Gitelman syndrome [OMIM: 263800 (73)], which is caused by loss-of-function mutations in the thiazide-sensitive sodium chloride cotransporter (NCC) in the distal convoluted tubule, and the pharmacological corollary, thiazide treatment. In fact, thiazides are used as first-line treatments for many forms of DI because they cause a paradoxical decrease in UV and increase urine osmolality in DI (74, 75). Multiple processes that compensate for salt wasting with NCC loss, including stimulation of isosmotic water absorption in the proximal tubule (76), activation of the epithelial Na+ channel and of AQP2 (77), and distal nephron remodeling (78), are responsible and are likely to override the negative effects of hypokalemia on vasopressin signaling, which otherwise drive the development of NDI.
In contrast to the protective effects of NCC inhibition, activation of NCC may exacerbate hypokalemic NDI. NCC activity is exquisitely sensitive to changes in PK, being stimulated through the WNK-SPAK signaling pathway when PK decreases in the physiological range (79, 80). The physiological response, which protects against urinary K+ wasting, usually has no noticeable effects on water balance. However, if vasopressin resistance develops because of sustained hypokalemia, NCC-mediated salt reabsorption will increase electrolyte-free water excretion and thereby contribute to NDI. We speculate that the processes that drive vasopressin resistance, which are activated at lower K+ levels than those that drive maximum activation of NCC, might be a part of a last-resort physiological feedback pathway that counterbalances the extracellular volume expansion when overt hypokalemia sustains NCC activity, such as might occur with prolonged consumption of extremely low-K+ diets (69), fasting, or anorexia. Such a mechanism should be considered unusual because extracellular volume is nearly always regulated by Na+ and not water balance.
In summary, we found that dietary K+ deficiency rapidly induces vasopressin resistance when hypokalemia develops, supporting the definition of the disorder as “potassium-dependent nephrogenic diabetes insipidus.” The development of K+-dependent NDI is influenced by the sexual dimorphism in urinary K+ handling. Because female mice are more prone to develop hypokalemia than male mice, they develop NDI more easily than male mice.
SUPPLEMENTAL DATA
Supplemental Material is available at https://doi.org/10.6084/m9.figshare.14128517.
GRANTS
This work was supported with funds from the National Institute of Diabetes and Digestive and Kidney Diseases (Grants DK054231, DK093501, and DK110375) and the Leducq Foundation.
DISCLOSURES
No conflicts of interest, financial or otherwise, are declared by the authors.
AUTHOR CONTRIBUTIONS
L.A-Q., P.R.G., A.M.Z., and P.A.W. conceived and designed research; L.A-Q., P.R.G., and A.M.Z. performed experiments; L.A-Q., P.R.G., A.M.Z., and P.A.W. analyzed data; L.A-Q., P.R.G., A.M.Z., and P.A.W. interpreted results of experiments; L.A-Q. and P.A.W. prepared figures; L.A-Q. and P.A.W. drafted manuscript; L.A-Q., P.R.G., A.M.Z., and P.A.W. edited and revised manuscript; L.A-Q., P.R.G., A.M.Z., and P.A.W. approved final version of manuscript.
ACKNOWLEDGMENTS
We thank Prof. Ossama B. Kashlan for the valuable assistance in performing the regression analysis and Dr. Hyun Jun Jung for the constructive discussion during the preparation of this work.
REFERENCES
- 1.Matsuda T, Hiyama TY, Niimura F, Matsusaka T, Fukamizu A, Kobayashi K, Kobayashi K, Noda M. Distinct neural mechanisms for the control of thirst and salt appetite in the subfornical organ. Nat Neurosci 20: 230–241, 2017. doi: 10.1038/nn.4463. [DOI] [PubMed] [Google Scholar]
- 2.Pool A-H, Wang T, Stafford DA, Chance RK, Lee S, Ngai J, Oka Y. The cellular basis of distinct thirst modalities. Nature 588: 112–117, 2020. doi: 10.1038/s41586-020-2821-8. [DOI] [PMC free article] [PubMed] [Google Scholar]
- 3.Morello JP, Bichet DG. Nephrogenic diabetes insipidus. Annu Rev Physiol 63: 607–630, 2001. doi: 10.1146/annurev.physiol.63.1.607. [DOI] [PubMed] [Google Scholar]
- 4.Rosenthal W, Seibold A, Antaramian A, Lonergan M, Arthus MF, Hendy GN, Birnbaumer M, Bichet DG. Molecular identification of the gene responsible for congenital nephrogenic diabetes insipidus. Nature 359: 233–235, 1992. doi: 10.1038/359233a0. [DOI] [PubMed] [Google Scholar]
- 5.Seibold A, Brabet P, Rosenthal W, Birnbaumer M. Structure and chromosomal localization of the human antidiuretic hormone receptor gene. Am J Hum Genet 51: 1078–1083, 1992. [PMC free article] [PubMed] [Google Scholar]
- 6.Lindop GB, Padfield PL. The renal pathology in a case of lithium-induced diabetes insipidus. J Clin Pathol 28: 472–475, 1975. doi: 10.1136/jcp.28.6.472. [DOI] [PMC free article] [PubMed] [Google Scholar]
- 7.Uldall PR, Awad AG, McCormick WO, Carter LB, Gonsick T, Grass CL, Kugelmass MI. Renal function in patients receiving long-term lithium therapy. Can Med Assoc J 124: 1471–1474, 1981. [PMC free article] [PubMed] [Google Scholar]
- 8.Manitius A, Levitin H, Beck D, Epstein FH. On the mechanism of impairment of renal concentrating ability in potassium deficiency. J Clin Invest 39: 684–692, 1960. doi: 10.1172/JCI104084. [DOI] [PMC free article] [PubMed] [Google Scholar]
- 9.Smith SG, Lasater TE. A diabetes insipidus-like condition produced in dogs by a potassium deficient diet. Proc Soc Exp Biol Med 74: 427–431, 1950. doi: 10.3181/00379727-74-17928. [DOI] [PubMed] [Google Scholar]
- 10.Hollander W Jr, Winters RW, Williams TF, Bradley J, Oliver J, Welt LG. Defect in the renal tubular reabsorption of water associated with potassium depletion in rats. Am J Physiol 189: 557–563, 1957. doi: 10.1152/ajplegacy.1957.189.3.557. [DOI] [PubMed] [Google Scholar]
- 11.Marples D, Frokiaer J, Dorup J, Knepper MA, Nielsen S. Hypokalemia-induced downregulation of aquaporin-2 water channel expression in rat kidney medulla and cortex. J Clin Invest 97: 1960–1968, 1996. doi: 10.1172/JCI118628. [DOI] [PMC free article] [PubMed] [Google Scholar]
- 12.Rutecki GW, Cox JW, Robertson GW, Francisco LL, Ferris TF. Urinary concentrating ability and antidiuretic hormone responsiveness in the potassium-depleted dog. J Lab Clin Med 100: 53–60, 1982. [PubMed] [Google Scholar]
- 13.Raymond KH, Davidson KK, McKinney TD. In vivo and in vitro studies of urinary concentrating ability in potassium-depleted rabbits. J Clin Invest 76: 561–566, 1985. doi: 10.1172/JCI112007. [DOI] [PMC free article] [PubMed] [Google Scholar]
- 14.Kim C, Ricardo AC, Boyko EJ, Christophi CA, Temprosa M, Watson KE, Pi-Sunyer X, Kalyani RR; Diabetes Prevention Program Research Group. Sex hormones and measures of kidney function in the Diabetes Prevention Program outcomes study. J Clin Endocrinol Metab 104: 1171–1180, 2019. doi: 10.1210/jc.2018-01495. [DOI] [PMC free article] [PubMed] [Google Scholar]
- 15.Morris RG, Hoorn EJ, Knepper MA. Hypokalemia in a mouse model of Gitelman’s syndrome. Am J Physiol Renal Physiol 290: F1416–F1420, 2006. doi: 10.1152/ajprenal.00421.2005. [DOI] [PubMed] [Google Scholar]
- 16.Beck N, Webster SK. Impaired urinary concentrating ability and cyclic AMP in K+-depleted rat kidney. Am J Physiol 231: 1204–1208, 1976. doi: 10.1152/ajplegacy.1976.231.4.1204. [DOI] [PubMed] [Google Scholar]
- 17.Amlal H, Krane CM, Chen Q, Soleimani M. Early polyuria and urinary concentrating defect in potassium deprivation. Am J Physiol Renal Physiol 279: F655–F663, 2000. doi: 10.1152/ajprenal.2000.279.4.F655. [DOI] [PubMed] [Google Scholar]
- 18.Walter SJ, Shore AC, Shirley DG. Effect of potassium depletion on renal tubular function in the rat. Clin Sci (Lond) 75: 621–628, 1988. doi: 10.1042/cs0750621. [DOI] [PubMed] [Google Scholar]
- 19.Khositseth S, Uawithya P, Somparn P, Charngkaew K, Thippamom N, Hoffert JD, Saeed F, Michael Payne D, Chen S-H, Fenton RA, Pisitkun T. Autophagic degradation of aquaporin-2 is an early event in hypokalemia-induced nephrogenic diabetes insipidus. Sci Rep 5: 18311, 2015. doi: 10.1038/srep18311. [DOI] [PMC free article] [PubMed] [Google Scholar]
- 20.Iervolino A, Prosperi F, De La Motte LR, Petrillo F, Spagnuolo M, D’Acierno M, Siccardi S, Perna AF, Christensen BM, Frische S, Capasso G, Trepiccione F. Potassium depletion induces cellular conversion in the outer medullary collecting duct altering Notch signaling pathway. Sci Rep 10: 5708, 2020. doi: 10.1038/s41598-020-61882-7. [DOI] [PMC free article] [PubMed] [Google Scholar]
- 21.Park E-Y, Kim W-Y, Kim Y-M, Lee J-H, Han K-H, Weiner I-D, Kim J. Proposed mechanism in the change of cellular composition in the outer medullary collecting duct during potassium homeostasis. Histol Histopathol 27: 1559–1577, 2012. doi: 10.14670/hh-27.1559. [DOI] [PubMed] [Google Scholar]
- 22.Kulka JP, Pearson CM, Robins SL. A distinctive vacuolar nephropathy associated with intestinal disease. Am J Pathol 26: 349–377, 1950. [PMC free article] [PubMed] [Google Scholar]
- 23.Reungjui S, Roncal CA, Sato W, Glushakova OY, Croker BP, Suga S-I, Ouyang X, Tungsanga K, Nakagawa T, Johnson RJ, Mu W. Hypokalemic nephropathy is associated with impaired angiogenesis. J Am Soc Nephrol 19: 125–134, 2008. doi: 10.1681/ASN.2007030261. [DOI] [PMC free article] [PubMed] [Google Scholar]
- 24.Yalamanchili HB, Calp-Inal S, Zhou XJ, Choudhury D. Hypokalemic nephropathy. Kidney Int Rep 3: 1482–1488, 2018. doi: 10.1016/j.ekir.2018.07.014. [DOI] [PMC free article] [PubMed] [Google Scholar]
- 25.Tahaei E, Coleman R, Saritas T, Ellison DH, Welling PA. Distal convoluted tubule sexual dimorphism revealed by advanced 3D imaging. Am J Physiol Renal Physiol 319: F754–F764, 2020. doi: 10.1152/ajprenal.00441.2020. [DOI] [PMC free article] [PubMed] [Google Scholar]
- 26.Veiras LC, Girardi ACC, Curry J, Pei L, Ralph DL, Tran A, Castelo-Branco RC, Pastor-Soler N, Arranz CT, Yu ASL, McDonough AA. Sexual dimorphic pattern of renal transporters and electrolyte homeostasis. J Am Soc Nephrol 28: 3504–3517, 2017. doi: 10.1681/ASN.2017030295. [DOI] [PMC free article] [PubMed] [Google Scholar]
- 27.Sullivan JC, Gillis EE. Sex and gender differences in hypertensive kidney injury. Am J Physiol Renal Physiol 313: F1009–F1017, 2017. doi: 10.1152/ajprenal.00206.2017. [DOI] [PMC free article] [PubMed] [Google Scholar]
- 28.Vinas JL, Porter CJ, Douvris A, Spence M, Gutsol A, Zimpelmann JA, Tailor K, Campbell PA, Burns KD. Sex diversity in proximal tubule and endothelial gene expression in mice with ischemic acute kidney injury. Clin Sci (Lond) 134: 1887–1909, 2020. doi: 10.1042/CS20200168. [DOI] [PubMed] [Google Scholar]
- 29.Goswami N, Reichmuth J, Di Mise A, Brix B, Roessler A, Centrone M, Ranieri M, Russo A, De Santo NG, Tamma G, Sasso FC, Valenti G. Comparison between men and women of volume regulating hormones and aquaporin-2 excretion following graded central hypovolemia. Eur J Appl Physiol 119: 633–643, 2019. doi: 10.1007/s00421-018-4053-2. [DOI] [PubMed] [Google Scholar]
- 30.Nair AV, Yanhong W, Paunescu TG, Bouley R, Brown D. Sex-dependent differences in water homeostasis in wild-type and V-ATPase B1-subunit deficient mice. PLoS One 14: e0219940, 2019. doi: 10.1371/journal.pone.0219940. [DOI] [PMC free article] [PubMed] [Google Scholar]
- 31.Tingskov SJ, Mutsaers HAM, Norregaard R. Estrogen regulates aquaporin-2 expression in the kidney. Vitam Horm 112: 243–264, 2020. doi: 10.1016/bs.vh.2019.08.016. [DOI] [PubMed] [Google Scholar]
- 32.Goldberg M. Hyponatremia. Med Clin North Am 65: 251–269, 1981. doi: 10.1016/s0025-7125(16)31523-1. [DOI] [PubMed] [Google Scholar]
- 33.Mallie JP, Bichet DG, Halperin ML. Effective water clearance and tonicity balance: the excretion of water revisited. Clin Invest Med 20: 16–24, 1997. [PubMed] [Google Scholar]
- 34.Mendoza LD, Hyndman KA. The contribution of collecting duct NOS1 to the concentrating mechanisms in male and female mice. Am J Physiol Renal Physiol 317: F547–F559, 2019. doi: 10.1152/ajprenal.00180.2019. [DOI] [PMC free article] [PubMed] [Google Scholar]
- 35.Christensen BM, Zelenina M, Aperia A, Nielsen S. Localization and regulation of PKA-phosphorylated AQP2 in response to V2-receptor agonist/antagonist treatment. Am J Physiol Renal Physiol 278: F29–F42, 2000. doi: 10.1152/ajprenal.2000.278.1.F29. [DOI] [PubMed] [Google Scholar]
- 36.Fushimi K, Sasaki S, Marumo F. Phosphorylation of serine 256 is required for cAMP-dependent regulatory exocytosis of the aquaporin-2 water channel. J Biol Chem 272: 14800–14804, 1997. doi: 10.1074/jbc.272.23.14800. [DOI] [PubMed] [Google Scholar]
- 37.Katsura T, Gustafson CE, Ausiello DA, Brown D. Protein kinase A phosphorylation is involved in regulated exocytosis of aquaporin-2 in transfected LLC-PK1 cells. Am J Physiol Renal Physiol 272: F817–F822, 1997. [PubMed] [Google Scholar]
- 38.Berl T, Linas SL, Aisenbrey GA, Anderson RJ. On the mechanism of polyuria in potassium depletion: the role of polydipsia. J Clin Invest 60: 620–625, 1977. doi: 10.1172/JCI108813. [DOI] [PMC free article] [PubMed] [Google Scholar]
- 39.Weiner ID, Wingo CS. Hypokalemia–consequences, causes, and correction. J Am Soc Nephrol 8: 1179–1188, 1997. [DOI] [PubMed] [Google Scholar]
- 40.Greenlee M, Wingo CS, McDonough AA, Youn J-H, Kone BC. Narrative review: evolving concepts in potassium homeostasis and hypokalemia. Ann Intern Med 150: 619–625, 2009. [Erratum in Ann Intern Med 151: 143–144, 2009]. doi: 10.7326/0003-4819-150-9-200905050-00008. [DOI] [PMC free article] [PubMed] [Google Scholar]
- 41.Luke RG, Lyerly RH, Anderson J, Galla JH, Kotchen TA. Effect of potassium depletion on renin release. Kidney Int 21: 14–19, 1982. doi: 10.1038/ki.1982.3. [DOI] [PubMed] [Google Scholar]
- 42.Suga SI, Phillips MI, Ray PE, Raleigh JA, Vio CP, Kim YG, Mazzali M, Gordon KL, Hughes J, Johnson RJ. Hypokalemia induces renal injury and alterations in vasoactive mediators that favor salt sensitivity. Am J Physiol Renal Physiol 281: F620–F629, 2001. doi: 10.1152/ajprenal.2001.281.4.F620. [DOI] [PubMed] [Google Scholar]
- 43.Wang Z-J, Sun P, Xing W, Pan C, Lin D-H, Wang W-H. Decrease in dietary K intake stimulates the generation of superoxide anions in the kidney and inhibits K secretory channels in the CCD. Am J Physiol Renal Physiol 298: F1515–F1522, 2010. doi: 10.1152/ajprenal.00502.2009. [DOI] [PMC free article] [PubMed] [Google Scholar]
- 44.McDonough AA, Thompson CB, Youn JH. Skeletal muscle regulates extracellular potassium. Am J Physiol Renal Physiol 282: F967–F974, 2002. doi: 10.1152/ajprenal.00360.2001. [DOI] [PubMed] [Google Scholar]
- 45.McFarlin BE, Chen Y, Priver TS, Ralph DL, Mercado A, Gamba G, Madhur MS, McDonough AA. Coordinate adaptations of skeletal muscle and kidney to maintain extracellular [K+] during K+-deficient diet. Am J Physiol Cell Physiol 319: C757–C770, 2020. doi: 10.1152/ajpcell.00362.2020. [DOI] [PMC free article] [PubMed] [Google Scholar]
- 46.Wysowski DK, Kornegay C, Nourjah P, Trontell A. Sex and age differences in serum potassium in the United States. Clin Chem 49: 190–192, 2003. doi: 10.1373/49.1.190. [DOI] [PubMed] [Google Scholar]
- 47.Chen P, Guzman JP, Leong PKK, Yang LE, Perianayagam A, Babilonia E, Ho JS, Youn JH, Wang WH, McDonough AA. Modest dietary K+ restriction provokes insulin resistance of cellular K+ uptake and phosphorylation of renal outer medulla K+ channel without fall in plasma K+ concentration. Am J Physiol Cell Physiol 290: C1355–C1363, 2006. doi: 10.1152/ajpcell.00501.2005. [DOI] [PubMed] [Google Scholar]
- 48.Nordoy ES, Stijfhoorn DE, Raheim A, Blix AS. Water flux and early signs of entrance into phase III of fasting in grey seal pups. Acta Physiol Scand 144: 477–482, 1992. doi: 10.1111/j.1748-1716.1992.tb09324.x. [DOI] [PubMed] [Google Scholar]
- 49.Ortiz C, Costa D, Le Boeuf B. Water and energy flux in elephant seal pups fasting under natural conditions. Physiol Zool 51: 166–178, 1978. doi: 10.1086/physzool.51.2.30157864. [DOI] [Google Scholar]
- 50.Elkjaer M-L, Kwon T-H, Wang W, Nielsen J, Knepper MA, Frokiaer J, Nielsen S. Altered expression of renal NHE3, TSC, BSC-1, and ENaC subunits in potassium-depleted rats. Am J Physiol Renal Physiol 283: F1376–F1388, 2002. doi: 10.1152/ajprenal.00186.2002. [DOI] [PubMed] [Google Scholar]
- 51.Hoffert JD, Pisitkun T, Wang G, Shen R-F, Knepper MA. Quantitative phosphoproteomics of vasopressin-sensitive renal cells: regulation of aquaporin-2 phosphorylation at two sites. Proc Natl Acad Sci USA 103: 7159–7164, 2006. doi: 10.1073/pnas.0600895103. [DOI] [PMC free article] [PubMed] [Google Scholar]
- 52.Matsumura Y, Uchida S, Rai T, Sasaki S, Marumo F. Transcriptional regulation of aquaporin-2 water channel gene by cAMP. J Am Soc Nephrol 8: 861–867, 1997. [DOI] [PubMed] [Google Scholar]
- 53.DiGiovanni SR, Nielsen S, Christensen EI, Knepper MA. Regulation of collecting duct water channel expression by vasopressin in Brattleboro rat. Proc Natl Acad Sci USA 91: 8984–8988, 1994. doi: 10.1073/pnas.91.19.8984. [DOI] [PMC free article] [PubMed] [Google Scholar]
- 54.Nedvetsky PI, Tabor V, Tamma G, Beulshausen S, Skroblin P, Kirschner A, Mutig K, Boltzen M, Petrucci O, Vossenkamper A, Wiesner B, Bachmann S, Rosenthal W, Klussmann E. Reciprocal regulation of aquaporin-2 abundance and degradation by protein kinase A and p38-MAP kinase. J Am Soc Nephrol 21: 1645–1656, 2010. doi: 10.1681/ASN.2009111190. [DOI] [PMC free article] [PubMed] [Google Scholar]
- 55.Moeller HB, Knepper MA, Fenton RA. Serine 269 phosphorylated aquaporin-2 is targeted to the apical membrane of collecting duct principal cells. Kidney Int 75: 295–303, 2009. doi: 10.1038/ki.2008.505. [DOI] [PMC free article] [PubMed] [Google Scholar]
- 56.Kim JK, Jackson BA, Edwards RM, Dousa TP. Effect of potassium depletion on the vasopressin-sensitive cyclic AMP system in rat outer medullary tubules. J Lab Clin Med 99: 29–38, 1982. [PubMed] [Google Scholar]
- 57.Datta A, Yang C-R, Limbutara K, Chou C-L, Rinschen MM, Raghuram V, Knepper MA. PKA-independent vasopressin signaling in renal collecting duct. FASEB J 34: 6129–6146, 2020. doi: 10.1096/fj.201902982R. [DOI] [PMC free article] [PubMed] [Google Scholar]
- 58.Xie L, Hoffert JD, Chou C-L, Yu M-J, Pisitkun T, Knepper MA, Fenton RA. Quantitative analysis of aquaporin-2 phosphorylation. Am J Physiol Renal Physiol 298: F1018–F1023, 2010. doi: 10.1152/ajprenal.00580.2009. [DOI] [PMC free article] [PubMed] [Google Scholar]
- 59.Hasler U, Leroy V, Jeon US, Bouley R, Dimitrov M, Kim JA, Brown D, Kwon HM, Martin PY, Feraille E. NF-κB modulates aquaporin-2 transcription in renal collecting duct principal cells. J Biol Chem 283: 28095–28105, 2008. doi: 10.1074/jbc.M708350200. [DOI] [PMC free article] [PubMed] [Google Scholar]
- 60.Lee JW, Alsady M, Chou C-L, de Groot T, Deen PMT, Knepper MA, Ecelbarger CM. Single-tubule RNA-Seq uncovers signaling mechanisms that defend against hyponatremia in SIADH. Kidney Int 93: 128–146, 2018. doi: 10.1016/j.kint.2017.06.008. [DOI] [PMC free article] [PubMed] [Google Scholar]
- 61.Gaoa MC, Cao R, Du S, Jia X, Zhenga S, Huanga S, Han Q, Liu J, Zhang X, Miao Y, Kang J, Gustafsson J-A, Guan Y. Disruption of prostaglandin E2 receptor EP4 impairs urinary concentration via decreasing aquaporin 2 in renal collecting ducts. Proc Natl Acad Sci USA 112: 8397–8402, 2015. doi: 10.1073/pnas.1509565112. [DOI] [PMC free article] [PubMed] [Google Scholar]
- 62.Ando F, Sohara E, Morimoto T, Yui N, Nomura N, Kikuchi E, Takahashi D, Mori T, Vandewalle A, Rai T, Sasaki S, Kondo Y, Uchida S. Wnt5a induces renal AQP2 expression by activating calcineurin signalling pathway. Nat Commun 7: 13636, 2016. doi: 10.1038/ncomms13636. [DOI] [PMC free article] [PubMed] [Google Scholar]
- 63.Terker AS, Zhang C, McCormick JA, Lazelle RA, Zhang C, Meermeier NP, Siler DA, Park HJ, Fu Y, Cohen DM, Weinstein AM, Wang W-H, Yang C-L, Ellison DH. Potassium modulates electrolyte balance and blood pressure through effects on distal cell voltage and chloride. Cell Metab 21: 39–50, 2015. doi: 10.1016/j.cmet.2014.12.006. [DOI] [PMC free article] [PubMed] [Google Scholar]
- 64.Kishore BK, Terris JM, Knepper MA. Quantitation of aquaporin-2 abundance in microdissected collecting ducts: axial distribution and control by AVP. Am J Physiol Renal Physiol 271: F62–F70, 1996. doi: 10.1152/ajprenal.1996.271.1.F62. [DOI] [PubMed] [Google Scholar]
- 65.Kim W-Y, Nam SA, Choi A, Kim Y-M, Park SH, Kim HL, Kim H, Han K-H, Yang CW, Lee M-S, Kim YK, Kim J. Atg7-dependent canonical autophagy regulates the degradation of aquaporin 2 in prolonged hypokalemia. Sci Rep 9: 3021, 2019. doi: 10.1038/s41598-019-39702-4. [DOI] [PMC free article] [PubMed] [Google Scholar]
- 66.Saritas T, Puelles VG, Su X-T, McCormick JA, Welling PA, Ellison DH. Optical clearing in the kidney reveals potassium-mediated tubule remodeling. Cell Rep 25: 2668–2675.e3, 2018. doi: 10.1016/j.celrep.2018.11.021. [DOI] [PMC free article] [PubMed] [Google Scholar]
- 67.Bolignano D, Medici MA, Coppolino G, Sciortino MT, Merlo FM, Campo S, Donato V, Venuti A, Sturiale A, Zaccaria D, Buemi A, Lacquaniti A, Buemi M. Aquaretic inhibits renal cancer proliferation: role of vasopressin receptor-2 (V2-R). Urol Oncol 28: 642–647, 2010. doi: 10.1016/j.urolonc.2008.12.014. [DOI] [PubMed] [Google Scholar]
- 68.Sinha S, Dwivedi N, Tao S, Jamadar A, Kakade VR, O’Neil M, Weiss RH, Enders J, Calvet JP, Thomas SM, Rao R. Targeting the vasopressin type-2 receptor for renal cell carcinoma therapy. Oncogene 39: 1231–1245, 2020. doi: 10.1038/s41388-019-1059-0. [DOI] [PMC free article] [PubMed] [Google Scholar]
- 69.Boyd-Shiwarski CR, Weaver CJ, Beacham RT, Shiwarski DJ, Connolly KA, Nkashama LJ, Mutchler SM, Griffiths SE, Knoell SA, Sebastiani RS, Ray EC, Marciszyn AL, Subramanya AR. Effects of extreme potassium stress on blood pressure and renal tubular sodium transport. Am J Physiol Renal Physiol 318: F1341–F1356, 2020. doi: 10.1152/ajprenal.00527.2019. [DOI] [PMC free article] [PubMed] [Google Scholar]
- 70.Jung J-Y, Madsen KM, Han K-H, Yang C-W, Knepper MA, Sands JM, Kim J. Expression of urea transporters in potassium-depleted mouse kidney. Am J Physiol Renal Physiol 285: F1210–F1224, 2003. doi: 10.1152/ajprenal.00111.2003. [DOI] [PubMed] [Google Scholar]
- 71.Musselman TM, Zhang Z, Masilamani SME. Differential regulation of the bumetanide-sensitive cotransporter (NKCC2) by ovarian hormones. Steroids 75: 760–765, 2010. doi: 10.1016/j.steroids.2010.05.014. [DOI] [PMC free article] [PubMed] [Google Scholar]
- 72.Bockenhauer D, Bichet DG. Inherited secondary nephrogenic diabetes insipidus: concentrating on humans. Am J Physiol Renal Physiol 304: F1037–F1042, 2013. doi: 10.1152/ajprenal.00639.2012. [DOI] [PubMed] [Google Scholar]
- 73.Peters M, Jeck N, Reinalter S, Leonhardt A, Tonshoff B, Klaus GG, Konrad M, Seyberth HW. Clinical presentation of genetically defined patients with hypokalemic salt-losing tubulopathies. Am J Med 112: 183–190, 2002. doi: 10.1016/S0002-9343(01)01086-5. [DOI] [PubMed] [Google Scholar]
- 74.Earley LE, Orloff J. The mechanism of antidiuresis associated with the administration of hydrochlorothiazide to patients with vasopressin-resistant diabetes insipidus. J Clin Invest 41: 1988–1997, 1962. doi: 10.1172/JCI104657. [DOI] [PMC free article] [PubMed] [Google Scholar]
- 75.Loffing J. Paradoxical antidiuretic effect of thiazides in diabetes insipidus: another piece in the puzzle. J Am Soc Nephrol 15: 2948–2950, 2004. doi: 10.1097/01.ASN.0000146568.82353.04. [DOI] [PubMed] [Google Scholar]
- 76.Shirley DG, Walter SJ, Laycock JF. The antidiuretic effect of chronic hydrochlorothiazide treatment in rats with diabetes insipidus: renal mechanisms. Clin Sci (Lond) 63: 533–538, 1982. doi: 10.1042/cs0630533. [DOI] [PubMed] [Google Scholar]
- 77.Kim G-H, Lee JW, Oh YK, Chang HR, Joo KW, Na KY, Earm J-H, Knepper MA, Han JS. Antidiuretic effect of hydrochlorothiazide in lithium-induced nephrogenic diabetes insipidus is associated with upregulation of aquaporin-2, Na-Cl co-transporter, and epithelial sodium channel. J Am Soc Nephrol 15: 2836–2843, 2004. doi: 10.1097/01.ASN.0000143476.93376.04. [DOI] [PubMed] [Google Scholar]
- 78.Grimm PR, Coleman R, Delpire E, Welling PA. Constitutively active SPAK causes hyperkalemia by activating NCC and remodeling distal tubules. J Am Soc Nephrol 28: 2597–2606, 2017. doi: 10.1681/ASN.2016090948. [DOI] [PMC free article] [PubMed] [Google Scholar]
- 79.Hadchouel J, Ellison DH, Gamba G. Regulation of renal electrolyte transport by WNK and SPAK-OSR1 kinases. Annu Rev Physiol 78: 367–389, 2016. doi: 10.1146/annurev-physiol-021115-105431. [DOI] [PubMed] [Google Scholar]
- 80.Welling PA. Roles and regulation of renal K channels. Annu Rev Physiol 78: 415–435, 2016. doi: 10.1146/annurev-physiol-021115-105423. [DOI] [PubMed] [Google Scholar]