

Abstract
BACKGROUND AND PURPOSE: Normal pressure hydrocephalus (NPH) is considered to be a combination of altered CSF resorption and a reversible form of cerebral ischemia. The hypothesis tested in this study was that a reduction in venous compliance in the territory drained by the superior sagittal sinus (SSS) is associated with NPH and cerebral ischemia.
METHODS: This prospective study involved 27 patients without evidence of hydrocephalus. This group was subdivided into those with normal MR findings and those with evidence of ischemia or atrophy. Ten patients with NPH then underwent MR flow quantification studies of the cerebral vessels. Five of these patients had the same studies performed after CSF drainage. Vascular compliance was measured in the SSS and straight sinus territory by use of MR flow quantification with net systolic pulse volume (NSPV) and arteriovenous delay (AVD) as markers.
RESULTS: Vascular compliance of patients with ischemia or atrophy was significantly higher than that of healthy subjects (mean NSPV in the SSS, 417 μL and 274 μL, respectively). Patients with NPH showed lower compliance than that of the healthy subjects in the SSS (mean NSPV, 212 μL and 274 μL, respectively; mean AVD, 42 ms and 89 ms, respectively). After intervention, the NPH group showed compliance approximating the group with ischemia/atrophy.
CONCLUSION: Vascular compliance is significantly different in the brains of healthy subjects as compared with that in patients with ischemia/atrophy or NPH.
Normal pressure hydrocephalus (NPH) was first described in 1965 by Adams et al (1) in a study of elderly patients with the clinical triad of gait disturbance, dementia, and urinary incontinence. Approximately two thirds of cases are associated with such conditions as arachnoiditis, meningitis, subarachnoid hemorrhage, trauma, and tumors, as well as ectasia and elongation of the basilar artery (2). Despite an awareness of these associated factors, a detailed understanding of the pathophysiology of NPH has remained elusive. MR aqueduct flow quantification, infusion conductance tests, nuclear medicine cisternography, and CSF tap tests measure CSF flow and resorption abnormalities (3–6). Nuclear medicine and CT studies of relative cerebral blood flow (rCBF) measure ischemia in this disorder (7). The pathophysiological mechanisms of this disease appear to involve both reduced CBF and altered CSF resorption without producing an increase in CSF pressure. A single mechanism that explains both processes has remained elusive. Mase et al (8) hypothesized that the most important factor in the underlying pathophysiology of NPH is a reduction in intracranial compliance. Intracranial vascular compliance, however, has not been measured in previous studies. The hypothesis tested in this study is that, in NPH, a reduction in venous compliance in the superior sagittal sinus (SSS) territory leads to vascular compression and ischemia.
Methods
Subjects
Twenty-seven patients without clinical features of hydrocephalus underwent standard diagnostic MR imaging. On the basis of the MR findings, patients were placed into two groups, healthy or those with ischemia/atrophy. The criteria for defining atrophy were semiquantitative. Ventricular enlargement was measured at the level of the frontal horns and a size greater than 33% of the adjacent frontal lobes was used as the cutoff. Similarly, the sulci were compared with the adjacent gyri in the same slice, and atrophy was defined as a sulcal size greater than 20% of the gyrus. Ischemia was defined as any white matter T2 hyperintensity (excluding transependymal periventricular changes) affecting greater than 10% of the parenchyma. The healthy group contained seven patients, four men and three women, with a mean age of 58 ± 7 (SD) years. The ischemia/atrophy group contained 20 patients, 12 men and eight women, with a mean age of 75 ± 7 years. The NPH group was prospectively selected on the basis of classical clinical findings plus either a positive CSF tap test and/or a positive nuclear medicine cisternogram. In all but one patient, a positive clinical response to the tap test was the main criterion for inclusion in the study. One patient had a strongly positive nuclear medicine test only. Effectively, the standard of reference used to detect NPH was significant clinical improvement in gait and/or cognition and/or incontinence as defined by the referring neurologist after the tap test. Ten patients fulfilled these criteria (one female and nine male patients, with a mean age of 75 ± 10 years). In five cases, the flow quantification study was repeated after a CSF drainage procedure, in one case within 30 minutes of a tap test and in the remainder 3 days after ventriculoperitoneal shunt insertion. In four cases, therapy was denied on the basis of significant comorbidity. One patient is awaiting surgical opinion. All five patients who were followed up showed clinical improvement. Patients were excluded from the NPH group if they had symptoms suggesting NPH but did not have a positive tap test or nuclear medicine study, because symptoms alone were thought not to distinguish NPH from other forms of dementia significantly.
MR Imaging and Analysis
All patients were imaged on a 1.5-T superconducting magnet. A prospectively cardiac-gated phase-contrast flow-quantification sequence was used with the following parameters: 29/7/1 (TR/TE/excitations), 30° flip angle, 6-mm section thickness, 192 × 512 matrix, and 200-cm field of view. The velocity-encoding value was 40 cm/s. This value was selected to maximize the measurement of the venous structures. The plane of section was selected to intersect the SSS approximately 2 cm above the confluence of sinuses and to continue through the straight sinus and pass through the basilar artery and the cavernous portion of the internal carotid arteries (Fig 1A). This plane was selected to minimize obliquity of the vessels, despite MR flow measurement being relatively insensitive to changes in flow angulation (9). Regions of interest were placed around the SSS, the straight sinus, and the carotid artery (Fig 1B). The base lines of the resultant graphs were manipulated retrospectively, giving an effective range of 0 to 80 cm/s. This successfully excluded aliasing in all the venous structures and in all but two of the arteries in the control group. In these two patients, the trace from the basilar artery was used.
fig 1.

A, Scout image shows site of flow quantification acquisition.
B, Axial scout image in the same plane as the flow study shows the carotid artery (long arrow), the straight sinus (short thin arrow), and the SSS (short thick arrow).
C, Axial phase image in the same plane as B.
Measurement of Net Systolic Pulse Volume (NSPV)
The resultant graphs were displayed as mean flow versus time for one RR interval. The mean flow volume in milliliters per minute was calculated by multiplying the mean flow rate by the cross-sectional area of the vessel. To measure the NSPV, the arterial graph was scaled until the total blood volume represented by this graph equaled the venous graph (either the SSS or straight sinus graph) and then the venous graph was subtracted from the arterial graph. The net flow graph was the result of this subtraction. The net flow is a roughly sinusoidal graph with positive values in systole and negative values in diastole. The area beneath the curve above the line in systole is equal to the area below the line in diastole if the arterial and venous graphs have been scaled correctly. The NSPV was calculated as the area beneath the curve in systole for each of the SSS and straight sinus territories.
Measurement of Arteriovenous Delay (AVD)
The AVD was measured from the center (gauged as the center of a line drawn at half the peak height, because of some variability of the highest point on the curves) of the arterial peak to the center of the venous peak in the SSS territory. AVDs were not measured in the straight sinus territory, as the venous flow shows a very broad peak.
Mean and standard deviations were obtained for each group of patients, and differences were calculated between the healthy and ischemia/atrophy groups and compared with those of the NPH group. Differences within the NPH group before and after intervention were also calculated. Differences between the groups were tested using a nonpaired t test in the first instance and a paired t test in the second instance.
Results
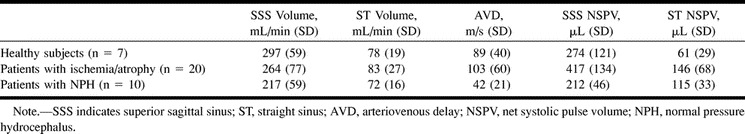
The results are summarized in Table 1.
Table 1:
Results before intervention
Nonhydrocephalic Patients
Figure 2 shows an example of a patient with normal blood flow. The arterial flow has a shape reminiscent of carotid duplex sonography. The venous flow has the same overall volume but the peak and trough flows are closer to the mean flow. The delay from the middle of one peak to the other is the AVD (small in this patient). The area defined between the arterial and venous flow curves in the central portion of the graph is the NSPV. Figure 3, for comparison with Figure 2, is from a patient predominantly with atrophy. Note the arterial flow is overall lower than in the healthy patient. The center of the venous peak is displaced to the right as compared with the healthy patient, and thus the AVD is longer. Moving the venous peak right has also increased the area between the arterial and venous curves, indicating a larger NSPV.
fig 1.

fig 2. Arterial and venous flow in the SSS territory in a healthy patient. fig 3. Arterial and venous flow in the SSS territory in a patient with atrophy
The mean blood flow volume through the SSS territory in the ischemia/atrophy group was 11% lower than in the healthy group, but this was not statistically significant (P = .16). The blood flow volumes through the straight sinus segments were not significantly different. Despite the lack of significant alteration in blood flow, the markers of compliance showed significantly higher compliance in the SSS territory and the straight sinus territory in the ischemia/atrophy group as compared with the healthy group. The NSPV measurements were 52% higher than those in healthy subjects (P = .01) in the SSS and 140% higher in the straight sinus segment (P = .002). The AVD was 16% larger in this group than in the healthy group (P = .3). Although this value failed to reach significance, it was concordant with the NSPV findings.
NPH Group
Figure 4 graphically shows the compliance changes in NPH. Figure 4A shows a patient with NPH. Note the areas under the arterial and venous curves are equal, denoting equal blood volumes. The curves are almost identical in shape, only the venous flow is delayed by approximately 50 milliseconds. Subtracting venous flow from arterial flow gives the smaller of the two curves in Figure 4C. The area under the curve above the zero line is the NSPV. In Figure 4B, the same patient was reimaged 30 minutes later, after removal of 30 mL of CSF. Note the arterial curve is thinner, has a higher peak flow, and is shifted to the left. The venous curve is broader, has a lower peak, and its center is shifted to the right. When the venous curve is subtracted from the arterial curve, the larger peak in Figure 4C results. The area under the curve in Figure 4C is the NSPV, and there is an increase in compliance after the tap test. As the arterial and venous peaks have moved apart in Figure 4B, it is also noted that the AVD is larger.
fig 4.

A, Blood flow in SSS territory before tap test shows very similar arterial and venous flows with minimal delay.
B, Blood flow in SSS territory immediately after removal of 30 mL of CSF. Note the arterial curve now peaks earlier, is higher, and is thinner. The venous curve peaks later, is lower, and is wider.
C, Net blood flow before and after tap test. The divergence of the curves after intervention has led to a larger overall pulsation in systole (positive half of curve).
The mean blood flow volume through the SSS in NPH patients was 27% lower in relation to that in the healthy subjects and 18% lower than that in the ischemia/atrophy group (P < .01 and P = .05, respectively). This suggests that SSS blood flow is even lower in patients with NPH than in those with macroscopic evidence of ischemia or infarction. The straight sinus territory volume showed no significant difference between the NPH group and either of the other groups.
There is a trend toward the SSS NSPV being lower in the NPH patients than in the healthy subjects (P = .08); however, the AVD was 53% lower (P = .003). The direction of the results was concordant and the lack of significance of the NSPV may relate to the small number of patients. Comparing the SSS territory with that in the ischemia/atrophy group showed the NSPV to be 49% lower and the AVD 59% lower; the results were significant (P < .001 and P = .002, respectively). These findings suggest that compliance measures may be better able to discriminate between patients with NPH and ischemia/atrophy than between patients with NPH and those who are healthy. This finding is likely to be of more clinical relevance in situations in which the distinction between patients with NPH and those with diffuse cerebral atrophy or ischemia is more problematic. The straight sinus territory compliance was 89% higher in the NPH group than in the healthy group, which was significant (P = .002) but not significantly different from that in the ischemia/atrophy group. This is an interesting result, because although in NPH patients the SSS territory is significantly less compliant than in healthy subjects, the straight sinus territory is significantly more compliant. In this territory, the NPH patients and the ischemia/atrophy patients are similar.
NPH Group after Intervention
These data are summarized in Table 2. All patients showed evidence of clinical improvement at neurologic review. On comparison of blood flow data, no patient showed a reduction in blood flow after intervention. The mean increase in the SSS territory was 28% (P = .01). In the straight sinus territory, there was no significant change. In the SSS, the compliance markers showed an increase in the NSPV of 129%, while the AVD increased by 210% (P < .01 and P < .001, respectively). The NSPV for the straight sinus territory was essentially unchanged.
Table 2:
Results after intervention
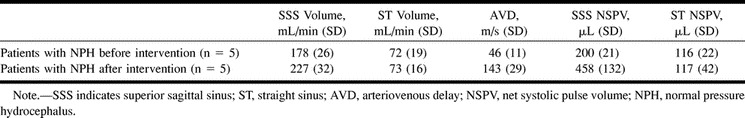
Comparison of the postintervention group with the healthy group showed that the SSS flow volume remained 24% lower, despite the improved blood flow P < .01). The SSS markers of compliance changed from significantly less compliant than normal before intervention to significantly more compliant after. The NSPV was 67% larger and the AVD 61% larger (P = .02 and P = .01, respectively). The straight sinus compliance as stated earlier was unchanged after intervention and thus remained significantly greater than in the healthy group. A comparison of the postintervention group with the ischemia/atrophy group showed that the NPH group approached, and was not significantly different from, the ischemia/atrophy group.
These results suggest that ischemia and atrophy increase the compliance of both the straight sinus and SSS territories as compared with healthy subjects. In the SSS territory, NPH vascular compliance was lower than in healthy subjects and was much lower than in the ischemia/atrophy patients. After the drainage procedures, the SSS territories in the NPH patients returned to closely approximate those in the ischemia/atrophy group. The straight sinus territory compliance was altered from normal by ischemia/atrophy and NPH but was resistant to change by treatment in the NPH group.
Discussion
Overview of Methods
The working definition of vascular compliance as used in this study is the degree of volume change that occurs in all vessels that lie between the arteries at the base of the skull and the venous sinuses resulting from pressure changes that occur during the cardiac cycle. More formally, compliance in vessels is defined as the rate of change of the vascular volume with respect to the change in pressure (dV/dP); thus, the more elastic a vessel, the greater its wall will dilate to accommodate a pressure wave, such as the systolic pressure wave, and the greater its compliance (10). In essence, this change in volume with the systolic pressure wave is the NSPV. It has been measured by obtaining the area under the systolic portion of the net blood flow graph. Vascular compliance is important in the brain because a rigid container (the skull) and an incompressible fluid (CSF) surround it. The blood supply is pulsatile, with the pressure in the arterial blood varying by the pulse pressure. The volume of blood entering the brain thus varies with the cardiac cycle. The arteriovenous difference (difference between blood entering and leaving the brain) shows a net intracranial inflow of blood during systole and a net outflow during diastole (11). This volume change must be accommodated by an exactly equal volume exiting the skull, because CSF is incompressible. The amplitude, then, of the CSF pressure waveform depends on the arterial input, the compliance of the cranial contents, and the venous outflow (12). The vascular compliance is important in this process because the degree of vascular compliance determines the degree of the volume change, and it is this volume change that is translated through the CSF. If the vessels were totally rigid, none of the arterial pulsation would be transmitted to the CSF, and, as a corollary, if the skull were a totally closed system, the vessels within it would show no net pulsation.
There is a second but related way that compliance may be seen to affect the passage of a pressure/volume wave. The speed of a wave in a vessel can be given by the equation V = √Eh/2ρr, where V is velocity, E is the elastic modulus (instantaneous stiffness of the vessel), h is the vessel wall thickness, ρ is the blood density, and r is the vessel's internal radius. As compliance is inversely proportional to E and is related to the rate of change of r, the speed of a wave in a vessel is inversely proportional to the square root of compliance (13). In the case of the patients who were followed up after CSF diversion, parameters such as wall thickness and blood density would not be expected to change in 3 days; therefore, the AVD effectively measures compliance in these patients. Comparisons of the wave velocities between the ischemia/atrophy and healthy groups are more difficult, as wall thickness, vessel size, and blood density cannot be controlled. It is, however, thought unlikely that blood density was significantly varied between the groups. Ischemia, due to arterial disease, leads to vessel wall thickening (atheroma), and atrophy due to Alzheimer's disease, for example, leads to fibrohyaline thickening of blood vessels (14). Both these changes would be expected to lead to increased wave velocity and tend to underestimate rather than overestimate the compliance in these groups. Taking the whole of the cerebral vascular tree as a series of vessels, it can be seen that the delay between the center of the arterial flow peak and the venous flow peak is a measure of the pulse wave velocity through the vessels between these two points. The AVD thus can also be used as a measure of vascular compliance.
It is known that NPH is associated with low intracranial compliance (8). The difficulty has been defining the extent of this compliance change and linking it to the other manifestations of NPH. The hypothesis tested in this study was that a reduction in venous compliance in the SSS territory is associated with NPH and cerebral ischemia. To test this hypothesis, MR flow quantification was used to measure the NSPV and AVD in a healthy group of subjects and in a group of patients with either ischemia or atrophy, and these data were then compared with those in a group of patients with NPH before and after shunting or removal of CSF. The first control group served to provide initial data with respect to a healthy population. The criteria for MR normality were strict, however, and because of this, truly “normal,” or “healthy” patients between the ages of 70 and 90 years were not common. It is not difficult to distinguish patients with NPH from healthy subjects either on clinical or imaging grounds; thus, the ischemia/atrophy group was selected as a second control group, as it is often difficult to distinguish patients with atrophy or ischemia from those with NPH, and thus this group makes a more clinically useful comparison group than does a group of patients who have no morbidity.
The grouping of the ischemia/atrophy patients was carefully considered. They were grouped together because, in a large percentage of them, both sulcal/ventricular enlargement and white matter lesions were detected together. In the few predominately with atrophy, the increased compliance was found to be concordant with the remainder of the group and no statistical difference was noted. Only two patients had white matter lesions exclusively, and these could not be analyzed separately. Finally, the selection criteria for patients with NPH were strict, primarily because of the lack of a reference standard. Previous studies have noted a high rate of comorbidity between NPH and other causes of dementia at pathologic review (15). The aim in this study was to exclude, to the extent possible, those patients with other coexisting causes of dementia in the hope of better defining the physiology of NPH alone. The best standard available to this end is clinical improvement. In this sample, only two of the 10 NPH patients had any evidence of white matter lesions, and the changes were minor in nature. It has previously been noted that patients with no white matter changes have a better outcome (16).
Overview of Results
The intracranial system is semiclosed, which leads to a degree of interdependence between the variables measured and to the formation of feedback loops. With this in mind, what follows is an initial overview of the scope of the findings and the way they appear to impact on the findings of other researchers. The arguments for and against each assertion will not be presented in full until the more detailed subsections that follow. Thus, it is hoped that the reader will gain a general sense of the sweep of the discussion before the details are presented.
Figure 5A shows a stylized section through the brain in a patient with atrophy. The superficial circulation is depicted superiorly and passes from arterial to venous (left to right). The deep circulation is similarly depicted inferiorly. In the superficial system, the arterial pulsations in the subarachnoid space are large. As the vessels pass into the brain, they are somewhat restricted in their pulsation by the parenchyma; however, as there are a larger number of arterioles than arteries, the overall pulsation from the brain is larger as compared with the subarachnoid space. Brain arterial expansion is dissipated by a combination of CSF movement out of the skull and venous compression. The actual peak flow in the venous outflow is a combination of the pulsatility of blood leaving the capillaries (normally low) and the mechanical squeezing of the veins. Compression is greatest at the veins in the subarachnoid space and the lateral lacunae. Total blood flow is regulated by the arteriolar constriction before the capillary bed. Interstitial fluid flows from the capillaries to the venules. The sulci are widened, indicating volume loss, which may have some correlation with the shear stresses produced by the arterial pulsation, as these are also larger than normal. Apart from the increased magnitude of all the pulsations, the findings are similar to those in the normal brain.
fig 5.

A, The pathophysiology of atrophy. Straight black arrows indicate the magnitude of the pulsations; white arrow near the SSS, volume of CSF leaving the system through the incisura of the tentorium; curved black arrows between the capillary beds, bulk fluid flow; SSS, superior sagittal sinus; ST, straight sinus; V, ventricle.
B, The pathophysiology of NPH. Straight black arrows denote vessel pulsation magnitudes; curved black arrows, interstitial fluid bulk flow; white arrow, CSF flow; SSS, superior sagittal sinus; ST, straight sinus; V, ventricle.
The deep system is very similar except that the veins have a shorter subarachnoid course and thus the blood exiting in the straight sinus is less pulsatile. Because little of the pulsation exits via the veins, there is both a component of the pulsation expended toward the superficial brain and toward the ventricles. Again, increased pulsations in atrophy overall may account for the shear stresses increasing volume loss.
Figure 5B is of a patient with NPH. In the superficial system there is reduced compliance and a restriction of the CSF that can leave the system. This has two effects. The first is that almost all the arterial pulsations, both intra- and extraparenchymal, must be absorbed by venous compression, and therefore arterial and venous flow waves become closer in timing and shape. The second effect is compression of the subarachnoid space veins and lateral lacunae producing flow-limiting resistance. The arteriolar constriction relaxes fully to try to increase blood flow but fails, leaving significant ischemia. The capillary bed is no longer protected from systemic pressure and the increase in pressure is manifest as an increase in pulsatile flow within the capillary lumen, which passes directly to the veins. This compounds the reduced AVD. The overall effects of ischemia and reduced compliance are to reduce arterial pulsations. The superficial brain is thus subject to reduced shear stress, reducing volume loss. As increasing amounts of fluid leaving the capillaries cannot return to their venules in the superficial brain, what volume loss there is tends to be masked by the higher interstitial pressure.
In the deep system, the arteries retain their increased pulsatility and this pulsatility is absorbed mostly by ventricular compression due to the relative stiffness of the superficial parenchyma. There is still no significant deep venous compression, and the lower pressure in the deep veins compared with the superficial leads to bulk transport of interstitial fluid from superficial to deep. Because there is a balance in bulk fluid flow, there is no rise in mean CSF pressure. The ventricles enlarge because of atrophy from increased shear stress and appear to bulge outward, owing to a small pressure increase within the ventricles caused by the water hammer effect.
Vascular Compliance
The results show that the processes of atrophy and arterial ischemia significantly increase vascular compliance: the NSPV in the SSS territory was 52% larger in this group than in the healthy group. The veins are the major capacitance vessels, and as they are thin-walled, they account for between 70% and 80% of the capacitance in the brain (17, 18). Any reduction in brain substance or brain volume should allow greater freedom of vessel movement, and this, together with any increase in input pulse pressure, may partly account for the above finding. Mild ischemia has been shown to lead to arteriolar partial relaxation with the expected return to normal flow volume. This occurs, however, at the expense of increased pressure and pulsations in the capillary bed, leading to increased overall brain pulsations (19). If autoregulation fails from thickening of the walls of the small arterioles, then greater resistance across these segments would produce a pressure drop downstream. This pressure drop within the venules would increase compliance (20). The results show a significant reduction in vascular compliance in NPH, with the AVD 53% lower than in the healthy group in the SSS territory. Note that this change is the opposite of that in the ischemia/atrophy group, in which there was increased compliance. Thus, the diseases that produce clinical and imaging findings with which NPH can be confused (ie, atrophy and arterial ischemia) are well demarcated using this method.
The small size of this study would normally be a limiting factor; however, despite this fact, the results show a high degree of statistical significance. Not all the supratentorial blood flow is measured by this technique, as portions of the frontal, parietal, temporal, and occipital lobes are drained by direct connections into the transverse sinuses and the middle cerebral veins, for example. Nevertheless, all superficial veins share similar physiology and would be expected to behave in a similar way. The deep system may communicate with the superficial system via the vein of Rosenthal, but this connection is usually not significant, and increased flow via this route is thought unlikely in NPH.
Reversible Ischemia
In this study there was, on average, a 29% lower blood flow through the SSS as compared with normal. Widespread hypoperfusion patterns have been previously detected in NPH (7). Xenon CT has shown that the maximal reduction in rCBF and relative cerebral blood volume (rCBV) occurs in the territory of the anterior cerebral artery (21). It is noted that the anterior cerebral artery territory is almost exclusively drained by the SSS and this territory is maximally affected by the compliance changes found.
Reversibility of the ischemia has also been recognized, with both rCBF and rCBV increasing after lumbar puncture (2). In healthy subjects or those with stroke, CBF is not increased by CSF removal (2), and in patients with Alzheimer's disease, decreased blood flow is found in the gray matter after removal of CSF (2). A 28% reversible component was found in this study after CSF diversion.
Previous theories have stressed that the increase in upstream resistance caused by arterial compression causes ischemia in NPH (20, 22). These theories predict reduced venous pressure and thus increased venous compliance. If, as hypothesized, compression of the veins were to reduce flow, then the strict autoregulation of the cerebral vasculature would cause relaxation of the arterioles and thus an increase in flow back toward normal. Continuing ischemia would then result in maximally dilated arterioles and systemic arterial pressure in the capillary bed (19). Interestingly, these findings were predicted by Penar et al (23) using a mathematical model. These investigators showed that NPH could not be sustained unless capillary flow resistance was elevated. The present study indicates low compliance with ischemia in NPH and thus venous compression and high capillary pressure. In childhood hydrocephalus, there is a greater increase in the diastolic flow as compared with the systolic flow after shunt, suggesting a decreased distal resistance (24). Note that the postshunt findings in this study show greater compliance and this predicts decreased distal resistance.
The venous ischemia as discussed above seems to affect the superficial system preferentially, since, in the present study, the compliance and blood flow through the deep system (straight sinus territory) were not significantly different between the ischemia/atrophy group and the pre- or postintervention NPH group. That the two vascular systems are separate is well known, as intracerebral venous anastomoses through the centrum semiovale toward the convexity are nonexistent or negligible in humans. Instead, a venous watershed exists, separating paraventricular white matter from a layer of subcortical white matter (25). The difference in response of the deep system to NPH seems to come about because of a difference in anatomy and physiology. Normally, the Starling resistor effect of the lateral lacunae and subarachnoid course of the veins maintain the cortical (superficial) venous pressure above CSF pressure. A similar mechanism is absent in the deep venous system, and thus the pressure in the deep veins is similar to that in the dural sinuses (26). The deep system is thus more resistant to changes in CSF pressure, both static and dynamic, whereas the superficial system is more easily affected because the superficial veins have a long subarachnoid course.
One potential limitation of the arguments presented above is whether the apparent extreme reduction in blood volume through the SSS in the NPH group could be explained by some other mechanism, such as reduced cardiac output, in these patients. The important variable in cerebral perfusion is the input blood pressure. Review of the clinical state of these patients showed that in fact the blood pressure was raised. This finding has also been borne out in the literature, where it is noted that there is a high correlation between hypertension and NPH (27). A second potential problem is why the flows were not measured in the neck, with the corrections performed on carotid and jugular flows. Although this would have allowed a greater sample volume, it would not have allowed selective sampling of the SSS and straight sinus. The crux of this study was the measurement of compliance, and, as both the cervical carotid and jugular are very compliant, measuring here may have introduced bias. A further potential problem arises if the SSS and straight sinus flows are not truly independent, given they share a closed cavity. As described above, the vascular territories from the arterioles to the venous sinuses of these two territories are independent, at least in humans. The two blood flows come together at the torcular Herophili, but at this site there would only be expected to be significant interference of one upon the other if there was a significant downstream resistance producing a pressure gradient here. This seems unlikely, as the sinuses are capacious and have rigid walls. In any event, the straight sinus blood flow seems very resistant to any of the disease processes studied.
CSF Pulsation
The study of CSF pulsation dominates the literature on NPH. The present results showed a significant reduction in the SSS territory pulsation and an increased magnitude of the straight sinus territory pulsation. The SSS territory is much larger than that of the straight sinus; thus, the overall amount of CSF leaving the foramen magnum would be expected to be smaller in patients with NPH than in healthy subjects. Other studies have found that, in communicating hydrocephalus, the aqueduct flow is larger and the cervical flow half as large as compared with normal (22). A greater reduction in cervical amplitudes has also been shown to correspond to worsening symptoms (28). Kim et al (29) found a significant shortening in the time from the beginning of arterial systole to the center of the CSF diastolic flow curve (return flow) in the cervical region. CSF diastole is related to contraction of the brain, which in turn is related to the rate blood leaves the veins. In this study, the AVD was shortened in NPH, leading to earlier venous outflow and accounting for the earlier CSF diastole.
The aqueduct flow is increased in NPH and this may relate to the relative increase in straight sinus pulsation in patients with NPH as compared with that in healthy subjects, owing to the increased compliance herein. Others have concluded that the increased flow in the aqueduct in all forms of communicating hydrocephalus is simply a matter of reduced resistance to flow caused by a larger aqueduct diameter (30). Flow through a vessel is determined by the following equation: flow = pressure ÷ resistance. The calculated resistance in the aqueduct is remarkably low, even in healthy subjects (31), which is why a pressure gradient cannot be normally measured between the ventricles and subarachnoid space (26). Using cadaveric aqueducts, flows equivalent to CSF systolic flows of 40 to 120 μL were obtained with pressures of only 1.3 cm of water (19), which compares with actual normal aqueduct flows on the order of 30 μL (11). It seems unlikely, then, that a three- to fourfold increase in aqueduct flow could come about by any other means than by increased subependymal brain pulsation. Some have stated that the increased aqueduct flow is related directly to the larger size of the ventricles, “the brain beating on a larger drum” (32), but the aqueduct flow is independent of ventricular volume and only dependent on the volume increase of the brain (19). Further study of ischemia and atrophy is required to see whether the higher straight sinus compliance in these diseases also leads to high aqueduct flows.
Ventricular Dilatation
The current theory is that in early communicating hydrocephalus the ventricles expand, forcing the brain out against the inner table of the calvarium, compressing the cortical veins. With the brain expanded outward, all systolic motion is directed inward, leading to increased systolic flow of CSF (32). This theory requires that there be a transmantle force to push the brain up and out and enlarge the ventricles (22). In most instances, however, a transmantle pressure cannot be detected (26). To develop a transmantle pressure gradient, there would have to be a significant resistance to flow at the aqueduct, or the pressure gradient could not exist. In fact, as described above, in communicating hydrocephalus there is decreased resistance to flow as a result of aqueduct dilatation (3). The findings in the present study suggest not a transmantle pressure gradient but a transcortical gradient, with higher pressures superficially. Similar findings were found in communicating hydrocephalus using a dog model (26).
It has been suggested that although the mean intraventricular pressure is usually normal, the pulse pressure is generally increased up to six times normal, giving a so-called “water hammer pulse” (19, 33). Normally, the inner portions of the brain move least; in NPH, owing to reduced compliance superficially and to larger arterial pulsations in the deeper territory, they move the most, producing increased shear stresses and thus ventricular expansion through volume loss. Shear stresses have been implicated in the pathogenesis of dementia and atrophy (34). White matter particularly seems extremely susceptible to damage and demyelination as a result of apparently small increases in physical strain (35). The tangential forces on the corona radiata have been proposed as the cause of gait disturbance (34). The large floppy ventricles would appear to be bowing outward due to the small but significant intraventricular water hammer pulse. Thus, I believe that although the pressures generated within the ventricles are far too small to push the ventricles out and compress the cortical veins on their own, the opposite is probable (ie, vascular compression leads to ventricular dilatation). Vascular pulsations cause parenchymal atrophy and the ventricles then act not unlike a floppy sail on a sail boat, which only requires a breath of wind to cause it to billow out.
The lack of volume loss with preserved gyri above the sylvian fissure, as compared with the enlarged basal cisterns and sylvian cisterns below (36), is probably multifactorial. First, the increased interstitial fluid from the intrinsic venous compression superficially may artificially improve the appearances. Note that after intervention, the NPH patients closely approached the ischemia/atrophy group, not the healthy group, in both the SSS and straight sinus territories. This suggests some underlying atrophy or ischemia that is irreversible. Second, the vascular pulsations and thus the shear stresses superficially are reduced.
CSF Resorption
CSF is produced at a rate of 500 mL per day (37), and the classical teaching is that all this fluid is resorbed by the arachnoid granulations. Greitz (22) disagrees, however, and suggests that “the pacchionian granulations are not the main CSF outflow.” Portnoy et al (26) state that the normal pathway for CSF absorption includes transcapillary or transvenular absorption of CSF from the interstitial space and that increased cortical venous pressure is an initial event resulting in decreased absorption and subsequent hydrocephalus. An increase in cortical venous pressure has been suggested by the data, as discussed above, and this would initiate hydrocephalus in a manner similar to Portnoy's model. Water is freely diffusible through the ependyma, and intrathecally injected larger molecules—such as iodine, sugar, inulin, and albumen—pass rapidly into the blood, even contrast media have been shown to penetrate the cord and brain and rapidly pass into the blood (5, 22). It has been found that brain extraction of water from the arterioles and then its return to the bloodstream in the venules is on the order of 600 L per day, compared with 500 mL per day produced from the choroid plexus. To absorb the choroid production, the brain would only have to increase water extraction by 0.1% (22). As venous pressure rises in NPH, the CSF production should rise from reduced water resorption at the capillaries and veins. The supratentorial CSF production rate, however, was not altered when healthy subjects were compared with NPH patients (38). The present study suggests the subependymal brain parenchyma adjacent to the ventricles is at a lower pressure (close to the venous sinus pressure) in NPH. The absorption of CSF in this region may balance the SSS production, which may explain why the CSF pressure does not rise. All forms of communicating hydrocephalus are associated with so-called transependymal CSF spread (39), and it has been noted that all forms of communicating hydrocephalus are associated with ventricular reflux of fluid (40). These findings, I believe, are evidence of the straight sinus territory's role in CSF resorption. Further study may show the only difference between NPH and other types of communicating hydrocephalus is the subependymal parenchyma's ability to cope with the added fluid load before the pressure must rise.
The Initiating Cause of NPH
It is known that despite the supratentorial brain producing a much larger pulsation as compared with the infratentorial brain, only approximately 40% of the volume of CSF displaced into the spinal canal relates to supratentorial brain expansion, whereas 60% relates to infratentorial brain expansion (11). This is an apparent paradox, with the much larger volume of brain producing a much smaller fluid flow. The supratentorial brain expansion must be accommodated by means other than CSF displacement. Compression of venous structures has been suggested as the mechanism of this dampening (11). Some degree of venous compression must occur in the normal brain in the SSS territory in systole, as this is the basis for the Starling resistor effect described previously. In fact, the entire arterial pulsation in the supratentorial region not accounted for in healthy subjects by venous compression or venous blood flow is estimated by the addition of the SSS and straight sinus NSPV, which, in this study, had a mean value of 335 μL. Greitz (22) measured the volume, leaving the incisura at 330 μL, which is a very close correlation. Thus, in healthy subjects, all the arterial pulsation can be accounted for by venous flow and the volume of CSF exiting the system. Therefore, a failure of craniospinal compliance to absorb vascular pulsations is put forward as the underlying pathophysiology of NPH. In 1997, Greitz et al (41), on the basis of previous studies measuring CSF flow in communicating hydrocephalus, put forward a theory that obstructive hydrocephalus is caused primarily by compression of the cortical veins and that communicating hydrocephalus is caused by any process that restricts arterial pulsation. Although arterial restriction by reduced subarachnoid space compliance was discussed, no account was taken of simultaneous venous compression. In fact, it was postulated that reduced venous counterpressure was associated with communicating hydrocephalus, and venoconstrictors were recommended as therapy. This theory failed to take into account the change in flow limiting resistor from arteriole to vein. If the arteriole remained the most significant resistor and the arterial walls were rendered rigid, no pulsatile flow would enter the cranial cavity and the pressures in the capillary bed would not rise. The large pressure drop across the arteriole would buffer the capillaries. The difference between the theory put forward by Greitz et al and that suggested by this study, then, is the universality of venous compression in all forms of hydrocephalus. From this point of view, NPH would better be termed venous compressive ischemic encephalopathy, as the pressures, although normal in the lumbar canal, are not normal in the veins.
The exact site of the initiating compliance failure is not defined by this study, but the compliance changes noted have a significant impact on the literature on this subject. The compliance failure may occur anywhere the delimiting membranes of the craniospinal cavity normally allow movement. The pacchionian granulations have long been implicated in many of the secondary forms of NPH. They are not present at birth and develop in infancy at the time of closure of the fontanels (42). Thus, they are not involved in CSF resorption in the first year of life and only appear as the subarachnoid compliance is reduced as a result of fontanel closure. Greitz et al (41) state that “the granulations probably serve as regulators of the pulse pressure taking over the function of the fontanels after the skull has entirely closed.” These thin-walled structures project directly into the venous sinuses (43) and undoubtedly pulsate in life. Their effect would be to bypass some of the compressive CSF pulsations directly into the SSS venous flow and thus reduce compression on the Starling resistor vessels (the veins of the subarachnoid space and the lateral lacunae). Any damage to the granulations by hemorrhage, infection, or fibrosis, then, would, by necessity, increase the compression of the Starling resistor vessels. This mechanism would be involved in those pathogeneses in which such granulation damage has been proved pathologically.
In regard to the cases in which no pathologic evidence of granulation damage exists, two observations are put forward. First, the reduction in spinal CSF flow in NPH previously described (22, 28) may be related to compliance changes in the spinal canal. The disks, ligamentum flava, and nerve sheaths are many times more compliant than the skull, and further study of the spinal canal is warranted. Second, any reduction in compliance anywhere is compounded by the high correlation of NPH with hypertension and arteriosclerosis (27), as these conditions stress the available compliance because of the high input pulse pressure. In a similar way, basilar arterial pulsation in basilar ectasia would be expected to stress the available compliance.
Diagnosis and Therapy
It has been stated that in all communicating hydrocephalus the objective of ventricular shunting is not to lower the mean pressure but rather to dampen the pulse pressure by providing additional capacitance to the ventricular system (44). In one study of patients with NPH after shunting, it appeared that the tube was not the main CSF pathway, indicating that resistance to CSF absorption had decreased after shunting and suggesting recovery of the physiological absorption pathway (45). This could conceivably occur through two mechanisms, either the direct effect of the added capacitance of the tube or a lowering of the mean CSF pressure below normal. Lowering the mean pressure would change the pressure on the veins and render them more compliant.
Finally, the question arises, “Would the measuring of compliance markers be a better indicator of NPH than, say, tap tests or aqueduct flow studies?” Certainly, the literature is divergent on the usefulness of CSF flow studies. Some researchers have found them very useful (3, 32, 46, 47) and others have found them of little value (48). Increased aqueduct flow has even been found equally in atrophy and NPH (49). To answer this diagnostic dilemma, I am undertaking an analysis of the patients with possible NPH who were excluded from the present study to see whether the degree of expected clinical recovery, based on clinical criteria, is related to compliance. Ultimately, only a prospective trial measuring clinical improvement with the available tests, including compliance tests, will answer this question.
Conclusion
Vascular compliance is decreased in patients with NPH relative to healthy subjects or those who have atrophy or arterial ischemia. After treatment, vascular compliance in NPH patients becomes more like that in patients with ischemia or atrophy rather than returning to normal. This suggests underlying changes that may not be reversible.
Acknowledgments
I thank C. Levi for his help in the statistical analysis.
References
- 1.Adams RD, Fisher CM, Hakim , et al. Symptomatic occult hydrocephalus with “normal” cerebrospinal pressure: a treatable syndrome. N Engl J Med 1965;273:117. [DOI] [PubMed] [Google Scholar]
- 2.Meyer JS, Tachibana H, Hardenberg MS, et al. Normal pressure hydrocephalus: influences on cerebral hemodynamic and cerebrospinal fluid pressure-chemical autoregulation. Surg Neurol 1984;21:195-203 [DOI] [PubMed] [Google Scholar]
- 3.Bradley WG, Scalzo D, Queralt J, et al. Normal pressure hydrocephalus: evaluation with cerebrospinal fluid flow measurements at MR imaging. Radiology 1996;198:523. [DOI] [PubMed] [Google Scholar]
- 4.Malm J, Kristensen B, Karlsson T, et al. The predictive value of cerebrospinal fluid dynamic tests in patients with the idiopathic adult hydrocephalus syndrome. Arch Neurol 1995;52:783-789 [DOI] [PubMed] [Google Scholar]
- 5.Okada K. Cerebrospinal fluid dynamics in the field of neurosurgery. Bull Tokyo Med Dent Univ 1979;26:213-214 [PubMed] [Google Scholar]
- 6.Matthew NT, Meyer JS, Hartmann A, Ott EO. Abnormal cerebrospinal fluid-blood flow dynamics. Arch Neurol 1975;32:657-664 [DOI] [PubMed] [Google Scholar]
- 7.Kristensen B, Malm J, Fagerland M, et al. Regional cerebral blood flow, white matter abnormalities, and cerebrospinal fluid hydrodynamics in patients with idiopathic adult hydrocephalus syndrome. J Neurol Neurosurg Psychiatry 1996;60:282-288 [DOI] [PMC free article] [PubMed] [Google Scholar]
- 8.Mase M, Yamada K, Banno T, et al. Quantitative Analysis of CSF flow dynamics using MRI in normal pressure hydrocephalus. Acta Neurochir Suppl (Wein) 1998;71:350-353 [DOI] [PubMed] [Google Scholar]
- 9.Pelc LR, Pelc NJ, Rayhill SC, et al. Arterial and venous blood flow: noninvasive quantification with MR imaging. Radiology 1992;185:808-812 [DOI] [PubMed] [Google Scholar]
- 10.Berne RM, Levy MN. Physiology.. 3rd ed. St Louis: Mosby; 1993 455-456
- 11.Enzmann DR, Pelc NJ. Cerebrospinal fluid flow measured by phase-contrast cine MR. AJNR Am J Neuroradiol 1993;14:1301-1307 [PMC free article] [PubMed] [Google Scholar]
- 12.Cordoso ER, Rowan JO, Galbraith S. Analysis of the cerebrospinal fluid pulse wave in intracranial pressure. J Neurosurg 1983;59:817-821 [DOI] [PubMed] [Google Scholar]
- 13.Best CH. Physiological Basis of Medical Practice.. 12th ed. Baltimore: Williams & Wilkins 1991;147
- 14.Furuta A, Ishii N, Nishihara Y, Horie A. Medullary arteries in aging and dementia. Stroke 1991;22:442-446 [DOI] [PubMed] [Google Scholar]
- 15.Savolainen S, Paljarvi L, Vapalahti M. Prevalence of Alzheimer's disease in patients investigated for presumed normal pressure hydrocephalus: a clinical and neuropathological study. Acta Neurochir (Wein) 1999;141:849-853 [DOI] [PubMed] [Google Scholar]
- 16.Jack CR, Mokri B, Laws ER, Houser OW, Baker HL, Peterson PC. MR findings in normal pressure hydrocephalus: significance and comparison with other forms of dementia. J Comput Assist Tomogr 1987;11:923-931 [DOI] [PubMed] [Google Scholar]
- 17.Nilsson F. Cerebral vasoconstriction as treatment of intracranial hypertension: aspects based on experimental investigations.. Malmo, Sweden: University Hospital; 1995. Thesis
- 18.Bergsneider M, Alwan AA, Falkson L, Rubenstein EH. The relationship of pulsatile cerebrospinal fluid flow to cerebral blood flow and intracranial pressure: a new model. Acta Neurochir Suppl (Wein) 1998;71:266-268 [DOI] [PubMed] [Google Scholar]
- 19.White DN, Wilson KC, Curry GR, Stevenson RJ. The limitation of pulsatile flow through the aqueduct of Sylvius as a cause of hydrocephalus. J Neurol Sci 1979;42:11-51 [DOI] [PubMed] [Google Scholar]
- 20.Dodd GD. Answer to question on parvus tardus. AJR Am J Roentgenol 1995;165:1299-1300 [DOI] [PubMed] [Google Scholar]
- 21.Mathew NT, Meyer JS, Hartmann A, Ott EO. Abnormal cerebrospinal fluid-blood flow dynamics. Arch Neurol 1975;32:657-664 [DOI] [PubMed] [Google Scholar]
- 22.Greitz D. Cerebrospinal fluid circulation and associated intracranial dynamics. Acta Radiol Suppl 1993;34:1-21 [PubMed] [Google Scholar]
- 23.Penar PL, Lakin WD, Yu J. Normal pressure hydrocephalus: an analysis of etiology and response to shunting based on mathematical modeling. Neurol Res 1995;17:83-88 [DOI] [PubMed] [Google Scholar]
- 24.Goh D, Minns RA, Pye SD, Steers AJ. Cerebral blood flow velocity changes after ventricular taps and ventriculoperitoneal shunting. Childs Nerv Syst 1991;7:452-457 [DOI] [PubMed] [Google Scholar]
- 25.Andeweg J. The anatomy of collateral venous flow from the brain and its value in etiological interpretation of intracranial pathology. Neuroradiology 1996;38:621-628 [DOI] [PubMed] [Google Scholar]
- 26.Portnoy HD, Branch C, Castro ME. The relationship of intracranial venous pressure to hydrocephalus. Childs Nerv Syst 1994;10:29-35 [DOI] [PubMed] [Google Scholar]
- 27.Krauss JK, Regel JP, Vach W, Droste DW, Borremans JJ, Mergner T. Vascular risk factors and arteriosclerotic disease in idiopathic normal pressure hydrocephalus of the elderly. Stroke 1996;27:24-29 [DOI] [PubMed] [Google Scholar]
- 28.Katayama S, Asari S, Ohmoto T. Quantitative measurement of normal and hydrocephalic cerebrospinal fluid flow using phase contrast cine MR imaging. Acta Med Okayama 1993;47:157-168 [DOI] [PubMed] [Google Scholar]
- 29.Kim MH, Shin KM, Song JH. Cine MRI CSF flow study in hydrocephalus: what are the valuable parameters? Acta Neurochir Suppl (Wein) 1998;71:343-346 [DOI] [PubMed] [Google Scholar]
- 30.Bradley WG, Whittemore A, Jinkins JR, et al. Cerebrospinal fluid flow patterns in hydrocephalus: correlation of clinical and phantom studies using MR imaging. Radiology 1987;79:165 [Google Scholar]
- 31.Castro ME, Portnoy HD, Maesaka J. Elevated cortical venous pressure in hydrocephalus. Neurosurgery 1991;29:232-238 [DOI] [PubMed] [Google Scholar]
- 32.Bradley WG, Whitemore AR, Kortman KE, et al. Marked cerebrospinal fluid void: indicator of successful shunt in patients with suspected normal pressure hydrocephalus. Radiology 1991;78:459. [DOI] [PubMed] [Google Scholar]
- 33.Ekstedt J, Friden H. CSF hydrodynamics for the study of the adult hydrocephalus syndrome. In: Shapiro K, Marmarou A, Portnoy H, eds. Hydrocephalus. New York: Raven 1984;
- 34.Hakim S, Vengas JG, Burton JD. The physics of the cranial cavity, hydrocephalus and normal pressure hydrocephalus: mechanical interpretation and mathematical model. Surg Neurol 1970;5:187. [PubMed] [Google Scholar]
- 35.Bunge RP, Settlage PH. Neurological lesions in cats following cerebrospinal fluid manipulation. J Neuropathol Exp Neurol 1957;16:471-491 [DOI] [PubMed] [Google Scholar]
- 36.Kitagaki H, Mori E, Kazunari, et al. CSF spaces in idiopathic normal pressure hydrocephalus: morphology and volumetry. AJNR Am J Neuroradiol 1998;19:1277-1284 [PMC free article] [PubMed] [Google Scholar]
- 37.Lorenzo AV, Page LK, Wattes GV. Relationship between cerebrospinal fluid formation, absorption and pressure in human hydrocephalus. Brain 1970;93:679. [DOI] [PubMed] [Google Scholar]
- 38.Gideon P, Stalhberg F, Thompsen C, et al. Cerebrospinal fluid flow and production in patients with normal pressure hydrocephalus studied by MRI. Neuroradiology 1994;36:210-215 [DOI] [PubMed] [Google Scholar]
- 39.Fishman RA. Brain edema. N Engl J Med 1975;293:706. [DOI] [PubMed] [Google Scholar]
- 40.Tator CH, Fleming JFR, Shepad RD, et al. A radioscopic test for communicating hydrocephalus. J Neurosurg 1968;28:327. [DOI] [PubMed] [Google Scholar]
- 41.Greitz D, Greitz T, Hindmarsh T. A new view on CSF circulation with potential for pharmacological treatment of childhood hydrocephalus. Acta Pediatr 1997;86:125-132 [DOI] [PubMed] [Google Scholar]
- 42.Le Gros Clarke WE. On the pacchionian bodies. J Anat 1920;55:40-48 [PMC free article] [PubMed] [Google Scholar]
- 43.Boles MA. Cerebrospinal fluid imaging. In: Henkin RE, Boles MA, Dillebay GL, et al, eds. Nuclear Medicine. St Louis: Mosby 1996:1314
- 44.Skylar FH, Lindler ML. The role of the pressure-volume relationship of brain elasticity in the mechanics and treatment of hydrocephalus. In: Shapiro K, Marmarou A, Portnoy H, eds. Hydrocephalus. New York: Raven 1984;
- 45.Hara M, Nakamura M, Kadowaki C, et al. Cerebrospinal fluid absorption mechanism based on measurement of CSF flow rate in shunt tube. No To Shinkei 1985;37:365-370 [PubMed] [Google Scholar]
- 46.Goldmann A, Kunz U, Rotermund G, Friedrich JM, Schnarkowski P. Magnetic resonance tomography imaging of pulsatile CSF movement in communicating hydrocephalus before and after shunt placement. Rofo Forschr Geb Rontgenstr Neuen Bildgeb Verfahr 1992;157:555-560 [DOI] [PubMed] [Google Scholar]
- 47.Bowen B. The MR appearance of CSF flow in patients with ventriculomegaly. AJNR Am J Neuroradiol 1987;18:193. [DOI] [PubMed] [Google Scholar]
- 48.Hakim R, Black PM. Correlation between lumbo-ventricular perfusion and MRI-CSF flow studies in idiopathic normal pressure hydrocephalus. Surg Neurol 1998;49:14-19 [DOI] [PubMed] [Google Scholar]
- 49.Krauss JK, Regel JP, Vach W, Jungling FD, Droste DW, Wakhloo AK. Flow void of cerebrospinal fluid in idiopathic normal pressure hydrocephalus of the elderly: can it predict outcome after shunting? Neurosurgery 1997;40:67-73 [DOI] [PubMed] [Google Scholar]