Abstract
BACKGROUND AND PURPOSE: CT is a frequent examination that is performed using ionizing radiation. We sought to assess image-quality changes on CT scans of the head when the radiation dose is reduced by changing tube current and kilovoltage.
METHODS: A formalin-fixed cadaver was examined in conventional and helical mode by use of two CT-scanners. Surface dose was measured with standard scanning parameters, and after reduction of tube current and kilovoltage. Five experienced examiners independently evaluated subjective image quality.
RESULTS: In the conventional mode, the highest surface dose was 83.2 mGy (scanner 1: helical mode, 55.6 mGy), and 66.0 mGy (scanner 2: helical mode, 55.9 mGy). By changing kVp and mAs, a dose reduction of up to 75% (scanner 1), and 60% (scanner 2) was achieved. No observable differences in image quality between scans obtained with doses from 100% to 60% of standard settings were noted. Ten of 20 images obtained with the highest dose and 13 of 20 images obtained with lowest dose (19–29.4 mGy) were reliably identified by subjective quality assessment. Scans produced with a surface dose of less than 30 mGy were judged uninterpretable.
CONCLUSION: Standard parameters used in cranial CT are oriented toward best image quality. A dose reduction up to 40% may be possible without loss of diagnostic image quality.
In Germany, CT contributes one third to the collective radiation dose given for medical purposes, although it represents only 2% to 5% of all radiologic examinations (1, 2). Thirty-five percent of these examinations comprise CT of the head, with a mean effective dose of 1 mSv to 5 mSv (3, 4). When examinations are repeated after administration of contrast material, the usual skin entrance dose between 10 mGy and 50 mGy will be doubled (5–9). The advent of helical scanning with rapid acquisition times and new diagnostic fields (eg, CT angiography) will lead to a further increase in CT examinations.
Patients examined or treated for complex or chronic disease (eg, malformation, tumors, trauma, and vascular disease) often undergo multiple CT studies. This applies, for instance, to children with malfunctioning ventricular shunts in hydrocephalus. Although initial examinations are oriented toward identification of subtle changes of intracerebral structures, the main purpose of control studies is to identify complications and gross morphologic changes. As this often involves structures with relatively high contrast-enhancing features (eg, bleeding or ventricular size), an alteration of “standard” scan settings seems possible.
Previous work concentrating on dose reduction showed that in high-contrast imaging (eg, imaging of lung or bone), low-dose examinations did not result in a loss of diagnostic information. (10–13). It remains unclear if a dose reduction may be feasible in view of the low contrast of intracranial structures.
Therefore, this study was undertaken in order to evaluate the possibility of a reduction in radiation dose delivered during cranial CT in the conventional and helical mode. Systematic changes of scanning parameters were analyzed with respect to resulting image quality.
Methods
Phantom
A human cadaver specimen served as phantom (head and neck), which was formalin-fixed for more than 3 months.
CT Scanners
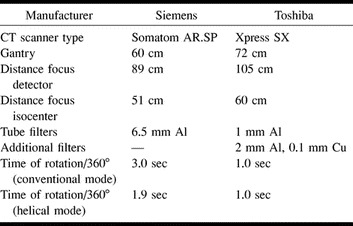
Two CT scanners were used to perform CT examinations in conventional and helical mode: (Xpress SX; Toshiba Medical Systems, Japan/Somatom AR.SP; Siemens Medizingerätetechnik, Germany). Technical data are listed in detail in Table 1. Apart from the geometry, the scanners differ in their filter systems. Furthermore, the Toshiba CT is a 1-second scanner, whereas the Siemens CT needs 3 seconds in conventional and 1.9 seconds in helical scanning per rotation.
TABLE 1:
Technical data of CT sanner
Dosimeters
Lithium-fluoride-thermoluminescent dosimeters (LiF-TLD; 3.2*3.2*0.9 mm) were used to measure the skin entrance dose at the tuber frontale, the eye lenses, and the thyroid gland, respectively. Within 24 hours after exposure, the LiF-TLD were read out by use of an automatic detector system type (Filtrol 2000 D; Harshaw, Cleveland, USA). As accuracy ranges of LiF-TLD lie between 5% and 10%, reliability of measurements was improved by using three dosimeters per location and performing each study protocol twice. Surface entrance doses were defined and calculated as a mean of the resulting data.
Protocols
After acquiring a digital projection radiograph (topogram, scout) the scan volume was manually defined with a gantry angulation, according to the supraorbitomeatal line. First, a standard CT examination of the head was performed. For the Toshiba scanner, the parameters were 135 kVp, 270 mA (conventional), and 120 kVp, 185 mA (helical); for the Siemens scanner, the parameters were 130 kVp, 105 mA (conventional) and 130 kVp, 83 mA (helical). Helical reconstruction mode was set to “slim” (180° reconstruction algorithm). Generally, slice thickness was chosen according to routine procedures so that, in conventional scanning, it was set at 3 mm for the skull base, 5 mm at the petrous bone, 7 mm supratentorially (Toshiba CT), and 5 mm for the entire examination for the Siemens scanner. For the Toshiba scanner, this was changed to a 2-mm slice thickness (skull base, petrous bone) and a 7-mm slice thickness supratentorially during helical scanning. For details on scanning protocols, see Tables 2 and 3.
TABLE 1:
TABLE 2A: Scan parameter, skin entrance dose, and image noise of cerebellar and supratentorial parenchyma (conventional mode, Xpress SX)

Second, tube current and voltage were reduced both in the conventional and helical mode. In the conventional mode, scanning parameters were reduced stepwise to 120 kVp, 100 mA (Toshiba), and 110 kVp, 63 mA (Siemens). In the helical mode, parameters were decreased to the lowest kVp and mA setting possible, which in the case of the Toshiba scanner was the CT fluoroscopy setting (80 kVp, 50 mA). For the Siemens scanner, settings were 110 kVp, 63 mA.
Owing to the limited heating capacity of the tube, pitch factor had to be increased twofold when using the Siemens scanner, with higher kVp and mAs settings (see Table 3B) in order to scan the entire phantom. Consequently, protocols were performed with a slice thickness of 5 mm and a table movement of 10 mm. One protocol was done with 3-mm slice thickness and a 6-mm table movement (skull base, petrous bone), and a 5-mm slice thickness and 10-mm table movement supratentorially.
TABLE 1:
TABLE 3A: Scan parameter, skin entrance dose, and image noise of cerebellar and supratentorial parenchyma (helical mode, Xpress SX)

The resulting 13 protocols per scanner (six conventional, seven helical) were documented as hardcopy film with comparable window widths (WW) (WW:200 HU at the skull base, 100 HU at the posterior fossa/frontobasis, 85 HU supratentorially; window level [WL]:35 HU; and magnification factor).
Quality Assessment
Primarily, the resulting films were ranked and numbered according to falling surface dose measured at the tuber frontale. This ranking order was defined as our standard of reference. Presuming that higher radiation dose results in better image quality, a detectable image quality degradation was expected in scans obtained with a reduced surface dose.
The scans were reviewed in four groups: for each scanner type and scanning mode separately (Toshiba: conventional and helical; Siemens: conventional and helical). Films were named by randomly assigned letters and presented in a masked fashion so that the reviewers were blinded to technical data or surface dose. Five examiners with several years' experience in CT of the brain (two radiologists [M.C., U.M.], two neuroradiologists [H.F., E.L.], and one neurosurgeon [J.H.]) were asked to list all films according to subjective image quality, with the film considered to be of best subjective image quality numbered 1, and the scans with the worst quality numbered 6 or 7, respectively. Quality differences between examinations (helical or conventional) obtained from the same scanner had to be assessed semiquantitatively: no difference, just detectable, and important quality difference. Thus, images obtained with the highest dose and the ones with the lowest dose had to be identified by quality, and the examiners had to comment on unacceptable image quality.
In total, 20 subjective rankings (four modes, five examiners) were compared with the standard-of-reference ranking order generated by falling surface dose. Statistical analysis was performed using the Wilcoxon signed rank test with a significance level of P ≤ .05.
Image Noise
Regions of interest were placed bilaterally in the cerebellar parenchyma (“posterior fossa”) as well as in the periventricular white matter (“centrum semiovale”), with a mean area of 2.5 cm2 ± 0.2. The attenuation values calculated by the implemented CT software were used to evaluate image noise.
Results
Dose Measurements
The maximal skin entrance dose depended on the scan mode. At the tuber frontale, a surface dose of 83.2 mGy (Toshiba Xpress SX), and 66.0 mGy (Siemens Somatom AR.SP) was found for standard parameters in conventional scanning. Surface dose in standard helical scanning was 55.6 mGy (Toshiba scanner) and 55.9 mGy (Siemens scanner).
As the tuber frontale was exposed by the primary beam in all examinations, the measurements on this region of the forehead were used to compare the different protocols. The other organs were positioned at the border of the field of interest (eye lenses) or definitely outside with scatter exposure only (thyroid gland). At the thyroid gland, between 0.9 and 1.3 mGy were found. The skin entrance dose at the eye lenses tended to be lower than the values at the tuber frontale apart from protocol “K” (conventional mode, Siemens Somatom AR.SP), where the observed difference was within the accuracy range of LiF-TLD. Detailed information on dose values in all tested protocols are displayed in Tables 2 and 3.
The stepwise reduction of kilovoltage and milliamperage resulted in a gradual decrease of the skin entrance dose at the tuber frontale. Single analysis of kVp reduction reveals that, in conventional scanning, the maximal dose can be decreased by a mean of 15.5 mGy per 15 kVp (25%, Toshiba) and 16.3 mGy per 20 kVp (28%, Siemens), respectively. In helical CT, the mean values are 14.1 mGy per 20 kVp (33%, Toshiba) and 19 mGy per 20 kVp (40%, Siemens).
The effect of altering milliamperage similarly led to a decrease in surface dose in conventional CT between 9.7 mGy per 70 mAs (17.4%), and 28 mGy per 100 mAs (47.7%, Toshiba). For the Siemens scanner, 7.3 mGy per 66 mAs (11.1%), and 13.3 mGy per 60 mAs (31.1%) were found.
In total, the alteration of scanning parameters resulted in a decrease of the skin entrance dose at the tuber frontale in conventional CT by 58.6 mGy (70.4%, Toshiba) and 36.4 mGy (55.5%, Siemens). In helical CT, a dose reduction of 36.6 mGy (63.8%, Toshiba) and 36.5 mGy (65.3%, Siemens) was achieved.
Quality Assessment
The subjective semiquantitative rating according to image quality was incongruent to the ranking according to falling surface dose. Only one of 20 subjective ratings reflected this dose-related order. In general, films obtained with 100% to 60% of the initial dose could not be reliably identified by subjective assessment of image quality. Ten (50%) of the 20 images produced with maximal skin entrance dose were correctly named, whereas 13 of 20 images obtained with the lowest entrance dose were identified (65%). One examiner identified the minimal dose scans in all four cases, and two examiners identified the minimal dose scans in three of four cases.
Analysis of the most prominent dose reduction per group (M to V [24.5 mGy], Toshiba conventional; G to O [9.5 mGy], Siemens conventional; P to U [11.4 mGy], Toshiba helical; T to A [19.2 mGy], Siemens helical) showed that a clear quality difference with a better subjective image quality of the higher dose image was seen in one of 20 cases, whereas in 10 films, only a marginally better image quality was noted for the images produced by higher dose. Other judgements (no quality difference, images obtained with lower dose judged as better quality) were made in 40% (eight of 20).
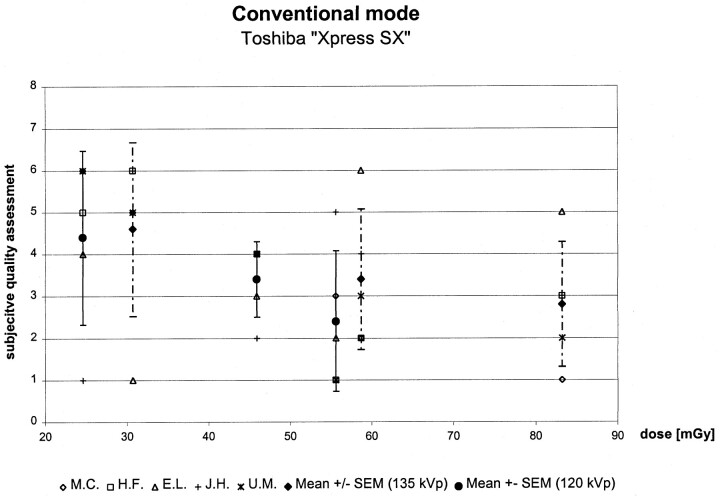
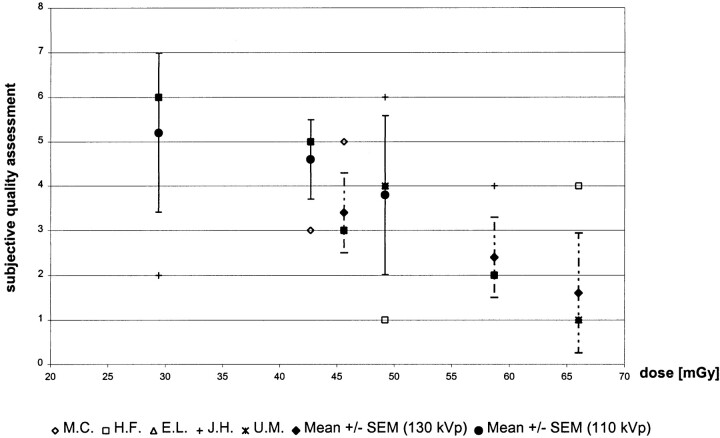
The statistical analysis of the subjective assessment of image quality in relation to surface dose revealed that, in conventional scanning with the Siemens scanner, a significant quality difference could only be observed between images produced by the two highest doses in contrast to the images produced by the two lowest surface doses. Conventional scanning with the Toshiba scanner did not show a significant difference in subjective quality dependent ranking when compared with surface dose (Figs 1 and 2).
fig 1.
Subjective quality assessment (grade 1–6) plotted against surface dose (mGy) used in conventional scanning with the Toshiba Xpress SX, showing an inverse linear relationship. Dotted lines represent the standard error of the mean in scans with 135 kVp, full lines in scans with 120 kVp
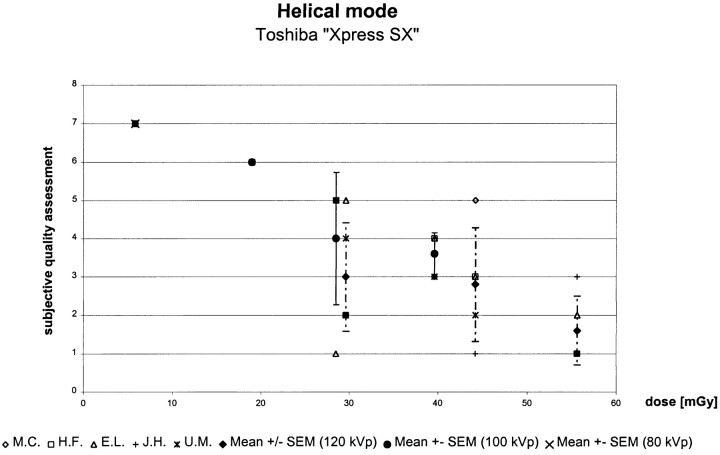
For helical scans, findings were dependent both on changing tube current and kilovoltage. Films with constant 120 kVp obtained from the Toshiba Xpress SX scanner (scans P, U, and R) did not show a significant difference in subjective quality assessment in relation to surface dose. Among the scans with 80 or 100 kVp, a significant subjective quality difference was found when comparing scans Q and N to C and I, respectively. C and I were unanimously characterized as not suitable for routine purposes and reliably identified as lowest-dose images. Comparing the different levels of kilovoltage, subjective image quality of scans P, U, and R (120 kVp) was significantly better than that of scans C and I (100 kVp). With the exception of scans P and Q, no quality difference was observed between scans P, U, R, Q, and N. The difference in subjective assessment between scans P and Q (P = .042) represents a dose reduction of 26 mGy or 28.8% (Fig 3).
fig 3.
Subjective quality assessment (grade 1–7) plotted against surface dose (mGy) used in helical scanning with the Toshiba Xpress SX. Dotted lines represent standard error of the mean of scans with 120 kVp, full lines of scans with 100 kVp. The 80 kVp scan was unanimously rated as a 7
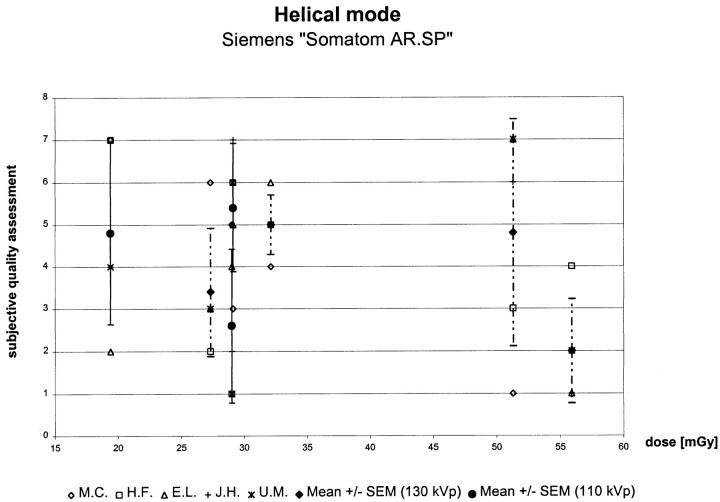
Helical scans (B, T, A, and X) obtained with the Siemens Somatom AR.SP scanner did not show a significant quality difference expressed by subjective quality assessment apart from scans B and A. They represent a dose difference of 23.8 mGy (42.6%). Furthermore, scan A was performed with a pitch of 2, so that a broader section-sensitivity profile may be the reason for this finding. No difference was found among scans with a lower kVP (W, J, and F). When comparing scans performed with 130 kVp and 110 kVp, a significant difference in subjective quality assessment could be demonstrated between B and W as well as B and F, respectively. Detailed analysis revealed in scans with the same pitch (p = 1) and lower mAs (B vs F) a dose reduction of 36.5 mGy (65.3%), whereas with an increase in pitch (p = 2) and comparable mAs (B vs. W), a dose reduction of 26.8 mGy (47.9%) was reached (Fig 4).
fig 4.
Subjective quality assessment (grade 1–7) plotted against surface dose (mGy) used in helical scanning with the Siemens Somatom AR.SP. Dotted lines represent the standard error of the mean of scans with 130 kVp, full lines of scans with 110 kVp
Images obtained from both scanners with less than 30 mGy skin entrance doses were judged unsuitable for diagnostic purposes (scans D, C, I, F).
Image Noise
Image noise was inversely related to surface dose. CT software determined image noise to be between 4.5 HU and 9.9 HU with the Siemens CT scanner, and 3.4 HU and 35.5 HU with the Toshiba CT scanner. Results are listed in detail in Tables 2 and 3. For both scanners, image noise in the cerebellar parenchyma (“posterior fossa”) was significantly higher than in the centrum semiovale (P ≤ .05). Compared with the Siemens scanner, image noise was higher on conventional scans obtained by the Toshiba Xpress SX scanner. For helical scans, no significant difference in measured image noise between the two CT scanners could be found.
Regarding surface dose and image noise, an inverse linear relationship was noted. A dose reduction of 10 mGy led to an average increase of image noise of 0.5 HU to 1.8 HU, yielding a correlation coefficient (r²) between 0.62 and 0.97.
The subjective assessment of image quality and noise showed a direct linear correlation. This became particularly evident when reviewing images obtained by conventional mode with the Siemens CT scanner and on images obtained by helical mode with the Toshiba Xpress SX. Conventional CT scans considered to be adequate for diagnostic purposes did not reveal more than 6 HU of noise at the height of the centrum semiovale or 11 HU at the height of the posterior fossa (Tables 2 and 3).
Discussion
The frequency of CT examinations, and its concomitant radiation dosing, is steadily increasing since its advent 25 years ago. Our results show that in new fourth-generation helical scanners, surface doses used in earlier studies are still in use (7, 9, 14–16). With conventional CT, we found a surface dose of 66 mGy to 83 mGy caused by direct exposure of the primary beam. A tendency toward lower doses (56 mGy) was seen in helical scanning because of different preset scan settings with lower milliamperage and kilovoltage.
In general, helical CT with a pitch factor of 1 does not reduce radiation dose (17, 18). Owing to the limited heating capacity of X-ray tubes, lower scan parameters are often chosen for helical CT. These data are consistent with findings from other studies (7, 8, 14, 19). The doses described herein are well below any critical threshold for cataract formation, as this occurs after a single dose of 2 Gy or more. Slight lens calcifications were observed after irradiation with 0.5 Gy (6, 20). Even repeated examinations do not reach critical dose values in this respect.
A threshold for the development of thyroid malignancies, however, is not known, and therefore any radiation exposure may be hazardous. In the present study, surface doses of 0.9 to 1.3 mGy were found, which correspond to an effective dose of approximately 0.06 mSv when multiplied with the weighted conversion factor 0.05 (ICRP 60), confirming results of earlier studies (7).
The radiation exposure to the bone marrow in the skull may be important, which is believed to represent 5% to 10% of the total marrow in adults (8, 21). Thus, an approximate effective dose of 0.1 mSv may be applied during “standard” cranial CT. In children, CT of the brain results in a possible effective dose of up to 0.4 mSv to the calvarium, in which 25% to 30% of the bone marrow is localized (22). Because multiple scans may be performed in pediatric patients, (eg, shunt and ventricle size control), emphasis should be placed on radiation protection and lowering exposure when possible.
In this context, the exemption of risk organs from primary beam exposure has to be emphasized. The surface doses at the eye lenses are sometimes comparable to the doses measured at the tuber frontale, but may be four times lower. This can be attributed to the fact that the scan plane was positioned manually according to the supraorbitomeatal line by help of a digital projection radiograph. If gantry angulation is carefully chosen in a way that the orbit is spared from primary beam exposure, a dose reduction of up to 75% is achievable without any loss of information. Previous experience reveals that dose may be reduced by a factor of 5 to 10 when the scan volume is properly positioned (9, 23, 24).
Alteration of kilovoltage and milliamperage represents a different way to reduce radiation exposure. Our data show that a maximal dose reduction up to 70% in conventional scanning and 65% in helical CT may be achievable. As there is a direct relation between image noise and photon flux, dose reduction by lowering kVp and mAs may lead to a degradation of image quality (18). The higher the radiation exposure, the more photons are detected by the CT system, and the lower the image noise will be (19, 25). Image noise, geometrically or software-related (eg, reconstruction algorithms) characteristics of a CT scanner and individual patient factors (eg, skull thickness) influence contrast resolution. With cranial CT, relatively low-contrast tissues are to be visualized. Because there is no established objective method to quantify diagnostic image quality, the present study had to rely on a semiquantitative subjective assessment of image quality by five examiners experienced in CT scanning of the brain.
In earlier studies working on low contrast resolution, only a slight correlation could be found between reduced dose and a recognition of high-quality image criteria (26). In high-contrast imaging (eg, imaging of the lung or bones), a relevant loss of information does not occur even if dose is reduced by 50% or more (10–13). In addition, detection of mediastinal abnormalities was not impaired (11). On the other hand, streak artifacts due to beam hardening at the border of high-contrast structures became more prominent on low-dose images. Although this rarely affects the diagnostic value of a scan (13), artifacts play an important role in scanning of the posterior fossa.
Analysis by CT software showed that, in both scanners, image noise was significantly higher in the cerebellar parenchyma (“posterior fossa”) than at the centrum semiovale, suggesting the influence of beam hardening due to the petrous and facial bones. Image noise tended to be higher in helical scanning, taking into account the different ways of image reconstruction from raw data as well as the lower dose applied in helical CT. Particularly, lowering tube current led to an increase in image noise so that higher kVp should be recommended for scanning the skull base to minimize beam hardening. Despite comparable surface doses that were applied, the reason for higher image noise on conventional scans obtained from the Toshiba as compared with that from the Siemens scanner remains unclear. This phenomenon may be attributed to inherent hardware components.
Minimal tube current and kilovoltage will be necessary to produce diagnostic images. In our study, images obtained with less than 30 mGy surface dose in the area of the primary beam were unanimously considered inadequate in diagnostic quality. Interestingly, a significant difference in subjective image quality between scans obtained with 100% to 60% of the maximal surface was not found. As more minimal- than maximal-dose scans were correctly identified (13/20 vs 10/20) low-dose scans may be easier to identify owing to increasingly grainy images.
Although higher dose means less image noise on CT scans, previous studies did not show a significant improvement of image quality with high-dose CT (26). The present study confirms this finding. Subjective quality assessment of CT scans generated by high-dose technique was not significantly different from that of films generated with doses as low as 60% of the maximal surface dose.
In accordance with other data (11), our study implies a nearly linear inverse relation between surface dose and image noise. A dose reduction of 10 mGy leads to an average increase of image noise by 0.5 HU to 1.8 HU. Conventional CT did not show more than 6 HU noise at the centrum semiovale and 11 HU at the posterior fossa on images obtained by both scanners considered to be of diagnostic quality. Previous studies assumed 10 HU as the threshold for image noise sufficient for diagnostic purposes of CT (10). Obviously, this cannot be generalized, because noise not only depends on anatomic region, but on inherent technical details of the scanner and the chosen parameter settings.
A limitation of our study is the use of a human anatomic phantom. After preparation and formalin fixation, X-ray attenuation and morphologic structure are different from that of normal human tissue. Assessing image quality in the context of a cadaver cannot be compared with a clinical diagnostic situation. However, in the context of repetitive scanning, a phantom experiment was mandatory. As relative image quality and its dependance on surface dose reduction had to be assessed, the described method seemed appropriate. Nevertheless, further studies will be necessary to evaluate how much radiation doses can be reduced and how these new parameters may be applied in a clinical context. We suggest that such a reduction will most likely be feasible where multiple control CT scans are required.
Conclusion
Scan parameters of “standard” examination protocols in cranial CT implemented by manufacturers are oriented toward attaining best image quality in order to meet the highest diagnostic criteria. The parameter settings are chosen under aspects of radiation protection as well as physical tube limitations. Nevertheless, considerable dose reduction without loss of relevant information or image quality can be achieved in situations in which relatively high contrast-enhancing pathologic characteristics are suspected (eg, postoperative bleeding, ventricle size in shunt control). Our study suggests that surface dose in standard scanning may be reduced by up to 40% by changing kilovoltage and milliamperage. Knowledge of the radiation dose applied in one´s own institution and individual adaptation of scan parameters by the examiner may contribute substantially to radiation protection according to the ALARA (as low as reasonably achievable) principle.
TABLE 1:
TABLE 2B: Scan parameter, skin entrance dose, and image noise of cerebellar and supratentorial parenchyma (conventional mode, somatom AR.SP)

TABLE 1:
TABLE 3B: Scan parameter, skin entrance dose, and image noise of cerebellar and supratentorial parenchyma (Helical mode, Somatom AR.SP)

fig 2.
Subjective quality assessment (grade 1–6) plotted against surface dose (mGy) used in conventional scanning with the Siemens Somatom AR.SP, showing an inverse linear relationship. Dotted lines represent the standard error of the mean in scans with 130 kVp, full lines in scans with 110 kVp
Footnotes
Address reprint requests to Dr. med. M. Cohnen, Institute of Diagnostic Radiology, Heinrich-Heine-University, Moorenstr. 5, D-40225 Düsseldorf Germany.
References
- 1.Kaul A, Bauer B, Bernhardt J, Nosske D, Veit R. Effective doses to members of the public from the diagnostic application of ionizing radiation in Germany. Eur Radiol 1997;7:1127-1132 [DOI] [PubMed] [Google Scholar]
- 2.Seifert H, Hagen Th, Bartylla K, Blass G, Piepgras U. Patient doses from standard and spiral CT of the head using a fast twin beam system. B J Radiol 1997;70:1139-1145 [DOI] [PubMed] [Google Scholar]
- 3.van Unnik J, Broerse JJ, Geleijns J, Jansen JT, Zoetelief J, Zweers D. Survey of CT techniques and absorbed dose in various Dutch hospitals. Br J Radiol 1997;70:367-371 [DOI] [PubMed] [Google Scholar]
- 4.Wade JP, Weyman JC, Goldstone KE. CT standard protocols are of limited value in assessing actual patient dose. Br J Radiol 1997;70:1146-1151 [DOI] [PubMed] [Google Scholar]
- 5.Maclennan AC. Radiation dose to the lens from CT brain scans in general radiology departments [letter; comment]. Br J Radiol 1995;68:219-220 [DOI] [PubMed] [Google Scholar]
- 6.Moulin G, Chagnaud C, Waultier S, et al. Radiation dose to the lenses in CT of the paranasal sinuses. Neuroradiology 1996;38:Suppl 1:S127-S129 [DOI] [PubMed] [Google Scholar]
- 7.Conway BJ, McCrohan JL, Antonsen RG, Rueter FG, Slayton RJ, Suleiman OH. Average radiation dose in standard CT examinations of the Head: results of the 1990 NEXT Survey. Radiology 1992;184:135-140 [DOI] [PubMed] [Google Scholar]
- 8.Langkowski JH, Pogoda P, Hess A. Radiation-exposure studies of CT diagnosis with the standard and spiral technics. Fortschr Röntgenstr 1994;161:3-11 [DOI] [PubMed] [Google Scholar]
- 9.Smith A, Shah GA, Kron T. Variation of patient dose in head CT. Br J Radiol 1998;71:1296-1301 [DOI] [PubMed] [Google Scholar]
- 10.Haaga JR, Miraldi F, MacIntyre W, LiPuma JP, Bryan PJ, Wiesen E. Effect of mAs variation upon computed tomography image quality as evaluated by in vivo and in vitro studies. Radiology 1981;138:449-454 [DOI] [PubMed] [Google Scholar]
- 11.Mayo JR, Hartman TE, Lee KS, Primack SL, Vedal S, Muller NL. CT of the chest: minimal tube current required for good image quality with the least radiation dose. AJR.Am J Roentgenol 1995;164:603-607 [DOI] [PubMed] [Google Scholar]
- 12.Naidich DP, Marshall CH, Gribbin C, Arams RS, McCauley DI. Low-dose CT of the lungs: preliminary observations. Radiology 1990;175:729-731 [DOI] [PubMed] [Google Scholar]
- 13.Zwirewich CV, Mayo JR, Müller NL. Low-dose high-resolution CT of lung parenchyma. Radiology 1991;180:413-417 [DOI] [PubMed] [Google Scholar]
- 14.Maclennan AC, Hadley DM. Radiation dose to the lens from computed tomography scanning in a neuroradiology department [see comments]. Br J Radiol 1995;68:19-22 [DOI] [PubMed] [Google Scholar]
- 15.McCrohan JL, Patterson JF, Gagne RM, Goldstein HA. Average radiation doses in a standard head examination for 250 CT Systems. Radiology 1987;163:263-268 [DOI] [PubMed] [Google Scholar]
- 16.Gollnast HK, Vogel H. Radiation exposure in computed tomography. Aktuelle Radiol 1993;3:20-23 [PubMed] [Google Scholar]
- 17.Verdun FR, Meuli RA, Bochud FO, et al. Image quality and dose in spiral computed tomography. Eur Radiol 1996;6:485-488 [DOI] [PubMed] [Google Scholar]
- 18.Wang G, Vannier MW. Low-contrast resolution in volumetric X-ray CT analytical comparison between conventional and spiral CT. Med Phys 1997;24:373-376 [DOI] [PubMed] [Google Scholar]
- 19.Rothenberg LN, Pentlow KS. Radiation dose in CT. Radiographics 1992;12:1225-1243 [DOI] [PubMed] [Google Scholar]
- 20.Henk JM, Whitelocke RA, Warrington AP, Bessell EM. Radiation dose to the lens and cataract formation. Int J Radiat Oncol Biol Phys 1993;25:815-820 [DOI] [PubMed] [Google Scholar]
- 21.Nishizawa K, Maruyama T, Takayama M, Okada M, Hachiya J, Furuya Y. Determinations of organ doses and effective dose equivalents from computed tomographic examination. Br J Radiol 1991;64:20-28 [DOI] [PubMed] [Google Scholar]
- 22.Cristy M. Active bone marrow distribution as a function of age in humans. Phys Med Biol 1981;26:389-400 [DOI] [PubMed] [Google Scholar]
- 23.Yeoman LJ, Howarth L, Britten A, Cotterill A, Adam EJ. Gantry angulation in brain CT: dosage implications, effect on posterior fossa artifacts and current international practice. Radiology 1992;184:113-116 [DOI] [PubMed] [Google Scholar]
- 24.Cohnen M, Cohnen B, Ewen K, Teubert G, Mödder U. Dosage measurements in spiral CT examinations of the head and neck region. Fortschr Röntgenstr 1998;168:474-479 [DOI] [PubMed] [Google Scholar]
- 25.Mayo JR, Whittall KP, Leung AN, et al. Simulated dose reduction in conventional chest CT: validation study. Radiology 1997;202:453-457 [DOI] [PubMed] [Google Scholar]
- 26.Jurik AG, Jessen KA, Hansen J. Image quality and dose in computed tomography. Eur Radiol 1997;7:77-81 [DOI] [PubMed] [Google Scholar]


