

Abstract
BACKGROUND AND PURPOSE: Independent component analysis (ICA), unlike other methods for processing functional MR (fMR) imaging data, requires no a priori assumptions about the hemodynamic response to the task. The purpose of this study was to analyze the temporal characteristics and the spatial mapping of the independent components identified by ICA when the subject performs a finger-tapping task.
METHODS: Ten healthy subjects performed variations of the finger-tapping task conventionally used to map the sensorimotor cortex. The scan data were processed with ICA, and the temporal configuration of the components and their spatial localizations were studied. The locations with activation were tabulated and compared with locations known to be involved in the organization of motor functions in the brain.
RESULTS: Components were identified that correlated to varying degrees with the conventional boxcar reference function. One or more of these components mapped to the sensorimotor cortex, supplementary motor area (SMA), putamen, and thalamus. By means of ICA components, sensorimotor cortex, supplementary motor area, and superior cerebellar activation were identified bilaterally in 100% of the subjects; thalamus activation was contralateral to the active hand in 80%; and putamen activation was contralateral to the active hand in 60%.
CONCLUSION: ICA processing of multislice fMR imaging data acquired during finger tapping identifies the sensorimotor cortex, SMA, cerebellar, putamen, and thalamic activation. ICA appears to be a method that provides information on both the temporal and spatial characteristics of activation. Multiple task-related components can be identified by ICA, and specific activation maps can be derived from each separate component.
Functional MR (fMR) imaging activation is identified regularly within the sensorimotor cortex and supplementary motor area (SMA) by means of finger-tapping paradigms that employ repeated on-off task cycles (1–3). Analysis is conventionally performed by cross-correlation to a boxcar reference function that represents the expected hemodynamic response (4). The boxcar function is typically configured such that it has a unit magnitude throughout the performance of the task and zero amplitude during the periods of rest. The sensorimotor cortex is consistently identified when the reference function models a hemodynamic response sustained throughout the task. Other areas in the brain known to participate in motor functions can be identified when the reference function is modified. For example, activation can be identified in the putamen when the reference function models a hemodynamic response of short duration (5). The amount and location of activation detected by means of conventional cross-correlation methods depends significantly on the reference function chosen.
Independent component analysis (ICA) is a blind source–separation method applied recently to fMR imaging data (6–8). The method derives statistically independent components that collectively estimate the observed changes of signal intensities within the data set. It does not require a reference function. In principle, it identifies the hemodynamic responses within the data, regardless of their interval, duration, or magnitude. Therefore, we attempted to apply ICA to whole-brain fMR imaging data sets acquired during the performance of finger tapping, and to compare the activation patterns identified by ICA with those observed conventionally by correlation with reference functions.
Methods
Ten right-handed volunteers with no history of neurologic disease were recruited, and informed consent was obtained. Functional imaging was performed on a 1.5-T Signa Horizon scanner (GE, Milwaukee, WI) equipped with fast gradients for multislice echo-planar imaging sequences. A prototype, high-resolution quadrature radio-frequency head coil was used. Standard spin-echo and gradient-echo 3D volume anatomic images were acquired. For fMR imaging data, 18 slices were obtained in the coronal plane with the following technical parameters: single-shot echo-planar pulse sequence (2000/40 [TR/TE]); 64 × 64 matrix; 24 cm field of view; flip angle, 90°; and 7-mm slice thickness with 2-mm gap. Prior to the fMR scan, shimming was optimized with an automated gradient–shim sequence on a manually selected 3D brain-volume region of interest.
Eight of the volunteers performed an alternating hand- and finger-tapping task, of four regular 20-second cycles, which has been described previously (5). The other two volunteers performed an alternating hand- and finger-tapping task with asymmetrically timed cycles of finger tapping for right, left, both hands, and rest periods. During this version of the task, the duration of finger tapping epochs within each cycle was randomly varied between 16 to 24 seconds (8–12 TRs), with four cycles each of either right-, left-, or both-hand(s) activation. This asymmetrical task paradigm was implemented as a test of the derivative sensitivity of ICA to varying task components.
Echo-planar imaging raw data were filtered in the spatial frequency domain by use of a Hamming low-pass filter to increase the signal-to-noise ratio (9), then reconstructed into individual slice-location time courses. For the fMR images, signal intensity was plotted as a function of time for each voxel and a three-point Hanning filter was applied for temporal smoothing of the signal. Signal intensities in each image were time corrected by a shift of the smoothing filter corresponding to the temporal offset within the 2-second TR. A minimum signal threshold was applied to exclude voxels outside the brain. To minimize pulsation effects from CSF, all voxels with signal intensities exceeding the average of brain tissue by 2 standard deviations in the first image of the echo-planar series were excluded from further analysis. A signal-to-noise map was obtained of the remaining voxels, and voxels with a signal-to noise ratio 2 standard deviations below average were excluded to eliminate large blood vessels. Each of the resulting matrices from the multislice data sets had dimensions of 130 (or 176 for the asymmetrical task paradigm) × (approximately) 9000.
ICA, as formulated by Comon (10), was used. Blind source separation algorithms of Bell and Sejnowski (11) were used to separate the data into independent components. The components were converted to z-scores, and all components were ranked according to their cumulative content above a threshold of z = 4. Components were selected based upon agreement of spatial and temporal patterns to the expected patterns of activation for a motor task, and specifically those patterns observed with a conventional reference function representing a sustained hemodynamic response and a reference function modified to represent a transient hemodynamic response (5). The spatial mapping of each component was overlaid on coregistered 3D-volume anatomic datasets, and inspected at a threshold of P < .05 (z = 2.4). Standard parcellation methods were used to identify the structures in which activation was observed (12). Specifically, the activation in the sensorimotor cortex, SMA, thalamus, putamen, and cerebellum was tabulated.
For each of the components identified by ICA, the correlation coefficient to a boxcar reference function was calculated. The boxcar reference function had plateaus corresponding temporally to the task cycles. The function incorporated a 6-second delay, representing the expected latency in the blood oxygenation level–dependent hemodynamic response.
Results
For all subjects, task activation maps of good technical quality were obtained with ICA (Fig 1 and 2). Activation was identified in the sensorimotor cortex, SMA, superior sylvian region, cerebellum, thalamus, or putamen in all subjects.
fig 1.

fMR imaging map processed with ICA in one subject who performed bilateral finger tapping. Activation is shown in the left sensorimotor cortex, SMA, thalamus, putamen, superior sylvian region, and right superior cerebellum. The component illustrated correlated temporally with a reference function for right-hand finger tapping (Note: all figures are radiologic orientation).
ICA identified in each case a component that, in its temporal characteristics, resembled the timing of the right- and left-finger tapping tasks. These components mapped regularly to the contralateral sensorimotor cortex, SMA, and ipsilateral superior cerebellum. They also mapped regularly to the contralateral superior sylvian region. These components mapped variably to the contralateral thalamus or putamen. The shapes of each temporal component identified with either hand task were asymmetrical, with either one or both time courses sharing an elevated plateau of signal intensity that corresponded to the timing of the opposite hand task (Fig 3). These plateaus varied between individual subjects. In the two subjects who performed unequally timed epochs of finger tapping and rest, ICA identified temporal components with plateaus synchronized to the right- and left-hand finger tapping (Fig 4). Activation maps derived from this asymmetrical task performance were consistent with those from the regularly timed task paradigm. ICA did not identify a separate component related to the task cycles when both hands were simultaneously finger tapping.
fig 3.

Relative signal-versus-time plots for sample ICA components from the data sets of subjects who performed cycles of rest, right-, and left-hand finger tapping. Lower dashed lines indicate task timing. One component labeled “right hand” has greatest relative signal during the right-hand task performance One component, labeled “left hand,” shows maximal increase during left-hand finger tapping and a reduced increase during right-hand finger tapping. Note the components plateau about 5 seconds after the initiation of the task.
fig 4.

ICA components in subjects performing the left- and right-finger tapping task, with unequal lengths of epochs. Rest and finger-tapping cycles varied in length from 16 to 24 seconds. Lower dashed lines indicate task timing. The components correlate closely with the expected hemodynamic response for each hand task
In all of the subjects, a component was identified that had temporally short signal peaks synchronized with the auditory cues for initiation of each task cycle, including rest (Fig 5). This component mapped specifically to the bilateral auditory cortices in all subjects. In three of the 10 subjects, an additional component that mapped specifically to the anterior bilateral putamen was identified (Fig 6A). The short signal plateaus in this temporal component correlated with the early initiation of finger-tapping task cycles (Fig 6B).
fig 5.

A, Another ICA component that was identified in the data set of subjects performing the alternating finger-tapping task. This component correlates temporally with the delivery of auditory instructions to the subject to initiate or terminate a task. Such a component was found in each of the subjects.
B, The component is superimposed on the components correlating with right- and left-hand finger movement. Lower dashed lines indicate task timing. Note that the fluctuations in the component correspond to the initiation and termination of the motor tasks.
C, fMR image of the independent component illustrates activation localized to the auditory cortices.
fig 6.
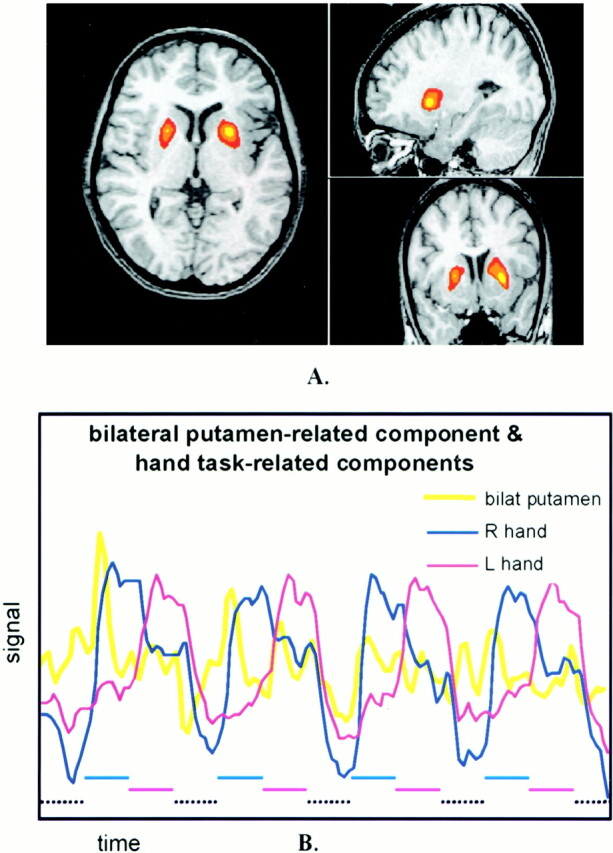
A, Representative three-axis map of an ICA component specific to bilateral putamen. Similar component maps were identified in three subjects. Spatial localization is specific to the anterior putamen bilaterally and to no other regions.
B, Signal-versus-time plots of this ICA component overlaid on the components for left- and right-hand finger tapping. Note that the component increases as the subject initiates the left- or right-hand tasks. Lower dashed lines indicate task timing.
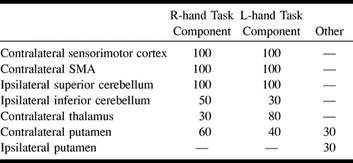
The Table lists the regions in which activation was identified for each of the subjects. ICA components, temporally correlated to each hand task, identified activation in the contralateral sensorimotor cortex, SMA, superior sylvian region, and ipsilateral superior cerebellum in 100% of the subjects. With these components, the ipsilateral inferior right cerebellum showed activation in five subjects, and left cerebellum activation in three. Contralateral thalamus activation was identified in three subjects by the right-hand task component and in eight subjects by the left. Contralateral putamen activation was identified in six subjects by the right-hand task component, and in four subjects by the left-hand task component. In three subjects, a separate component was identified, specific to bilateral putamen activation. Each of these three subjects showed contralateral putamen activation with one of the individual hand task components.
Percentage of subjects with activation in cortical and subcortical regions of activation identified by ICA secondary to finger tapping
More than 100 components with z scores above threshold were identified in the data set for each subject. These multiple components are produced automatically by the ICA deconvolution algorithm, with the matrix number of fMR scan time points determining maximal number of output components. For those components with higher z scores and temporal characteristics suggesting the reference function, cross-correlation coefficients to boxcar reference functions were calculated. These averaged 0.59 (for the components correlated to the right-hand movement) and 0.70 (for components correlated to left-hand movement).
Discussion
This study showed that ICA of multislice fMR data effectively identified multiple temporal patterns of hemodynamic response to finger tapping, and permitted cortical and subcortical structures involved in the tasks to be mapped. It demonstrated more regions of activation than does conventional correlation analysis for similar tasks (1–3). It demonstrates all of the regions of activation identified when multiple reference functions modeling variable hemodynamic responses are used (5).
The relatively low threshold values (P < .05) employed in this study for inspection of ICA-derived activation maps were offset by the specificity of the component maps to positively activated regions. Task-related component maps exhibited robust localization to known cortical areas involved in the motor performance, with very sparsely scattered nonactivated voxels passing threshold. This pattern of robust specificity also applied to the ICA-derived components for auditory activation and bilateral putamen activation. Application of higher thresholds (P < .01) to the right- and left-hand task-related component maps demonstrated less sensitivity to subcortical areas of thalamus and basal ganglia activation.
This study was a preliminary assessment of ICA efficacy to fMR imaging–revealed motor activation. ICA has not been optimized for fMR studies. The effects of data matrix size, filtering, and task paradigm on the sensitivity and specificity of ICA are unknown. This current configuration of ICA demonstrates multiple components, only a few of which are specific to the task performed. Others may represent artifacts associated with motion, for example. Many of the components resemble each other, either temporally or spatially. One of the weaknesses of ICA is that the trends in the data may be fragmented into multiple components, each with a highly related time course. The investigators selected ICA components for this study by analyzing both their spatial and temporal features.
ICA extracts the intrinsic structure of the data without an a priori knowledge or prediction of it. It uses an iterative training process to find the spatially independent components in the data set (8). Some components identified by ICA have temporal characteristics suggesting a relationship to the task. Activations that are not anticipated, such as hemodynamic changes that are transiently related to the task, may more likely be uncovered by ICA than by hypothesis-driven methods. With this current version of ICA, they can be identified by spatial characteristics specific to a region of brain known to be active in the task, and by confirming the relationship of temporal characteristics to the task timing.
Hypothesis-driven methods, such as subtraction, correlation and time frequency analyses, or analysis of variance, identify trends that correlate with the known or assumed hemodynamic response. These methods may be useful to distinguish physiological and artifactual fluctuations, although they do not distinguish artifact that has a time course similar to that of activation. They have the drawback that the hemodynamic response must be known or assumed. Hybrid methods that have the advantages of both hypothesis- and data-driven methods have been described (13). These methods, when applied to fMR imaging data, may facilitate the classification of the components in ICA.
The multiplicity of components revealed by ICA may have advantages for clinical and experimental fMR imaging. For example, one component was identified from the finger-tapping task data that corresponded temporally and spatially to the processing of the auditory cues given to the subject to initiate and terminate finger movements. This component of short duration would not ordinarily be detected by a reference function modeling a sustained hemodynamic response. The short duration of each of the auditory cortical responses also indicates the sensitivity of ICA to event-related hemodynamics. Multiple task-related events can be detected, and their spatial localizations specified. These factors are important considerations in the analysis of higher-order cognitive and complex motor tasks, especially when task performance can involve aggregate functions. ICA may also be especially effective in the analysis of fMR imaging tasks in which the temporal characteristics of the response are unknown. Examples of such data may include complex cognitive tasks, tasks in which the subject or patient fails to perform exactly according to instruction, and tasks in which learning, habituation, or fatigue impact results.
Conclusion
The significance of this study is that ICA, without a prescribed reference function, identifies sites of activation secondary to the motor task employed. It characterizes the hemodynamic task response temporally and spatially. In this whole-brain study, the identified ICA components included cortical and subcortical activation mapping. ICA may also reveal variations in an individual subject's performance of the task. Multiple task-related components were separately identified, even with this relatively simple task paradigm. With further application to more complex tasks, ICA will likely reveal areas of activation not identified with conventional postprocessing methods.
fig 2.

fMR imaging spatial map processed with ICA, in the same subject as in figure 1, illustrating another component. Activation is shown in the right sensorimotor cortex, SMA, thalamus, putamen, superior sylvian region, and left superior cerebellum. This component had a high correlation coefficient with a reference function for left-hand finger tapping
Footnotes
Address reprint requests to Chad H. Moritz, 600 Highland Avenue, Department of Radiology, Clinical Sciences Center, Module E3, Madison, WI 53792.
References
- 1.Bandettini PA, Wong EC, Hinks RS, Tikofsky RS, Hyde JS. Time course EPI of human brain function during task activation. Magn Reson Med 1992;25:390-397 [DOI] [PubMed] [Google Scholar]
- 2.Rao SM, Harrington DL, Haaland KY, Bobholz JA, Cox RW, Binder JR. Distributed neural systems underlying the timing of movements. J Neurosci 1997;17:5528-5535 [DOI] [PMC free article] [PubMed] [Google Scholar]
- 3.Moriyama T, Yamanouchi N, Kodama K, et al. Activation of non-primary motor areas during a complex finger movement task revealed by functional magnetic resonance imaging. Psych and Clin Neurosci 1998;52:339-343 [DOI] [PubMed] [Google Scholar]
- 4.Bandettini PA, Jesmanowicz AJ, Wong EC, Hyde JS. Processing strategies for time-course data sets in functional MRI of the human brain. Magn Reson Med 1993;30:161-173 [DOI] [PubMed] [Google Scholar]
- 5.Moritz CH, Meyerand ME, Cordes D, Haughton VM. Different reference functions reveal varying patterns of subcortical activation from finger tapping studies with whole-brain fMRI. AJNR Am J Neuroradiol 2000; in press
- 6.McKeown MJ, Makeig S, Brown GG, et al. Spatially independent activity patterns in functional MRI data during the stroop color-naming task. Proc Natl Acad Sci USA 1998;95:803-810 [DOI] [PMC free article] [PubMed] [Google Scholar]
- 7.Biswal BB, Ulmer JL. Blind source separation of multiple signal sources of fMRI data sets using independent component analysis. J Comp Assist Tomogr 1999;23:265-271 [DOI] [PubMed] [Google Scholar]
- 8.McKeown MJ, Makeig S, Brown GG, et al. Analysis of fMRI data by blind separation into independent spatial components. Hum Brain Mapp 6:160-188 [DOI] [PMC free article] [PubMed] [Google Scholar]
- 9.Lowe MJ, Sorenson JA. Spatially filtering functional magnetic resonance imaging data. Magn Reson Med 1997;37:723-729 [DOI] [PubMed] [Google Scholar]
- 10.Comon P. Independent component analysis: a new concept? Signal Processing 1996;36:11-20 [Google Scholar]
- 11.Bell AJ, Sejnowski TJ. An information-maximization approach to blind separation and blind deconvolution. Neural Comput 1995;7:1129-1159 [DOI] [PubMed] [Google Scholar]
- 12.Sobel DF, Gallen CC, Schwartz BJ, et al. Locating the central sulcus: comparison of MR anatomic and magnetoencephalographic functional methods [see comments]. AJNR Am J Neuroradiol 1993;14:915-925 [PMC free article] [PubMed] [Google Scholar]
- 13.McKeown MJ. Detection of consistently task-related activation in fMRI data with hybrid independent component analysis. NeurImage 2000;11:24-35 [DOI] [PubMed] [Google Scholar]