

Abstract
BACKGROUND AND PURPOSE: The purpose of our study was to analyze the diffusion properties of intracranial hematomas to understand the effects of hematomas on diffusion-weighted MR images of patients with acute stroke and to further our understanding of the evolution of signal intensities of hematomas on conventional MR images. We hypothesized that hematomas containing blood with intact RBC membranes (ie, early hematomas) have restricted diffusion compared with hematomas in which RBC membranes have lysed.
METHODS: Seventeen proven intracranial hematomas were studied with conventional and diffusion MR imaging. Hematomas were characterized using conventional images to determine the stage of evolution and their putative biophysical composition, as described in the literature. Apparent diffusion coefficient (ADC) measurements for each putative hematoma constituent (intracellular oxyhemoglobin, intracellular deoxyhemoglobin, intracellular methemoglobin, and extracellular methemoglobin) were compared with each other and with normal white matter.
RESULTS: Hematomas showing hemoglobin within intact RBCs by conventional MR criteria (n = 14) showed equivalent ADC values, which were reduced compared with hematomas containing lysed RBCs (P = .0029 to .024). Compared with white matter, hematomas containing lysed RBCs had higher ADC measurements (P = .003), whereas hematomas containing intact RBCs had reduced ADC measurements (P < .0001).
CONCLUSION: Restricted diffusion is present in early intracranial hematomas in comparison with both late hematomas and normal white matter. Therefore, early hematomas would be displayed as identical to the signal intensity of acute infarction on ADC maps, despite obvious differences on conventional MR images. These data also are consistent with the biochemical composition that has been theorized in the stages of evolving intracranial hematomas and provide further evidence that paramagnetic effects, rather than restriction of water movement, are the dominant cause for their different intensity patterns on conventional MR images.
The advent of early, aggressive therapy for ischemic cerebral infarction has fostered a new motivation for imaging of the brain (1). Before the introduction of emergent treatment of acute ischemic stroke, imaging was performed mainly to exclude other pathologic abnormalities masquerading as infarction and to exclude hemorrhage. Recent advances in therapy for these patients (2) has dramatically changed the overall importance of imaging in this setting, particularly where diffusion and perfusion MR imaging techniques are available, because these techniques are beginning to play an important role in assessing tissue viability and, consequently, patient management (3–7). Moreover, the recognition of early intracranial hemorrhage specifically on MR images has also become more important, because the primary assessment of patients with early stroke is moving toward MR imaging and away from CT scanning (1, 8).
It has become generally accepted that early intracranial hematomas typically change over time (9), mainly, but not exclusively, in two important ways that alter MR signal intensity patterns: 1) the oxygenation state of hemoglobin changes, and 2) initially intact RBC membranes eventually lyse. Intact RBCs containing relatively oxygenated hemoglobin in the earliest hematomas (10) first deoxygenate. Next, the deoxygenated hemoglobin, still within intact RBCs (11, 12), becomes oxidized (11), forming methemoglobin (13). At that point in time, RBC membranes lyse, so that paramagnetic methemoglobin becomes non-compartmental-ized (9).
Diffusion-weighted MR imaging is highly sensitive to changes in water motion (3, 14–16), because signal loss occurs with more water diffusion when using a diffusion-sensitized pulse sequence. The presence of intact cell membranes restricts molecular diffusion (17). The lysis of RBC membranes in the evolution of hematomas might, therefore, change the environment regarding water mobility (ie, there would be a change from a more restricted environment within intact RBCs to a less restricted environment in which RBC membranes have lysed). As diffusion imaging becomes integrated into the initial emergent evaluation of patients with acute stroke (5–7), it becomes paramount to understand the manifestations of intracranial hemorrhage on diffusion MR imaging specifically. This is particularly important because the recognition of underlying cerebral infarction, a potentially treatable cause of the hemorrhage, depends to a great extent on separating the hemorrhage from the infarction. Acute treatment (ie, thrombolysis) of a hemorrhagic infarction is generally contraindicated. If early hematomas, theorized to contain hemoglobin primarily within intact RBC membranes, are associated with restricted diffusion, the potential exists for early hemorrhage to confound the diagnosis of ischemic infarction based on diffusion MR images.
The purpose of our study was twofold: 1) to analyze the diffusion properties of various stages in evolving intracranial hematomas to further our understanding of the normal evolution of signal intensities of hematomas on conventional MR images, and 2) to understand the effects of hematomas on diffusion-weighted MR images of patients with acute stroke. We hypothesized that diffusion MR images would differ among the stages of evolving hematomas in that hematomas containing blood with intact cell membranes would have restricted diffusion compared with hematomas in which RBC membranes have lysed.
Methods
Sixteen consecutive patients with 17 discrete intracranial hematomas proved by CT or surgery or both were studied by conventional and diffusion MR imaging on a GE Signa Echospeed 1.5-T imager modified with hardware for echo-planar imaging. By clinical criteria, none of the hematomas included in this study were due to neoplasm, infarction, or diffuse axonal injury, any of which might be expected to confound apparent diffusion coefficient (ADC) data. All MR images, including both conventional and diffusion images, were acquired using a 5-mm section thickness with a 2.5-mm intersection gap and a 24 × 24-cm field of view. For T1- and T2-weighted images, a 192 × 256 matrix was used. For T1-weighted images generated from a conventional spin-echo pulse sequence, the parameters of 600/11/1 (TR/TE/excitations) were used. For T2-weighted images generated from a fast spin-echo sequence, the parameters of 3600/90/1 were used. For diffusion data, we performed multisection single-shot spin-echo diffusion imaging using a diffusion sensitivity of b = 1000 s/mm2. Diffusion gradients were applied sequentially in three orthogonal directions to generate three sets of axial diffusion-weighted images. From these, average ADC maps were calculated.
Hematomas were characterized using conventional T1- and T2-weighted images to determine the stage of evolution and their putative biophysical composition, based on the generally accepted signal intensity patterns as described in the literature (9, 10, 13). Regions of interest (ROI) were carefully drawn in these areas on calculated average ADC maps, as well as in normal-appearing white matter in all patients. The selection of ROI was made with the help of the T2-weighted echo-planar images of the same acquisition as the diffusion images (ie, images generated from the diffusion sequence with diffusion sensitivity b = 0) to avoid errors in ROI selection due to spatial distortion problems causing discrepancies between diffusion images and conventional MR images. All analysis was conducted with careful ROI placement while using the largest ROI possible within the hematoma without volume averaging (14 of 17 hematomas measured greater than or equal to 1 cm in diameter; the minimum ROI measured 2 × 2). ADC measurements for each type of putative hematoma constituent (intracellular oxyhemoglobin, intracellular deoxyhemoglobin, intracellular methemoglobin, and extracellular methemoglobin) were compared with each other and with normal white matter using an unpaired t test.
Results
Seventeen hematomas were identified with specific signal intensity patterns described in the literature for evolving intracranial hematomas on conventional MR intensity patterns on T1- and T2-weighted MR images. The following hematoma regions underwent ROI analysis: intracellular oxyhemoglobin (n = 2), intracellular deoxyhemoglobin (n = 8), intracellular methemoglobin (n = 4), and extracellular methemoglobin (n = 3) (Table 1).
TABLE 1:
Average ADC in intracranial hematomas
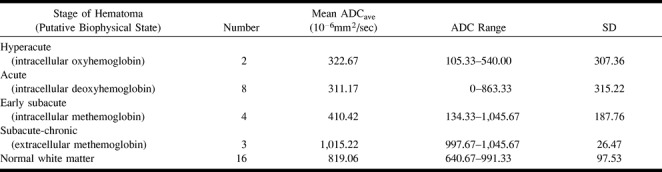
All hematoma regions consistent with compartmentalized blood components (ie, intact RBCs) by conventional MR imaging criteria (n = 14), regardless of whether that was intracellular deoxyhemoglobin, intracellular methemoglobin, or intracellular oxyhemoglobin, showed no statistically significant differences among their average ADC values (Table 2, Fig 1). All hematoma regions containing these intracellular components also showed significantly reduced diffusion compared with hematomas containing lysed RBCs (intracellular oxyhemoglobin versus extracellular methemoglobin, P = .024; intracellular deoxyhemoglobin versus extracellular methemoglobin, P = .0046; intracellular methemoglobin versus extracellular methemoglobin, P = .0029). Hematomas containing lysed RBCs had significantly more diffusion (higher ADC measurements) than did white matter (P = .003), whereas hematomas containing intact RBCs had significantly reduced diffusion as compared with normal white matter (P < .0001).
TABLE 2:
Statistical comparisons between ADC of stages of intracranial hematomas
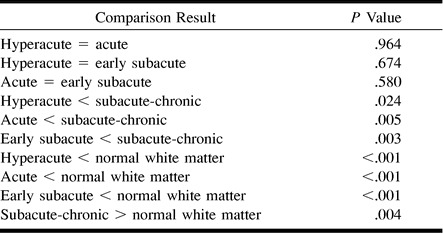
fig 1.
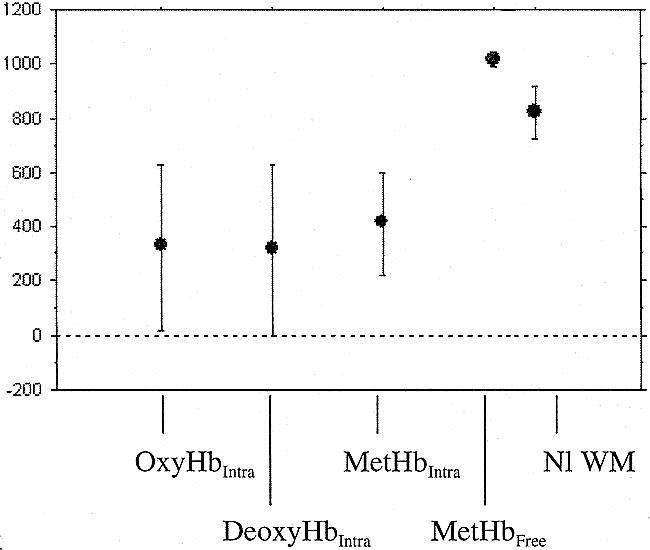
Average ADC value versus putative biophysical state in intracranial hematomas
Discussion
The MR appearance of evolving intracranial hemorrhage and its underlying biophysical basis are somewhat complex, even on conventional MR images. It has been proposed that the earliest stage of intracranial hematoma, “hyperacute” hematoma, is recognized on conventional T2-weighted images by its overall hyperintensity accompanied by marked peripheral hypointensity (10). This pattern has been attributed to relatively oxygenated hemoglobin forming the bulk of the hematoma with early deoxygenation found at the periphery (10, 18). Evolution into “acute” hematomas is identified as marked hypointensity throughout the lesion on T2-weighted images (9) with isointense signal on T1-weighted images. Although multifactorial, it has been generally accepted that the basis of this signal loss on T2-weighted images is mainly the intrinsic heterogeneity of magnetic field gradients due to compartmentalized paramagnetic deoxygenated blood (9, 12, 19, 20). Similarly, “early subacute” hematomas are hyperintense on T1-weighted images and markedly hypointense on T2-weighted images. This infrequently seen, transient stage in hematoma evolution is attributed to the presence of methemoglobin, which is compartmentalized within intact RBCs (9). Based on numerous clinical, animal, and in vitro studies in the literature (21), it has been generally recognized that two of the most important factors in generating these signal intensity patterns in the evolution of intracranial hemorrhage are the oxygenation state of the hemoglobin with its accompanying paramagnetic iron and the presence of intact cells to compartmentalize the paramagnetic material.
In this study, we hypothesized that diffusion MR data would differ among the stages of evolving hematomas in that hematomas containing blood with intact cell membranes would have restricted diffusion compared with those hematomas in which RBC membranes have lysed. This hypothesis was based on several facts. First, the presence of intact cell membranes restricts molecular diffusion (17). For instance, increased ADC values have been reported in cases of intratumoral necrosis (22–24), a pathologic environment defined by a lack of intact cell membranes. Second, an important requisite for the diffusion restriction observed in association with early ischemic infarction is the presence of intact cells, because the early reduction in diffusion is related to shifts of water from extracellular space to intracellular space (3, 15, 25). Once cells have lysed in the subsequent evolution of subacute to chronic infarction, measured diffusion increases (26, 27).
Our data indicate that hematomas composed of any and all of the evolutionary stages theorized to contain hemoglobin within intact RBCs (ie, hyperacute, acute, and early subacute hematomas) show significantly reduced ADC values compared with the single hematoma state theorized to be comprised of lysed RBCs (ie, “free” methemoglobin in subacute-to-chronic hematomas). Our data also show that the ADC measurements in all of the intracellular hemoglobin states (intracellular oxyhemoglobin, intracellular deoxyhemoglobin, and intracellular methemoglobin) were statistically equivalent. These diffusion data support the theorized biophysical states of hemoglobin and the RBC put forth in the literature on evolving intracranial hematomas.
Further analysis of our data indicated that the ADC measurements of all early hematomas (including hyperacute, acute, and even early subacute) were significantly reduced compared with normal brain tissue. This restriction of diffusion is similar to the phenomenon observed in cases of early ischemic infarction, in which it is well documented that within minutes and for the first several days, the ADC value decreases and is therefore depicted as marked hypointensity on ADC maps (3–5, 27). The precise biophysical explanation for the observed restriction of diffusion in early stages of intracranial hematomas is uncertain. Potential causes include, but are not limited to: 1) a shrinkage of extracellular space with clot retraction (25); 2) a change in the osmotic environment once blood becomes extravascular, which alters the shape of the RBC (28)—a phenomenon related to the formation of the fibrin network associated with clot (29); 3) a conformational change of the hemoglobin macromolecule within the RBC (30); and the less likely possibility of 4) contraction of intact RBCs (thereby decreasing intracellular space) (31). Any of these processes might alter the potential mobility of intracellular water protons. Regardless of the precise explanation for restricted diffusion in early hematomas, our study indicates that the measured restriction of diffusion (reduced ADC value) in the hematoma itself would generate similar hypointensity on ADC maps (Fig 2) and, if anatomically appropriate, might confound the diagnosis and the quantification of regions of acute infarction in the clinical setting.
fig 2.
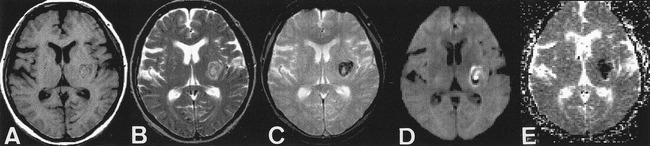
ADC map in case of hyperacute intracranial hematoma.
A, T1-weighted images (600/11/1). Left subinsular hematoma is isointense to brain.
B, T2-weighted images (3600/90/1). Left subinsular hematoma is hyperintense to brain, with thin, peripheral rim of marked hypointensity.
C, T2*-weighted gradient-echo images (500/30/1). Left subinsular hematoma is more prominent.
D, Diffusion-weighted images show central high intensity.
E, Calculated ADC maps show marked hypointensity indicating restricted diffusion.
The diffusion data presented in this study are important for several reasons. First, in this era of acute stroke treatment, management decisions depend to a great extent on imaging findings, and they are beginning to depend particularly on diffusion imaging (1). Restriction of diffusion, even in the appropriate clinical setting of acute stroke by clinical assessment, should not necessarily be taken as specific for acute ischemic infarction. Second, several studies quantify regions of acute infarction on the basis of restricted diffusion on ADC maps. Our data indicate a potential pitfall to that quantitative assessment in that early hematomas might mask or mimic regions of acute infarction. This suggests that ADC maps should always be interpreted with conventional MR images for comparison. Third, this study confirms the key features of the putative evolutionary stages in intracranial hematomas. Our data showing equivalence of diffusion among hyperacute, acute, and early subacute hematomas despite their marked differences in signal intensity patterns on conventional MR images provide further evidence that paramagnetic effects, rather than restriction of water movement and clot retraction, account for the dominant features seen on conventional MR images of these lesions. Notwithstanding certain limitations of our study, including the relatively large SD of our ADC measurements and the small number of cases in some of our representative hematoma states, statistical significance was achieved in all relevant comparisons to support our hypothesis.
Conclusion
Diffusion of water is significantly restricted in intracranial hematomas that show MR signal intensity patterns consistent with intracellular oxyhemoglobin, intracellular deoxyhemoglobin, and intracellular methemoglobin. This restricted diffusion in hyperacute and acute hematomas is in comparison with both extracellular methemoglobin in subacute chronic hematomas and is relative to normal brain parenchyma. Therefore, early hematomas would be displayed as identical to the signal intensity of acute infarction on ADC maps, despite their clear differentiation on conventional MR images. This suggests that ADC maps should always be interpreted with conventional MR images for comparison. These data also are consistent with the biochemical composition that has been theorized in the various stages of evolving hematomas in nonneoplastic brain hemorrhage and provide further evidence that paramagnetic effects, rather than restriction of water movement, account for the dominant features seen on conventional MR images of these lesions.
Footnotes
Presented in part at the 1998 Annual Meeting of the American Society of Neuroradiology, Philadelphia, PA.
Address reprint requests to Scott W. Atlas, MD, Department of Radiology, Stanford University Medical Center, 300 Pasteur Drive, Room S-047, Stanford, CA 94305.
References
- 1.Albers G. Expanding the window for thrombolytic therapy in acute stroke: the potential role of acute MRI for patient selection. Stroke 1999;30:2230-2237 [DOI] [PubMed] [Google Scholar]
- 2. The National Institute of Neurological Disorders and Stroke rt-PA Stroke Study Group. Tissue plasminogen activator for acute ischemic stroke. N Engl J Med 1995;333:1581-1587 [DOI] [PubMed] [Google Scholar]
- 3.Moseley ME, Kucharczyk J, Mintorovitch J, et al. Diffusion-weighted MR imaging of acute stroke: correlation with T2-weighted and magnetic susceptibility-enhanced MR imaging in cats. AJNR Am J Neuroradiol 1990;11:423-429 [PMC free article] [PubMed] [Google Scholar]
- 4.Warach S, Chien D, Li W, Ronthal M, Edelman R. Fast magnetic resonance diffusion weighted imaging of acute human stroke. Neurology 1992;42:1717-1723 [DOI] [PubMed] [Google Scholar]
- 5.Gonzalez R, Schaefer P, Buonanno F, et al. Diffusion-weighted MR imaging: diagnostic accuracy in patients imaged within 6 hours of stroke symptom onset. Radiology 1999;210:155-162 [DOI] [PubMed] [Google Scholar]
- 6.Sunshine J, Tarr R, Lanzieri C, Landis D, Selman W, Lewin J. Hyperacute stroke: ultrafast MR imaging to triage patients prior to therapy. Radiology 1999;212:325-332 [DOI] [PubMed] [Google Scholar]
- 7.Singer M, Chong J, Lu D, Schonewille W, Tuhrim S, Atlas S. Diffusion-weighted MRI in acute subcortical infarction. Stroke 1998;29:133-136 [DOI] [PubMed] [Google Scholar]
- 8.Grotta J, Chiu D, Lu M, et al. Agreement and variability in the interpretation of early CT changes in stroke patients qualifying for intravenous rtPA therapy. Stroke 1999;30:1528-1533 [DOI] [PubMed] [Google Scholar]
- 9.Gomori JM, Grossman RI, Goldberg HI, Zimmerman RA, Bilaniuk LT. Intracranial hematomas: imaging by high-field MR. Radiology 1985;157:87-93 [DOI] [PubMed] [Google Scholar]
- 10.Atlas S, Thulborn K. MR detection of hyperacute parenchymal hemorrhage of the brain. AJNR Am J Neuroradiol 1998;19:1471-1507 [PMC free article] [PubMed] [Google Scholar]
- 11.Gomori JM, Grossman RI, Bilaniuk LT, et al. High-field MR imaging of superficial siderosis of the central nervous system. J Comput Assist Tomogr 1985;9:972-975 [DOI] [PubMed] [Google Scholar]
- 12.Thulborn KR, Waterton JC, Matthews PM, Radda GK. Oxygenation dependence of the transverse relaxation time of water protons in whole blood at high field. Biochim Biophys Acta 1982;714:265-270 [DOI] [PubMed] [Google Scholar]
- 13.Bradley WGJ, Schmidt PG. Effect of methemoglobin formation on the MR appearance of subarachnoid hemorrhage. Radiology 1985;156:99-103 [DOI] [PubMed] [Google Scholar]
- 14.Buxton R, Kwong K, Brady T, Rosen B. Diffusion imaging of the human brain. J Comput Assist Tomogr 1990;14:514-520 [DOI] [PubMed] [Google Scholar]
- 15.Beneviste H, Hedlund L, Johnson G. Mechanism of detection of acute cerebral ischaemia in rats by diffusion-weighted magnetic resonance microscopy. Stroke 1992;23:746-754 [DOI] [PubMed] [Google Scholar]
- 16.Basser P, Mattiello J, LeBihan D. MR diffusion tensor spectroscopy and imaging. Biophys J 1994;66:259-267 [DOI] [PMC free article] [PubMed] [Google Scholar]
- 17.van der Veen J, van Gelderen P, Creyghton JH, Bovee WM. Diffusion in red blood cell suspensions: separation of the intracellular and extracellular NMR sodium signal. Magn Reson Med 1993;29:571-574 [DOI] [PubMed] [Google Scholar]
- 18.Pauling L, Coryell C. The magnetic properties and structure of hemoglobin, oxyhemoglobin, and carbonmonoxyhemoglobin. Proc Natl Acad Sci USA 1936;22:210-216 [DOI] [PMC free article] [PubMed] [Google Scholar]
- 19.Bryant RG, Marill K, Blackmore C, Francis C. Magnetic relaxation in blood and blood clots. Magn Reson Med 1990;13:133-144 [DOI] [PubMed] [Google Scholar]
- 20.Clark RA, Watanabe AT, Bradley WG, Roberts JD. Acute hematomas: effects of deoxygenation, hematocrit, and fibrin-clot formation and retraction on T2 shortening. Radiology 1990;175:201-206 [DOI] [PubMed] [Google Scholar]
- 21.Thulborn KR, Atlas SW. Intracranial hemorrhage. In: Atlas SW (ed): Magnetic Resonance Imaging of the Brain and Spine. Philadelphia: Lippincott-Raven Publishers 1996 265-314
- 22.Tien R, Felsberg G, Friedman H, Brown M, MacFall J. MR imaging of high-grade cerebral gliomas: value of diffusion-weighted echoplanar pulse sequences. AJR Am J Roentgenol 1994;162:671-677 [DOI] [PubMed] [Google Scholar]
- 23.Desprechins B, Stadnik T, Koerts G, Shabana W, Breucq C, Osteaux M. Use of diffusion-weighted MR imaging in differential diagnosis between intracerebral necrotic tumors and cerebral abscesses. AJNR Am J Neuroradiol 1999;20:1252-1257 [PMC free article] [PubMed] [Google Scholar]
- 24.Chong J, Lu D, Eisenkraft B, et al. Diffusion Trace for the Diagnosis of Tumor Necrosis in Intracerebral Neoplasms. Presented at the Annual Meeting of the American Society of Neuroradiology, Philadelphia, 1998
- 25.Latour L, Svoboda K, Mitra P, Sotak C. Time-dependent diffusion of water in a biological model system. Proc Natl Acad Sci USA 1994;91:1229-1233 [DOI] [PMC free article] [PubMed] [Google Scholar]
- 26.Warach S, Gaa D, Siewert B, Wiepolski P, Edelman R. Acute human stroke studied by whole brain echo planar diffusion-weighted magnetic resonance imaging. Neurology 1995;37:231-241 [DOI] [PubMed] [Google Scholar]
- 27.Beaulieu C, de Crespigny A, Tong D, Moseley M, Albers G, Marks M. Longitudinal magnetic resonance imaging study of perfusion and diffusion in stroke: evolution of lesion volume and correlation with clinical outcome. Ann Neurol 1999;46:568-578 [DOI] [PubMed] [Google Scholar]
- 28.Hijiya N, Horiuchi K, Asakura T. Morphology of sickle cells produced in solutions of varying osmolarities. J Lab Clin Med 1991;117:60-66 [PubMed] [Google Scholar]
- 29.Kaibara M. Rheology of blood coagulation. Biorheology 1996;33:101-117 [DOI] [PubMed] [Google Scholar]
- 30.Beall P, Hazlewood C, Rao P. Nuclear magnetic resonance patterns of intracellular water as a function of HeLa cell cycle. Science 1976;192:904-907 [DOI] [PubMed] [Google Scholar]
- 31.Hargens A, Bowie L, Lent D, et al. Sickle-cell hemoglobin: fall in osmotic pressure upon deoxygenation. Proc Natl Acad Sci USA 1980;77:4310-4312 [DOI] [PMC free article] [PubMed] [Google Scholar]