Abstract
BACKGROUND AND PURPOSE: Our purpose was to test a new variant of the fluid-attenuated inversion-recovery (FLAIR) sequence that was designed to reduce CSF and blood flow artifacts by use of a non–slice-selective inversion pulse and k-space reordered by inversion time at each slice position (KRISP).
METHODS: With the KRISP FLAIR sequence, the slice order was cycled so that each inversion time (TI) was associated with a region of k-space rather than a particular slice, and the effective inversion time (TIeff) was chosen to null the signal from CSF. Scans were obtained with both conventional and KRISP FLAIR sequences. Studies were performed in 20 adult patients with a variety of brain diseases. Images were evaluated for artifacts from patient motion, CSF, and blood flow, and scored on a four-point scale. The conspicuity of the cortex, meninges, ventricular system, brain stem, and cerebellum was evaluated, as was lesion number and conspicuity.
RESULTS: The KRISP FLAIR sequence showed more patient motion artifacts but had a pronounced advantage over the conventional sequence in control of CSF artifacts around the foramen of Munro, in the third ventricle, aqueduct, and fourth ventricle, as well as in the basal cisterns and around the brain stem and cerebellum. Blood flow artifacts from the internal carotid, basilar, and vertebral arteries were also much better controlled. Spurious high signal in the sylvian branches of the middle cerebral artery was eliminated. The meninges, cortex, ventricular system, brain stem, and cerebellum were better seen due to improved artifact suppression and an edge enhancement effect.
CONCLUSION: The KRISP FLAIR sequence can suppress CSF and blood flow artifacts and improve the conspicuity of the meninges, cortex, brain stem, and cerebellum. Its major disadvantage is its duration, which may be reducible with a fast spin-echo version.
Fluid-attenuated inversion recovery (FLAIR) is an MR pulse sequence that typically uses a slice-selective inversion pulse to null the signal from CSF and a long echo time (TE) to provide heavy T2 weighting. The technique provides a sensitive means for detecting lesions in the brain (1–12) as well as disease involving the subarachnoid space and meninges (13–15). A major problem with the technique is the occurrence of high signals within CSF that may simulate disease in the subarachnoid space as well as create partial volume effects and motion artifacts that obscure disease in the brain (16–19). The most important cause of these spurious high signals is inflow of uninverted, or only partially inverted, CSF into the slice during the period between the initial slice-selective 180° pulse and the subsequent 90° pulse; that is, during the inversion time (TI), which is typically 2000 to 2500 milliseconds (20). A solution is to use a non–slice-selective initial 180° pulse so that a large volume of CSF is inverted and spurious signals are not produced by inflow during TI (21–23). The disadvantage of this approach is that the TI of successive slices in a multislice set is progressively increased, so tissue contrast is altered and the number of slices that can be imaged with nulling, or near nulling, of the CSF is limited.
Recently, Norris (24) described a method for reducing radiofrequency power deposition in ultra–high-field imaging using the modified driven equilibrium Fourier transform pulse sequence, which is a variant of an inversion-recovery pulse sequence. Norris used a single non–slice-selective 180° pulse and maintained constant tissue contrast in all slices by cycling the slice order and associating each TI with a region of k-space rather than a particular slice. We have adapted this approach to FLAIR imaging. This article describes the pulse sequence and presents clinical results from 20 patients.
Methods
The k-Space Reordered by Inversion Time at Each Slice Position (KRISP) FLAIR Pulse Sequence
The k-space reordered by inversion time at each slice position (KRISP) FLAIR pulse sequence is illustrated for three slices in Figure 1A. After the non–slice-selected 180° initial inversion pulse is applied, data are collected at TI delay times α, β, and γ, as shown in Figure 1B. If the data collected at TI = α were always used for slice 1, the data at TI = β for slice 2, and the data at TI = γ for slice 3, we would just have a multislice sequence with TI progressively increasing for each slice, as described previously (21–23).
fig 1.
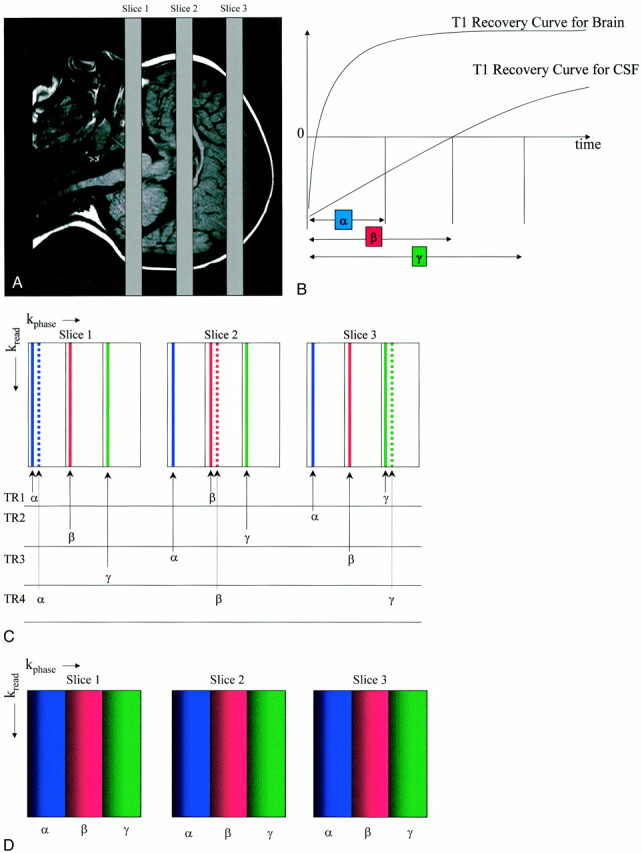
Illustration of the KRISP FLAIR pulse sequence.
A, Three transverse slices through the brain.
B, Diagram shows T1 recovery curves for brain and CSF and illustrates sampling (with a 90° pulse at each data collection) at three progressively increasing TIs: α, β, and γ, with CSF nulled at time β.
C, Diagram shows mapping of k-space for each of the three slices. In TR1, lines are mapped as shown with the first sample at TI = α to the first strip of k-space in slice 1; sample 2, at TI = β to the second strip of slice 2; and sample 3 at TI = γ to the third strip of k-space in slice 3. For TR2, the sample at TI = α is mapped to the first strip of slice 3, the sample at TI = β to the second strip of slice 1, and so on.
D, Diagram shows the end result for each slice with the first strip of k-space mapped with TI = α, the middle strip with TI = β, and the third strip with TI = γ. Since the signals from tissues and fluids vary with TI as a function of their T1 value, this applies a tissue- and fluid-specific T1 filter across k-space, which is the same for each slice
With the KRISP sequence, during the first repetition (TR1), the data acquired at TI = α are mapped to the beginning of the first strip of k-space in slice 1 (Fig 1C), the data acquired at TI = β are mapped to the beginning of the second strip of k-space in slice 2, and the data acquired at TI = γ are mapped to the beginning of the third strip of k-space in slice 3. For the next repetition (TR2), data with TI = α are mapped to the first strip of k-space of slice 3, data with TI = β are mapped to the second strip of k-space of slice 1, and data with TI = γ are mapped to the third strip of slice 2. In TR3, data acquired at TI = α are mapped to the first strip of k-space of slice 2, data acquired at TI = β are mapped to the second strip of slice 3, and data acquired at TI = γ are mapped to the third strip of slice 3. For TR4, the allocations are the same as for TR1 but the phase-encoding gradients are stepped to provide the next line of k-space in each strip for each slice (dotted lines in Fig 1C).
The TR cycles are repeated until k-space is fully mapped for each slice. The end result is shown in Figure 1D, in which the k-space map for all slices is the same. Each slice shows a range of TI values across the phase-encoded direction from α to γ (shading has also been used to indicate that the phase-encoding values have increased from left to right). Since the signals from tissue and fluids vary with TI as a function of their T1 value, this form of k-space mapping applies a tissue- and fluid-specific T1 filter to k-space.
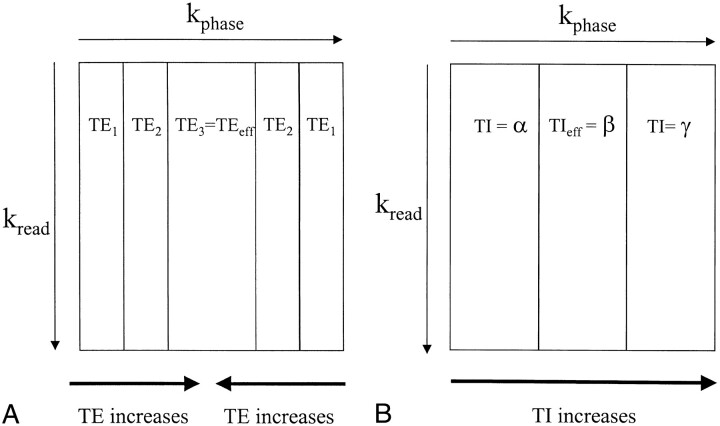
The T1 k-space filter of KRISP FLAIR operates in an analogous manner to the T2 filter associated with the fast spin-echo (FSE) pulse sequence (Fig 2A). The data at the center of k-space determine the overall image contrast and that at the periphery of k-space provide information about detailed structures, such as edges. In T2-weighted FSE imaging, the late echo (echo 3 in Fig 2A) is used to fill the center of k-space and thus is the effective TE (TEeff) of the image. Earlier echoes (echoes 1 and 2) are then used to fill in the peripheral points of k-space (which is generally done systematically to make the smoothest possible pattern). A heavily T2-weighted FSE sequence (long echoes at the center) can show fine detail because the short high-amplitude echoes are used to encode the edges of k-space.
fig 2.
Diagrams show associations between regions of k-space and TE for a three-echo FSE sequence (A), as well as TI for a three-slice KRISP FLAIR sequence (B). The center of k-space controls image contrast, and the periphery of k-space contains information about fine structures, such as edges. With the FSE sequence, the TE used for the center of k-space is known as the effective echo time (TEeff). In A, the third echo, which has a long TE, provides the data for the center of k-space, and echoes 1 and 2, which have shorter TEs, are used to fill the periphery of k-space. A heavily T2-weighted image appearance with good edge definition would result from this type of acquisition. With the KRISP sequence, image contrast is determined by the TIeff, which is the TI of the data at the center of k-space. In B, a three-slice example is shown with TIs corresponding to the slice excitation timings shown in figure 1. Data with TIeff = β are shown in the center of k-space and have been chosen to null CSF. The high-amplitude signals from brain and CSF at TI = α and TI = γ provide good edge definition
In KRISP FLAIR, data acquired with a TI for which CSF is at its null point (TI = β in Fig 2B) are placed at the center of k-space. The resulting image has dark CSF, because the CSF signal is nulled, but the brain magnetization is substantially recovered at TI = β (Fig 1B) and so gives a high signal. The edges of k-space are filled with data acquired at TI = α and TI = γ (Fig 2B) for which both CSF and brain provide high-amplitude signals. As a result, the edge detail of brain is maintained. However, CSF can also produce high signal at the periphery of k-space even though the central CSF signal is nulled. This can result in images in which brain/CSF and meninges/CSF interfaces are particularly well defined. Although Figures 1B and 2B have been presented with only three slices for illustrative purposes, the clinical implementation was with 20 slices. This provides a smoother variation of TI across k-space (ie, 20 strips instead of three).
Patient Studies
With the approval of the research ethics committee of our institution, we studied 20 unselected patients (13 men and seven women, ages 16 to 78 years; mean age, 46 years) who were referred for MR imaging because of suspected disease of the brain (Table 1). All subjects had conventional and KRISP FLAIR sequences performed during the same examination and in the same slice position.
TABLE 1:
Diagnosis and lesion conspicuity in 20 patients imaged for suspected brain disease
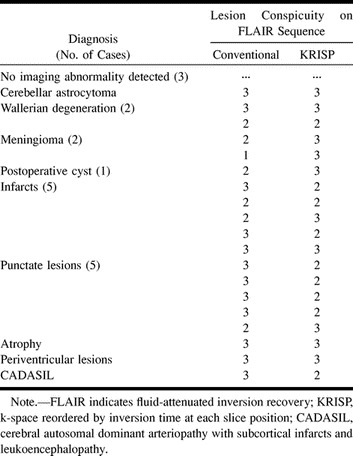
Brain images were obtained with a quadrature bird cage coil on a 1.0-T MR system. The following parameters were used for both the conventional and KRISP FLAIR sequences: TR/TE/excitations = 8142/135/1, TI or TIeff = 2250, field of view = 25 cm, slice thickness of all selective pulses = 7 mm, resolution = 128 × 256, number of slices = 20, and a numerically optimized initial sinc inversion pulse. The duration of each sequence was 13 minutes, 40 seconds. Conventional T2-weighted spin-echo (2500/20–80) sequences (10 minutes) and T1-weighted spin-echo (760/20) sequences (4 minutes) were performed before the FLAIR sequences in each case.
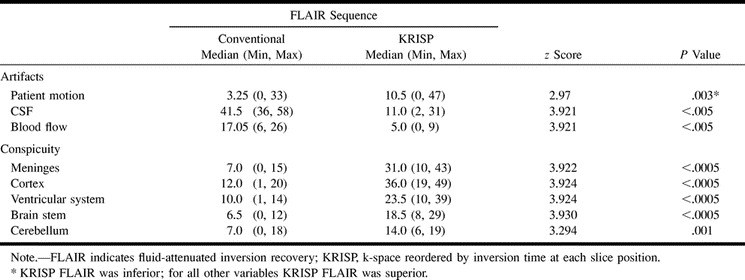
Artifacts from patient motion, CSF, and blood flow were evaluated, as was conspicuity of the meninges, cerebral cortex, ventricular system, brain stem, and cerebellum. These were assessed for each slice from both sequences for each of the 20 patients on a workstation by two experienced radiologists. Each of the eight variables was scored on a four-point scale, with 0 as the minimum. These values were then summed over the whole brain for each patient. The paired conventional and KRISP FLAIR ordinal values for each variable were then compared across all 20 patients by means of the Wilcoxon signed-rank test, using the SPSS version 9 package (25).
The lesion number as well as false-positive and false-negative results were noted. Lesion conspicuity was evaluated on the same four-point scale as for meninges, cerebral cortex, and so forth. Disagreements as to artifact visibility and lesion interpretation were resolved by review of all other imaging studies and the patients' clinical data. The radiologists' scores were averaged.
Results
Three patients had normal findings, and 19 diagnoses were made in the remaining 17 patients (Table 1). Table 2 shows median values with minimum and maximum scores in brackets for the eight variables assessed (patient motion, CSF, and blood flow artifacts as well as conspicuity of the meninges, cerebral cortex, ventricular system, brain stem, and cerebellum) for both the conventional and KRISP FLAIR pulse sequences. The conventional FLAIR sequence was superior to the KRISP FLAIR sequence for level of artifacts from patient motion. The KRISP FLAIR sequence was superior to the conventional sequence for each of the other seven variables (ie, the artifact scores for the KRISP FLAIR sequence were lower and the conspicuity scores were higher).
TABLE 2:
Descriptive statistics for artifacts and conspicuity (n = 20 in each case)
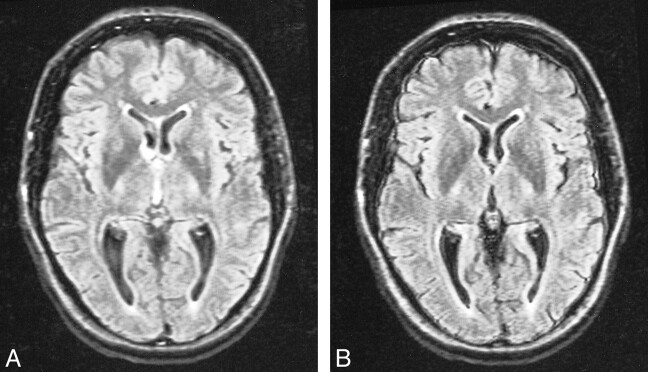
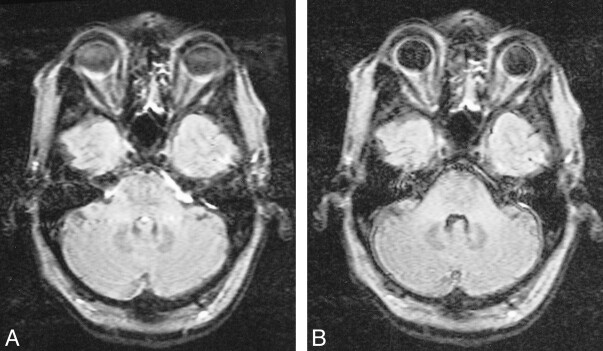
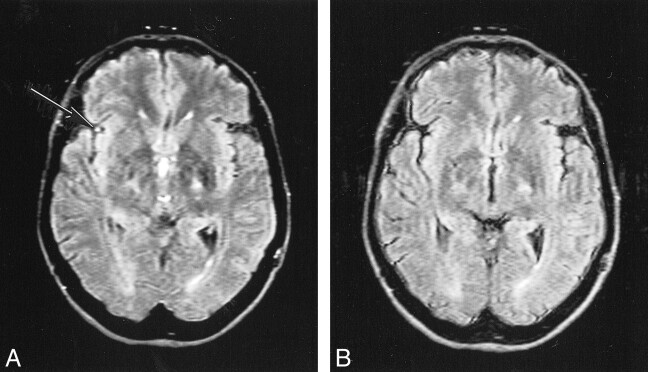
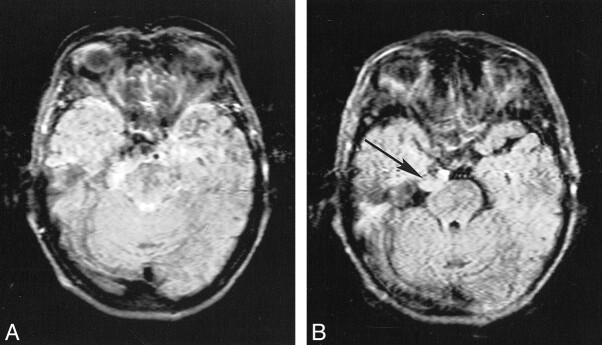
CSF artifacts (which mainly consisted of high signals due to flow, but also included effects due to inadequate inversion of magnetization and probable elevated CSF protein) were better controlled with the KRISP FLAIR sequence. CSF flow artifacts were most apparent with the conventional FLAIR sequence at the foramen of Munro, in the third ventricle (Fig 3), basal cisterns, aqueduct, and fourth ventricle, as well as around the brain stem and cerebellum (Fig 4). CSF signal was well controlled with the KRISP FLAIR sequence, except inferiorly, where uniform higher signal was seen in the region of the foramen magnum and inferior cerebellar folia. This was probably due to inadequate inversion of the CSF magnetization. Paradoxically, the reduction in CSF signal in the third ventricle defined the ventricular boundary better and in some cases was a source of ghost artifacts, which were propagated across the thalami.
fig 3.
Comparison of conventional (A) and KRISP (B) FLAIR images at level of third ventricle obtained with identical parameters 8142/135/1; TI = 2250. The CSF signal is higher in A than in B at the foramen of Munro and in the third ventricle. The meninges are more clearly seen in B.
fig 4.
Comparison of conventional (A) and KRISP (B) FLAIR images (8142/135/1; TI = 2250) at the level of the pons. In A there is high signal anterior to the pons as well as in the fourth ventricle and across the pons. This has been controlled in B, where the pons, cerebellum, and meninges are clearly seen
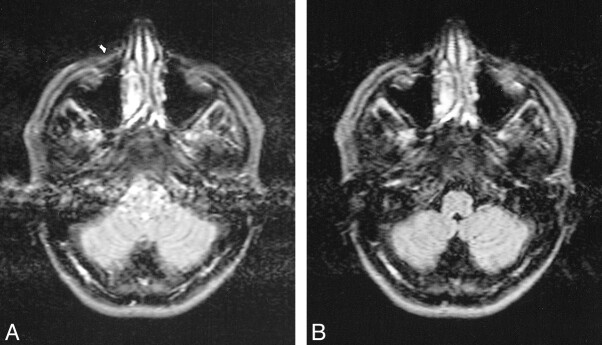
Blood flow artifacts were very apparent on the conventional FLAIR sequences in the phase-encoding (left-right) direction from the internal carotid, basilar, and vertebral arteries and to a small extent from the superior sagittal sinus. These were controlled with the KRISP FLAIR sequence (Fig 5). In nine of the 20 cases, high signal was seen in one or more of the sylvian branches of the middle cerebral artery with the conventional FLAIR sequence. This signal was absent on the KRISP FLAIR sequence (Fig 6). High signal was also frequently seen in the posterior cerebral arteries adjacent to the brain stem and the veins at the skull base with the conventional sequence but not with the KRISP version.
fig 5.
Comparison of conventional (A) and KRISP (B) FLAIR images (8142/135/1; TI = 2250) at the level of the medulla. High levels of artifact are seen from the vertebral arteries and the CSF on A. These are not seen on B.
fig 6.
Comparison of conventional (A) and KRISP (B) FLAIR sequences (8142/135/1; TI = 2250). High signal is seen in a sylvian branch of the middle cerebral artery on the right in A (arrow) but not in B.
The conspicuity of the meninges, cortex, ventricular system, brain stem, and cerebellum were all improved (see Figs 3–6), owing to better control of the CSF and blood flow artifacts as well as to an edge enhancement effect. Comparison of the number of lesions visualized revealed an extraaxial tumor that was only evident on the KRISP FLAIR sequence (Fig 7). No lesions were seen only with the conventional FLAIR sequence. Lesion conspicuity was reduced with the KRISP FLAIR sequence in six cases and increased in five cases (see Fig 8). Total lesion conspicuity was almost identical for each sequence (Table 1).
fig 7.
Extraaxial tumor (probably a meningioma) on conventional (A) and KRISP (B) FLAIR sequences (8142/135/1; TI = 2250). The tumor is difficult to see because of CSF artifacts on A, but is obvious on B (arrow)
fig 8.
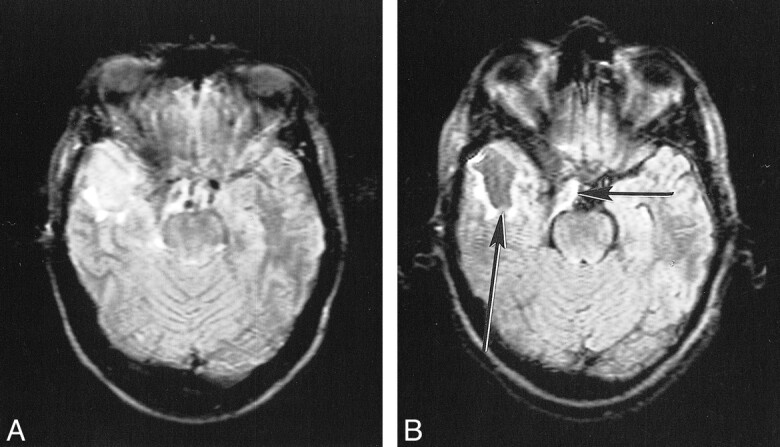
Postoperative cyst on conventional (A) and KRISP (B) FLAIR sequences (8142/135/1; TI = 2250). The cyst is of slightly increased signal in A but is of low signal in B (long arrow). The brain stem and partially resected meningioma (short arrow) are also better seen in B.
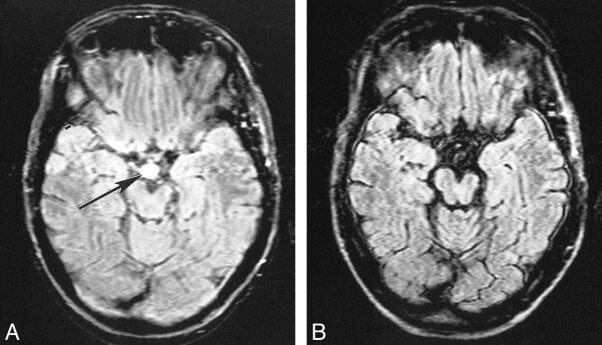
Lesions were designated as false-positive findings if they were only seen on one FLAIR sequence with no corroborating evidence from the other scans (T1- and T2-weighted) obtained at the same examination (or from other sources) and after full and repeated review by both radiologists. These included five apparent periventricular lesions and two apparent lesions in the suprasellar cistern (see Fig 9) that were only seen on the conventional FLAIR sequences. No false-positive findings were identified with the KRISP FLAIR sequence. (Scores were not assigned for false-positive lesions.)
fig 9.
False-positive finding on conventional (A) but not on KRISP (B) FLAIR sequence (8142/135/1; TI = 2250) in the suprasellar cistern. A high-signal lesion is seen on A (arrow) but not on B. It was not present on other sequence (SE 2500/20–80) or on transverse or sagittal T1-weighted sequences (SE 720/20). The left cerebral peduncle shows evidence of wallerian degeneration
Discussion
The KRISP FLAIR sequence produced a marked reduction in CSF flow artifacts, which was most evident at the foramen of Munro and in the third ventricle, basal cisterns, aqueduct, and fourth ventricle. There was also a marked reduction in blood flow artifacts. The meninges, cortex, ventricular system, brain stem, and cerebellum were all better visualized than with the conventional sequence. This was in spite of the increased level of patient motion artifacts seen with the KRISP FLAIR sequence. The increase in artifacts may have been due to some unintended feature of the sequence itself or to the fact that it was performed after the conventional sequence and at the end of the examination in 18 of 20 cases. (Patient motion artifacts are often greatest at the end of a long study such as this one.)
Blood flow artifacts were much reduced, which may have been due in part to more uniform inversion of rapidly flowing blood by the non–slice-selective inversion pulse. In addition, the slice firing order cycling inherent in the KRISP method may reduce the effects of inflow from adjacent slices by partially saturating flowing blood. Unlike CSF, the signal from blood is not nulled (it has a much shorter T1 than CSF; ie, 1000 vs 4500) and signal from slowly and uniformly flowing blood is readily seen in the cortical veins and in veins and sinuses at the skull base. The signal from pulsatile fast-flowing blood may be zero because of dephasing, but it may also be a source of artifacts.
The high signal in the sylvian branches of the middle cerebral artery has been proposed as an early sign of cerebral infarction when seen with a conventional FLAIR sequence (26), but this may arise as a false-positive finding because of inflow of blood with uninverted or only partially inverted magnetization with the conventional FLAIR sequence. This problem was eliminated by use of the KRISP FLAIR sequence.
The KRISP sequence applies a T1 filter to k-space because TI varies across k-space (see Fig 2B). Although CSF is nulled at the center of k-space, at the periphery, CSF contributes signal, which can enhance definition at brain/CSF and meninges/CSF interfaces. Increasing the number of slices and/or the TE increases this effect. This can be beneficial, particularly for small areas of abnormality and for lesions with well-defined boundaries, but if it is excessive it can result in an overshoot phenomenon and produce spurious high signal in the cortex. It is possible that this effect may increase the sensitivity of the sequence to subarachnoid hemorrhage beyond the theoretical limit suggested from calculations from the T1 and T2 values of brain and CSF containing blood (27).
The lack of a major advantage in lesion detection in this series may reflect the fact that only two patients had disease in the subarachnoid space or meninges, where a pronounced advantage might have been expected for the KRISP FLAIR sequence. The high signal seen in some cysts with the conventional FLAIR sequence may arise from inflow of fluid within the cysts and may be misinterpreted as evidence of proteinaceous fluid or hemorrhagic breakdown products producing a shortening of T1. It may also reflect the increased T1 weighting for very long T1 lesions with the KRISP FLAIR sequence. The partial volume effects and spurious high signal seen in periventricular regions with the conventional FLAIR sequence may arise as an edge effect from a selective 180° pulse giving incomplete inversion of CSF magnetization.
Other mechanisms of increased CSF signal in the region of the subarachnoid space and ventricular system besides CSF inflow were still manifest. Uniform nonzero signal was seen in the CSF in the region of the foramen magnum in several cases. This was probably due to inhomogeneity of the B1 field in this region with incomplete inversion of the CSF magnetization (28). This problem can be avoided by use of adiabatic inversion pulses, which are tolerant of B1 amplitude variation (29). Such a solution is valid equally for a slice-selective inversion, such as is used in a conventional FLAIR sequence, and for a nonselective inversion, as used in the present KRISP FLAIR sequence. In cases of glioma, in which there may have been high CSF protein content, high signal was seen in the inferior aspect of the cerebellum. This may have been due to a combination of inadequate pulse inversion (as above) and shortening of the T1 of CSF. Other causes of high signal in the subarachnoid space included susceptibility and chemical shift artifacts as well as anatomic structures, such as the choroid plexus, cranial nerves, pituitary stalk, and arachnoid villi.
In relation to other approaches to obtaining heavily T2-weighted images of the brain with CSF suppression, a 3D FLAIR sequence in principle allows the use of a non–slice-selective 180° initial pulse but in the only implementation so far reported, a series of slab excitations was used with a slice-selective 180° pulse (eg, 15-mm slice thickness) (30) phase encoded into a series of narrower partitions (eg, 1.5 mm). This was still subject to CSF inflow effects. Another approach to CSF suppression with T2-weighted imaging is the high-intensity reduction sequence (31), in which a late-echo image (mainly due to CSF signal) is subtracted from an early-echo image in the FSE acquisition. As initially implemented, the clinical results were inferior to a FLAIR sequence for lesion detection but superior for artifact control. The method is being developed further. Diffusion-weighted imaging (DWI) characteristically produces a low signal in CSF in spite of the heavy T2 weighting of the sequence as a consequence of the free diffusion of water molecules in CSF. DWI resembles FLAIR imaging in this regard (ie, the low signal in CSF) (32). However, CSF suppression in DWI may be incomplete, and a combination of FLAIR and DWI may lead to more accurate values of the apparent diffusion coefficient in the brain by providing more complete suppression of the CSF signal (33, 34).
A disadvantage of the present KRISP FLAIR implementation is that, like the conventional FLAIR sequence, it is slow. Using a faster acquisition technique, such as the FSE sequence, could reduce imaging time. The practicalities of implementing such a version of the KRISP FLAIR sequence are the subject of current study. Simulations of sequence properties for brain and CSF suggest that this approach is likely to be effective.
Conclusion
This study establishes a proof in principle that the KRISP FLAIR sequence can suppress confusing CSF and blood flow artifacts and improve the conspicuity of the meninges, cortex, brain stem, and cerebellum. Further clinical studies with a faster version of the sequence in more specific groups of patients will be necessary to determine its clinical utility.
Footnotes
Support provided by Marconi Medical Systems.
Address reprint requests to Graeme M. Bydder, MD.
References
- 1.De Coene B, Hajnal JV, Gatehouse P, et al. MR of the brain using fluid attenuated inversion recovery (FLAIR) pulse sequences. AJNR Am J Neuroradiol 1992;13:1555-1564 [PMC free article] [PubMed] [Google Scholar]
- 2.Rydberg JN, Hammond CA, Grimm RC, et al. Initial clinical experience in MR imaging of the brain with a fast fluid-attenuated inversion-recovery pulse sequence. Radiology 1994;193:173-180 [DOI] [PubMed] [Google Scholar]
- 3.Hashemi RH, Bradley WG, Chen DY, et al. Suspected multiple sclerosis: MR imaging with a thin-section fast FLAIR pulse sequence. Radiology 1995;196:505-510 [DOI] [PubMed] [Google Scholar]
- 4.Baratti C, Barkhof F, Hoogenraad F, Valk J. Partially saturated fluid attenuated inversion recovery (FLAIR) sequences in multiple sclerosis: comparison with fully relaxed FLAIR and conventional spin-echo. Magn Reson Imaging 1995;13:513-521 [DOI] [PubMed] [Google Scholar]
- 5.Brant-Zawadzki M, Atkinson D, Detrick M, Bradley WG, Scidmore G. Fluid-attenuated inversion recovery (FLAIR) for assessment of cerebral infarction: initial clinical experience in 50 patients. Stroke 1996;27:1187-1191 [DOI] [PubMed] [Google Scholar]
- 6.Alexander JA, Sheppard S, Davis PC, Salverda P. Adult cerebrovascular disease: role of modified rapid fluid-attenuated inversion-recovery sequences. AJNR Am J Neuroradiol 1996;17:1507-1513 [PMC free article] [PubMed] [Google Scholar]
- 7.Tubridy N, Barker GJ, Macmanus DG, Moseley IF, Miller DH. Three-dimensional fast fluid attenuated inversion recovery (3D fast FLAIR): a new MRI sequence which increases the detectable cerebral lesion load in multiple sclerosis. Br J Radiol 1998;71:840-845 [DOI] [PubMed] [Google Scholar]
- 8.Oskuda T, Koragi Y, Shigematsu Y, et al. Brain lesion: when should fluid attenuated inversion recovery sequences be used in MR evaluation? Radiology 1999;212:793-798 [DOI] [PubMed] [Google Scholar]
- 9.Melhem ER, Bert RJ, Walker RE. Usefulness of optimized gadolinium-enhanced fast fluid-attenuated inversion recovery MR imaging in revealing lesions of the brain. AJR Am J Roentgenol 1998;171:803-807 [DOI] [PubMed] [Google Scholar]
- 10.Essig M, Schoenberg SO, Hawighorst H, et al. Cerebral gliomas and metastases: assessment with contrast-enhanced fast fluid-attenuated inversion-recovery MR imaging. Radiology 1999;210:551-557 [DOI] [PubMed] [Google Scholar]
- 11.Mathews VP, Caldemyer KS, Lowe MJ, Greenspan SL, Weber DM, Ulmer JV. Brain: gadolinium-enhanced fast fluid attenuated inversion recovery MR imaging. Radiology 1999;211:256-263 [DOI] [PubMed] [Google Scholar]
- 12.Soong JC, Bradley WG, Chen D, Atkinson DJ, Teresi LM, Teich DL. Gadolinium enhanced FLAIR is the best MR technique for detecting some cortical processes. Radiology 1998;209(P):426 [Google Scholar]
- 13.Noguchi K, Ogawa T, Inugami A, et al. Acute subarachnoid hemorrhage: MR imaging with fluid-attenuated inversion recovery pulse sequences. Radiology 1995;196:173-177 [DOI] [PubMed] [Google Scholar]
- 14.Noguchi K, Ogawa T, Seto H, et al. Subacute and chronic subarachnoid hemorrhage: diagnosis with fluid-attenuated inversion recovery MR imaging. Radiology 1997;203:257-262 [DOI] [PubMed] [Google Scholar]
- 15.Singer MB, Atlas SW, Drayer BP. Subarachnoid space disease: diagnosis with fluid attenuated inversion-recovery MR imaging and comparison with gadolinium-enhanced spin-echo MR imaging: blinded reader study. Radiology 1998;208:417-422 [DOI] [PubMed] [Google Scholar]
- 16.Campbell BG, Comunale JP, Kelly LH, Zimmerman RD. The subarachnoid space on fluid attenuated inversion recovery MR: all that is bright is not hemorrhage and all that is dark is not cerebrospinal fluid. In: Proceedings of the 36th annual meeting of the American Society of Neuroradiology, Philadelphia, May 17–21 1998. Oak Brook, IL: American Society of Neuroradiology; 1998;417
- 17.Williams RL, Fukai MB, Tishkoff NW, Kanal E. MR imaging of the subarachnoid space utilizing FLAIR: pathology and pitfalls. Radiology 1999;213(P):552 [Google Scholar]
- 18.Villa J, Akhtar N, Boyko OB, Memisoglu E. Imaging pitfalls in the clinical utilization of post contrast magnetization transfer and fluid attenuated inversion recovery. In: Proceedings of the 36th annual meeting of the American Society of Neuroradiology, Philadelphia, May 17–21, 1998. Oak Brook, IL: American Society of Neuroradiology 1998;417
- 19.Yousem DM, Wu H. Artifacts in the basal cisterns: the downfall of FLAIR. Radiology 1999;213(P):145 [Google Scholar]
- 20.Bakshi R, Caruthers SD, Janardhan V, Wasay M. Intraventricular CSF pulsation artifact on fast fluid-attenuated inversion-recovery MR images: analysis of 100 consecutive normal studies. AJNR Am J Neuroradiol 2000;21:503-508 [PMC free article] [PubMed] [Google Scholar]
- 21.Hajnal JV, De Coene B, Lewis PD, et al. High signal regions in normal white matter shown by heavily T2-weighted CSF nulled inversion recovery sequences. J Comput Assist Tomogr 1992;16:506-513 [DOI] [PubMed] [Google Scholar]
- 22.De Coene B, Hajnal JV, Pennock JM, Bydder GM. MRI of the brain stem using fluid-attenuated inversion-recovery pulse sequences. Neuroradiology 1993;35:327-331 [DOI] [PubMed] [Google Scholar]
- 23.White SJ, Hajnal JV, Young IR, Bydder GM. Use of fluid-attenuated inversion recovery pulse sequences for imaging the spinal cord. Magn Reson Med 1992;28:153-162 [DOI] [PubMed] [Google Scholar]
- 24.Norris DG. Reduced power multislice MDEFT imaging. J Magn Reson Imaging 2000;11:445-451 [DOI] [PubMed] [Google Scholar]
- 25. SPSS for Windows.. Chicago: SPSS Inc 1998;
- 26.Toyoda K, Ida M, Futuda S. FLAIR intraarterial signal: an early sign of hyperacute cerebral ischaemia. In: Proceedings of the 38th annual meeting of the American Society of Neuroradiology, Atlanta, April 3–8, 2000. Oak Brook, IL: American Society of Neuroradiology 2000;233
- 27.Noguchi K, Seto H, Kamiski Y, Tomizang G, Toyoshima S, Watanabe N. Comparison of fluid attenuated inversion recovery MR imaging with CT in a simulated model of subarachnoid hemorrhage. AJNR Am J Neuroradiol 2000;21:923-927 [PMC free article] [PubMed] [Google Scholar]
- 28.Hajnal JV, Oatridge Herlihy AH, Bydder GM. Reduction in artifacts on FLAIR imaging by use of adiabatic inversion pulses: a technical report. AJNR Am J Neuroradiol (in press) [PMC free article] [PubMed]
- 29.Silver MS, Joseph RI, Hoult DI. Highly selective π/2 and π pulse generation. J Magn Reson Med 1984;59:347-351 [Google Scholar]
- 30.Barker GJ. 3D for FLAIR: a CSF nulled 3D fast spin echo pulse sequence. Magn Reson Imaging 1998;16:715-720 [DOI] [PubMed] [Google Scholar]
- 31.Essig M, Deimling M, Hawighorst H, Debus J, van Kiack G. Assessment of cerebral gliomas by a new dark fluid sequence, high intensity reduction (HIRE): a preliminary study. J Magn Reson Imaging 2000;11:506-517 [DOI] [PubMed] [Google Scholar]
- 32.Oatridge A, Hajnal JV, Cowan FM, Baudouin CJ, Young IR, Bydder GM. MRI diffusion weighted imaging of the brain: contribution to image contrast from CSF signal reduction, use of a long echo time and diffusion effect. Clin Radiol 1993;47:82-90 [DOI] [PubMed] [Google Scholar]
- 33.Falconer JC, Naryana PA. Cerebrospinal fluid-suppressed high-resolution diffusion imaging of human brain. Magn Reson Med 1997;3:119-123 [DOI] [PubMed] [Google Scholar]
- 34.Hirsch JG, Bock M, Essig M, Schol LR. Comparison of diffusion anisotropy measurements in combination with the FLAIR technique. Magn Reson Imaging 1999;17:705-716 [DOI] [PubMed] [Google Scholar]


