

Abstract
BACKGROUND AND PURPOSE: Various methods for evaluating the lateralization of linguistic function using functional MR imaging have been proposed. However, the optimal method remains controversial. The purpose of this study was not only to establish a method for quantitatively evaluating the lateralization of linguistic function but also to evaluate its optimality.
METHODS: Internal speech tasks were measured by functional MR imaging in 17 healthy adult volunteers by use of z scores. The laterality index (LI) was calculated first by a previously reported method and second by our newly designed method, in which we investigated the correlation between the z scores and the number of activated pixels in the regions of interest; that is, we made scatter diagrams (z scores versus number of activated pixels). To obtain detailed information, we searched a regression function that fit the scatter diagrams well.
RESULTS: We found the number of activated pixels was proportional to (1/z score)4 and the correlation coefficient was very high. Each hemisphere showed an original proportional constant. Our newly designed LI was calculated from these two constants and was found to be a fixed value. In contrast, the reported LI varied with the z score. We found our LI differed in robustness and reproducibility from the reported LI.
CONCLUSION: Our LI method proved more optimal than the reported LI. The lateralization of linguistic function can be evaluated quantitatively using our new LI method.
It is important in the field of neurosurgery to preoperatively determine the hemisphere dominant for speech, because this knowledge can be used to reduce surgical complications. The Wada test, developed in 1949, measures the relative lateralization of linguistic and memory functions across the two hemispheres with anesthesia of one hemisphere induced by intraarterial administration of sodium amobarbital (1, 2). The Wada test has been used to identify the speech-dominant hemisphere in many patients, and its reliability has been confirmed. However, despite its utility, the Wada test has the following four drawbacks: the angiographic procedure can cause complications (3); repeated examination is impossible; precise evaluation is difficult in patients with an azygous cerebral blood supply pattern or arterial cross-flow (4); and only three grades of lateralization are used, left-dominant, right-dominant, and bilateral (1, 2). The lateralization of linguistic function in particular must be evaluated on a continuous scale, since the lateralization and distribution of linguistic function vary widely among individuals (5–8).
Functional MR imaging is a useful technique in that it is not invasive, it is independent of the flow pattern, and it can document lateralization on a continuous scale. Functional MR imaging is based on MR signal changes associated with neural activities. These MR signal changes are called blood oxygen level–dependent differences, and are produced by both increases in regional blood flow and decreases in deoxyhemoglobin (9).
Several functional MR imaging studies concerning language processes have been reported (10–14), and various methods for evaluating the lateralization of linguistic function have been proposed. However, the optimal method for evaluating the lateralization of linguistic function remains controversial (15–20). A suitable method should have the following three criteria: robustness (results do not vary with parameters), the capability of intersubject comparison, and reproducibility (21). The methods reported thus far have not been examined in terms of these three criteria. For data analysis (primarily, cross-correlation analysis), both the z score and t-test methods have been used. In the present study, we used z scores. The laterality index (LI) (obtained by a formula reported in the Methods section) varied with the z score in our study, and for this reason, it was difficult to evaluate lateralization quantitatively by the z score method previously reported in functional MR imaging studies (16, 19, 20). The drawback of this method was that LI was calculated from a simple above-threshold pixel count, whereas we found it of greater value to use more of the data. We describe our attempt to establish a method for quantitatively evaluating lateralization of linguistic function on a continuous scale by functional MR imaging using the z score, and evaluate our new method according to the three criteria of optimality defined above.
Methods
Subjects
Seventeen consecutive right-handed healthy adult subjects (16 men and one woman; 20–39 years old) were recruited for this study; of these, six (subjects 12–17) were recruited for the investigation of reproducibility (see Table 1). Subjects gave written informed consent for functional MR imaging. Hand preference was assessed by the Edinburgh Handedness Inventory (EDI) (22), in which subjects were asked to indicate hand preference for each of the 12 EDI items, and a handedness score was obtained for each subject. EDI scores varied from +100 to −100%, with +100% meaning right-handedness and −100% meaning left-handedness. A subject was excluded if the EDI score was negative.
TABLE 1:
Number of activated pixels in each region of interest (ROI) and laterality index values obtained by two methods
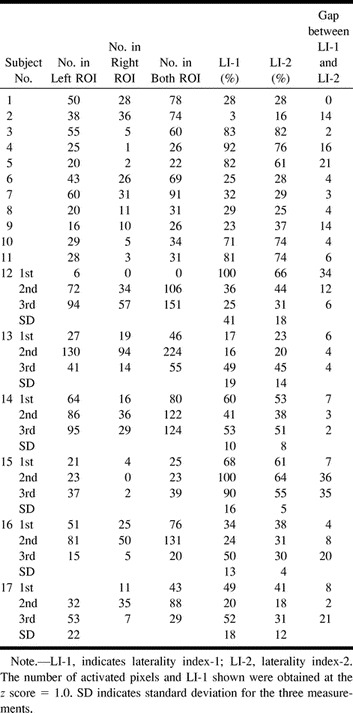
Image Acquisition
The subjects were informed of the purpose and meaning of the examination before imaging. Images were obtained on a 1.5-T MR unit with a gradient-echo echo-planar sequence with the following parameters: TR/TE (repetition time/echo time) = 2265/64, flip angle = 90°, field of view = 300 mm, matrix = 84 × 128, slice thickness = 10 mm, scan time = 180 ms. Three contiguous axial slices were obtained parallel to a reference line through the superior edge of the anterior commissure and the inferior of the posterior commissure. These slices covered the pars opercularis (Brodmann's areas 44 and 45) (23). The subjects underwent seven alternating periods of a rest and a silent linguistic stimulation task. During each of the four rest periods and three task periods, 10 images were obtained for every slice. Thus, 70 images per slice were acquired. During the imaging examination, the room light was dimmed and the subject's head was fixed tightly with foam pads bilaterally to minimize motion artifacts. Subjects were instructed to close their eyes and to keep their head and eyes still.
Task Design
The word generation task was performed silently through internal speech. During the task periods, the subjects were asked to generate and “say” silently as many words as possible that were associated with the first word announced through an intercom at the beginning of the task period. The subjects were instructed to finish the task period when the word end was announced through an intercom. During the rest periods, the subjects were asked to rest and concentrate on their breathing. After the experiment, subjects were asked whether they believed they had performed the task successfully. If their answer was negative, the examination was repeated.
Data Analysis
Before carrying out the data analysis, we discarded the first two images of each period, because activation/deactivation typically lags several seconds behind stimulus onset/termination (24). Thus, 56 of the 70 images per slice were used.
Significant signal changes were identified by the z score (25–28), which was calculated using the following formula:
where Mt is the mean signal during task periods, Mr is mean signal during rest periods, δt is the standard deviation (SD) during task periods, δr is the SD during rest periods, Nt is the image number during task periods, and Nr is the image number during rest periods.
No correction was made for head motion, and no additional filtering or clustering algorithm was used. The pixels that were found to be significantly activated were superimposed on the T1-weighted structural images obtained with a spin-echo sequence (500/12/2). The number of activated pixels was counted using Numaris software supplied by the manufacturer (Siemens).
Evaluation of Lateralization
For the evaluation of the lateralization of linguistic function, the LI was calculated by two methods: first by a method (LI-1) reported previously (16, 19, 20) and second by our new method (LI-2), which we describe here. The regions of interest (ROIs) were drawn on the superimposed images, focusing on the pars opercularis (Brodmann's areas 44 and 45) rather than on Wernicke's area, because there is no consensus as to where Wernicke's area is located (29–31).
LI-1 Method
With this method, we kept the z score uniform in all subjects, and the number of activated pixels was measured in each ROI (ie, the left pars opercularis and the right pars opercularis). LI-1 was calculated using the following formula:
 |
where Nl is the number of activated pixels in the left ROI, and Nr is the number of activated pixels in the right ROI.
LI-2 Method
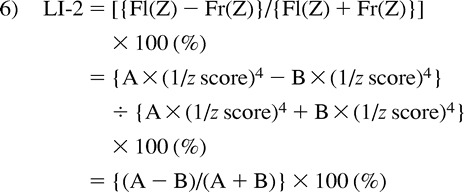
With this method, to first determine the correlation between the z scores and the number of activated pixels in each ROI, we made a scatter diagram in which the x-axis represented the z scores and the y-axis represented the number of activated pixels (Fig 1). Robust and more detailed information could be obtained by fitting these ROI concave curves into a regression function. All functions fitting these ROI concave curves well could be used, but it was not possible to calculate a correlation coefficient between these ROI concave curves for all functions. A function having few parameters is ideal for calculating LI-2; in other words, a monomial expression is more suitable than a polynomial expression, because it is difficult to select one parameter to represent a particular value if the function has many parameters. We therefore chose (1/z score)n as the particular function. We transformed each of the z scores into (1/z score)n to calculate regression equations, and we investigated the correlation coefficient between (1/z score)n and the number of activated pixels. The mean correlation coefficient differences were compared statistically using the Friedman test. We used the function that had the highest correlation coefficient. We then calculated the regression equations of the two curves from Figure 1. LI-2 was calculated using the following formula:
 |
where Fl(Z) is the regression equation that was calculated from the curve of the left ROI, and Fr(Z) is the regression equation that was calculated from the curve of the right ROI. LI-1 and LI-2 varied from +100 to −100%, in which +100% indicates left hemisphere dominance and −100% indicates right hemisphere dominance.
fig 1.

A and B, Scatter diagrams for subjects 5 (A) and 10 (B). Circles indicate the values for the left ROI; squares, for the right ROI
To compare the LI-1 method with the LI-2 method for reproducibility (degree of variation), we performed three functional MR imaging measurements at different times and on different days in six subjects (subjects 12–17), and the LI was obtained by both methods. A scatter plot of LI-1 versus LI-2 for all six subjects was made, and the SD between LI-1 and LI-2 for the three measurements was obtained for each subject (see Table). The SD between LI-1 and LI-2 was compared statistically using a Wilcoxon signed rank test.
Results
EDI scores were positive for all subjects. The mean EDI score was 90 ± 5(%) (mean ± SD); all subjects were considered strongly right-handed. All subjects performed the internal speech task successfully, and all showed evidence of a focal MR signal increase in the pars opercularis. The LI-1 and LI-2 scores were positive for all subjects, and we found that language lateralization was to the left in all subjects (see Table).
LI-1
The number of activated pixels in each ROI varied meaningfully with the z score (Fig 1); that is, the number depended on the z score. LI-1 was obtained from the number of activated pixels in the right and left ROIs, assuming that the z score was a fixed value (eg, z score = 1.0). The number of activated pixels at threshold z = 1.0 in each ROI varied among subjects, showing a marked variation in activation grade among subjects (see Table). Within the same subject, LI-1 varied with the z score. At higher thresholds, LI-1 reached 100%, because the number of activated pixels in the right ROI became too small (Fig 2). Therefore, we confirmed that LI-1 varied markedly and was dependent on the z score. A threshold in the relatively flat part of LI-1 versus the threshold (a cross-correlation method) has been reported (16); however, such a threshold in the z score could not be determined from our results.
fig 2.
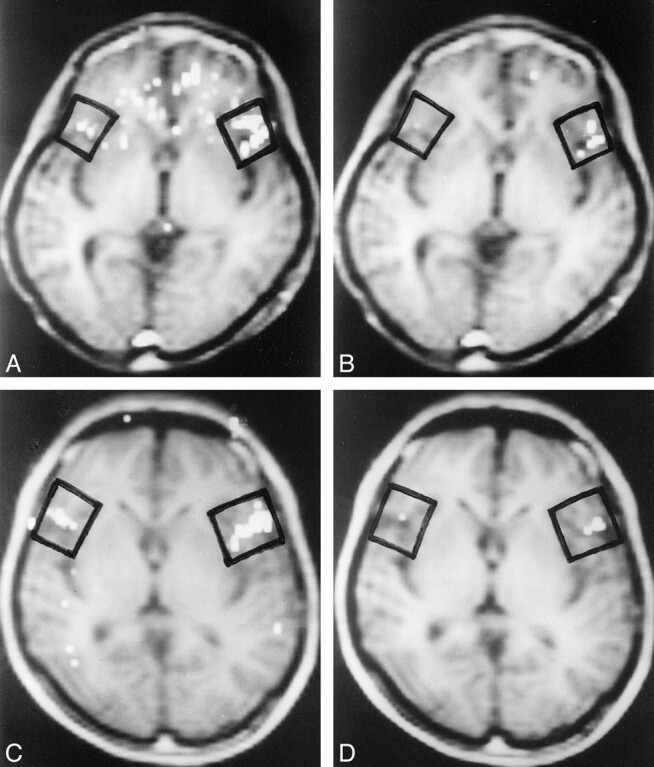
A–D, Brain activity images (viewed from below) of subject 5 at thresholds 1.0 (A) and 1.5 (B) and of subject 10 at thresholds 1.0 (C) and 1.5 (D). Black boxes indicate ROIs
LI-2
The scatter diagrams (in which the x-axis represents the z scores and the y-axis the number of activated pixels) showed similar concave curves in all subjects, regardless of the difference in the grade of activation. We chose (1/z score)n as the particular function. When the value of n ranged from 1 to 10, the correlation coefficient between (1/z score)n and the number of activated pixels was very high. A Friedman test revealed that the mean correlation coefficient differences for both sides, for the left side, and for the right side were statistically significant (P < .0001). The mean correlation coefficients for both sides, for the left side, and for the right side showed a maximum at n = 4. The mean values at n = 4 for both sides, for the left side, and for the right side were .989 ± .006 (mean ± SD), .988 ± .12, and .989 ± .009, respectively (Fig 3). We therefore used (1/z score)4 as the function. Because the value of the correlation coefficient was very high, regression functions of the concave curves could be calculated with the following formulas (Fig 4).
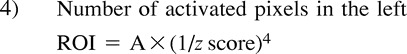 |
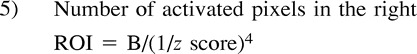 |
where A and B are the fixed values calculated from the scatter diagrams.
fig 3.
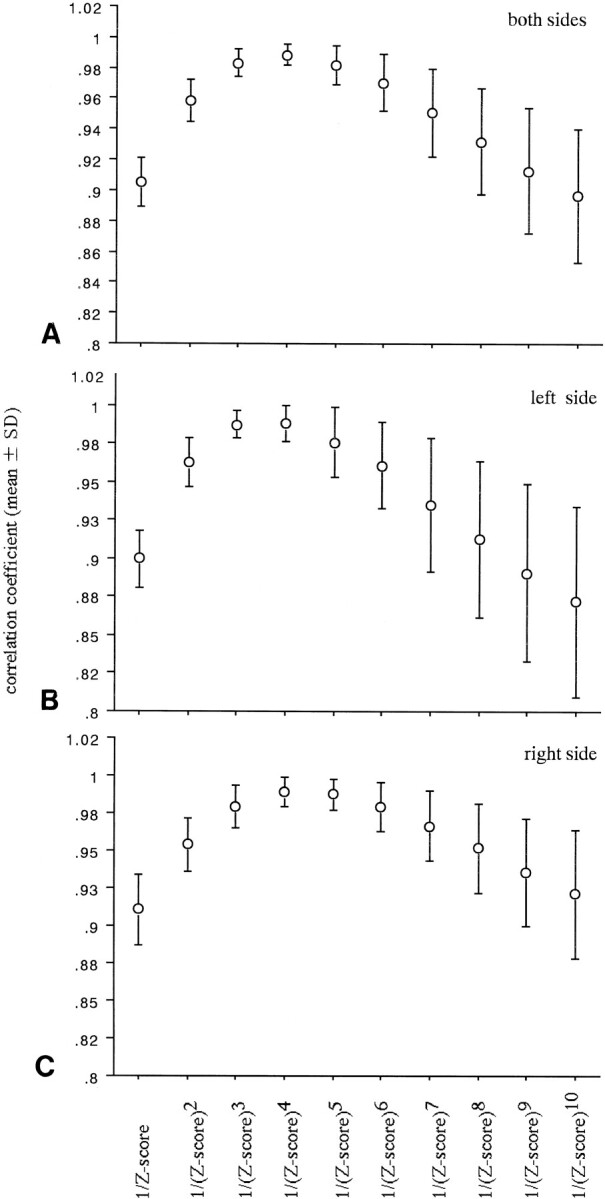
A–C, The mean correlation coefficient between (1/z score), (1/z score)2. . . (1/z score)10, and the number of activated pixels for all subjects on both sides (A), on the left side (B), and on the right side (C)
fig 4.

A and B, The regression line of subjects 5 (A) and 10 (B). Circles indicate the left ROI; squares, the right ROI. The underlined fixed values indicate the regression coefficient of the regression line for each ROI (regression analysis, R; correlation coefficient)
In nearly all 17 subjects, a difference in the number of plots of concave curves (ie, in the df between the two ROI curves) was observed. For example, in subject 5, the df of the left ROI curve was 27 and that of the right ROI curve was 10. However, there was a negligible difference in the correlation coefficient between the two ROI curves, which was very high. We therefore surmised that there was no significant difference in the reliability between the fixed values A and B used in the above formulas.
LI-2 was calculated using the following formula:
 |
Thus, LI-2 was a fixed value and independent of the z score, and we were able to evaluate lateralization independent of the z score. The values of A and B did not change significantly when the number of the plots of the concave curves was changed.
A relationship between LI-1 and LI-2 was observed. The gap between the two indexes tended to be larger when the number of activated pixels in both ROIs was small (Table and Fig 5).
fig 5.

Scatter plot shows gap between LI-1 and LI-2 (regression analysis, r2 = .244, P < .01, n = 28)
When comparing the two LI methods for reproducibility, the scatter plots of LI-1 versus LI-2 scores for six subjects indicated a slight slant (Fig 6), and the SD of the LI-2 scores was statistically smaller than that of the LI-1 scores (Wilcoxon signed rank test, P < .05).
fig 6.

Scatter plot for LI-1 versus LI-2 for subjects 12 through 17
Discussion
In this study, we evaluated lateralization of linguistic function on a continuous scale with both the well-known LI-1 method and our new LI-2 method. A suitable and useful medical examination should meet the following three criteria: 1) the results from the examination should represent robust information about the subject, 2) the results should be easily compared across subjects, and 3) the examination should have good reproducibility (21). The LI-1 scores of our subjects were found to vary with the z score. In this regard, the LI-1 method did not meet the first criterion.
Because the number of activated pixels at a certain threshold varied among subjects, it may be that the reliability of the LI-1 scores differed, even when those scores were the same. For example, in one subject, the number of activated pixels in the left ROI was 40 and the number in the right ROI was 20; the subject's LI-1 score was therefore 33%. In another subject, the number in the left ROI was 4 and the number in the right ROI was 2; this subject's LI-1 score was therefore also 33%. The LI-1 scores were the same, but the reliability of LI-1 differed (ie, it was higher in the first subject). Therefore, it was not possible to compare the two LI-1 scores, and therefore, the LI-1 method did not meet the second criterion described above.
For the calculation of LI-2, we made scatter diagrams. Interestingly, the scatter diagrams showed similar concave curves in all subjects. We thought that the concave curves were unique to functional MR imaging using the z score, and that each concave curve represented robust and more detailed information. The two regression coefficients of the regression lines were calculated from the scatter diagram. The regression coefficient of the regression line represented the rate of decrease of the activated pixels. LI-2 yielded the difference between the rate of decrease in the left hemisphere and that in the right hemisphere. LI-2 was a fixed figure, independent of the z score and thus, LI-2 was believed to represent a quantitative lateralization across the two hemispheres. The LI-2 method was thought to meet the first criterion, concerning robust information.
The reliability of LI-2 did not differ even if the regression coefficient of the regression line differed significantly among subjects, because each regression coefficient was based on a sufficient amount of information. The LI-2 method was thus thought to meet the second criterion regarding intersubject comparisons. As for reproducibility, the LI-2 method was found to be more suitable than the LI-1 method, even though the three LI-2 scores of several subjects differed somewhat. The intrasubject variability in LI might be attributed to the inherent variability in the subjects' responses, but we were not able to identify the cause of intrasubject variability in this study.
The LI-2 method differed from the LI-1 method in its ability to evaluate weak activated pixels. The LI-1 method could not evaluate the weak activated pixels. The functional MR imaging technique has been used to localize the centers of primary functions, such as motor, sensory, and visual functions. For localizing such a functional center, it is necessary to set the threshold (z score) at a high value to exclude secondarily activated areas. It is, however, not appropriate to set too high a threshold, because many true and weak activated pixels might be missed. We suspected that weak activated pixels played an important role in language function. LI-2 was calculated on the basis of both weak and strong activated pixels (ie, on the concave curves). To our knowledge, the LI-2 method thus met all three criteria for a useful medical examination.
Conclusion
In evaluating the lateralization of linguistic function, we found that a comparison of the number of activated pixels at only one threshold was not a correct method, since the correlation between the two hemispheres regarding the number of activated pixels at one threshold did not always represent the correlation at another threshold. Therefore, we established a more suitable method by fitting the concave curve from the scatter diagrams into a function to allow more robust and detailed information. In this study, (1/z score)4 was found to be the optimal function with the highest correlation coefficient. We did not create a theoretical foundation for selecting (1/z score)4 as the function; therefore, it might be possible that another function exists that would fit the concave curve better than (1/z score)4. At the least, we strongly believe that a comparison of the concave curves between the two hemispheres is a more accurate, sound, and reliable method than a comparison of the number of activated pixels at only one threshold.
Footnotes
Address reprint requests to Shun-ichi Nagata, MD.
References
- 1.Wada J. A new method for the determination of the side of cerebral speech dominance: a preliminary report on the intracarotid injection of sodium amytal in man [in Japanese]. Igaku Seibutugaku (Med Biol) 1949;14:221-222 [Google Scholar]
- 2.Wada J, Rasmussen T. Intracarotid injection of sodium amytal for the lateralization of cerebral speech dominance. J Neurosurg 1960;17:266-282 [DOI] [PubMed] [Google Scholar]
- 3.Dion JE, Gates PC, Fox AJ, Barnett HJ, Blom RJ. Clinical events following neuroangiography: a prospective study. Stroke 1987;18:997-1004 [DOI] [PubMed] [Google Scholar]
- 4.Hietala SO, Silfvenius H, Aasly J, Olivecrona M, Jonsson L. Brain perfusion with intracarotid injection of 99mTc-HM-PAO in partial epilepsy during amobarbital testing. Eur J Nucl Med 1990;16:683-687 [DOI] [PubMed] [Google Scholar]
- 5.Strauss E, Wada J, Goldwater B. Sex differences in intrahemispheric reorganization of speech. Neuropsychologia 1992;30:353-359 [DOI] [PubMed] [Google Scholar]
- 6.Satz P, Strauss E, Wada J, Orsini DL. Some correlates of intra- and interhemispheric speech organization after left focal brain injury. Neuropsychologia 1988;26:345-350 [DOI] [PubMed] [Google Scholar]
- 7.Sano Y, Kato M, Kojima T. Long-term assessment of aphasia [in Japanese]. Situgosyokenkyu 1996;16:123-133 [Google Scholar]
- 8.Dichowny M, Jayakar P, Harvey AS, et al. Language cortex representation: effects of developmental versus acquired pathology. Ann Neurol 1996;40:31-38 [DOI] [PubMed] [Google Scholar]
- 9.Ogawa S, Lee TM, Nayak AS, Glynn P. Oxygenation-sensitive contrast in magnetic resonance image of rodent brain at high magnetic fields. Magn Reson Med 1990;14:68-78 [DOI] [PubMed] [Google Scholar]
- 10.Binder JR, Rao SM, Hammeke TA, et al. Lateralized human brain language systems demonstrated by task subtraction functional magnetic imaging. Arch Neurol 1995;52:593-601 [DOI] [PubMed] [Google Scholar]
- 11.Pugh KR, Shaywitz BA, Shaywitz SE, et al. Cerebral organization of component processes in reading. Brain 1996;119:1221-1238 [DOI] [PubMed] [Google Scholar]
- 12.Binder JR, Hammeke JA, Rao SM, Cox RW. Function of the left planum temporale in auditory and linguistic processing. Brain 1996;119:1239-1247 [DOI] [PubMed] [Google Scholar]
- 13.Cuenod CA, Bookheimor SY, Hertz-Pannier L, Zeffiro TA, Theodore WH, Bihan DL. Functional MRI during word generation using conventional equipment: a potential tool for language localization in the clinical environment. Neurology 1995;45:1821-1827 [DOI] [PubMed] [Google Scholar]
- 14.Kim KHS, Relkin NR, Lee KM, Hirsch J. Distinct cortical areas associated with native and second languages. Nature 1997;388:171-174 [DOI] [PubMed] [Google Scholar]
- 15.Hertz-Pannier L, Gaillard WD, Mott SM, et al. Noninvasive assessment of language dominance in children and adolescents with functional MRI: a preliminary study. Neurology 1997;48:1003-1012 [DOI] [PubMed] [Google Scholar]
- 16.Binder JR, Swanson SJ, Hammeke TA, et al. Determination of language dominance using functional MRI: a comparison with the Wada test. Neurology 1996;46:978-984 [DOI] [PubMed] [Google Scholar]
- 17.Desmond JE, Sum JM, Wagner AD, et al. Functional MRI measurement of language lateralization in Wada-tested patients. Brain 1995;118:1411-1419 [DOI] [PubMed] [Google Scholar]
- 18.Bahn MM, Lin W, Silbergeld DL, Miller JW, et al. Localization of language cortices by functional MR imaging compared with intracarotid amobarbital hemispheric sedation. AJNR Am J Neuroradiol 1997;169:575-579 [DOI] [PubMed] [Google Scholar]
- 19.Hinke RM, Hu X, Stillman AE, et al. Functional magnetic resonance imaging of Broca's area during internal speech. Neuroreport 1993;4:675-678 [DOI] [PubMed] [Google Scholar]
- 20.Swanson SJ, Hammeke TA, Binder JR, Fischer M, Morris GL. Mueller WM. Language lateralization ratios with functional magnetic resonance imaging and Wada testing: preliminary report (abstr). J Int Neuropsychiatry Soc 1995;1:141 [Google Scholar]
- 21.Orikasa H. Rinsyokenkyu Design [in Japanese].. Tokyo: Makokoeki; 1995
- 22.Oldfield RC. The assessment and analysis of handedness: the Edinburgh inventory. Neuropsychologia 1971;9:97-113 [DOI] [PubMed] [Google Scholar]
- 23.Talairach J, Pierre T. Co-planar Stereotaxic Atlas of the Human Brain: 3-Dimensional Proportional System, an Approach to Cerebral Imaging.. New York: Thieme; 1988
- 24.Bandettini PA, Wong EC, Hinks RS, Tikofsky RS, Hyde JS. Time course EPI of human brain function during task activation. Magn Reson Med 1992;25:390-397 [DOI] [PubMed] [Google Scholar]
- 25.Okuno T. Ohyotokei Handbook [in Japanese].. Tokyo: Youkendou; 1982
- 26.Terada K. Suikeitokeigaku [in Japanese].. Tokyo: Asakurasyoten; 1970
- 27.Fukutomi K, Nagai M, Nakamura Y, Yanagawa H. Kihontokeigaku [in Japanese].. Tokyo: Nanzandou; 1995
- 28.Righini A, Divitis OD, Prinster A, et al. Functional MRI: primary motor cortex localization in patients with brain tumors. J Comput Assist Tomogr 1996;20:702-708 [DOI] [PubMed] [Google Scholar]
- 29.Gazzaniga MS. The Cognitive Neurosciences.. Cambridge: MIT Press; 1995
- 30.Renzi ED, Colombo A, Scapra M. The aphasic isolate: a clinical-CT scan study of a particularly severe subgroup of global aphasics. Brain 1991;114:1719-1730 [DOI] [PubMed] [Google Scholar]
- 31.Willmes K, Poeck K. To what extent can aphasic syndromes be localized? Brain 1993;116:1527-1540 [DOI] [PubMed] [Google Scholar]