

Abstract
Summary: Methylmalonic acidemia is an inborn disorder of amino acid metabolism that commonly presents with neurologic deficits. We present the results of multi-slice proton MR spectroscopy and diffusion-weighted imaging of the brain in two patients with methylmalonic acidemia. The findings consisted of restricted diffusion and elevated lactate in the globi pallidi, compatible with acute infarction (patient 1) and elevated lactate in CSF (patient 2).
Methylmalonic acidemia is an inborn disorder of amino acid metabolism that commonly presents with neurologic deficits (1). CT and MR imaging of the brain typically reveal atrophy, delay in myelination, and abnormalities in the basal ganglia, predominantly in the globi pallidi (2). To our knowledge, there has been only one report on proton MR spectroscopic (MRS) findings (3) and no reports on diffusion-weighted imaging findings in patients with methylmalonic acidemia. In this report, we present the results of multi-slice proton MRS and diffusion-weighted imaging of the brain in two patients with methylmalonic acidemia.
Case Reports
Patient 1
A 16-month-old female patient presented with vomiting, lethargy, and upper limb tremor. She presented 6 months earlier with failure to thrive, dehydration, and metabolic acidosis. Organic acid analysis of urine revealed high levels of methylmalonic acid. In vitro skin fibroblast analysis confirmed that the methylmalonic acidemia was a result of a cobalamin synthesis defect. She remained well with protein restriction, carnitine supplementation, and alkalinization until this episode.
On admission, her neurologic examination was significant for axial hypotonia, right-extremity hypertonia, and aphasia. Initial CT findings were normal. She showed little improvement after administration of IV fluids and bicarbonate and carnitine-prompted dialysis. Repeat CT on the second day of hospitalization showed symmetrical hypodensities in both globi pallidi. MR imaging (sagittal T1-weighted, 565/8 [TR/TE]; axial fast spin-echo T2-weighted, 5015/97 [TR/TEeff] and echo train length, 20; axial fast fluid-attenuated inversion recovery [FLAIR], 8800/140/2200 [TR/TEeff/TI], and echo-train length, 16; single-shot spin-echo echo-planar diffusion-weighted, 10,000/100 [TR/TE] and two levels of weighting [b = 0 and 1000 s/mm2] applied sequentially in three orthogonal directions), axial 3D time-of-flight MR angiography of the circle of Willis (43/6.3 [TR/TE]; flip angle, 20o), and multi-slice proton MRS (2300/280 [TR/TE]; slice thickness, 15 mm; interslice gap, 2.5 mm; field of view, 24 × 24 cm; matrix, 32 × 32 × 256; averages, 1; scan time, 22 minutes) were performed on the sixth day of hospitalization. From the diffusion-weighted data, voxel-by-voxel average apparent diffusion coefficient (ADCave = [ADCxx + ADCyy + ADCzz]/3) brain maps were calculated on-line, using commercially available software. Multi-slice proton MRS data were reconstructed using software developed at our institution. Metabolic images were calculated using integration over a fixed frequency range for each resonance (choline [Cho], 3.34–3.14 ppm; creatine [Cr], 3.14–2.94 ppm; N-acetyl aspartate [NAA], 2.22–1.82 ppm; lactate [Lac], 1.55–1.15 ppm) after applying a susceptibility correction. Metabolic images were linearly interpolated from the initial 32 × 32 matrix size to 256 × 256. A signal was only assigned to Lac if it had an exact chemical shift of 1.33 ppm and a 7-Hz doublet structure.
Fast-FLAIR and T2-weighted FSE MR images revealed symmetrical, high signal in the globi pallidi (Fig 1A). On the diffusion-weighted MR images, the globi pallidi lesions were mildly hyperintense anteromedially and markedly hyperintense posterolaterally. ADCave maps showed low signal in the posterolateral portions of the globi pallidi corresponding to the zone of marked hyperintensity on diffusion-weighted images. The anteromedial portions of the globi pallidi were isointense to unaffected brain on ADCave maps (Fig 1A). The MR angiogram of the circle of Willis was normal.
fig 1.

Patient 1.
A, Symmetrical high signal intensity in the globi pallidi is demonstrated (*) on fast-FLAIR (8800/140/2200 [TR/TEeff/TI]) and T2-weighted FSE (5015/97 [TR/TEeff]) MR images. On the diffusion-weighted (10,000/100 [TR/TE]) (b = 1000 s/mm2) MR image, the lesions were mildly hyperintense anteromedially and markedly hyperintense posterolaterally (arrowheads). The ADCave map demonstrated symmetrical low signal intensity (restricted diffusion) in the posterolateral portions of the globi pallidi (arrowheads), consistent with acute infarctions. Metabolic images showed symmetrical bilateral decreases in NAA and increases in Lac in globi pallidi (*), also consistent with acute infarction. Other brain regions appeared normal, and no Lac was detected in CSF.
B, Single-voxel short-TE spectrum (2000/30 [TR/TE]) of the left globus pallidus shows decreased levels of NAA and increased levels of Lac compared with controls (not shown). Levels of other metabolites are within normal limits (Glu, glutamate and glutamine; mI, myo-inositol)
On multi-slice proton MR spectra, the lesions were characterized by reduced levels of NAA and increased levels of Lac. All other brain regions had normal levels of Cr, Cho, and NAA. No Lac was detected in normal-appearing brain parenchyma or within CSF. Short-TE single-voxel spectra also showed elevated Lac and reduced NAA, with normal levels of other metabolites (myo-inositol, glutamate, and glutamine) (Fig 1B).
Patient 2
A 14-year-old boy with methylmalonic acidemia attributable to mutase deficiency (mut–), diagnosed at 3 weeks of age, was admitted for fluctuating consciousness, hearing and visual loss, nystagmus, and clonus after an episode of upper respiratory tract infection. Blood tests revealed hypoglycemia, hyperammonemia, and elevated Lac levels. Organic acid analysis of urine was not performed during this admission. CT on the same day of admission depicted mild prominence of the cortical sulci and ventricular system. Brain MR imaging and multi-slice proton MRS (same as for patient 1) were performed on the third day of hospitalization. ADCave maps and metabolic images were calculated as described above.
MR imaging did not show any focal signal abnormality in the brain. On multi-slice proton MR spectra, NAA, Cr, and Cho levels were within normal limits, and there was no detectable Lac peak within the brain parenchyma. Interestingly, however, there was marked elevation of Lac levels in all CSF spaces, particularly in the lateral ventricles (Fig 2).
fig 2.
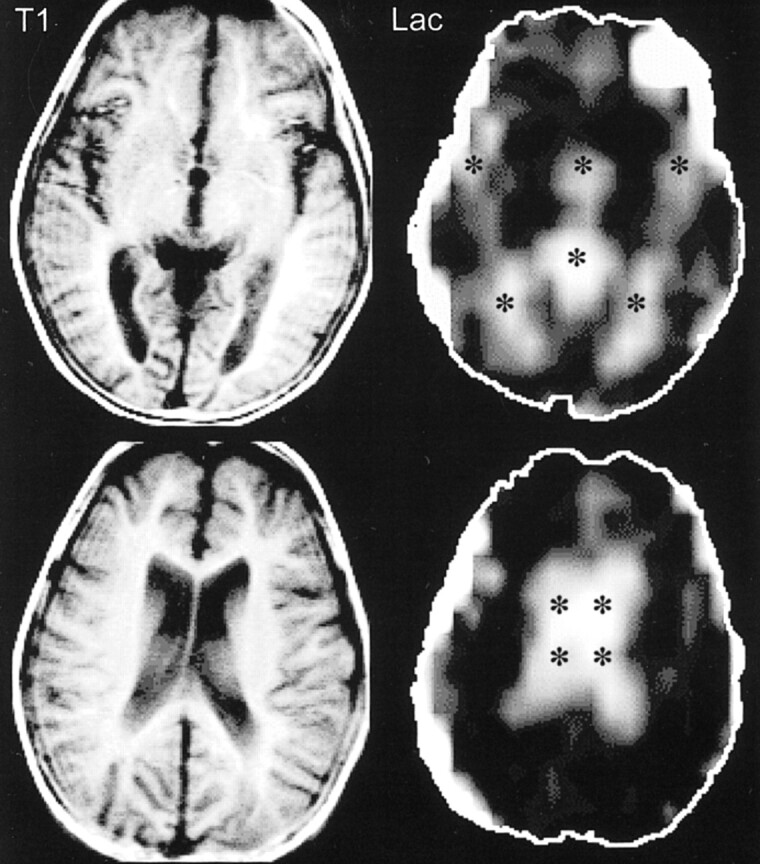
Patient 2. T1-weighted spin-echo MR images (300/13 [TR/TE]) at the level of the third ventricle (top row) and the lateral ventricles (bottom row) were unremarkable except for mild volume loss. Lac images showed high signal limited to the CSF spaces (*) (third and lateral ventricles, sylvian fissures, and cistern of the velum interpositum)
Discussion
The amino acids isoleucine, valine, methionine, and threonine are normally catabolized successively to propionic acid, methylmalonic acid, and succinic acid. The conversion of methylmalonic acid to succinic acid requires an enzyme, methylmalonyl CoA mutase, and a coenzyme, adenosyl cobalamine. Deficiency of the mutase enzyme (complete, mut0; partial, mut–) or of the cobalamine coenzyme (cblA through cblF) results in accumulation of methylmalonic acid (4). The pathophysiology of brain lesions in patients with methylmalonic acidemia is attributed to inhibition of succinate dehydrogenase, an enzyme essential for mitochondrial aerobic glucose oxidation, by high levels of methylmalonic acid (5). The globi pallidi are particularly sensitive to mitochondrial dysfunction, and are thus prime targets for injury. This is further supported by the frequent involvement of the globi pallidi in patients with congenital succinate dehydrogenase dysfunction. Energy depletion is partially compensated for by anaerobic glycolysis, with a resultant increase in the production of Lac.
All types of methylmalonic acidemia are transmitted by autosomal recessive mode. The incidence, as derived form a neonatal screening program, is one in 48,000 live births (6). The actual occurrence, however, is estimated to be one in 25,000 live births (6). Patients with methylmalonic acidemia usually manifest in the first year of life with vomiting, feeding difficulties, lethargy, dehydration, and severe metabolic acidosis (4). Neurologic manifestations consist of seizures, hypotonia, movement disorders, spasticity, developmental delay, mental retardation, and dyspraxia. Clinical decompensation is often progressive and triggered by infections (4). Patients with methylmalonic acidemia secondary to mutase deficiency present at an earlier age (neonatal period) compared with those with cobalamine deficiency (> 2 months of age), generally experience more severe disease, and have poorer outcome (mortality 74% to 87%, with a mean survival time 1.5 to 6.4 years) (1, 4). In general, methylmalonic acid levels do not correlate with outcome (4).
Brain CT and MR imaging reveal prominence of ventricles and sulci and a delay in white matter myelination (2). In the largest published series on brain imaging findings in methylmalonic acidemia (2), four of 23 patients had symmetrical globi pallidi infarcts similar to our first patient. One patient had increased T2 signal in the putamina bilaterally, which disappeared on a follow-up study performed 3 weeks later. These basal ganglia changes were found in patients over 2 years old and did not seem to correlate with patient compliance or severity of clinical symptoms (2).
Single-voxel proton MRS of the basal ganglia has been previously reported in three patients: one with cystic lesions in the globi pallidi, one with abnormal signal in the basal ganglia bilaterally, and one with normal MR imaging results (3). Decreased NAA was found in the two patients with basal ganglia changes on MR images, consistent with neuronal loss (3). Unlike our cases, Lac was not detected in any of the three patients (3).
Our first case demonstrated bilateral lesions in the globi pallidi, which were consistent with acute (posterolateral portions) and subacute (antermedial portions) infarction. The diagnosis of infarction was supported by reduced ADCave and increased Lac in the involved regions and the appearance of hypodensity in the globi pallidi on follow-up head CT scans. Brain infarctions have also been demonstrated by autopsies performed on patients who died of methylmalonic acidemia (7). It is important to emphasize that the reduction in ADCave is most likely due to bioenergetic failure and not vascular compromise (normal MR angiogram of the circle of Willis).
In our second case, MR imaging was normal, and multi-slice proton MR spectra showed normal metabolism within brain parenchyma. However, there was a large increase in Lac in CSF spaces. The origin of this CSF Lac is unclear; however, we speculate that a constant low level of anaerobic glycolysis due to reduced Krebs cycle flux may have occurred in brain parenchyma, with subsequent transport and accumulation of Lac in the CSF (8). High levels of CSF Lac without concomitant elevated brain Lac has been observed in several neuropathologic abnormalities, including certain mitochondrial diseases and HIV-associated encephalitis. Although the mechanism of elevated CSF Lac remains to be determined, it is possible that measurements of CSF Lac levels achieved using MRS may be helpful in predicting the risk for brain parenchymal injury, and for noninvasively monitoring the effects of therapy. The absence of CSF Lac in our first patient may have been due to complete clearance by the time of MRS imaging (6 days after admission), and the persistence of elevated Lac in the globi pallidi may have been the result of impaired transport from the infracted area into CSF. This case further illustrates one advantage of multi-slice proton MRS over single-voxel spectroscopy in evaluating metabolic diseases of the brain. Previous MRS study of methylmalonic acidemia (3) used single-voxel localization techniques that did not include coverage of CSF spaces. In contrast, multi-slice MRS allows spatial encoding of large amounts of brain parenchyma as well as CSF spaces in a single scan.
Conclusion
In methylmalonic acidemia, multi-slice proton MRS and diffusion-weighted brain imaging findings can range from abnormalities limited to the CSF spaces (elevated Lac) without parenchymal involvement to acute infarction in regions sensitive to mitochondrial dysfunction (globi pallidi). Multi-slice proton MRS can cover regions of metabolic abnormalities unsuspected on anatomic MR imaging.
Footnotes
Address reprint requests to Elias R. Melhem, MD, Department of Radiology, The Johns Hopkins Hospital, 600 North Wolfe Street, Baltimore, MD 21287-2182.
References
- 1.van der Meer SB, Poggi F, Spada M, et al. Clinical outcome of long-term management of patients with vitamin B12 unresponsive methylmalonic acidemia. J Pediatr 1994;125:903-908 [DOI] [PubMed] [Google Scholar]
- 2.Brismar J, Ozand PT. CT and MR of the brain in disorders of the propionate and methylmalonate metabolism. AJNR Am J Neuroradiol 1994;15:1459-1473 [PMC free article] [PubMed] [Google Scholar]
- 3.Lam WW, Wang ZJ, Zhao H, et al. 1H MR spectroscopy of the basal ganglia in childhood: a semiquantitative analysis. Neuroradiology 1998;40:315-323 [DOI] [PubMed] [Google Scholar]
- 4.Nicolaides P, Leonard J, Surtees R. Neurological outcome of methylmalonic acidaemia. Arch Dis Child 1998;78:508-512 [DOI] [PMC free article] [PubMed] [Google Scholar]
- 5.Wajner M, Coelho JC. Neurological dysfunction in methylmalonic acidaemia is probably related to the inhibitory effect of methylmalonate on brain energy production. J Inherit Metab Dis 1997;20:761-768 [DOI] [PubMed] [Google Scholar]
- 6.Coulombe JT, Shih VE, Levy HL. Massachusetts Metabolic Disorders Screening Program. II. Methylmalonic aciduria. Pediatrics 1981;67:26-31 [PubMed] [Google Scholar]
- 7.Larnaout A, Mongalgi MA, Kaabachi N, et al. Methylmalonic acidaemia with bilateral globus pallidus involvement: a neuropathological study. J Inherit Metab Dis 1998;21:639-644 [DOI] [PubMed] [Google Scholar]
- 8.Inao S, Marmarou A, Clarke GD, et al. Production and clearance of lactate from brain tissue, cerebrospinal fluid, and serum following experimental brain injury. J Neurosurg 1988;69:736-744 [DOI] [PubMed] [Google Scholar]