

Abstract
This work explores the use of graph-theoretical metrics of network topography to investigate interactions in the uterine activity using a multi-channel SQUID array. Magnetomyography (MMG) is a noninvasive technique that records magnetic fields associated with the uterine activity. Graph analysis was applied to 30s no-overlap epochs of MMG data for evaluating the evolution of local and global connectivity, and centrality indicators within the network. Binary graphs were obtained by applying a range of thresholds from 10% to 35% of the strongest edges preserved. Network analysis was applied to 24 simulated MMG data when independent noise realizations were added. Simulated data was generated from a multiscale forward model that uses a realistic uterus representation. Additionally, we applied network analysis to repeated real MMG measurements obtained from a subject at different gestational ages (GA) to observe the evolution of the network until subject reaches active labor. Results show in the simulation setting that network metrics were higher during the burst activity reflecting the propagation activity of the signal across the uterus of the multiscale mathematical model. The local efficiency values were higher than the global efficiency for any threshold used. For real MMG recordings, global and local efficiency, and clustering coefficient values increased as the patient approached active labor at any binarized threshold whereas betweenness centrality quantity decreased with days to active labor.
I. Introduction
Term labor is expected to occur after the 37th week of pregnancy. However, during the last two decades, the preterm birth rate in the United States has increased (12%) [1], accounting for over half a million premature births each year. Preterm birth can cause severe health problems or even be fatal for the fetus, and also imposes significant financial burdens on health care systems [2]. Early and reliable diagnosis is essential to the development of successful interventions to prevent preterm delivery and improve outcome.
The uterus is a complex organ and the underlying mechanism of labor is still partially understood. Electromyography (EMG) and Magnetomyography (MMG) are noninvasive techniques permitting to record the electrical and magnetic fields, respectively, of the electrophysiological activity of the uterine contractions. Both techniques measure the electrical (magnetic) activity on the surface of the maternal abdomen that is a result of a sequence of bursts or groups of action potentials that are generated and propagated in the uterine muscle. Unlike uterine EMG signals which are measured by electrodes attached to the abdomen, MMG signals are detectable with high sensitive SQUID magnetometers over the abdomen. MMG technique is a suitable tool for investigation of the uterine activity because it is independent of tissue conductivity, detects the signals without making any electrical contact with the body and it is independent of references [3].
Human and animal uterine studies have proposed relevant parameters to track labor, such as the frequency and power of burst activity, burst duration, synchronization index and propagation of the uterine electrical activity [4], [5], [6], [7], [8], [9]. Although advances have been made in tracking labor using these parameters, only few of them have shown differences in preterm and term subjects. Thus, new potential indicators of the uterine electrical activity are needed to understand the electrophysiological characteristics of the uterus.
The application of network topology measures has revolutionized the study on different areas such as the adult brain function. Graph theory has been applied in few uterine EMG studies [10] but it has never been applied to MMG signals. In this work, graph analysis was applied to MMG data for evaluating the centrality, local and global connectivity within the network to study the potential use of these indicators in uterine studies. Network analysis was applied to simulated data obtained from a realistically multiscale forward model that uses the FitzHugh-Nagumo equations. Additionally, we applied the network analysis to repeated real MMG measurements recorded from a subject at different gestational ages (GA) to observe the evolution of the network metrics until active labor.
II. Methods
A. Simulated data
The synthetic MMG data was generated using the multiscale forward model [11] developed by our group using the sensor array from SARA (SQUID Array for Reproductive Assessment) system [12]. This model takes into account the electrophysiological and realistically anatomical knowledge of uterine contractile activities. In particular, we applied a realistic four-compartment volume conductor (fetus, amniotic fluid, myometrium, and abdomen from the inner layer to the outer layer) at the organ level. At the tissue level, we introduced region-based fiber orientations to characterize the anisotropic property of the myometrium. At the cellular level, we described the electrophysiological activity using a variation of the FitzHugh-Nagumo (FHN) equations:
| (,1) |
| (2) |
where vm denotes the action potential, w is a state variable, cm is the membrane capacitance, and k, ϵ1, ϵ2, v1, v2, v3, β, γ, δ are model parameters. This electrophysiological activity is initiated by pacemaker stimulus, which is modeled as
| (3) |
where Np is the number of pacemaker areas, Nb is the burst number, ϑ denotes the stimulus amplitude, h(·) is the Heaviside step function, ri is the location of ith pacemaker, r is an observation point (in our case SARA sensor positions), and a and b denote the beginning and ending time of pacemaker stimulus current, respectively.
Parameter values for (1) and (2) are given in [13]. The value for ϵ2 = 0.5 was obtained using phase-space analysis, and Nb = 3. Values of a and b were extracted from real MMG measurements. The pacemaker was positioned to the right upper quadrant (with x-y-position 7.5cm and 12.99cm) of SARA array. We generated 16min of the simulated data at sampling rate of 32Hz where burst activity was in the range of 2 pico Teslas (pT). We added to the simulated MMG data uncorrelated random noise distributed as to produce noise level of white noise density (which is in the range of SARA sensor noise). We created 24 MMG simulated datasets with independent noise realizations.
B. Graph Analysis
A graph theoretical approach was used to investigate different properties of the uterine activity. A network can be represented by a set of nodes which are connected by edges. In this case, the individual nodes are the MMG sensor locations and edges reflect interactions between uterine activities which are defined by squared correlation coefficients extracted from MMG time series. For this end and track the dynamics of the network, we partitioned the MMG data from all the 151 sensors into 30s no-overlap epochs. In each epoch, we computed the Hilbert transform amplitude of the time series [14]. Next, using Hilbert transform amplitude, we calculated the squared correlation coefficient between each sensor and every other sensor, which resulted in a 151 × 151 connectivity matrix. The frequency content of the electrical burst activity corresponding to the uterine contractions changes over time [15]. Hence, enveloped correlation is a more plausible approach [16] to quantify amplitude coupling in the uterine activity. To characterize the network across a broad range of thresholds, connectivity matrices were converted to binary graphs by applying a range of thresholds from 10% to 35% of the strongest edges preserved. After constructing binarized networks, we calculated the following network metrics [17]:
- Global efficiency: It is inversely related to the average shortest path length and measures network integration and how efficiently information can be exchanged over the network. It is defined as:
where n is the number of vertices, dij is the shortest path length between nodes i and j.(4) - Local efficiency: It is defined as the average efficiency of the local subgraphs (Gi) and measures functional segregation and shows how efficient the communication is between the first neighbors of i when i is removed. It is defined as:
where is the local efficiency of node i with nodes in Gi that contains all neighbors of node i.(5) - Clustering coefficient: It is the ratio of all present neighbor–neighbor edges to the maximum possible number of such edges. It measures the cliquishness of a typical neighborhood. It is defined as:
where ti is the number of triangles around a node i and ki is the degree of a node i.(6) - Betweenness centrality: It is the ratio of the number of shortest paths that pass through a specified node to the total number of shortest paths in the network. It measures the importance of each node in the information transiting across the network. Nodes with high betweenness centrality perform as centralized hubs in a network. It is defined as:
where σij is the number of shortest paths between nodes i and j and σij(v) is the number of these shortest paths that pass through node v.(7)
C. Real MMG data
Five datasets were recorded with the SARA system consisting of 151 superconducting sensors that are uniformly distributed in a shell shaped structure matching the curvature of the maternal abdomen. Data corresponds to one pregnant women between 37 to 38 weeks of GA. Recordings were collected under the protocols approved by the Institutional Review Board and were performed serially every other day until mother reaches active labor. The first recording for this mother was performed at GA of 37 weeks 0 days (37w0d), and last one at 38 weeks and 1 day (38w1d). To obtain the MMG signals, we down-sampled the original data to 32Hz, next we applied a bandpass filter (0.1–1Hz) to attenuate the interfering maternal and fetal cardiac signals. A notch filter (0.25–0.35Hz) was applied to suppress the maternal breathing which is a prominent signal around the frequency of 0.33Hz. We excluded segments with maternal movement using the method described in [18]. After obtaining the real MMG data, we performed the network analysis as described in Section II-B to obtain the network metrics.
III. RESULTS AND DISCUSSION
A. Simulation scenario
Fig. 1 shows an example for one simulated dataset where the 3 bursts related to uterine activity are displayed in Fig. 1e. The connectivity in SARA sensor array (Figs. 1a and 1c) and the adjacency matrix (Figs. 1b and 1d) for two 30s-windows (1st from 30s-60s and 2nd from 60s-90s) are shown. Figs. 1f and 1g show the network metrics for the whole simulated data in 30s-windows when connectivity matrix was threshold to 30%. It is observed that global and local efficiency have high values (> 0.56) during the simulated burst activity. We expect to see this behavior due to the fact that the multiscale forward model created a propagation activity of the signal across the realistic uterus model starting from the pacemaker area. Network indicators mirror the small-world network properties during the burst uterine activity. Figs. 1f and 1g show highest local efficiency (ranking from 0.72–0.76) in comparison with the global efficiency (ranking from 0.42–0.56). The clustering coefficients are between the two efficiency values. During initiation of the burst (i.e. 60–90s, 330–360s and 450–480s), both efficiency metrics have low values in comparison with the ones obtained when maximum amplitudes of the burst activities are attained. Fig. 1g shows the betweenness centrality where non-zero values (gray areas in Fig. 1g corresponds to zero values of betweenness metric which were discarded in the analysis) appear during the burst activities but only highest values (> 500 from yellow to red in the colormap) were obtained in few sensors at the end (i.e. 150 – 180s and 360 – 390s) of the burst activities.
Fig. 1.
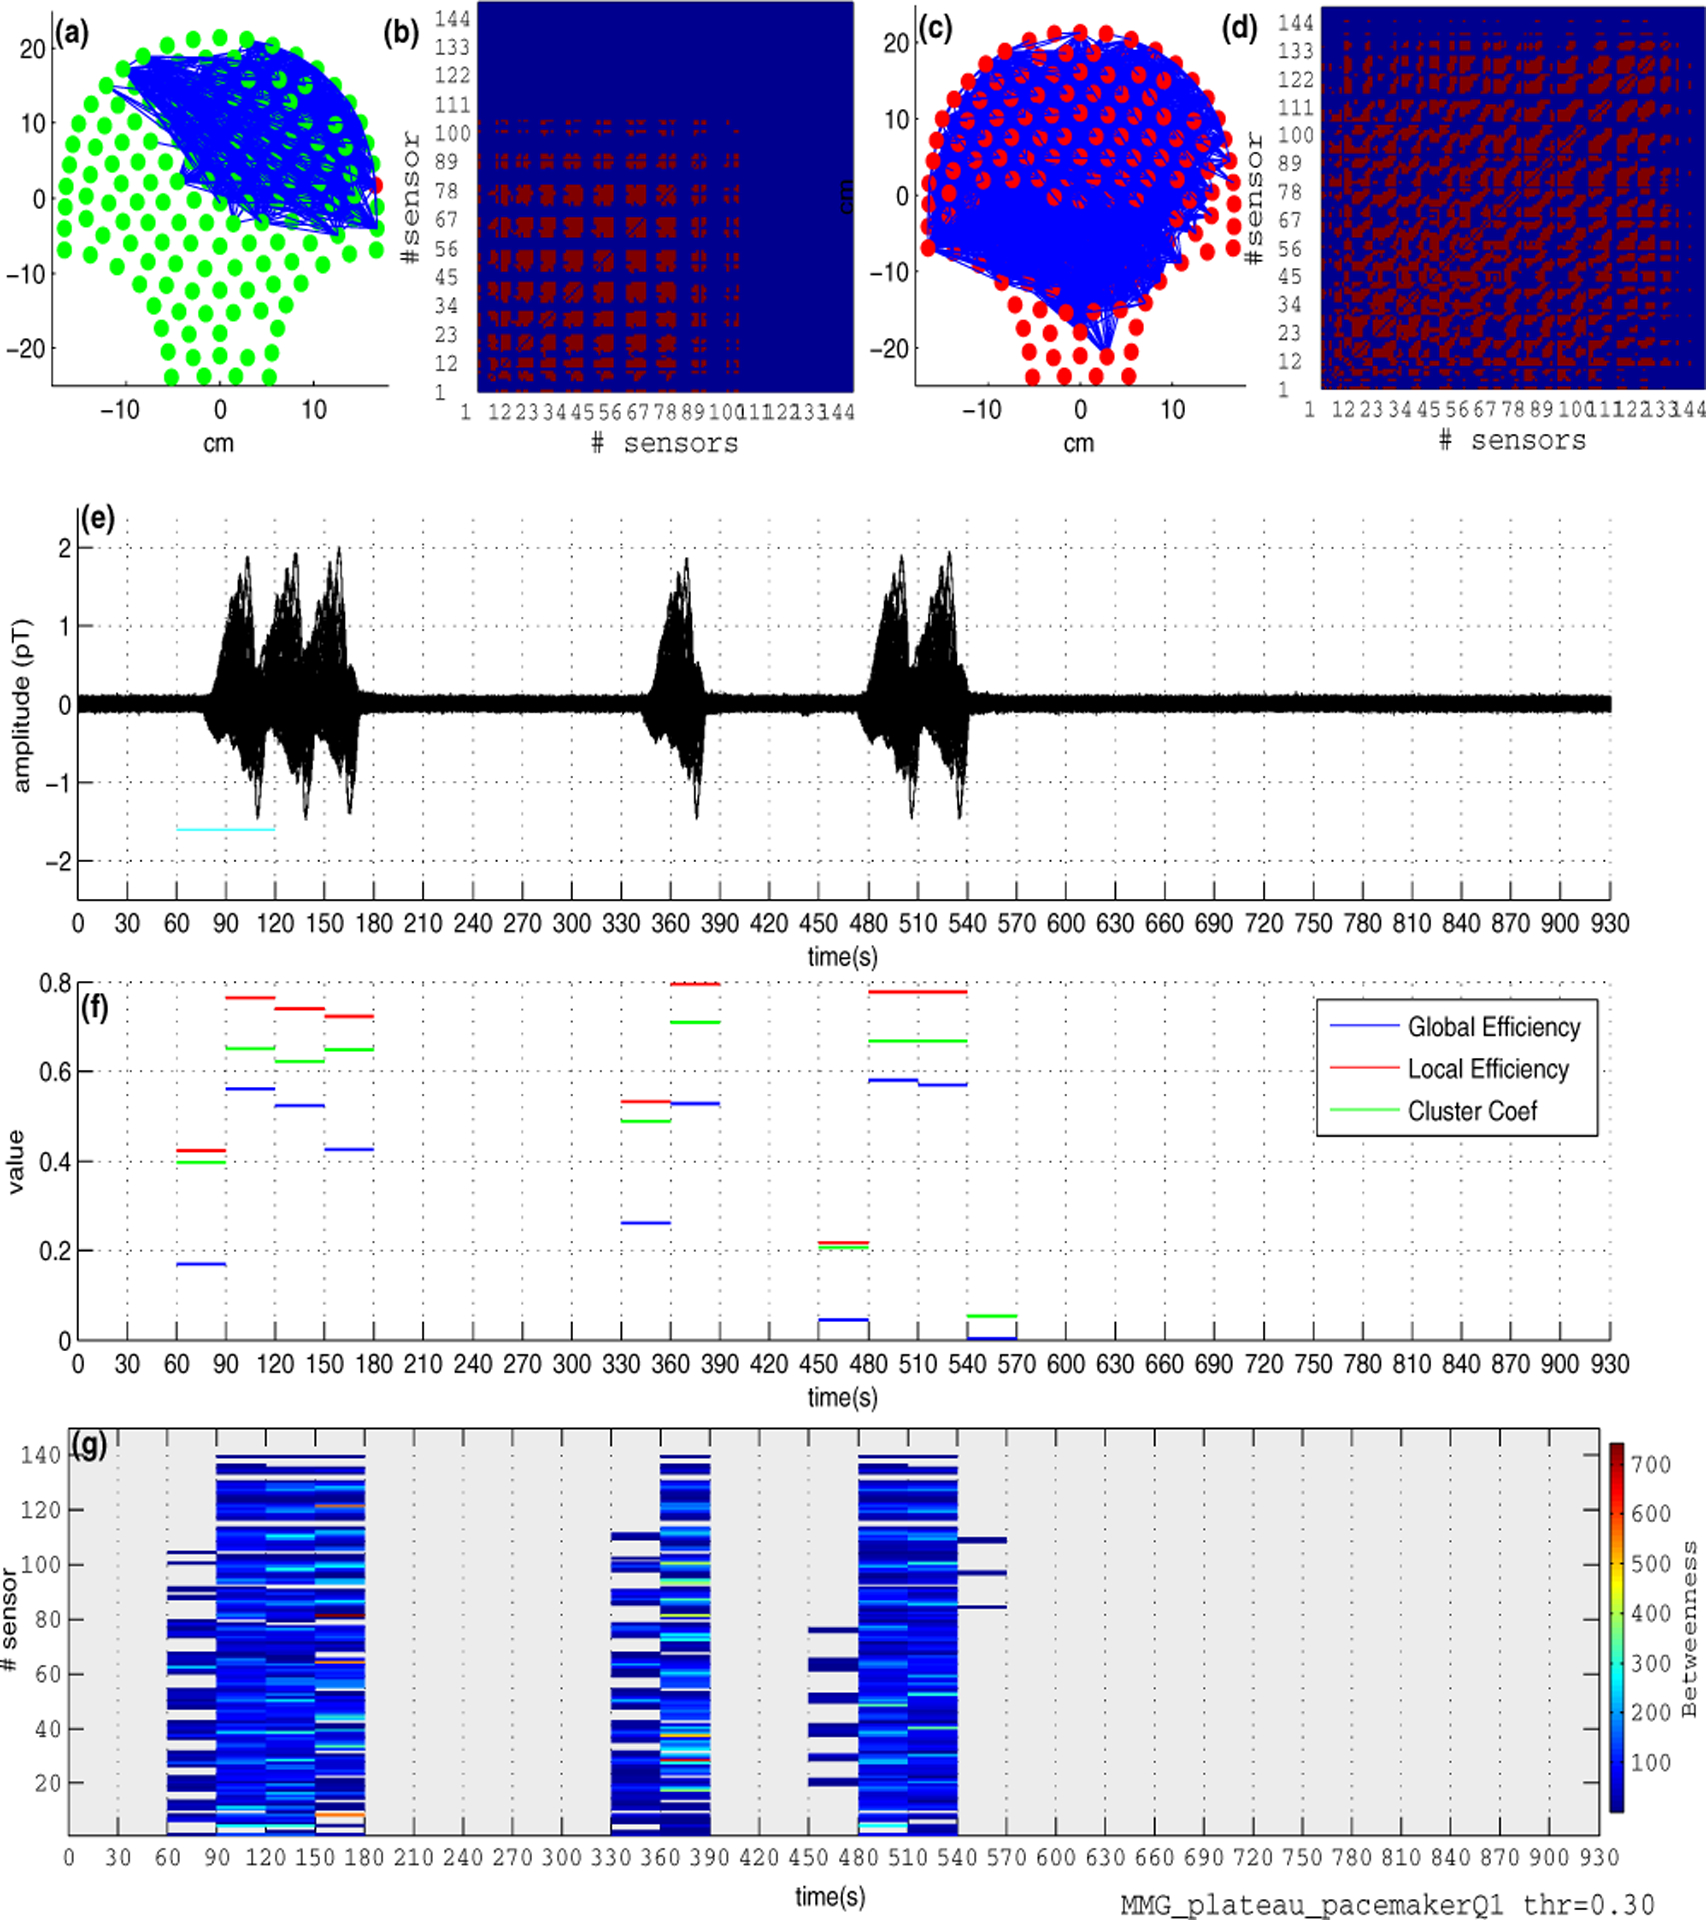
Simulated MMG Data. (a) and (c) Connectivity (thr = 30%) in SARA sensor array obtained from two 30s windows (1st from 30s-60s and 2nd from 60s-90s). (b) and (d) Corresponding adjacency matrices from the two 30s-windows. (e) Simulated MMG data showing the 3-burst uterine activities. (f) Local and global efficiency and clustering coefficient quantities over the entire data. (g) Betweenness centrality over the entire data.
We performed network analysis as described in Section II-B in the range of thresholds of 10% to 35% for the 24 simulated datasets when independent noise realizations were added. Fig. 2 shows the means and standard deviations of the network measures across all 30s-windows and simulated datasets. For any threshold used, the local efficiency values were higher than the global efficiency. Averages clustering coefficients were lower compared with the efficiency values. Mean betweenness values show an increase as binarization thresholds increase. This may happen, because we did not apply any method to identify group of nodes within each network that contained significantly higher betweenness centrality values over the course of the uterine activity. Thus for future work, we will include an algorithm, such as K-means method, to cluster nodes exhibiting high amounts of betweenness centrality.
Fig. 2.
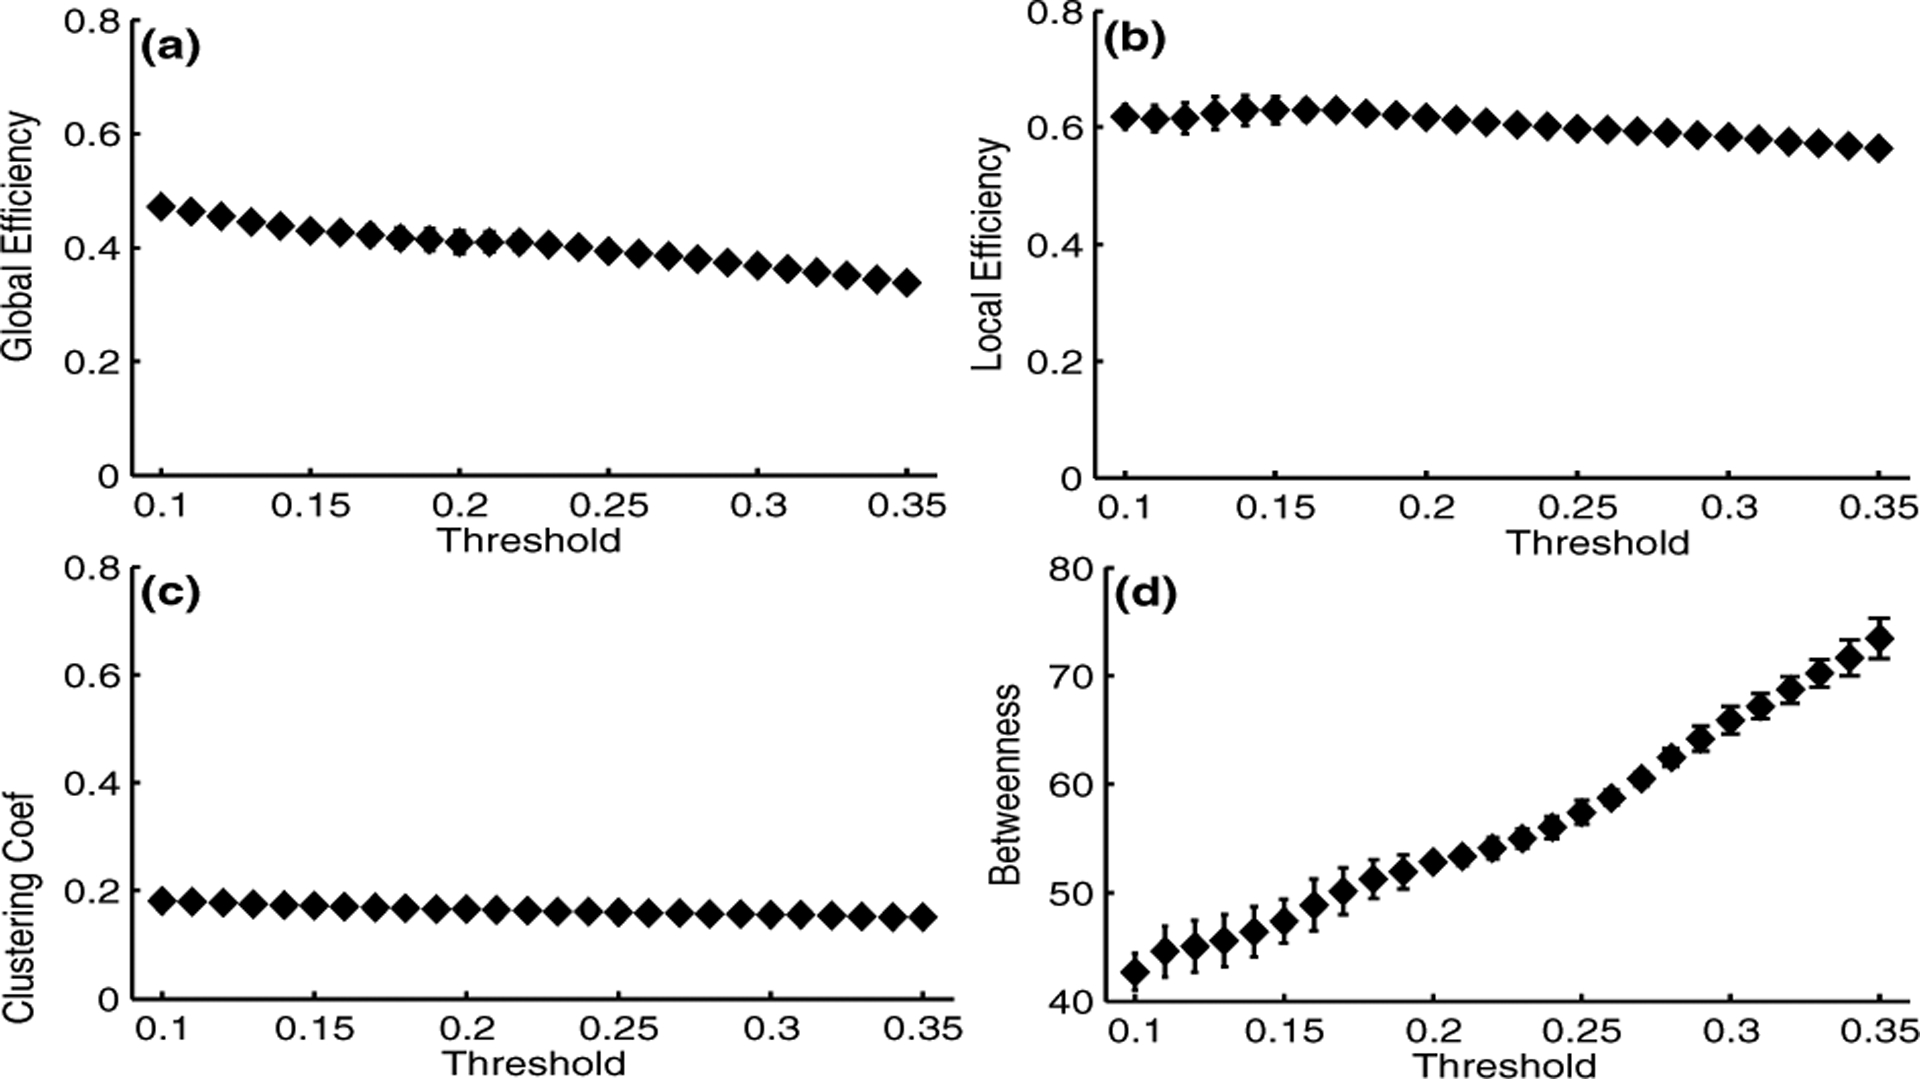
Means and standard deviations of the network analysis in a range of thresholds for the 24 simulated datasets. (a)-(c) Local and global efficiency and clustering coefficient quantities. (d) Betweenness centrality values.
B. Real data
Fig. 3 shows the means across all 30s windows for all binarized thresholds for the serial real MMG data recorded at different weeks of GA (37w0d-38w1d). The day prior to which the study was performed calculated from the day on which the mother went into active labor is shown in Fig. 3 (see the number in parenthesis in the legend for each MMG recording). Results show an increase in global (Fig. 3a) and local efficiency (Fig. 3b), and clustering coefficient values (Fig. 3c) starting at 37 weeks until active labor was reach on the day of last MMG study at 38 weeks for any threshold used. In the other hand, betweenness centrality numbers decreased from the 37 weeks until active labor was reached at 38 weeks.
Fig. 3.

Means across all 30s windows of the serial real MMG signals obtained from a single subject across different weeks of GA. The first recording was performed at 37w0d, and last recording at 38w1d. (a)-(c) Local and global efficiency and clustering coefficient quantities. (d) Betweenness centrality values.
IV. CONCLUSION
The large area and the shape of SARA sensor array allows to record the magnetic fields associated with the initiation and propagation of the uterine activity. In this work, we have shown that network analysis, specifically global and local efficiency, clustering coefficient and betweenness centrality metrics, are parameters that can track changes occurring in the uterine activity. In the simulation setting, the network metrics obtained higher values during the simulated burst activities reflecting the propagation of the signals across the realistic uterus representation from the multiscale mathematical model. The local efficiency values were higher than the global efficiency for any threshold used. Additionally, for the real datasets the global and local efficiency, and clustering coefficient values increased with days to active labor. Betweenness centrality quantity decreases with days to active labor. For future work, we plan to apply our study on a larger population and compare network metrics with the traditionally used clinical measures to track labor for term and preterm populations. We also plan to expand the study to source space network analysis.
Acknowledgments
This work was partially supported by the U.S. National Institute of Health (NIH) under Grant NIBIB/R01EB007264.
REFERENCES
- [1].Zerhouni E, “Prematurity research at the nih,” Rockville: National Institute of Child Health and Human Development, 2008. [Google Scholar]
- [2].Moster D, Lie RT, and Markestad T, “Long-term medical and social consequences of preterm birth,” New England Journal of Medicine, vol. 359, no. 3, pp. 262–273, 2008. [DOI] [PubMed] [Google Scholar]
- [3].Vrba J, “Multichannel SQUID biomagnetic systems,” in Applications of Superconductivity. Springer, 2000, pp. 61–138. [Google Scholar]
- [4].Lau H, Rabotti C, Bijloo R, Rooijakkers MJ, Mischi M, and Oei SG, “Automated conduction velocity analysis in the electrohysterogram for prediction of imminent delivery: A preliminary study,” Computational and Mathematical Methods in Medicine, vol. 2013, p. Article ID 627976 7 pages, 2013. [DOI] [PMC free article] [PubMed] [Google Scholar]
- [5].Lange L, Vaeggemose A, Kidmose P, Mikkelsen E, Uldbjerg N, and Johansen P, “Velocity and directionality of the electrohysterographic signal propagation,” PloS ONE, vol. 9, no. 1, p. e86775, 2014. [DOI] [PMC free article] [PubMed] [Google Scholar]
- [6].Lammers WJ, “The electrical activities of the uterus during pregnancy,” Reproductive Sciences, vol. 20, no. 2, pp. 182–189, 2013. [DOI] [PubMed] [Google Scholar]
- [7].Mikkelsen E, Johansen P, Fuglsang-Frederiksen A, and Uldbjerg N, “Electrohysterography of labor contractions: propagation velocity and direction,” Acta Obstetricia et Gynecologica Scandinavica, vol. 92, no. 9, pp. 1070–1078, 2013. [DOI] [PubMed] [Google Scholar]
- [8].Govindan RB, Siegel E, Mckelvey S, Murphy P, Lowery CL, and Eswaran H, “Tracking the changes in synchrony of the electrophysiological activity as the uterus approaches labor using magnetomyographic technique,” Reproductive Sciences, vol. 22, no. 5, pp. 595–601, 2015. [DOI] [PMC free article] [PubMed] [Google Scholar]
- [9].Escalona-Vargas D, Govindan RB, Furdea A, Murphy P, Lowery CL, and Eswaran H, “Characterizing the propagation of uterine electrophysiological signals recorded with a multi-sensor abdominal array in term pregnancies,” PloS ONE, vol. 10, no. 10, p. e0140894, 2015. [DOI] [PMC free article] [PubMed] [Google Scholar]
- [10].Al-Omar S, Diab A, Nader N, Khalil M, Karlsson B, and Marque C, “Detecting labor using graph theory on connectivity matrices of uterine EMG,” in 2015 37th Annual International Conference of the IEEE Engineering in Medicine and Biology Society (EMBC), August 2015, pp. 2195–2198. [DOI] [PubMed] [Google Scholar]
- [11].Zhang M, Tidwell V, Rosa PSL, Wilson JD, Eswaran H, and Nehorai A, “Modeling magnetomyograms of uterine contractions during pregnancy using a multiscale forward electromagnetic approach,” PLoS ONE, vol. 11, no. 3, p. e0152421, 2016. [DOI] [PMC free article] [PubMed] [Google Scholar]
- [12].Eswaran H, Preissl H, Wilson JD, Murphy P, and Lowery CL, “Prediction of labor in term and preterm pregnancies using non-invasive magnetomyographic recordings of uterine contractions.” American Journal of Obstetrics and Gynecology, vol. 190, no. 6, pp. 1598–1603, 2004. [DOI] [PubMed] [Google Scholar]
- [13].La Rosa PS, Eswaran H, Preissl H, and Nehorai A, “Multiscale forward electromagnetic model of uterine contractions during pregnancy,” BMC Medical Physics, vol. 12, no. 1, p. 4, 2012. [DOI] [PMC free article] [PubMed] [Google Scholar]
- [14].Furdea A, Eswaran H, Wilson JD, Preissl H, Lowery CL, and Govindan RB, “Magnetomyographic recording and identification of uterine contractions using Hilbert-wavelet transforms,” Physiological Measurement, vol. 30, no. 10, p. 1051, 2009. [DOI] [PMC free article] [PubMed] [Google Scholar]
- [15].Garfield RE, Maner WL, MacKay LB, Schlembach D, and Saade GR, “Comparing uterine electromyography activity of antepartum patients versus term labor patients,” American Journal of Obstetrics & Gynecology, vol. 193, no. 1, pp. 23–29, 2005. [DOI] [PubMed] [Google Scholar]
- [16].Bruns A, “Fourier-, hilbert-and wavelet-based signal analysis: are they really different approaches?” Journal of Neuroscience Methods, vol. 137, no. 2, pp. 321–332, 2004. [DOI] [PubMed] [Google Scholar]
- [17].Rubinov M and Sporns O, “Complex network measures of brain connectivity: uses and interpretations,” Neuroimage, vol. 52, no. 3, pp. 1059–1069, 2010. [DOI] [PubMed] [Google Scholar]
- [18].Govindan RB, Vairavan S, Ulusar U, Wilson J, Mckelvey S, Preissl H, and Eswaran H, “A novel approach to track fetal movement using multi-sensor magnetocardiographic recordings,” Annals of Biomedical Engineering, vol. 39, no. 3, pp. 964–972, 2011. [DOI] [PMC free article] [PubMed] [Google Scholar]