Abstract
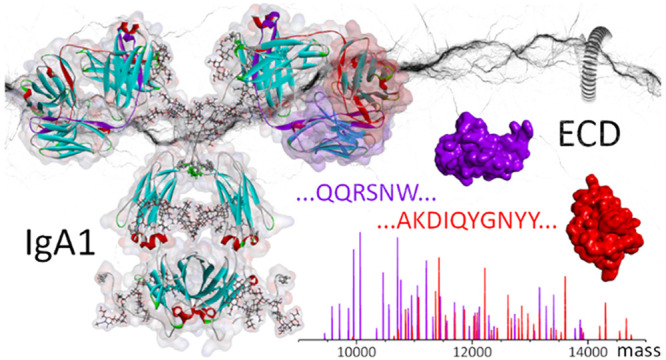
Immunoglobulins A (IgA) include some of the most abundant human antibodies and play an important role in defending mucosal surfaces against pathogens. The unique structural features of the heavy chain of IgA subclasses (called IgA1 and IgA2) enable them to polymerize via the joining J-chain, resulting in IgA dimers but also higher oligomers. While secretory sIgA oligomers are dominant in milk and saliva, IgAs exist primarily as monomers in serum. No method currently allows disentangling the millions of unique IgAs potentially present in the human antibody repertoire. Obtaining unambiguous sequence reads of their hypervariable antigen-binding regions is a prerequisite for IgA identification. We here report a mass spectrometric method that uses electron capture dissociation (ECD) to produce straightforward-to-read sequence ladders of the variable parts of both the light and heavy chains of IgA1s, in particular, of the functionally critical CDR3 regions. We directly compare the native top-down ECD spectra of a heavily and heterogeneously N- and O-glycosylated anti-CD20 IgA1, the corresponding N-glycosylated anti-CD20 IgG1, and their Fab parts. We show that while featuring very different MS1 spectra, the native top-down ECD MS2 spectra of all four species are nearly identical, with cleavages occurring specifically within the CDR3 and FR4 regions of both the heavy and light chain. From the sequence-informative ECD data of an intact glycosylated IgA1, we foresee that native top-down ECD will become a valuable complementary tool for the de novo sequencing of IgA1s from milk, saliva, or serum.
Introduction
Over the past decades, IgG-based antibodies have been increasingly used in the clinic in the fields of oncology, hematology, autoimmune diseases, and infections.1 It is, however, becoming increasingly apparent that other immunoglobulins, e.g., immunoglobulin A (IgA), might provide a useful alternative.2
In humans, the production of IgAs surpasses that of all the other Ig classes combined. While most of the daily IgA production (estimated at 60 mg per kilogram of body weight) is located at mucosal surfaces, offering frontline protection against invading pathogens, 2–3 mg/mL is also present in serum.3 The action of IgAs is characterized by their ability to recruit different effector cells, i.e., polymorphonuclear cells or neutrophils, as well as to activate monocytes and macrophages. Not surprisingly, there is, therefore, a growing interest in IgA-based therapeutics.3
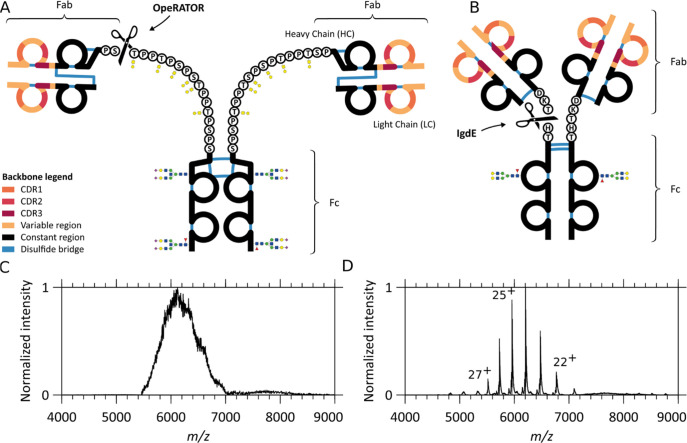
In terms of sequence and structure, recombinant monomeric IgG and IgA molecules feature quite a few similarities. They both consist of two heavy and two light chains connected by disulfide bridges, and both harbor a similar highly constant part (Fc) and a variable antigen-binding part (Fab) that contains the complementarity-determining regions (CDRs). The light chains (LC) can even be identical. IgGs and IgAs nevertheless also exhibit some very distinctive subclass-dependent features. The heavy chain (HC) constant domain of human IgGs is divided into four subclasses, namely, IgG1, IgG2, IgG3, and IgG4, which share between 83 and 96% of their sequence. Additionally, IgG subclasses exhibit distinctive disulfide bridging patterns characterized by different numbers of disulfide bonds in the hinge region and different positioning of disulfides between LC and HC.4 For human IgA, two subclasses are recognized, namely, IgA1 and IgA2. Compared to IgGs, both IgA1 and IgA2 carry more cysteines on their HC, resulting in a higher number of interchain disulfide bridges.3 The IgA subclasses primarily differ in their hinge region, with IgA1 containing an additional stretch of 13 residues between the Fab and Fc regions. Distinctively, the IgA1 HC hinges are rich in serine/threonine residues (as well as proline residues) and can bear up to six core 1 O-glycans. For the larger number of N-glycans carried by IgA1s compared to IgGs, it further adds to their structural complexity.4 Consequently, the higher degree of molecular heterogeneity resulting from the coexistence of multiple glyco-proteoforms is more challenging to tackle analytically for IgAs than for IgGs. This difference in structural heterogeneity becomes quite apparent when analyzing intact IgG1s and IgA1s by mass spectrometry (MS) (see Figure 1).
Figure 1.
Schematic overview of similarities and differences in IgA1 and IgG1 and the resulting native mass spectra. Comparison of (A) IgA1 and (B) IgG1 structures: the two variable regions (colored) display three antigen-binding CDRs each and one constant region (black). Notably, although the light and heavy chain are connected by a single disulfide bond in both IgA1 and IgG1, the connectivity is different. CDR-containing Fab fragments of either IgA1s or IgG1s can be separated from the glycosylated constant Fc portion by proteolytic cleavage (scissors). The OpeRATOR enzyme can cleave IgA1 N-terminally of all O-glycosylation sites, producing predominantly Fab molecules terminated by Ser105 on the constant region of the HC (scissors), whereas IgdE cleaves IgG1 at one specific sequence motif. While IgA1’s HCs bind to LCs via a more N-terminal HC cysteine than IgG1’s, they also differ by the number and location of intrachain disulfides: 6 for IgA1s against 4 for IgG1s. The IgA1 hinge region is extended compared to IgG1. Although the O-glycans are here depicted uncapped for simplicity, they can be variably extended by additional Gal and NeuNAc residues. Native MS1 spectra of (C) intact anti-CD20 IgA1 and (D) anti-CD20 IgG1. While baseline-resolved ion signals can be detected for IgG1, the structural heterogeneity of IgA1 leads to charge-unresolved ion signals, hampering direct mass determination.
Accurate sequence determination, a major prerequisite for the ultimate goal of clinical application of antibodies, requires high-quality, streamlined data sets. Mass spectrometry is thereby often the method of choice to obtain sequence information. In mass-spectrometry-based sequencing, forming ions from a single fragment pair (a/x, b/y, or c/z) can be beneficial for the de novo sequencing of antibodies as it avoids spectral congestion and dilution of signal intensity in fragmentation spectra. While conventional mass spectrometric methods such as CID or IRMPD can, in principle, be optimized to enhance the abundance of a single fragment pair, they often come with limited sequence coverage, extensive side-chain cleavages, and substantial internal fragmentation. These disadvantages make of electron capture dissociation (ECD) an alternative choice.5−8 Applied to denatured and native intact antibodies,9,10 ECD results in significant backbone cleavages in both the LC and HC variable regions, primarily leading to the formation of (c/z·) fragment ions. Furthermore, since intramolecular disulfide bridges of native proteins are not frequently cleaved during ECD,11 enhanced fragment formation is observed for sequence segments not involved in disulfide-bridged loops, e.g., for the segments covering the LC and HC CDR3s.9,12
Notwithstanding the tremendous structural complexity of the precursor molecule, we here present a method to obtain straightforward-to-read amino acid sequence ladders from the CDR3 of intact IgA1 molecules. We further optimize ECD toward the de novo sequencing of IgA1 CDR3s and their downstream regions, generating clean fragment ion series composed solely of c-ions.8 Using native mass spectrometry conditions, we achieve maximal separation between the precursor in the high m/z range and the informative fragment ions in the lower m/z range. We also show that, although IgA1 Fab isolation reduces the complexity of the spectrum and simplifies the precursor ion selection, simplified precursors are not required to obtain straightforward sequence reads from IgA1 CDR3 regions. The method thus proves to be generally applicable to IgA1 immunoglobulins and their proteoforms. We conclude by addressing fragment intensity prediction in terms of the energy required to separate fragments stabilized by noncovalent interactions.
Experimental Section
Antibody Samples
Monoclonal IgAs and IgGs against CD20 (anti-CD20)13 were recombinantly expressed and provided by Genmab (Utrecht, The Netherlands). Briefly, mAbs were expressed in Exip293F cells (Life Technologies, Waltham, MA, USA) by transient transfection using an ExpiFectamine 293 transfection kit (Life Technologies, Waltham, MA, USA) according to the instructions of the manufacturer. The culture was harvested 5 days post-transfection by centrifugation for 10 min at 3000g, followed by filter sterilization of the supernatant using a 0.22 μm filter and storage at 4 °C. The amino acid sequences of these antibodies are provided in Table S1.
Preparation of Intact IgA and Fab Samples for Native Top-Down MS Analysis
Fab molecules were generated by overnight digestion at 37 °C of the IgAs bound to CaptureSelect IgA affinity matrix (Thermo Fisher Scientific) using 1 U/μg of the SialEXO sialidase cocktail and the OpeRATOR O-glycopeptidase from Akkermansia muciniphila (Genovis AB, Llund, Sweden) for IgA1s and on-bead digestion of the IgGs bound to CaptureSelect FcXL affinity matrix using 1 U/μg FabALACTICA IgdE (Genovis AB, Llund, Sweden) as described previously.14
Prior to native top-down analysis, buffers were exchanged to aqueous 150 mM ammonium acetate (pH 7.5) through six consecutive dilution and concentration steps at 4 °C using Amicon Ultra centrifugal filters with a 10 kDa molecular weight cutoff (Merck KGaA, Darmstadt, Germany). IgA and IgG concentrations used for native electrospray ionization mass spectrometry were around 4 μM.
Native Top-Down ECD MS
Top-down MS of native immunoglobulins was performed on an ultrahigh mass range (UHMR) Q-Exactive Orbitrap (Thermo Fisher Scientific, Bremen, Germany) using an ECD cell developed by e-MSion.15 First, intact or Fab precursor ions were mass-selected by the quadrupole. The in-source trapping desolvation voltage displays an optimum in terms of ECD at −100 V for Fabs and intact (glycosylated) IgAs and IgGs (data not shown), likely a consequence of the small structural changes occurring as the effective temperature of the ion is raised and leading to cleavage enhancement.16 The ions were then transmitted into the ECD cell where they were subjected to electron capture dissociation. Second, upon transfer from the ECD cell to the HCD (high-energy C-trap dissociation) cell, post-ECD collisional activation was kept to a minimum (HCD direct eV setting = 1) to avoid (b/y) ion formation and concentrate the fragment signal intensity into the c- and z-ions of interest. Overall, HCD cell trapping and extraction parameters were optimized for low nitrogen collision gas pressures to achieve efficient detection of the subunits and fragments. All spectra were acquired with the noise threshold parameter set to 3.64. Whenever possible, a single charge state of the precursor (Fab or intact Ig) was isolated to simplify interpretation of the fragment ion spectra. All spectra were acquired at a set resolution of 200000 at m/z 400.
Data Analysis
Processing of the fragmentation spectra involved the conversion of raw files to mzML format by Proteowizard.17 We used the MSDeisotope python library (Joshua Klein, Boston University CBMS)18,19 with a minimum_score = 10.0 and mass_error_tolerance = 0.02 to generate a charge-deconvoluted spectrum with all of the isotopic peaks retained.18,19
Comparison of unprocessed data with the spectrum reconstructed from the charge-deconvoluted m/[z = 1] spectra corresponding to fragments sharing the same charge state involved shifting each charge-deconvoluted spectrum by (z – 1) × 1.007276, dividing them by their respective charge, z, and superposing the result.
Fragments were assigned by applying LcMsSpectator (Pacific Northwest National Laboratory)20,21 to the charge-deconvoluted spectra generated by MSDeisotope. The accuracy threshold was set to ±3 ppm for all assignments following recalibration of the fragment’s m/z via shifting by the average error on assignable c-ion fragments. The results were exported as .tsv files for further analysis. Sequence assignment accommodated the major ECD ion types (c, z, z·) without considering H2O and NH3 neutral losses, except when explicitly mentioned.
Spectral comparison of native top-down ECD spectra involved an in-house implementation of the cross-correlation approach pioneered for mass spectra by Yates and co-workers.22 Cross-correlation provides a metric for the pairwise comparison of spectra. The approach is ideally suited for cases where fragment isotope envelopes expand well beyond the first isotopic peak, and this peak’s intensity is diminished relative to the base peak in the envelope. For charge-deconvoluted spectra, we report the normalized cross-correlation values for a 1000 m/z mass window slid over the spectra in steps of 10 m/z, except when specified otherwise.
Interaction energies within the IgA1 structure were computed as follows. We used Modeller23 to generate a homology model for the anti-CD20 IgA1 sequence using the PDB ID 3M8O IgA1 structure. The LC and HC backbone bonds between the cysteine residues involved in intrachain disulfide loops were systematically cleaved, leading to the generation of a separate model structure for each cleavage. The resulting structures were geometrically relaxed using foldX (v4),24,25 and the interpolypeptide interactions were computed using the same software.
Results and Discussion
Comparison of IgG1 and IgA1 Glycosylation and Resulting Native Mass Spectra
IgG1s typically harbor a single N-glycosylation site in the Fc region of each of the two heavy chains. Their IgA1 counterparts display a much higher glycosylation and glycan complexity. N-Linked oligosaccharides contribute up to 6–7% of the mass of human IgA1,3,26 with N-glycans found attached to residues Asn263 and Asn459.3,27 In terms of composition, the N-linked glycans of serum and secretory IgAs primarily are of the diantennary complex type, with a small fraction showing triantennary or more branched structures. Additional heterogeneity arises from variable fucosylation levels and numbers of galactoses and sialic acids at the branched termini.28−30 IgA1s also harbor three to six core 1 and/or Tn O-linked glycans, composed principally of N-acetyl galactosamine, galactose, and zero, one, or two sialic acids attached to Ser and Thr sites in the IgA1’s hinge region.29,30 Furthermore, compared to IgG1, IgA1 molecules have an extended hinge region and feature a different disulfide bridging pattern, as schematically depicted in Figure 1A,B. To illustrate IgA1 heterogeneity, a comparison of the native mass spectra of intact IgA1 and IgG1 is displayed in Figure 1C,D. Whereas, for IgG1, baseline-resolved mass spectra allow even the direct analysis of the glycan composition,31 accurate mass determination is severely hampered for IgA1 due to the unresolvable charge states.
Impact of Glycosylation on the Native Top-Down ECD Mass Spectra of Intact IgA1 and IgG1
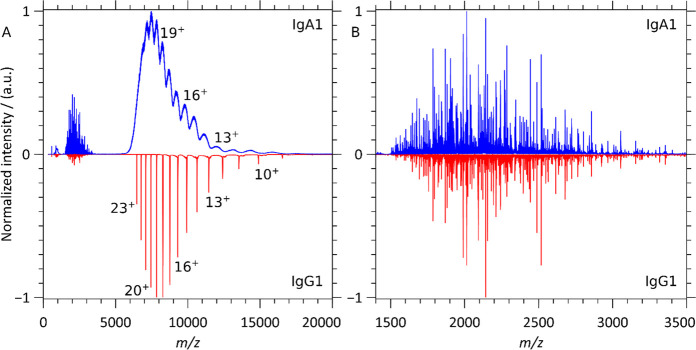
In Figure 2, we compare the native top-down ECD mass spectra of intact anti-CD20 IgA1 and IgG1 in order to assess the impact of the differences in structure and glycosylation on electron capture dissociation. These monoclonal antibodies, which possess identical LCs and identical HC variable regions, only differ in their HC constant regions. The simplicity of the anti-CD20 IgG1 MS1 spectrum allowed isolation of the single 23+ charge state (isolation window of 5 m/z). On the other hand, for the anti-CD20 IgA1, the absence of resolvable charge states (Figure 1C) led us to perform ECD on an m/z window encompassing the whole charge state distribution (5700 < m/z < 6900) as well as on an m/z window (6190 < m/z < 6400) englobing most of the IgA1 25+ charge state (isolation window of 210 m/z). Notably, for IgA1, the resulting ECD spectra looked nearly identical and were thus not influenced by isolating either the broader or narrower m/z window (see supplementary Figure S2).
Figure 2.
Native top-down ECD MS of anti-CD20 IgA1 and IgG1. (A) ECD spectra of intact anti-CD20 IgA1 (blue) and IgG1 (red) dominated by signals resulting from successive electron capture without dissociation. (B) Lower m/z spectral regions corresponding to the single-chain ECD fragments of intact anti-CD20 IgA1 (blue) and IgG1 (red).
In the higher m/z range (5000 < m/z < 20000), electron capture primarily yields charge-reduced peaks–ions absorbing from 1 to 15 electrons without incurring dissociation, i.e., ECnoD,7—resulting for IgG1 in a charge-resolved distribution of precursors. Similar ECnoD processes are observed for IgA1, and although the resulting charge states are still very broad, they improve upon the initial spectrum (Figure 1C). The detectable charge states can yield an average mass estimate for the IgA1 molecules, 157660 ± 170 Da (Table S1).
Despite the large difference in the complexity of the precursor anti-CD20 IgA1 and IgG1 molecules, the low m/z (1400 < m/z < 3500), ECD fragments of these intact immunoglobulins are highly similar, as displayed in Figure 2B and quantified using cross-correlation analysis in the next section. The differences in structure and glycosylation therefore do not seem to impact ECD fragment formation for the CDR3s and FR4s of immunoglobulins.
Comparison of Intact and Fab Arm IgA1’s and IgG1’s ECD-Derived c-Ion Sequence Ladders
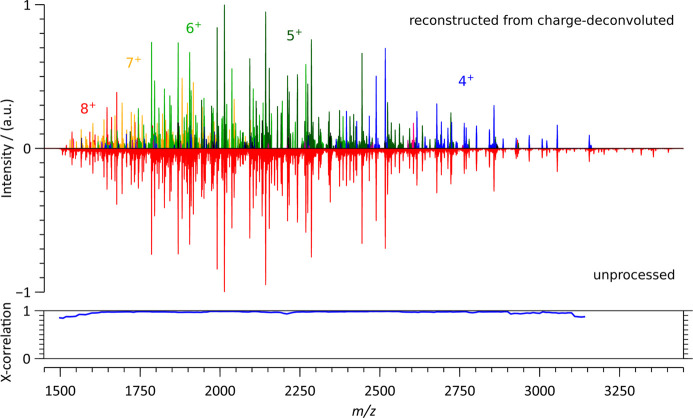
In order to compare fragment masses and abundances, it is more convenient to proceed by inspecting the charge deconvoluted spectra. In Figures 3 and S1, we first assessed the quality of our charge deconvolution process by comparing, for the intact anti-CD20 IgA1, the mass spectrum reconstructed from the charge-deconvoluted mass spectra of fragments segregated according to their charge state with the corresponding unprocessed ECD spectrum. Some large ions with low abundances and low charge states (m/z > 3000, z = 4) are absent from the charge-deconvoluted spectrum. This is a consequence of the S/N and intensity criteria used for peaks to be recognized as part of a given isotopic distribution. Still, although not perfect, a cross-correlation analysis confirms the negligible loss of spectral information introduced by the charge deconvolution process.
Figure 3.
Comparison of the low m/z region of the native top-down ECD spectra of intact anti-CD20 IgA1 spectrum reconstructed from charge-deconvoluted spectra corresponding to fragment charge states ranging from 1+ to 13+ (top spectra), with the unprocessed fragment ion spectrum (bottom spectrum). The most represented charge states are color annotated. Cross-correlation analysis, using a 100 m/z sliding window in steps of 10 m/z, yields an average high score of 0.964.
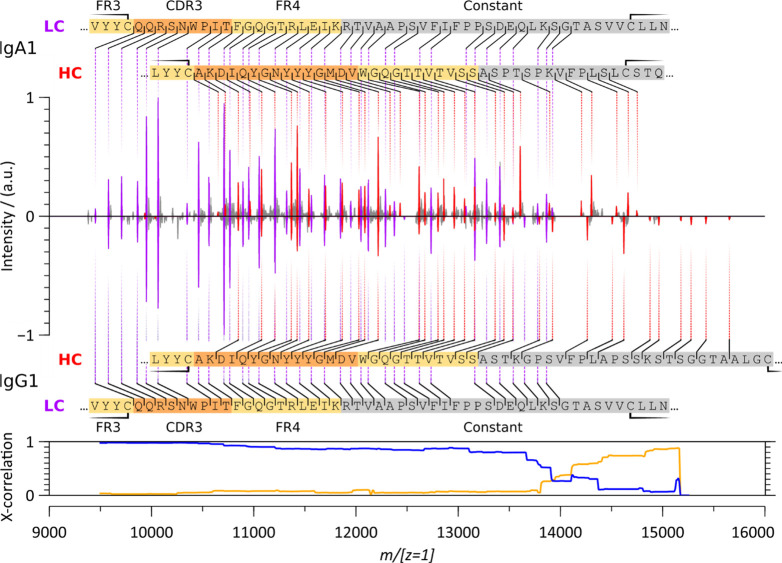
Having established that the charge-deconvoluted spectra account for the majority of the fragment ion signal in the unprocessed spectra, we first compare the charge-deconvoluted ECD spectra of the intact anti-CD20 IgA1 and the anti-CD20 IgG1 (Figure 4). In both cases, straightforward to read c-ion ladders dominate the ECD spectrum in this region and enable sequence determination for both the LC’s and HC’s CDR3 and FR4. Close-to-identical sequence ladders are obtained for anti-CD20 IgA1 and IgG1 up to m/[z = 1]14000 as established by a cross-correlation analysis. As expected, from m/[z = 1]14000, the IgA1 spectrum is shifted relatively to the IgG1 spectrum due to the mass difference between a Pro and a Gly residue in the Fd region (IgA.xxxPTSPK – IgG.xxxTKGPS ≡ 97.0528 − 57.0215 = 40.0313 Da). Additional differences in the higher m/[z = 1]range can be attributed to differences in the disulfide bridging patterns as discussed further below. Practically, the substantial structural heterogeneity of the intact anti-CD20 IgA1 does not affect the ECD process, as determined from similar fragment ion spectra for IgA1 and IgG1 in the lower m/z region.
Figure 4.
Charge-deconvoluted native top-down ECD spectra of intact anti-CD20 IgA1 (top) and IgG1 (bottom). LC c-ion fragments are annotated in purple and the HC c-ion fragments in red. Cross-correlation between all fragments shows a very high similarity up to m/[z = 1]14000 (blue). Accounting for the known sequence deviation between the anti-CD20 IgA1 and anti-CD20 IgG1 constant regions, and the corresponding mass shift (IgA.xxxPTSPK – IgG.xxxTKGPS ≡ 40.0313 Da), restores a high cross-correlation above m/[z = 1]14000 (orange line). See also Figure S2.
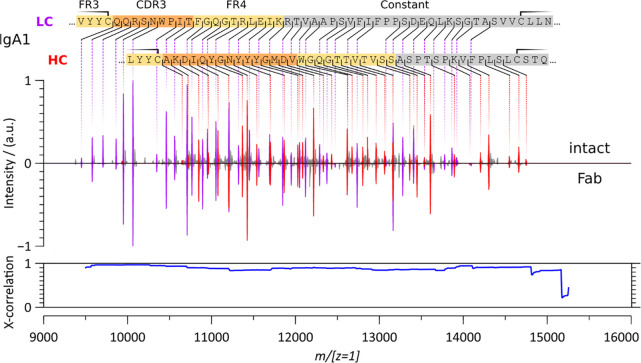
To further corroborate this latter statement, we proceeded with the comparison of the ECD spectra of the intact and Fab arm molecules of the anti-CD20 IgA1 (Figures 5 and S3). Middle-down analysis—here, the analysis of the Fab arms formed upon selective enzymatic digestion—offers an attractive alternative to the analysis of intact Igs as it removes the primary source of heterogeneity (the glycans located on the Igs Fcs). We observed that the native top-down ECD spectra of the 157660 ± 170 Da extensively glycosylated anti-CD20 IgA1 and the corresponding 47958/48618 Da (depending on the OpeRATOR cleavage site, see Tables S1 and S2 and Figure S4) nonglycosylated Fab arm were nearly identical in the lower m/z region, both revealing easy-to-interpret c-ion fragment ladders (Figure 5), a similitude confirmed by a cross-correlation analysis.
Figure 5.
Charge-deconvoluted native top-down ECD spectra of the anti-CD20 IgA1, originating from either the ∼160 kDa highly glycosylated intact form (top) or the corresponding ∼48 kDa nonglycosylated Fab arm (bottom). The LC c-ion fragments are annotated in purple and the HC fragments in red. The cross-correlation analysis (with values >0.85 over the whole spectral range) highlights the similitude between the spectra.
Concomitant c–z Ion Pairs of IgA1 Fab Molecules Reveal That Disulfide Bridges Remain Intact under Pure ECD Conditions
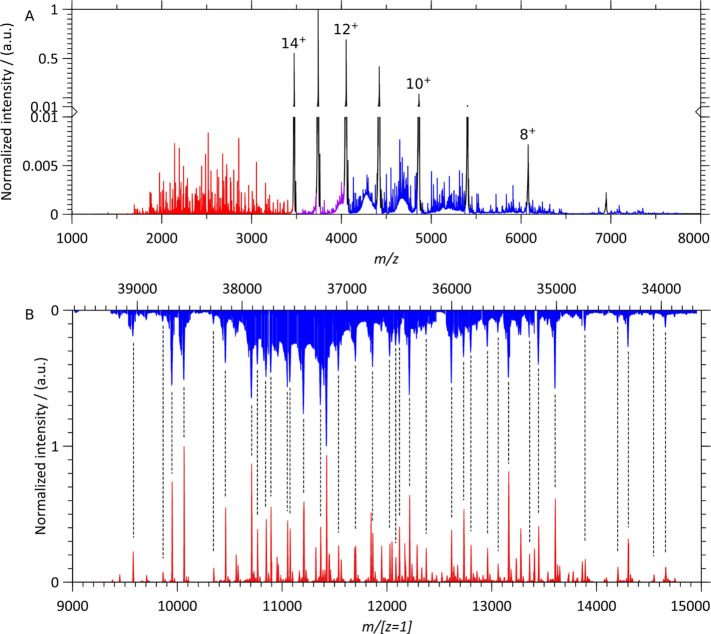
An advantage of fragmenting proteins below 50 kDa in mass is that both the concomitantly formed low m/zc-ions and complementary high m/zz-ions can be isotopically resolved using high-resolution mass spectrometry (here 200000 at m/z 400). This allows us to further corroborate the observation—first evidenced by measurements on IgG8—that ECD without additional vibrational or electronic excitation does not lead to substantial cleavage of disulfide bridges in native immunoglobulins (Figure 6).
Figure 6.
Concomitant N-terminal c-ions and bridged z-ions produced in the native top-down ECD spectra of the anti-CD20 IgA1 Fab precursor, revealing that the inter- and intrachain disulfide bonds remain intact. (A) Most c-ions (< m/z 3500, red) are well separated in the m/z window from their concomitant bridged z-ions (> m/z 3500, blue) which overlap with the charged reduced precursors in the native ECD-MS spectrum of the IgA1 anti-CD20 Fab molecule. The purple regions correspond to the spectral region with overlapping c-ions and bridged z-ions. (B) Alignment of the c- and z-ion pairs, in red and blue, respectively, after charge deconvolution, reveals that their summed-up masses precisely add up to that of the intact 48618 Da Fab precursor for each detected (c, bridged z) ion pair.
With the C-terminal cysteine of the LC forming a disulfide bridge with a cysteine on the HC, two pairs of fragments are detected for each Fab arm molecule: an LC or HC N-terminal c-ion paired with the complementary C-terminal disulfide-bridged z-ion. In contrast to intact Igs, the higher mass disulfide-bridged z-ion—termed “bridged” z-ion to highlight the conservation of the disulfide bridges between the LC and HC—can be isotopically resolved and thereby unambiguously paired with its complementary N-terminal c-ion, as illustrated in Figure 6B. While the near-perfect complementarity of the c- and bridged z-ion spectral regions confirms the conservation of the disulfide bond bridging the LC and HC, it also enables the unambiguous localization of (post-translational) modifications affecting the CDR3 and FR4 regions or the absence thereof. As detailed in Tables S1 and S2 and Figure S4, proteolytic digestion of the anti-CD20 IgA1 results in two Fab species, one at 47958 Da (matching the predicted cleavage site) and another at 48618 Da (the consequence of a proteolytic miscleavage of the operator resulting in an additional TPP at the HC’s C-terminus and an HexHexNAc attached). While identical c-ion ladders, resulting from ECD, confirm the sequence identity of both compounds, matching bridged z-ions unambiguously rule out the presence of labile modifications over the same sequence range.
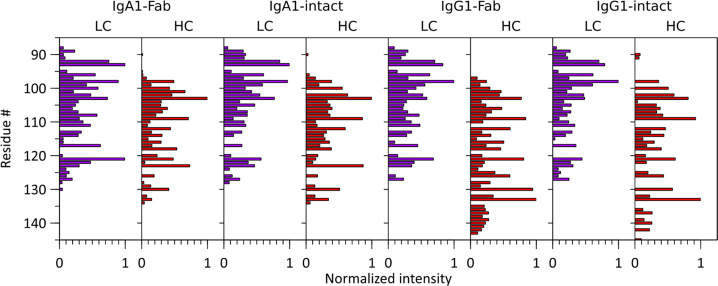
In Figure 7, we compare the c-ion intensities of the heavily and heterogeneously N- and O-glycosylated anti-CD20 IgA1, the corresponding N-glycosylated anti-CD20 IgG1, and their Fab counterparts. Owing to complete sequence identity between the LCs of the anti-CD20 IgA1 and IgG1, LC c-ion ladders are nearly identical. For the HC c-ion ladders, they are highly similar up to residue number 135, a consequence of IgA1 and IgG1 disulfide bridging patterns. Interacting LC and HC chains are organized into Fab arms stabilized by a disulfide bond between the LC C-terminal cysteine and an HC cysteine. This disulfide bond is located significantly more N-terminal in IgA1s than in IgG1s. Compared to IgG1s, the HC of IgA1 also carries two additional intrachain disulfides, one stabilizing the C-terminal end of the Fab part and the other the N-terminal area of the Fc part (Figure 1).3 Consequently, IgA1 disulfide bonds constrain fragmentation to the region between the disulfide-stabilized Ig folds, which is smaller than its IgG1 counterpart and more comparable to the pattern observed for the IgG2, IgG3, and IgG4 subclasses.8
Figure 7.
Bar chart displaying normalized c-ion fragment intensities for each residue in the LCs and HCs of IgA1 Fab, IgA1 intact, IgG1 Fab, and IgG1 intact (see Figure S4 for the detected and annotated much lower abundant a-ions).
Correlation between Fragment Ion Intensity and the Energy Required to Separate ECD Fragments
In native top-down mass spectrometry, ECD fragment ion intensities correlate with structural features ranging from protonation sites directing electron capture, hydrogen-bonding patterns governing radical hydrogen transfer, to covalent and noncovalent interactions hindering fragment separation.7 Here, we investigate the correlation between fragment ion intensity and fragment stabilization by noncovalent interactions.
Briefly, as in other immunoglobulins, native IgA1’s LCs and HCs, respectively, fold into two or four globular secondary structures known as the Ig folds. For both LC and HC, one of these structures is part of the variable region, while others occur in the constant regions. Typically containing about 110 amino acids, each Ig fold comprises two stacked β-sheets made up of antiparallel β-strands sandwiching a stabilizing disulfide bond.3 Additional stabilization of polypeptide pairs relies on an array of noncovalent interactions, chiefly hydrogen bonds and van der Waals interactions, which all may influence the observed fragmentation.
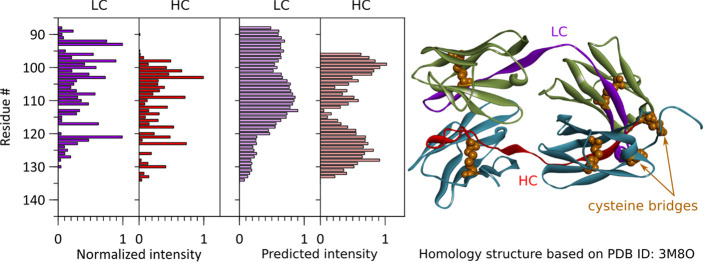
In Figure 8 and Figure S5, we compare ECD c-ion intensities to predictions corresponding to 1 plus the normalized stabilization energy of a given (c-, bridged z-) ion pair, which is negative. As expected, the fragments with the less negative stabilization energies—thus requiring the lowest activation energy to undergo separation—are also among the most abundant in the ECD spectra of Igs. While the current model describes trends reasonably well, an accurate prediction of ion intensities will have to take proton localization and hydrogen interactions with the protein backbone explicitly into account. Still, our simulations show that to some extent the ECD fragment ion spectra of immunoglobulins can be predicted.
Figure 8.
Correlation between observed fragment ion intensities and intensities predicted from the normalized interaction energies of (c-, bridged z-) ion pairs for the anti-CD20 IgA1 Fab molecule using the depicted homology model, based on the crystal structure (PDB ID 3M8O) used to compute the interaction energies.
Conclusion
We explored the benefits of native top-down electron capture dissociation for the mass-spectrometry-based sequencing of immunoglobulins. Extending beyond earlier related work,8,12,32,33 we targeted a very complex heavily glycosylated recombinant immunoglobulin IgA1. Due to this structural heterogeneity, even high-resolution native mass spectrometry is not able to dissect the proteoform composition of the molecule. Overcoming this enormous structural diversity, we deliberately used native ECD as we hypothesized, based on earlier work,8,12 that this could provide sequence coverage restricted to the highly informative hypervariable CDR3 regions of both the light and heavy chains, which carry none of the reported glycosylation sites responsible for this heterogeneity.
We conducted native top-down ECD at minimal collisional activation and low pressure. We obtained straightforward-to-read amino acid sequence ladders restricted solely to c-ions and spanning the CDR3s and FR4s. Very little difference was observed, both qualitatively and quantitatively, between the native top-down ECD spectra of the heterogeneously N- and O-glycosylated anti-CD20 IgA1, the corresponding N-glycosylated anti-CD20 IgG1, and their Fab parts. The data therefore confirm our observation, initially made for the four IgG subclasses, that “pure” ECD, i.e., ECD in the absence of supplemental collisional activation, results in the formation of straightforward-to-read c-ion ladders covering the CDR3 and FR4 of immunoglobulins independently of their class and subclass and can thus also be used to target highly glycosylated immunoglobulins. The observed ECD fragmentation spectra also can, to a large extent, be predicted quantitatively, primarily based on knowledge about the disulfide linkages between the light and heavy chains and interactions between the different domains in the immunoglobulins. Further developments, accounting for protonation sites and hydrogen bonds targeting backbone atoms, are therefore expected to open the way to spectral prediction via libraries incorporating intensity information.
Through this work, we expanded our understanding of the very specific ECD fragmentation occurring in the CDR3 and FR4 regions of different classes of immunoglobulins. We conclude that the optimized ECD method and spectrum prediction algorithms can become very powerful and beneficial for the de novo sequencing of human immunoglobulins.
Acknowledgments
We thank the members of the Heck laboratory for general support, especially Arjan Barendregt. J.F.G. thanks Joshua Klein (Boston University CBMS) for modifications to the MSDeisotope python library. This research received funding through The Netherlands Organization for Scientific Research (NWO) ENPPS.LIFT.019.001 project (A.J.R.H. and J.F.G.), the NACTAR project 16442 (A.J.R.H. and M.A.dB.), and the Spinoza Award SPI.2017.028 to A.J.R.H.
Supporting Information Available
The Supporting Information is available free of charge at https://pubs.acs.org/doi/10.1021/jasms.0c00461.
Charge deconvolution assessment, ECD spectra of anti-CD20 IgA1 and IgG1 Fab arms, MS1 spectrum of anti-CD20 IgA1 Fab, predicted ECD intensities for anti-CD20 IgG1 Fab, amino acid Charge deconvolution assessment, ECD spectra of anti-CD20 IgA1 and IgG1 Fab arms, MS1 spectrum of anti-CD20 IgA1 Fab, predicted ECD intensities for anti-CD20 IgG1 Fab, amino acid sequences (PDF)
Author Contributions
# J.-F.G. and M.A.dB. are contributing first authors.
The authors declare the following competing financial interest(s): F.J.B. and J.S. are Genmab employees and have stock and/or warrants. This work was also partly supported by Genmab through funding for A.B., S.T., and A.J.R.H.
Supplementary Material
References
- Orange J. S.; Hossny E. M.; Weiler C. R.; Ballow M.; Berger M.; Bonilla F. A.; Buckley R.; Chinen J.; El-Gamal Y.; Mazer B. D. Use of Intravenous Immunoglobulin in Human Disease: A Review of Evidence by Members of the Primary Immunodeficiency Committee of the American Academy of Allergy, Asthma and Immunology. J. Allergy Clin. Immunol. 2006, 117 (4), S525–S553. 10.1016/j.jaci.2006.01.015. [DOI] [PubMed] [Google Scholar]
- Leusen J. H. W. IgA as Therapeutic Antibody. Mol. Immunol. 2015, 68 (1), 35–39. 10.1016/j.molimm.2015.09.005. [DOI] [PubMed] [Google Scholar]
- de Sousa-Pereira P.; Woof J. M. IgA: Structure, Function, and Developability. Antibodies 2019, 8 (4), 57. 10.3390/antib8040057. [DOI] [PMC free article] [PubMed] [Google Scholar]
- de Haan N.; Falck D.; Wuhrer M. Monitoring of Immunoglobulin N- and O-Glycosylation in Health and Disease. Glycobiology 2020, 30 (4), 226–240. 10.1093/glycob/cwz048. [DOI] [PMC free article] [PubMed] [Google Scholar]
- Zubarev R. A. Electron-Capture Dissociation Tandem Mass Spectrometry. Curr. Opin. Biotechnol. 2004, 15 (1), 12–16. 10.1016/j.copbio.2003.12.002. [DOI] [PubMed] [Google Scholar]
- Taouatas N.; Drugan M. M.; Heck A. J. R.; Mohammed S. Straightforward Ladder Sequencing of Peptides Using a Lys-N Metalloendopeptidase. Nat. Methods 2008, 5 (5), 405–407. 10.1038/nmeth.1204. [DOI] [PubMed] [Google Scholar]
- Lermyte F.; Valkenborg D.; Loo J. A.; Sobott F. Radical Solutions: Principles and Application of Electron-Based Dissociation in Mass Spectrometry-Based Analysis of Protein Structure. Mass Spectrom. Rev. 2018, 37 (6), 750–771. 10.1002/mas.21560. [DOI] [PMC free article] [PubMed] [Google Scholar]
- den Boer M. A.; Greisch J.-F.; Tamara S.; Bondt A.; Heck A. J. R. Selectivity over Coverage in de Novo Sequencing of IgGs. Chem. Sci. 2020, 11, 11886. 10.1039/D0SC03438J. [DOI] [PMC free article] [PubMed] [Google Scholar]
- Mao Y.; Valeja S. G.; Rouse J. C.; Hendrickson C. L.; Marshall A. G. Top-Down Structural Analysis of an Intact Monoclonal Antibody by Electron Capture Dissociation-Fourier Transform Ion Cyclotron Resonance-Mass Spectrometry. Anal. Chem. 2013, 85 (9), 4239–4246. 10.1021/ac303525n. [DOI] [PubMed] [Google Scholar]
- Shaw J. B.; Malhan N.; Vasil’ev Y. V.; Lopez N. I.; Makarov A.; Beckman J. S.; Voinov V. G. Sequencing Grade Tandem Mass Spectrometry for Top–Down Proteomics Using Hybrid Electron Capture Dissociation Methods in a Benchtop Orbitrap Mass Spectrometer. Anal. Chem. 2018, 90 (18), 10819–10827. 10.1021/acs.analchem.8b01901. [DOI] [PMC free article] [PubMed] [Google Scholar]
- Ganisl B.; Breuker K. Does Electron Capture Dissociation Cleave Protein Disulfide Bonds?. ChemistryOpen 2012, 1 (6), 260–268. 10.1002/open.201200038. [DOI] [PMC free article] [PubMed] [Google Scholar]
- Shaw J. B.; Liu W.; Vasil′ev Y. V.; Bracken C. C.; Malhan N.; Guthals A.; Beckman J. S.; Voinov V. G. Direct Determination of Antibody Chain Pairing by Top-down and Middle-down Mass Spectrometry Using Electron Capture Dissociation and Ultraviolet Photodissociation. Anal. Chem. 2020, 92 (1), 766–773. 10.1021/acs.analchem.9b03129. [DOI] [PMC free article] [PubMed] [Google Scholar]
- Teeling J. L. Characterization of New Human CD20 Monoclonal Antibodies with Potent Cytolytic Activity against Non-Hodgkin Lymphomas. Blood 2004, 104 (6), 1793–1800. 10.1182/blood-2004-01-0039. [DOI] [PubMed] [Google Scholar]
- Bondt A.; Rombouts Y.; Selman M. H. J.; Hensbergen P. J.; Reiding K. R.; Hazes J. M. W.; Dolhain R. J. E. M.; Wuhrer M. Immunoglobulin G (IgG) Fab Glycosylation Analysis Using a New Mass Spectrometric High-Throughput Profiling Method Reveals Pregnancy-Associated Changes. Mol. Cell. Proteomics 2014, 13 (11), 3029–3039. 10.1074/mcp.M114.039537. [DOI] [PMC free article] [PubMed] [Google Scholar]
- Fort K. L.; Cramer C. N.; Voinov V. G.; Vasil’ev Y. V.; Lopez N. I.; Beckman J. S.; Heck A. J. R. Exploring ECD on a Benchtop Q Exactive Orbitrap Mass Spectrometer. J. Proteome Res. 2018, 17 (2), 926–933. 10.1021/acs.jproteome.7b00622. [DOI] [PMC free article] [PubMed] [Google Scholar]
- Pacholarz K. J.; Peters S. J.; Garlish R. A.; Henry A. J.; Taylor R. J.; Humphreys D. P.; Barran P. E. Molecular Insights into the Thermal Stability of MAbs with Variable-Temperature Ion-Mobility Mass Spectrometry. ChemBioChem 2016, 17 (1), 46–51. 10.1002/cbic.201500574. [DOI] [PubMed] [Google Scholar]
- Chambers M. C.; Maclean B.; Burke R.; Amodei D.; Ruderman D. L.; Neumann S.; Gatto L.; Fischer B.; Pratt B.; Egertson J.; Hoff K.; Kessner D.; Tasman N.; Shulman N.; Frewen B.; Baker T. A.; Brusniak M.-Y.; Paulse C.; Creasy D.; Flashner L.; Kani K.; Moulding C.; Seymour S. L.; Nuwaysir L. M.; Lefebvre B.; Kuhlmann F.; Roark J.; Rainer P.; Detlev S.; Hemenway T.; Huhmer A.; Langridge J.; Connolly B.; Chadick T.; Holly K.; Eckels J.; Deutsch E. W.; Moritz R. L.; Katz J. E.; Agus D. B.; MacCoss M.; Tabb D. L.; Mallick P. A Cross-Platform Toolkit for Mass Spectrometry and Proteomics. Nat. Biotechnol. 2012, 30 (10), 918–920. 10.1038/nbt.2377. [DOI] [PMC free article] [PubMed] [Google Scholar]
- Klein J.; Carvalho L.; Zaia J. Application of Network Smoothing to Glycan LC-MS Profiling. Bioinformatics 2018, 34 (20), 3511–3518. 10.1093/bioinformatics/bty397. [DOI] [PMC free article] [PubMed] [Google Scholar]
- Klein J.; Heckendorf C.; Lukauskas S.. Mobiusklein/Ms_deisotope: Release v0.0.10; Zenodo, 2019; https://doi.org/10.5281/zenodo.3475687.
- PNNL-Comp-Mass-Spec/LCMS-Spectator; Computational Mass Spectrometry @ Pacific Northwest National Laboratory, 2020. [Google Scholar]
- Park J.; Piehowski P. D.; Wilkins C.; Zhou M.; Mendoza J.; Fujimoto G. M.; Gibbons B. C.; Shaw J. B.; Shen Y.; Shukla A. K.; Moore R. J.; Liu T.; Petyuk V. A.; Tolić N.; Paša-Tolić L.; Smith R. D.; Payne S. H.; Kim S. Informed-Proteomics: Open-Source Software Package for Top-down Proteomics. Nat. Methods 2017, 14 (9), 909–914. 10.1038/nmeth.4388. [DOI] [PMC free article] [PubMed] [Google Scholar]
- Venable J. D.; Xu T.; Cociorva D.; Yates J. R. Cross-Correlation Algorithm for Calculation of Peptide Molecular Weight from Tandem Mass Spectra. Anal. Chem. 2006, 78 (6), 1921–1929. 10.1021/ac051636h. [DOI] [PubMed] [Google Scholar]
- Fiser A.; Šali A.. Modeller: Generation and Refinement of Homology-Based Protein Structure Models. Methods in Enzymology; Elsevier, 2003; Vol. 374, pp 461–491; https://doi.org/10.1016/S0076-6879(03)74020-8. [DOI] [PubMed] [Google Scholar]
- Schymkowitz J.; Borg J.; Stricher F.; Nys R.; Rousseau F.; Serrano L. The FoldX Web Server: An Online Force Field. Nucleic Acids Res. 2005, 33, W382–W388. 10.1093/nar/gki387. [DOI] [PMC free article] [PubMed] [Google Scholar]
- Schymkowitz J. W. H.; Rousseau F.; Martins I. C.; Ferkinghoff-Borg J.; Stricher F.; Serrano L. Prediction of Water and Metal Binding Sites and Their Affinities by Using the Fold-X Force Field. Proc. Natl. Acad. Sci. U. S. A. 2005, 102 (29), 10147–10152. 10.1073/pnas.0501980102. [DOI] [PMC free article] [PubMed] [Google Scholar]
- Tomana M.; Niedermeier W.; Mestecky J.; Skvaril F. The Differences in Carbohydrate Composition between the Subclasses of IgA Immunoglobulins. Immunochemistry 1976, 13 (4), 325–328. 10.1016/0019-2791(76)90342-6. [DOI] [PubMed] [Google Scholar]
- Maurer M. A.; Meyer L.; Bianchi M.; Turner H. L.; Le N. P. L.; Steck M.; Wyrzucki A.; Orlowski V.; Ward A. B.; Crispin M.; Hangartner L. Glycosylation of Human IgA Directly Inhibits Influenza A and Other Sialic-Acid-Binding Viruses. Cell Rep. 2018, 23 (1), 90–99. 10.1016/j.celrep.2018.03.027. [DOI] [PMC free article] [PubMed] [Google Scholar]
- Field M. C.; Amatayakul-Chantler S.; Rademacher T. W.; Rudd P. M.; Dwek R. A. Structural Analysis of the N-Glycans from Human Immunoglobulin Al: Comparison of Normal Human Serum Immunoglobulin Al with That Isolated from Patients with Rheumatoid Arthritis. Biochem. J. 1994, 299, 261–275. 10.1042/bj2990261. [DOI] [PMC free article] [PubMed] [Google Scholar]
- Mattu T. S.; Pleass R. J.; Willis A. C.; Kilian M.; Wormald M. R.; Lellouch A. C.; Rudd P. M.; Woof J. M.; Dwek R. A. The Glycosylation and Structure of Human Serum IgA1, Fab, and Fc Regions and the Role of N-Glycosylation on Fcα Receptor Interactions. J. Biol. Chem. 1998, 273 (4), 2260–2272. 10.1074/jbc.273.4.2260. [DOI] [PubMed] [Google Scholar]
- Royle L.; Roos A.; Harvey D. J.; Wormald M. R.; Van Gijlswijk-Janssen D.; Redwan E.-R. M.; Wilson I. A.; Daha M. R.; Dwek R. A.; Rudd P. M. Secretory IgA N- and O-Glycans Provide a Link between the Innate and Adaptive Immune Systems. J. Biol. Chem. 2003, 278 (22), 20140–20153. 10.1074/jbc.M301436200. [DOI] [PubMed] [Google Scholar]
- Rosati S.; Rose R. J.; Thompson N. J.; van Duijn E.; Damoc E.; Denisov E.; Makarov A.; Heck A. J. R. Exploring an Orbitrap Analyzer for the Characterization of Intact Antibodies by Native Mass Spectrometry. Angew. Chem., Int. Ed. 2012, 51 (52), 12992–12996. 10.1002/anie.201206745. [DOI] [PubMed] [Google Scholar]
- Fornelli L.; Srzentić K.; Huguet R.; Mullen C.; Sharma S.; Zabrouskov V.; Fellers R. T.; Durbin K. R.; Compton P. D.; Kelleher N. L. Accurate Sequence Analysis of a Monoclonal Antibody by Top-Down and Middle-Down Orbitrap Mass Spectrometry Applying Multiple Ion Activation Techniques. Anal. Chem. 2018, 90 (14), 8421–8429. 10.1021/acs.analchem.8b00984. [DOI] [PMC free article] [PubMed] [Google Scholar]
- He L.; Anderson L. C.; Barnidge D. R.; Murray D. L.; Hendrickson C. L.; Marshall A. G. Analysis of Monoclonal Antibodies in Human Serum as a Model for Clinical Monoclonal Gammopathy by Use of 21 T FT-ICR Top-Down and Middle-Down MS/MS. J. Am. Soc. Mass Spectrom. 2017, 28 (5), 827–838. 10.1007/s13361-017-1602-6. [DOI] [PubMed] [Google Scholar]
Associated Data
This section collects any data citations, data availability statements, or supplementary materials included in this article.


