

Abstract
Current microscopic and endoscopic technologies for cancer screening utilize white-light illumination sources. Hyper-spectral imaging has been shown to improve sensitivity while retaining specificity when compared to white-light imaging in both microscopy and in vivo imaging.1,2 However, hyperspectral imaging methods have historically suffered from slow acquisition times due to the narrow bandwidth of spectral filters. Often minutes are required to gather a full image stack. We have developed a novel approach called excitation-scanning hyperspectral imaging that provides 2-3 orders of magnitude increased signal strength. This reduces acquisition times significantly, allowing for live video acquisition. Here, we describe a preliminary prototype excitation-scanning hyperspectral imaging system that can be coupled with endoscopes or microscopes for hyperspectral imaging of tissues and cells.
Our system is comprised of three subsystems: illumination, transmission, and imaging. The illumination subsystem employs light-emitting diode arrays to illuminate at different wavelengths. The transmission subsystem utilizes a unique geometry of optics and a liquid light guide. Software controls allow us to interface with and control the subsystems and components. Digital and analog signals are used to coordinate wavelength intensity, cycling and camera triggering. Testing of the system shows it can cycle 16 wavelengths at as fast as 1 ms per cycle. Additionally, more than 18% of the light transmits through the system. Our setup should allow for hyperspectral imaging of tissue and cells in real time.
Keywords: Spectroscopy, excitation, hyperspectral, design, tissue imaging, microscopy, endoscopy, LED
1.0. INTRODUCTION
Treatment and rehabilitation of cancer relies on early detection and characterization.3 A study of cancer detection found that up to 27% of small, flat colorectal adenomas are undiagnosed with current white-light endoscopic methods.4 Thus, hyperspectral imaging provides the potential for earlier detection of lesions in vivo and ex vivo.5–8
Prior studies have shown that hyperspectral imaging can provide increased sensitivity over white-light imaging for cancer detection.1,2 The current gold standard for cancer diagnosis is tissue biopsy and histopathological evaluation, due to the low sensitivity of white light imaging. Unfortunately, hyperspectral imaging technologies have historically been limited in speed, sensitivity, or number of wavelengths.9 In order to increase the speed of our imaging device, we developed an excitation-scanning technology for endoscopic and microscopic hyperspectral imaging that allows the potential fast enough frame rates for real-time hyperspectral imaging.10 Our system provides 16 wavelengths of light and can by cycled at speeds exceeding 1 ms. These results indicate 20 frames per second (e.g., 320 bands imaged per second) hyperspectral image acquisition is achievable.
2.0. MATERIALS AND METHODS
2.1. System Assembly and Overview
Our system utilized a mix of off-the-shelf and in-house fabricated components. The detector was a sCMOS scientific camera (Andor Zyla 5.5). The camera was connected to the left port of an inverted fluorescence microscope (Nikon Eclipse Ti) equipped with custom dichroic beamsplitters (Semrock). The spectral light source was assembled in our lab. A light-proof enclosure was fabricated by Protocase. The primary components of the light source were mirrors and a lens array that passes sixteen different wavelengths of light into a single liquid light guide. Nikon Elements software (Nikon Instruments) was used to control the system. The electronics and software allowed any wavelength, or combination thereof, to be switched in sequence. The camera system was externally triggered by the software via National Instruments cards, facilitating high-speed image capture at each wavelength.
Alignment components were 3D printed or fabricated in-house. These included lens holders, mirror mounts, mounting plate, adjustable light-guide coupling apparatus, adjustable diode brackets, electrical component mounts, and circuit boards. The electronics were composed of a DC power supply, desktop computer, custom-made control board with individual LED channels connected via CAT5e, a relay switch, and supporting subcomponents. The control board was comprised of constant current LED drivers and resistors. LED current drivers were used to regulate the power to each diode to allow variable power control. Additionally, these current drivers could receive a digital on/off signal for pulsed operation which facilitates quick cycling of wavelengths. Illumination output was combined via a lens array and a mirrored hexadecagon with a raised center which creates an angle that allows for the light to pass into the end of a single liquid light-guide.
2.2. System Characterization
Next, the system was characterized in order to measure the spectral illumination profile. First, speed tests were conducted by setting cycling speeds of the LEDs and synchronizing the cycling of each diode to image acquisition. A fiber-coupled high-sensitivity spectrometer (QE6500, Ocean Optics) and an integrating sphere (FIOS, Ocean Optics), were used to determine power output vs current delivery. This determination was necessary to allow for a flat spectral illumination profile across all wavelengths.
2.3. Imaging Methods
Imaging was performed using an inverted microscope (Nikon Eclipse Ti) with a 60x objective. Fluorescence excitation was provided by our custom light source. A long-pass dichroic beamsplitter (Semrock) separated emission from excitation light. The hyperspectral image acquisition collected an image stack from 370-525 nm at specific wavelengths. Previous characterization and testing showed that certain diodes had power outputs outside of our characteristic range; thus, they were omitted from data-collection. Wavelength intensities were adjusted to provide flat spectral excitation across all wavelengths.
3.0. RESULTS AND CONCLUSIONS
The system was tested using a spectrometer to measure radiant power at each individual wavelength. The power output was characterized across a range of currents. Operational speed was tested via software and was found to be fast enough to acquire images at all 16 wavelengths in under 20 milliseconds. This is fast enough for video feeds for 640x540 resolution. At a slightly slower speed 1280x1080 resolution can be achieved. Some of our diodes were found to be outside of our characteristic power output range, thus for imaging, these were wavelength bands were omitted. However, all diodes were used when testing operational speed and image acquisition times.
Hyperspectral imaging shows great promise for improving the specificity and multiplexing capabilities of fluorescence microscopy studies and for improving detection sensitivity and specificity for clinical imaging devices, such as endoscopes. In prior work, we have shown that hyperspectral microscopy allows multilabel FRET studies to be performed for automated subcellular analysis of second messenger signals.11–13 Our work indicates that fluorescence excitation-scanning hyperspectral imaging shows promise as an alternative hyperspectral imaging modality for very high-speed imaging. Additionally, our proof of concept and test apparatus shows that hyperspectral imaging has the potential to allow for live video imaging of tissue in vivo and ex vivo.
4.0. FUTURE WORK
Further optimizations will include light path adjustments, diode improvements, and software development. Many of the diode power outputs did not overlap in our operational ranges. Therefore, 7 of the LEDs could not be used for imaging. This will be rectified in the next prototype. Upon optimization of the prototype, we plan to construct a number of “gamma” prototype systems for a variety of laboratory environments and settings. Development of a fluorescence excitation spectral library will be necessary for diagnostic interpretation of image data. Further development of this system will also include analysis tools based on spectral information to attempt automated region of interest detection.
Figure 1 –
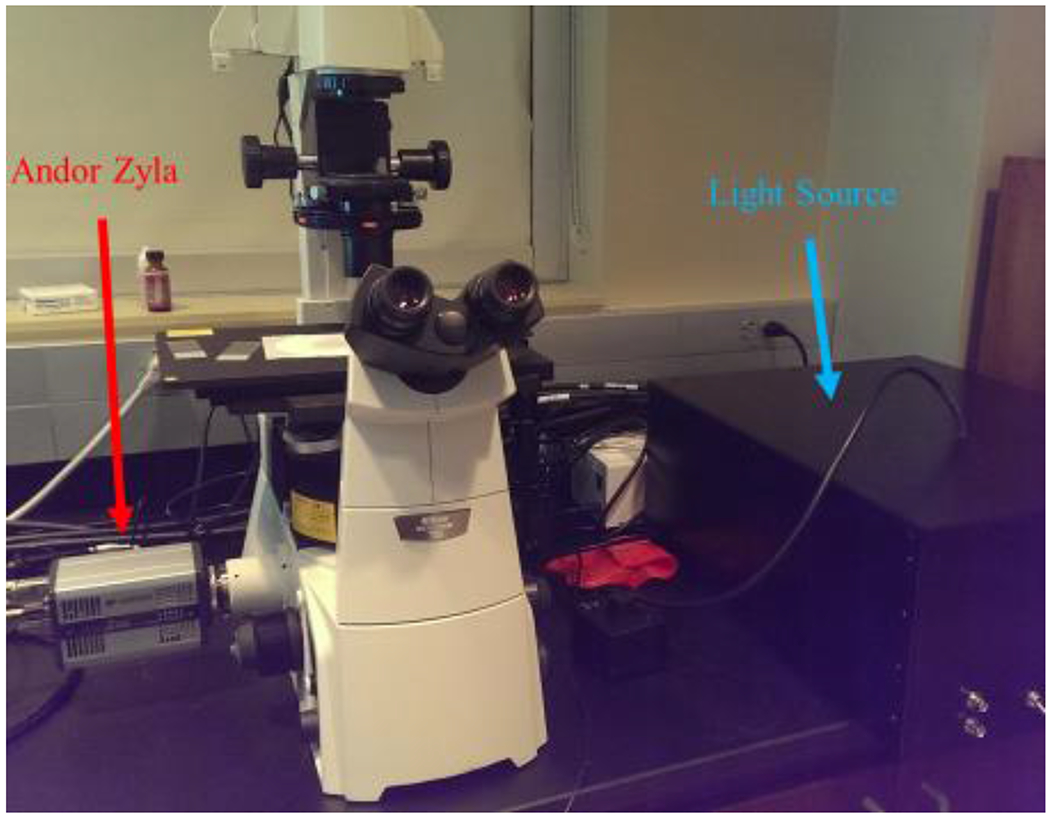
The system layout above shows the Andor Zyla sCMOS camera connected to a Nikon Eclipse Ti microscope with a liquid light guide feeding from the light source to the microscope.
Figure 2.
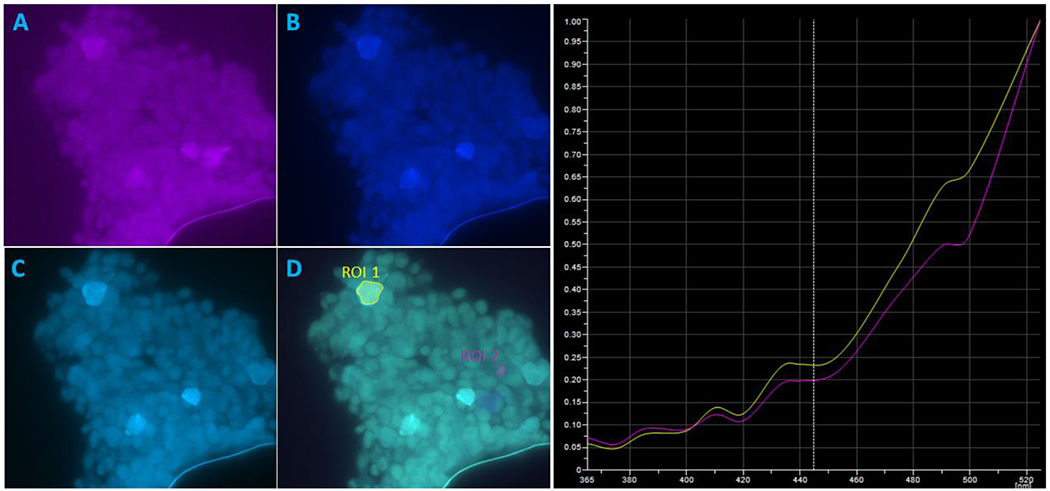
Three individual wavelengths captured at 1280x1080 pixels by our system, and a merged image containing all wavelengths. The images above were illuminated at A) 410 nm, B) 460 nm, and C) 490 nm. Image D) is a mixture of 370, 380, 390, 410, 435, 460, 475, 490, and 525 nm and false-colored to portray contributions from each wavelength. The preliminary normalized spectra shown on the right indicate small difference between the selected ROIs. This is attributed to being unable to utilize all wavelengths for imaging.
5.0. ACKNOWLEDGEMENTS
The authors give thanks to the Alabama Space Grant Consortium, NIH grants P01 HL066299, UL1 TR001417, and the Abraham Mitchell Cancer Research Fund for their support.
REFERENCES
- [1].Hirsch FR, Prindiville SA, Miller YE, Franklin WA, Dempsey EC, Murphy JR, Bunn PA, and Kennedy TC, “Fluorescence Versus White-Light Bronchoscopy for Detection of Preneoplastic Lesions: a Randomized Study,” Journal of the National Cancer Institute 93(18), 1385–1391 (2001). [DOI] [PubMed] [Google Scholar]
- [2].Haringsma J, Tytgat GNJ, Yano H, Iishi H, Tatsuta M, Ogihara T, Watanabe H, Sato N, Marcon N, et al. , “Autofluorescence endoscopy: Feasibility of detection of GI neoplasms unapparent to white light endoscopy with an evolving technology,” Gastrointestinal Endoscopy 53(6), 642–650 (2001). [DOI] [PubMed] [Google Scholar]
- [3].Kester RT, Bedard N, Gao L, and Tkaczyk TS, “Real-time snapshot hyperspectral imaging endoscope,” Journal of Biomedical Optics 16(5), 056005–056005 (2011). [DOI] [PMC free article] [PubMed] [Google Scholar]
- [4].Dekker E, and Fockens P, “Advances in colonic imaging: new endoscopic imaging methods,” Journal of Gastroenterology 17(8), 803–808 (2005). [DOI] [PubMed] [Google Scholar]
- [5].Vo-Dinh T, “A hyperspectral imaging system for in vivo optical diagnostics,” IEEE Engineering in Medicine and Biology Magazine 23(5), 40–49 (2004). [DOI] [PubMed] [Google Scholar]
- [6].Leavesley S, Jiang Y, Patsekin V, Rajwa B, and Robinson JP, “An excitation wavelength scanning spectral imaging system for preclinical imaging,” Review of Scientific Instruments 79(2), 023707–023707–10 (2008). [DOI] [PubMed] [Google Scholar]
- [7].Leavesley SJ, Annamdevula N, Boni J, Stocker S, Grant K, Troyanovsky B, Rich TC, and Alvarez DF, “Hyperspectral imaging microscopy for identification and quantitative analysis of fluorescently-labeled cells in highly autofluorescent tissue,” Journal of Biophotonics 5(1), 67–84 (2012). [DOI] [PMC free article] [PubMed] [Google Scholar]
- [8].Schultz RA, Nielsen T, Zavaleta JR, Ruch R, Wyatt R, and Gamer HR, “Hyperspectral imaging: A novel approach for microscopic analysis,” Cytometry 43(4), 239–247 (2001). [DOI] [PubMed] [Google Scholar]
- [9].Favreau P, Hernandez C, Lindsey AS, Alvarez DF, Rich T, Prabhat P, and Leavesley SJ, “Thin-film tunable filters for hyperspectral fluorescence microscopy,” Journal of Biomedical Optics 19(1), 011017–011017 (2013). [DOI] [PMC free article] [PubMed] [Google Scholar]
- [10].Favreau PF, Hernandez C, Heaster T, Alvarez DF, Rich TC, Prabhat P, and Leavesley SJ, “Excitation-scanning hyperspectral imaging microscope,” Journal of Biomedical Optics 19(4), 046010–046010 (2014). [DOI] [PMC free article] [PubMed] [Google Scholar]
- [11].Leavesley SJ, Britain AL, Cichon LK, Nikolaev VO, and Rich TC, “Assessing FRET using spectral techniques,” Cytometry Part A 83(10), 898–912 (2013). [DOI] [PMC free article] [PubMed] [Google Scholar]
- [12].Leavesley SJ, Nakhmani Arie, Gao Yi, and Rich TC, “Automated Image Analysis of FRET Signals for Subcellular cAMP Quantification,” cAMP Signaling: Methods and Protocols (2015). [DOI] [PubMed] [Google Scholar]
- [13].Rich T, Britain A, Stedman T, and Leavesley S, [Hyperspectral Imaging of FRET-Based cGMP Probes] , in Guanylate Cyclase Cycl. T. Krieg GMP and Lukowski R, Eds., Humana Press, 73–88 (2013). [DOI] [PubMed] [Google Scholar]