Abstract
Autofluorescence has historically been considered a nuisance in medical imaging. Many endogenous fluorophores, specifically, collagen, elastin, NADH, and FAD, are found throughout the human body. Diagnostically, these signals can be prohibitive since they can outcompete signals introduced for diagnostic purposes. Recent advances in hyperspectral imaging have allowed the acquisition of significantly more data in a shorter time period by scanning the excitation spectra of fluorophores. The reduced acquisition time and increased signal-to-noise ratio allow for separation of significantly more fluorophores than previously possible. Here, we propose to utilize excitation-scanning of autofluorescence to examine tissues and diagnose pathologies.
Spectra of autofluorescent molecules were obtained using a custom inverted microscope (TE-2000, Nikon Instruments) with a Xe arc lamp and thin film tunable filter array (VersaChrome, Semrock, Inc.) Scans utilized excitation wavelengths from 360 nm to 550 nm in 5 nm increments. The resultant spectra were used to examine hyperspectral image stacks from various collaborative studies, including an atherosclerotic rat model and a colon cancer study. Hyperspectral images were analyzed with ENVI and custom Matlab scripts including linear spectral unmixing (LSU) and principal component analysis (PCA). Initial results suggest the ability to separate the signals of endogenous fluorophores and measure the relative concentrations of fluorophores among healthy and diseased states of similar tissues. These results suggest pathology-specific changes to endogenous fluorophores can be detected using excitation-scanning hyperspectral imaging. Future work will expand the library of pure molecules and will examine more defined disease states.
Keywords: Hyperspectral, Fluorescence, Spectroscopy, Microscopy, Linear Spectral Unmixing, Autofluorescence
1. INTRODUCTION
Researchers began using exogenous fluorescence sources for biological imaging as early as the 1940’s1. Coons et al. used fluorescein chemically bound to an antibody to visualize that antibody in tissue sections, creating the field of immunofluorescence microscopy. Fluorescence microscopy advanced further with the cloning of the green fluorescent protein (GFP) in the 1990’s2 and the development of GFP’s many variants.3 Combining fluorescent proteins with genetic encoding expanded the applications of fluorescence microscopy, allowing researchers to tag specific proteins with fluorescent markers and track their movements and interactions.4 The common complication to these new fluorescence techniques was the endogenous fluorescence of the cells or tissues themselves, called autofluorescence. Autofluorescent signals can compete with or overpower the signal introduced for study. This was especially true of the first fluorescent proteins, as they had yet to be optimized for imaging and had relatively weak signals. The solution was often to choose a fluorophore with an emission spectrum as different as possible from the autofluorescence or alter the excitation wavelength to selectively excite the introduced fluorophore and not the autofluorescence or use a very high concentration of fluorescent label.5–7 These compromises often led to weak or nonspecific signals, further compounded by a lack of noise separation from older detection equipment and analysis methods. Schultz introduced an elegant solution to separation of fluorescence signals in 2001 when he applied hyperspectral imaging to fluorescence microscopy.8
Hyperspectral imaging began with remote sensing and geologic applications by NASA.9,10 Subsequent applications of hyperspectral imaging have reached virtually every field of science including: agriculture11, archaeology12, astronomy13, biomedicine14, crime scene investigation15, environmental science16, eye care17, food and safety18, forensics19, and surveillance20. Although hyperspectral imaging was initially performed via spectral reflectance, advancements in both imaging technology and processing now allow measurement of absorbance and fluorescence. The basis of this technique is that every object interacts with light in a unique and wavelength dependent way and the resultant measurements are termed spectral signatures. Thus, hyperspectral imaging is especially relevant in fields such as fluorescence microscopy where the entire method is predicated on a molecule’s interaction with light. Recently, our lab has shown that the common method of hyperspectral imaging, emission-scanning hyperspectral imaging, reduces detectable signal and has limited applications for time-sensitive and photosensitive studies, thereby limiting its effectiveness in medical imaging.21–23 To overcome these limitations, we have designed an excitation-scanning system.21–23 This new approach provides excitation light at discrete wavelengths over a broad wavelength range and collects all of the emitted light beyond a predetermined cutoff wavelength, which has been shown to significantly increase the signal-to-noise ratio of the acquired data while drastically reducing the acquisition time.
Although excitation-scanning hyperspectral imaging increases the effectiveness of signal separation and therefore strengthens the ability to separate autofluorescence from exogenous signals, one might wonder if the endogenous fluorescence itself could be diagnostic. Using endogenous fluorescence for diagnostic purposes is not a novel concept, but current methodology to investigate autofluorescent signals for medical purposes is limited in one of several ways, such as lack of distinct signal separation, low signal to noise ratios, or prohibitively lengthy acquisition times.24–27 As previously stated, excitation-scanning hyperspectral imaging provides a potential solution for all three of these problems. Herein, we explore the application of excitation-scanning hyperspectral imaging exclusively for analysis of endogenous fluorescence in comparative healthy and diseased tissues. Using a spectral library created with pure samples of each suspected endogenous fluorophore, we have separated the respective fluorescent signals of each fluorophore in each tissue and compared the results.
2. METHODS
2.1. Tissue specimens
Human colon samples were obtained from colorectal resections from the University of South Alabama Medical Center Department of Surgery. All human tissue specimens were obtained in accordance with protocols approved by the University of South Alabama Institutional Review Board. Following resection, samples were sent to the University of South Alabama Medical Center Department of Pathology. Tissue samples obtained from pathology were separated into cancerous lesions and surrounding non-lesional tissue, and later confirmed by histology. Samples were placed on ice immediately after resection, rinsed with PBS, cut into approximately 2 cm cubes, and imaged within 8 hours. All imaging was performed using a 25 mm round coverslip mounted in an AttoFluor coverslip holder (Life Technologies). Each tissue sample scan included a minimum of three fields of view, not including the field of view used to generate the background spectrum.
2.2. Excitation-scanning microscope setup and image acquisition
All imaging was performed on an inverted fluorescence microscope (TE2000-U, Nikon Instruments) with a 20X objective and 300-W Xe arc lamp (Titan 300, Sunoptic Technologies) for excitation. Excitation wavelength tuning (360 nm – 550 nm in 5 nm increments) was achieved via a custom array of 5 thin-film tunable filters immediately following the excitation source. A filter cube consisting of a long-pass barrier filter and dichroic beamsplitter was utilized to separate excitation and emission light at 550 nm. An electron-multiplied charge-coupled-device (EM-CCD) camera was used to acquire the fluorescence images.
2.3. Image processing and analysis
Images were processed into spectral image cubes through custom MATLAB (MathWorks, Natick, MA) scripts. The resultant cubes were visualized with ENVI software (Exelis Visual Information Solutions, Boulder, CO) as a three dimensional image cube composed of two spatial and one spectral dimension. Images were false-colored in the spectral dimension according to wavelength-dependent intensity, with blue, green, and red images merged using 10%, 50%, and 90% of the spectral range, respectively. Background subtraction and wavelength dependent illumination were completed as described previously.28,29 Briefly, a pixel-averaged background spectrum was extracted from a field of view of each tissue sample containing no tissue and then subtracted from all other fields of view for the respective samples. Image stacks were corrected for wavelength dependent illumination by multiplication of correction coefficients determined by use of a NIST-traceable lamp (LS-1-CAL-INT, Ocean Optics, Inc.) and a fiber-coupled spectrometer (QE65000, Ocean Optics, Inc.)
Suspensions of collagen, elastin, FAD, NADH, and protoporphyrin IX (PPIX) were created from commercially available powders according to product specifications. The pure samples were imaged and processed in the same manner as the tissue specimens above. The spectra were used to generate a spectral library for signal separation. A custom MATLAB script utilized non-negatively constrained linear regression for linear spectral unmixing to generate a fluorescence intensity image per fluorophore in the library. Measurements from these images were obtained using ImageJ software and compared to each other and to the total fluorescence signal available in the image. An additional set of unmixed images were created and processed using a spectral library generated from the same pure samples in a spectrofluorometer (QuantaMaster 40, Photon Technology International).
3. RESULTS AND DISCUSSION
Autofluorescent molecules can either be a compounding factor or a signal source for fluorescence imaging. Measurement of autofluorescence has been utilized for optical biopsy with promising results but limited ability for clinical implementation in an image-based screening platform due to low inherent signal and prohibitively long acquisition time.30 Furthermore, shifts in the spectral signature cannot currently be attributed to any one molecule. For example, it is currently unknown if the interaction between two fluorescent molecules in tissue changes the spectral signature of that tissue beyond simply the sum of the two signals themselves. A shift in the signature could be a change corresponding to abundance of a single molecule or a compounding result of interactions among fluorophores. Thus, given the current, preferred methods of utilizing exogenous fluorescence markers in medical imaging, autofluorescence is generally considered a nuisance.
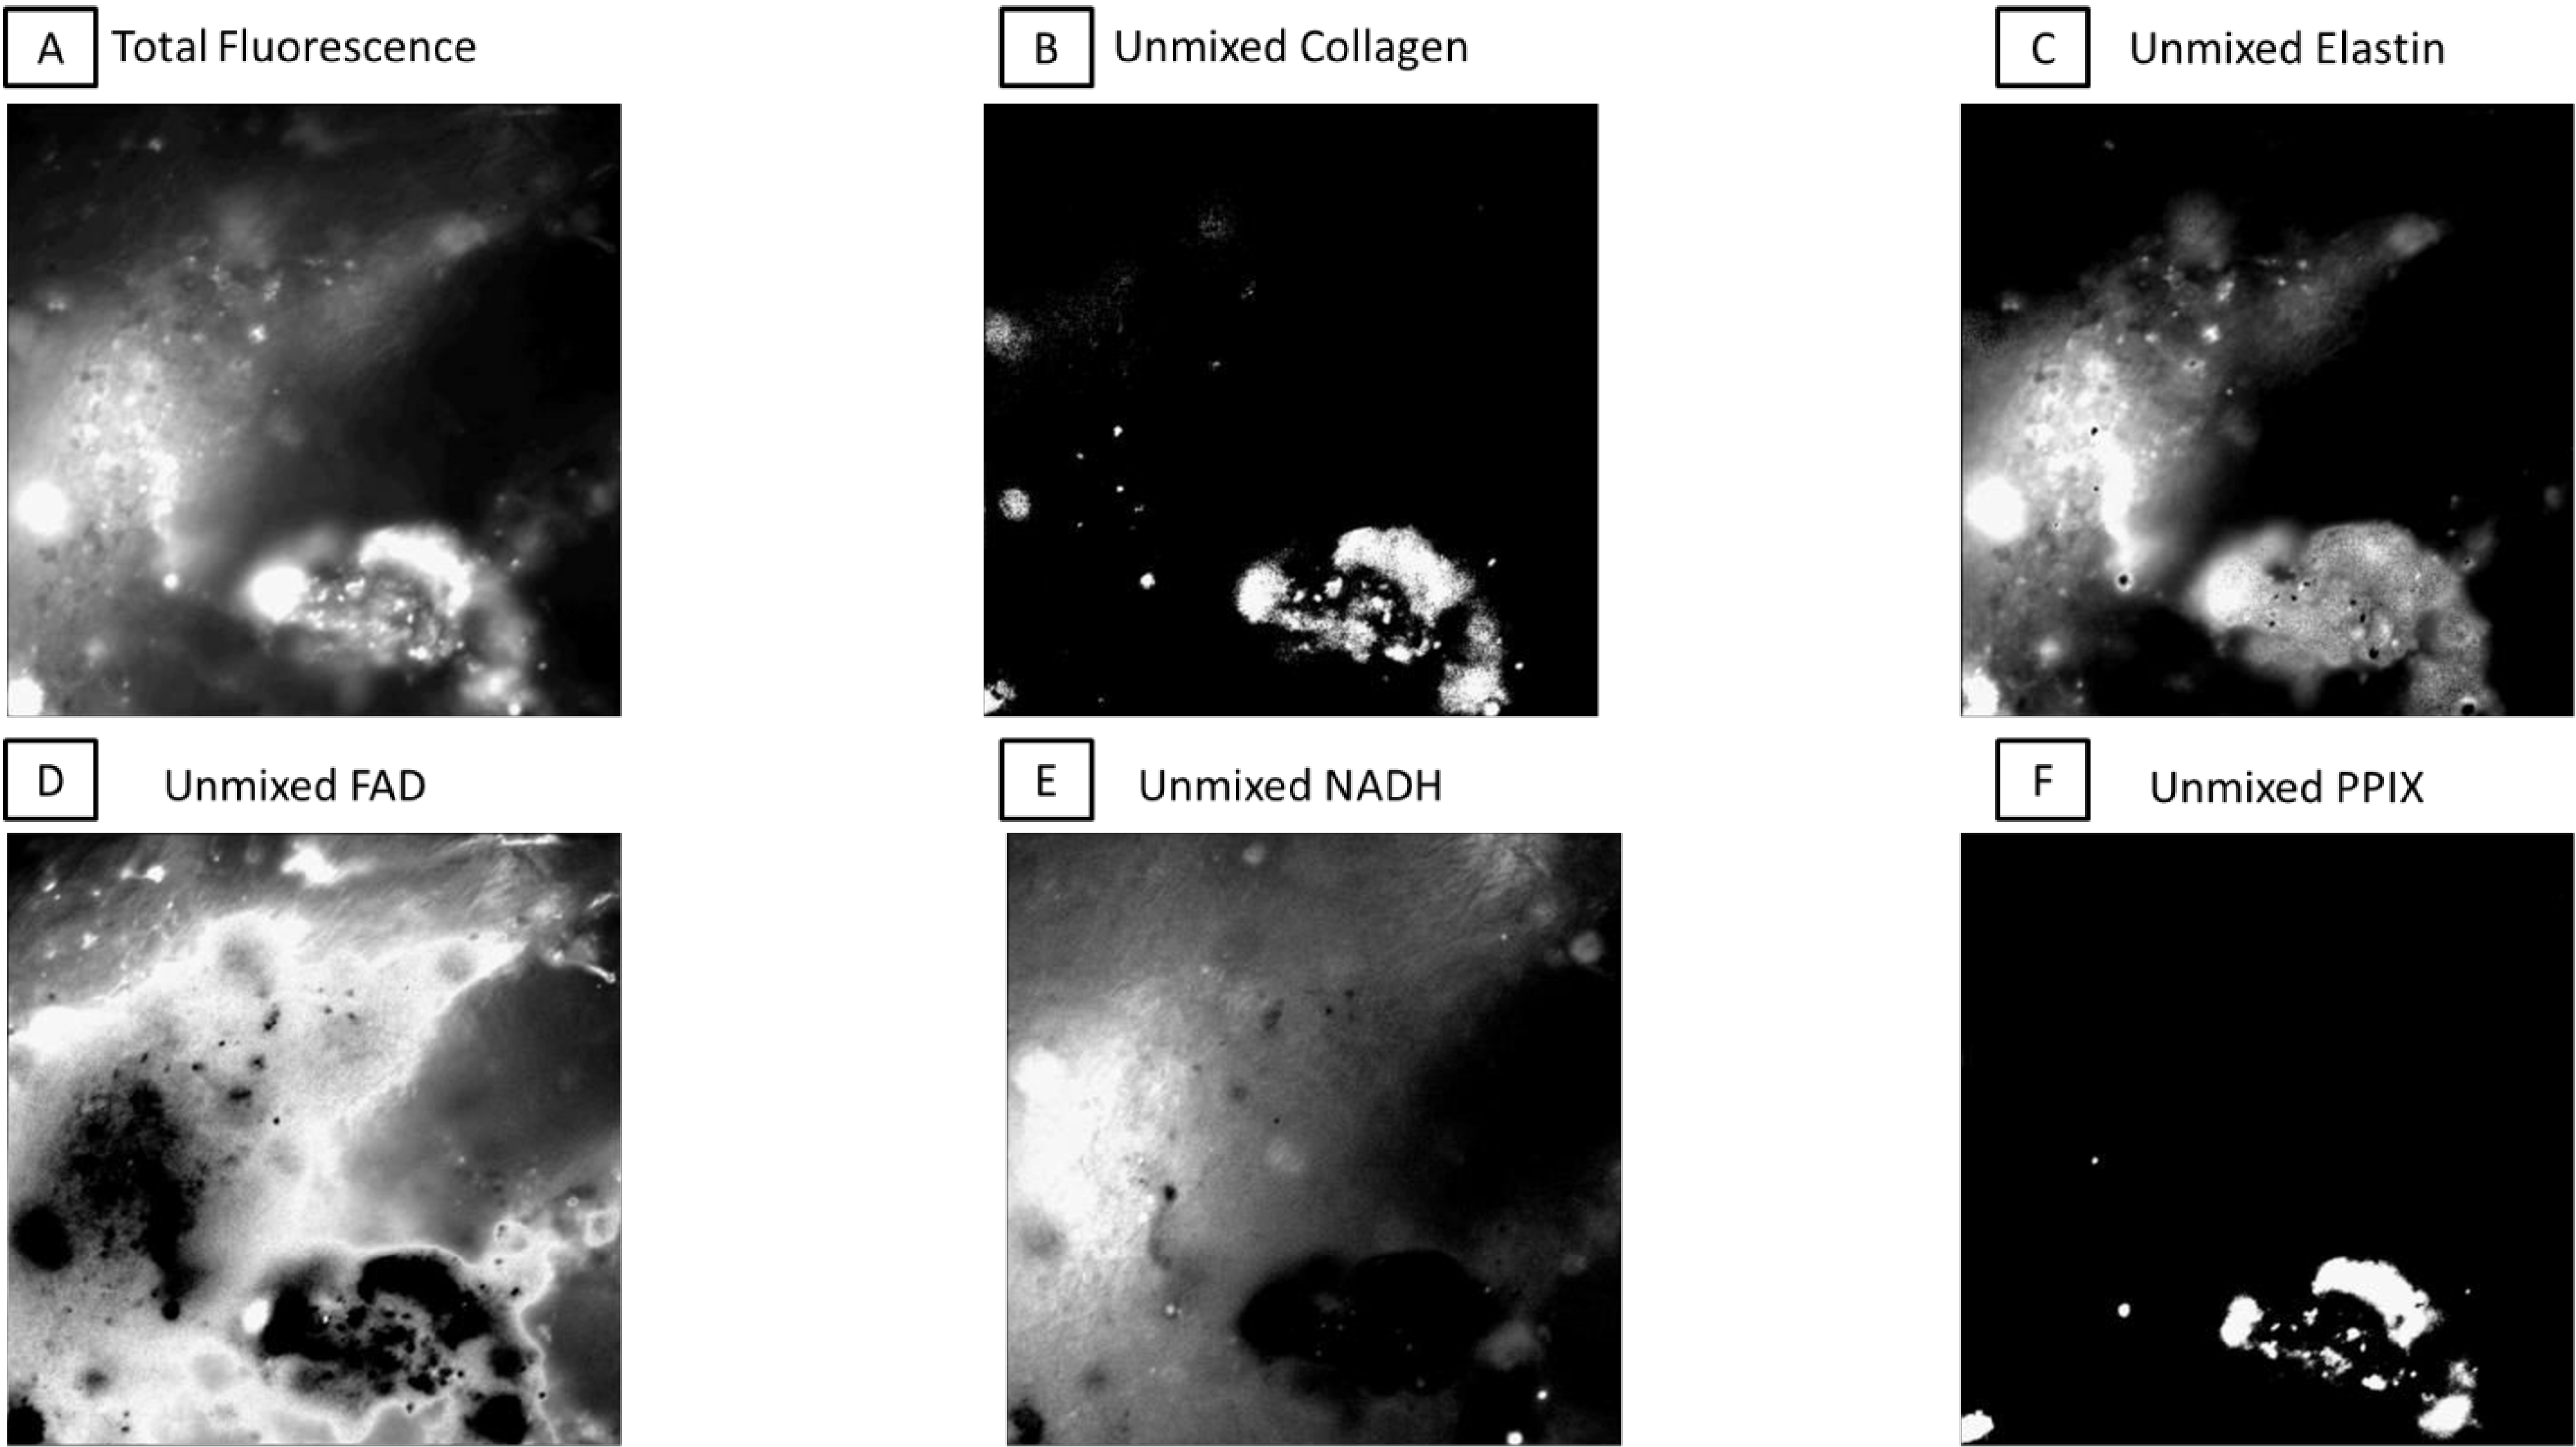
Utilizing excitation-scanning hyperspectral imaging, we have created a scanning method that allows for separation of autofluorescent signals per autofluorescent molecule in the given tissue, based on a library constructed with pure samples of those fluorophores. Furthermore, these scans can be performed in real time with a drastically increased signal-to-noise ratio (10–100 fold). Separation of these signals allows for examination of healthy versus diseased tissues; something especially important in diseases which alter the concentrations of these autofluorescent molecules, such as cancer. An example unmixing result is shown in Figure 1.
Figure 1.

An example FOV broken into respective intensities per pixel for each fluorophore after linear spectral unmixing with the excitation-scanning hyperspectral imaging library. A) The total fluorescence signal created by adding the intensity at each pixel per image in the hyperspectral image cube. B-F) The respective portions of signal per fluorophore. Images have been adjusted to show maximum signal per image, as strict percentages of total would make most images appear empty.
As our excitation range was 360 nm to 550 nm, we have chosen 5 autofluorescent molecules commonly considered to have excitation spectra within this range for consideration in our library: collagen, elastin, FAD, NADH, and PPIX. Using MATLAB code utilizing non-negatively constrained linear regression, we have broken the total fluorescence images into their respective component images, as shown in Figure 1.
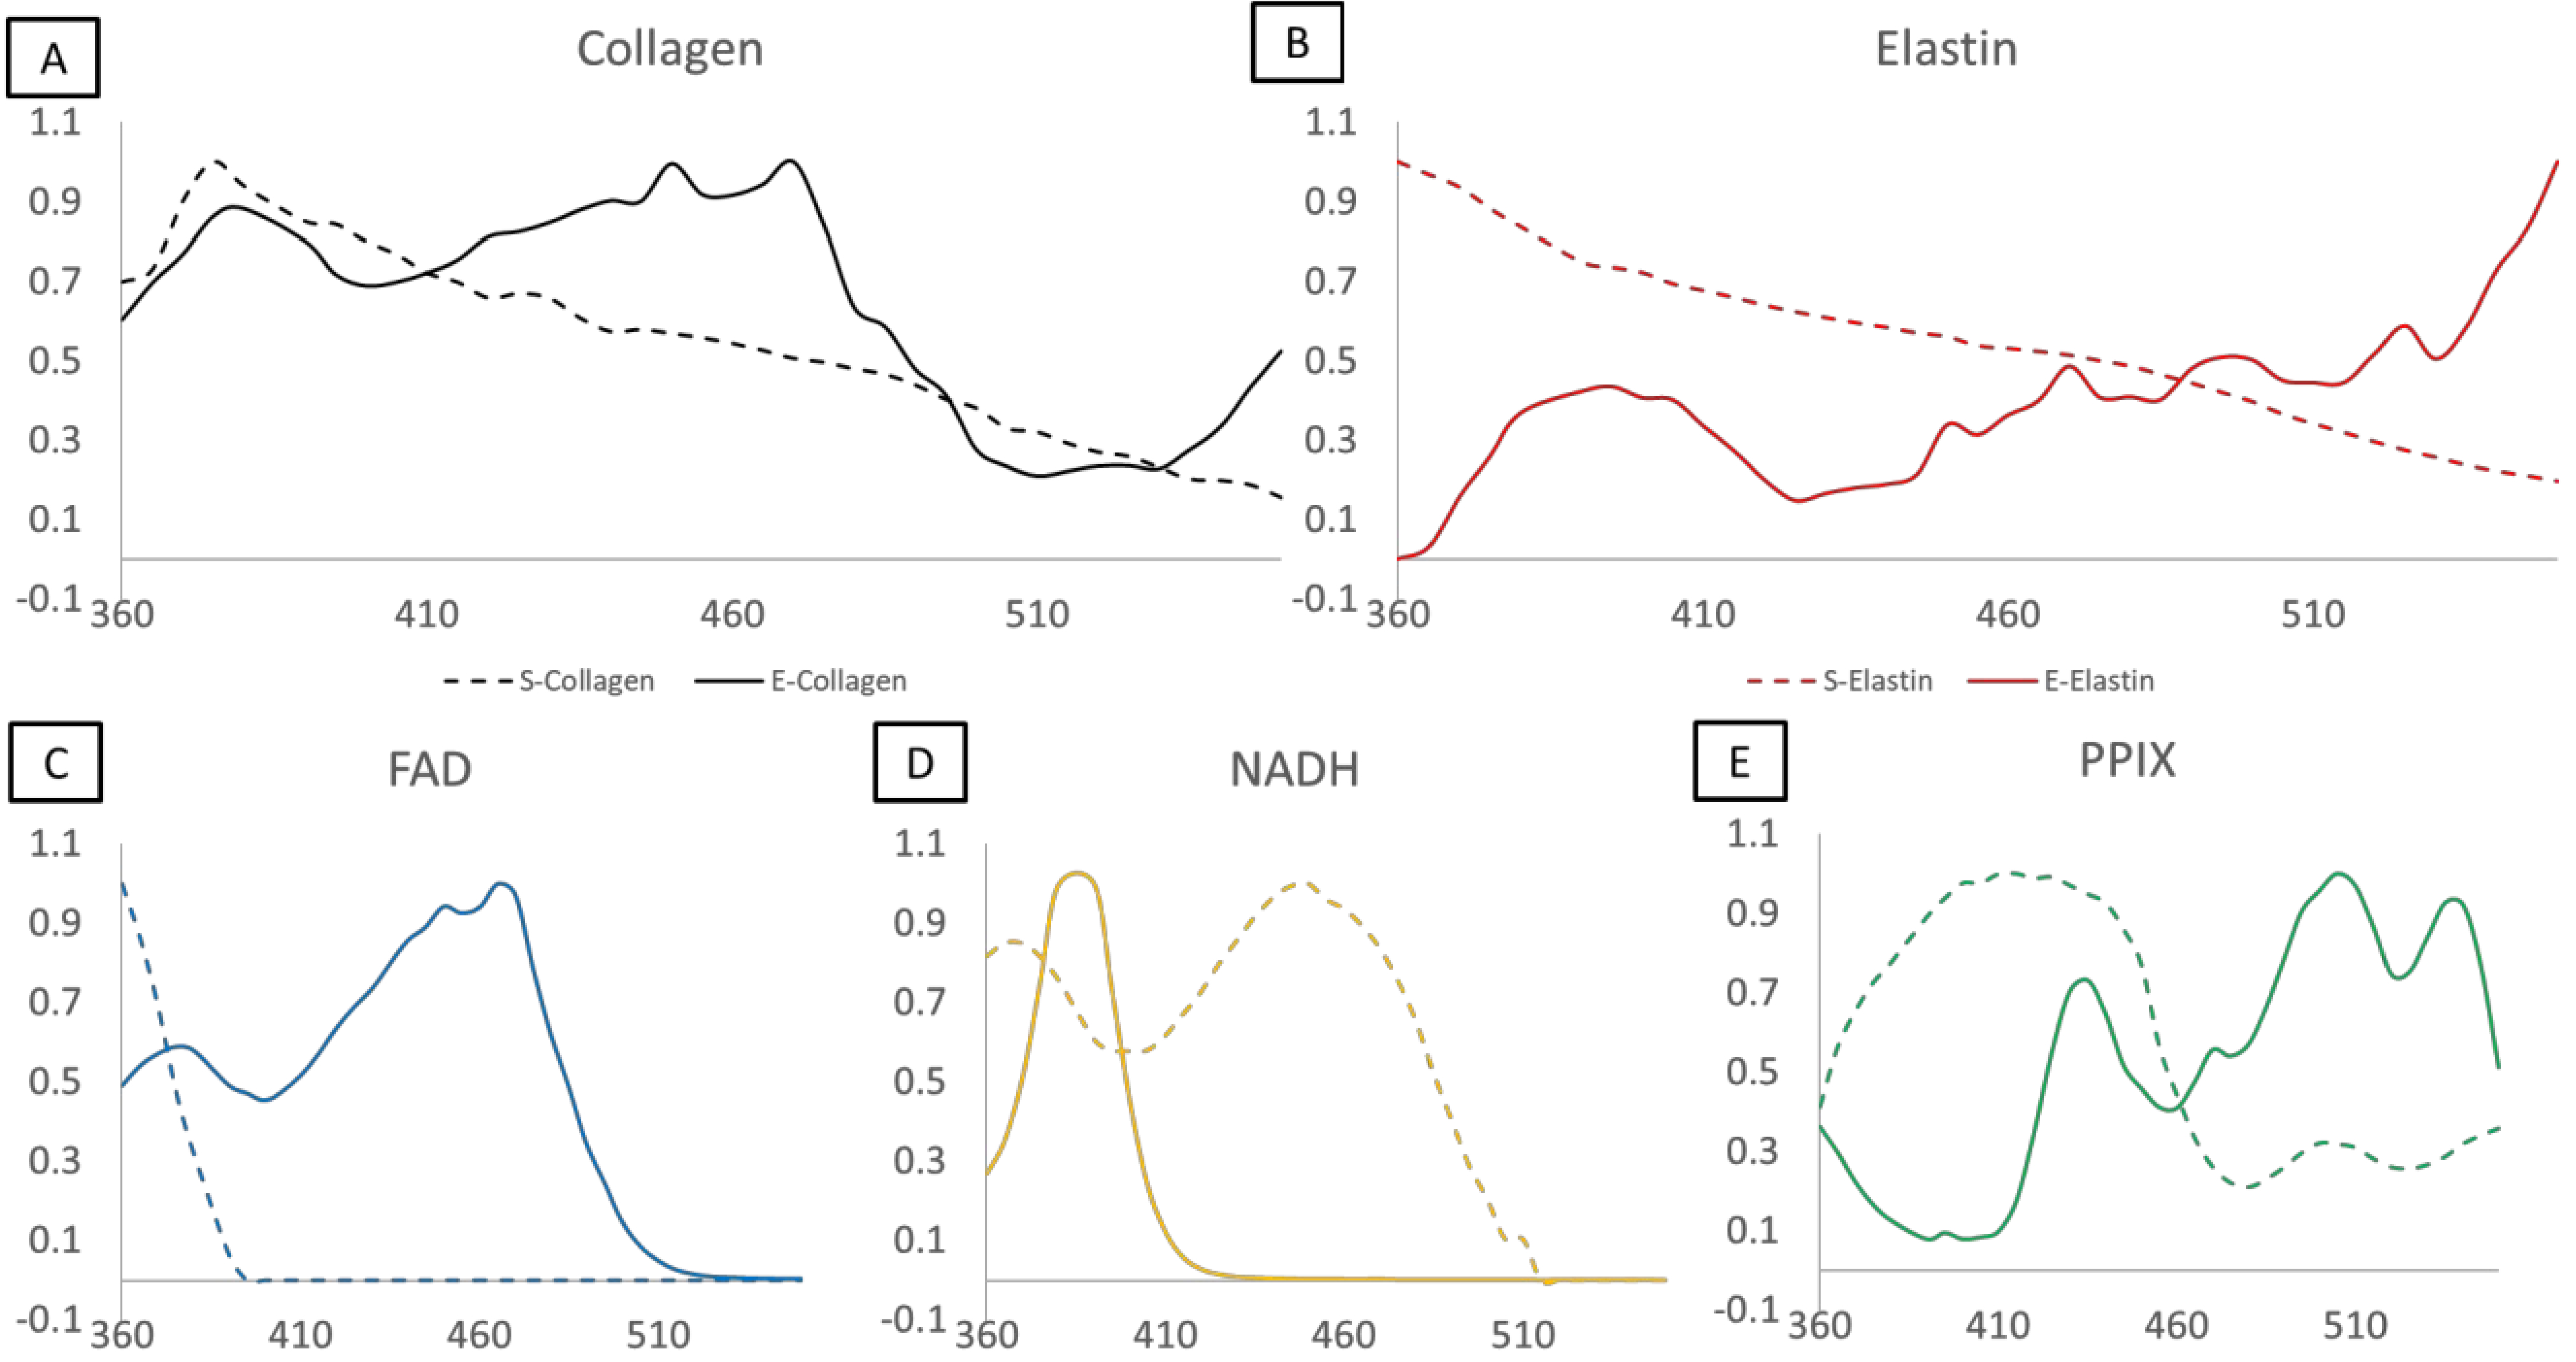
Linear spectral unmixing was performed on all healthy and lesional tissue samples with both the library generated with the excitation-scanning hyperspectral imaging system and the spectrofluorometer. The excitation-scanning hyperspectral imaging library was created by placing one drop of each pure suspension on a 25 mm coverslip, placing the coverslip in an AttoFluor, and imaging with the excitation-scanning hyperspectral imaging system, exactly as the tissues are imaged. A region was selected at the edge of the drop to allow for background subtraction and the resultant measurement is the average of no less than three FOVs per fluorophore over the range of 360 nm to 550 nm. Portions of the same pure samples were placed into a quartz cuvette and used in the spectrofluorometer. Spectrofluorometer scans utilized an excitation-emission matrix. The chosen library encompasses the excitation scan from 300–550 nm with emission data collected at 575 nm. The libraries are shown in Figure 2 as excitation-scanning hyperspectral imaging system (solid) versus excitation-scanning spectrofluorometer (dashed). The measurements of the reference spectra are significantly different based on the method of fluorescence intensity detection; an outcome we did not expect. One potential explanation is that emission detection via spectrofluorometer was limited to a single wavelength while the excitation-scanning hyperspectral imaging system utilized a long-pass emission filter to detect all light emitted beyond 550 nm. Perhaps the inclusion of a wide bandpass for emission detection allowed more detectable signal per excitation wavelength. Intuitively, the library generated from the same system as sample signal detection should allow for a more precise unmixing.
Figure 2.

Spectral libraries as a comparison of measurements taken via the excitation-scanning hyperspectral imaging system (solid lines) and the spectrofluorometer (dashed lines). Spectra have been normalized to the wavelength containing the most intense value. A) Collagen. B) Elastin. C) FAD. D) NADH. E) Protoporphyrin IX (PPIX).
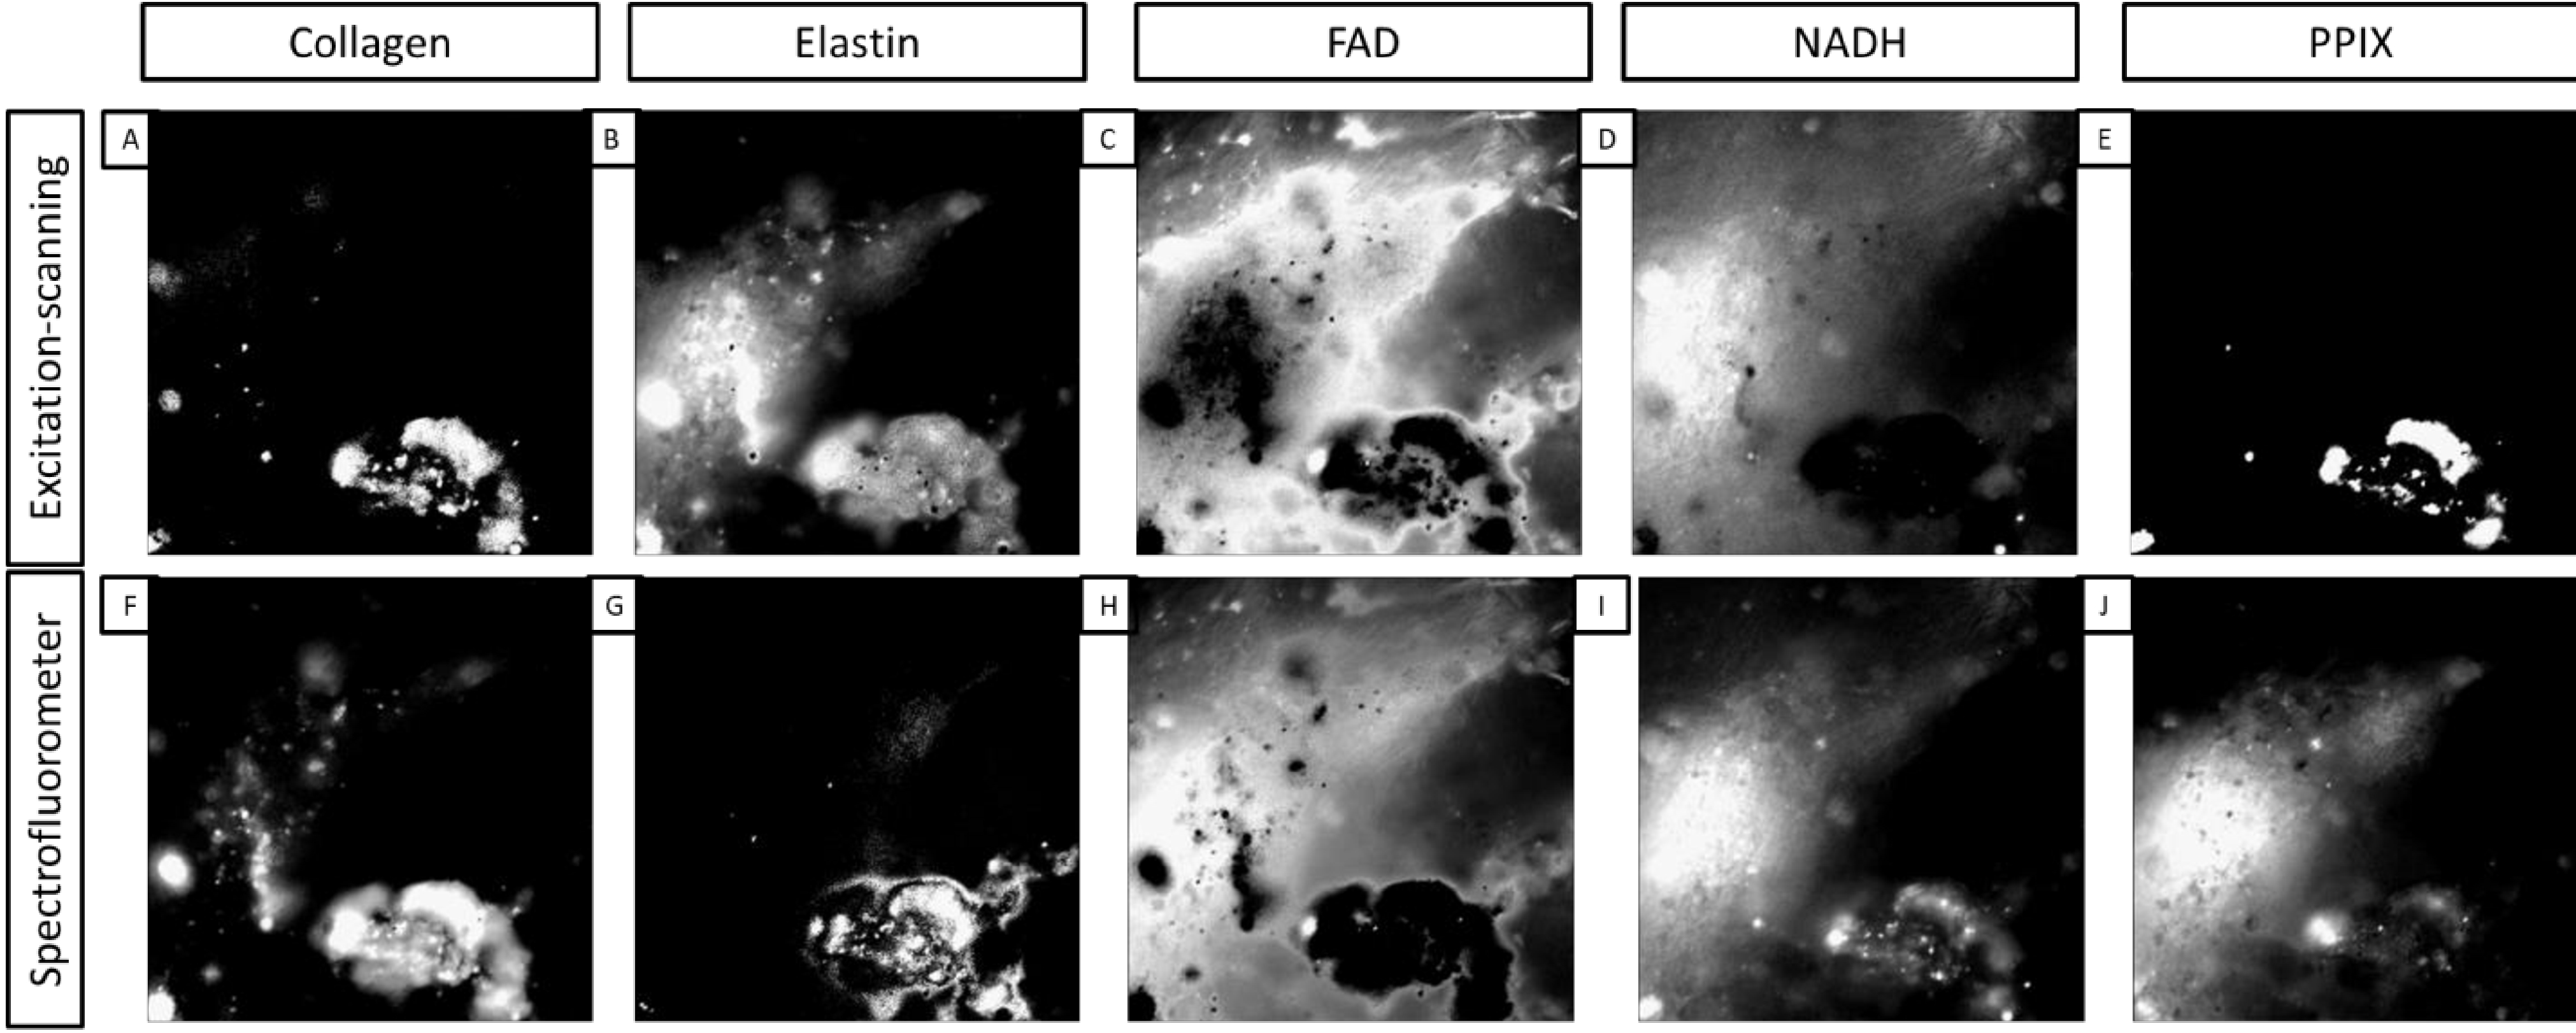
The images created from linear spectral unmixing based on the different libraries vary in a manner consistent with the libraries themselves. The added details of the multiple peaks detected with excitation-scanning hyperspectral imaging add an extra level of specificity to signal unmixing. Therefore, the resultant images appear more closely related to what one might expect to see spatially. The smooth nature of the spectrofluorometer measurements mask specific details of an individual fluorophore’s spectrum, resulting in non-specific unmixing. This point is especially important, as most excitation spectra throughout literature are poorly defined in general, and are often collected using a spectrofluorometer with a single emission wavelength. With this in consideration, future images and data collection will be performed using the excitation-scanning hyperspectral imaging library. An example of unmixing with both libraries is shown in Figure 3.
Figure 3.

A comparison of images created with linear spectral unmixing using both the excitation-scanning hyperspectral imaging library and the spectrofluorometer library. The top row contains images unmixed with the excitation-scanning hyperspectral imaging library directly above counterpart images unmixed with the spectrofluorometer library. A,F) Collagen. B,G) Elastin. C,H) FAD. D,I) NADH. E,J) PPIX.
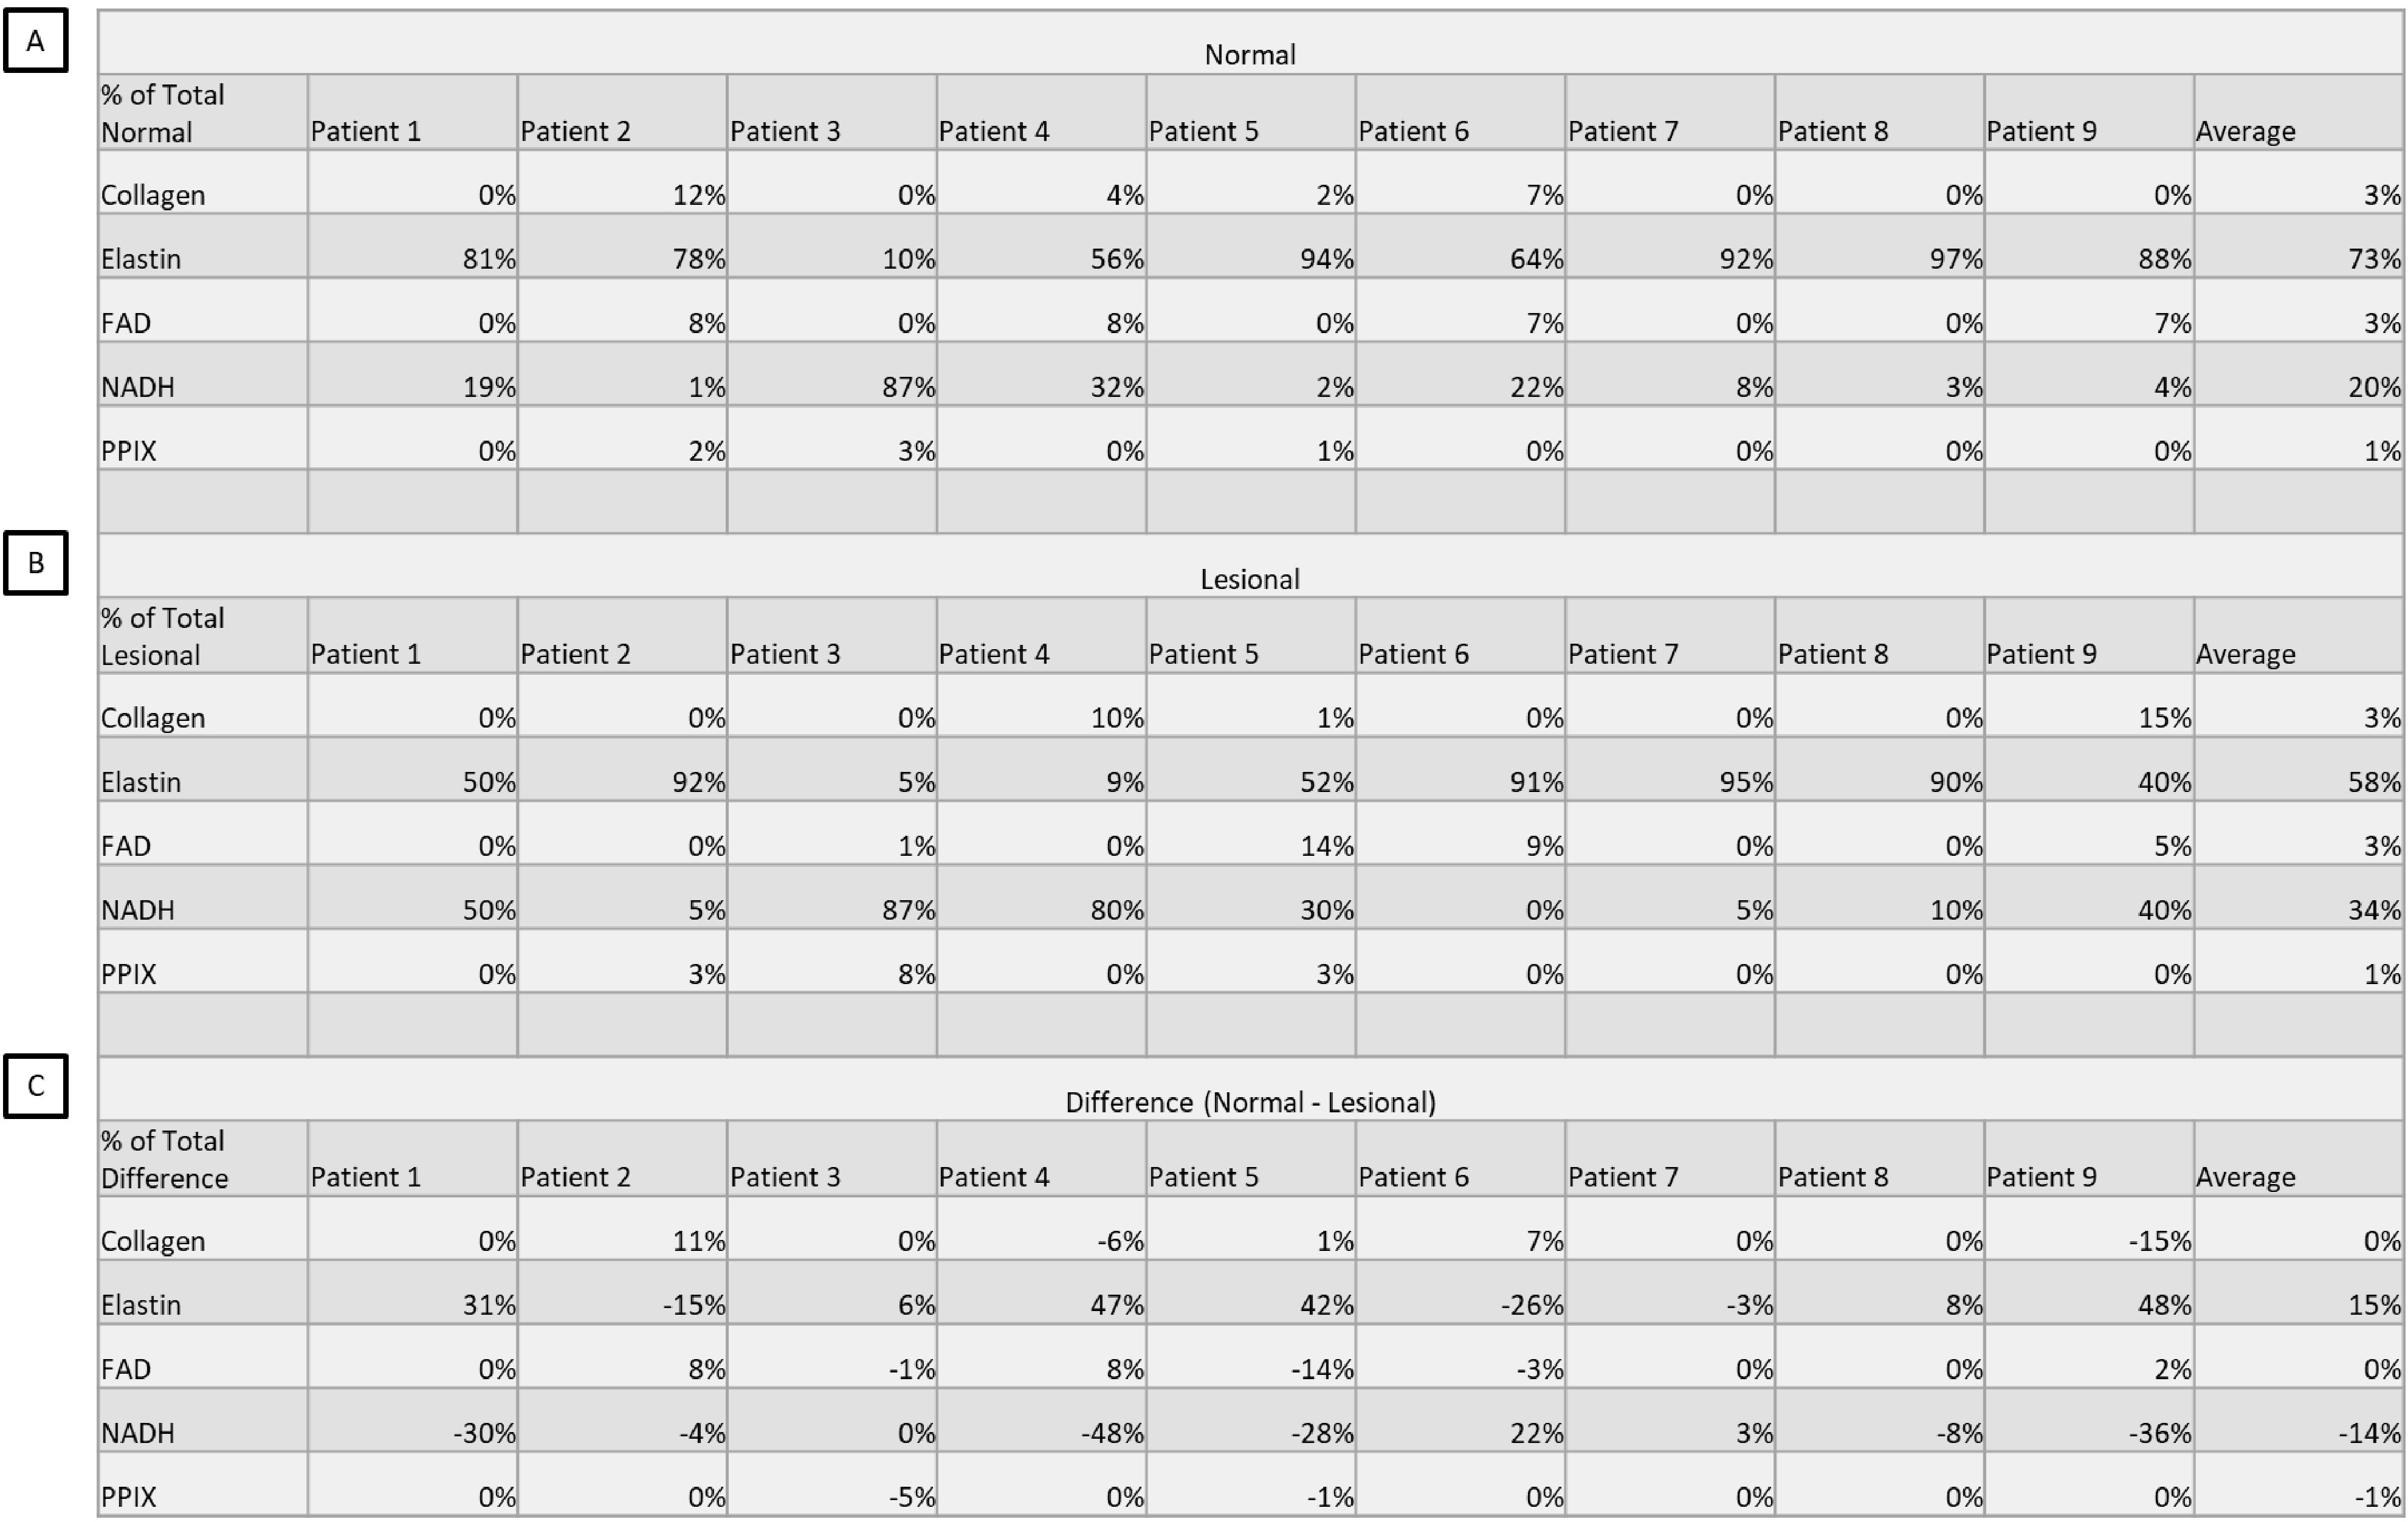
Finally, our investigation sought to determine whether accounting for abundances of fluorophores could determine whether a given colon sample was healthy or lesional. A consistent, predictable spectral shift in overall sample signature or abundance of fluorophores might serve as a marker for specific types of disease. Using ImageJ, each unmixed image was measured for mean, min, and max values. Those values were used to compute both a normalized measurement, similar to normalization of the spectra in the library, and a “% of total fluorescence” measurement. These measurements were averaged per tissue sample and those measurements further averaged to compare healthy tissues with their lesional counterparts. Interestingly, though there was slight deviation from patient to patient, collagen, FAD, and PPIX showed no change in measurement between healthy and lesional samples. However, the fluorescence due to elastin was higher in the non-lesional samples while the fluorescence due to NADH was much higher in the lesional samples. This might indicate an elastin decrease in lesional samples due to ECM remodeling and an increase in NADH due to increased metabolic demand. Shown in Figure 4 is a table of “% of total fluorescence” by fluorophore, patient, and pathological classification.
Figure 4.

A comparison of “% of total fluorescence” measurements taken by fluorophore, patient, and pathological classification. Percentages were generated by mean fluorescence intensity measurement of the unmixed image divided by the sum of the fluorescence intensities per image. These percentages were averaged per patient. A) The “% of total fluorescence” measurements of the non-lesional tissue regions averaged per patient per fluorophore. B) The “% of total fluorescence” measurements of the lesional tissue regions averaged per patient per fluorophore. C) The difference in non-lesional and lesional averages per patient per fluorophore, calculated by subtracting (A)-(B). Percentage values were rounded post calculation from original intensity measurements.
A few important points to note about this study are (1) we are still building a patient database. 9 samples do not represent a significant sample size and the possibility exists that part of our data was collected with “outlier patients.” (2) To maximize the number of samples available for the study, we pooled data from every tumor type. Data taken in this study came from patients with various tumor types in various regions of the colon. The potential exists that the “normal” samples were taken from different regions of the colon (as opposed to, for example, all mucosa) and the tumor samples could be different types of cancer and/or in different stages. (3) We have generated this data using 5 fluorophores and linear spectral unmixing, which assumes the existence of a complete spectral library. That is, some pixels may have been inappropriately labeled as one of the 5 fluorophores when it belongs to a missing 6th fluorophore. We have explored other analysis algorithms, which utilize similarity or spectral distance metrics and do not require a complete library, with varying degrees of success. In general, the most accurate measurement will encompass every possible fluorophore. However, in practice, signal separation necessary for diagnostic efficiency may simply be a subset of those fluorophores. (4) We have only considered a single type of each fluorescent molecule (e.g. Collagen I).
4. CONCLUSIONS AND FUTURE WORK
These data represent the basis for a study of the contribution of individual fluorophores to overall tissue fluorescence in both and healthy and disease states. Though some fluorophores appear to remain unchanged in disease states, there is a shift in each fluorophore from non-lesional to lesional measurements. These shifts could be used in real-time imaging to detect the change from a healthy region of tissue to a lesional one. In the future, we plan to expand our available library of fluorophores to include other molecules reported in literature to be fluorescent, such as collagen III and tryptophan. Additionally, we will purify our own fluorescent molecules to build a library for comparison to commercially available compounds.
5. ACKNOWLEDGEMENTS
We would like to acknowledge the Abraham Mitchell Cancer Research fund as well as National Institutes of Health grants P01HL066299 and NIH UL1 TR001417 and NSF 1725937 for supporting this work. Drs. Leavesley and Rich disclose financial interest in a start-up company formed to commercialize spectral imaging technology, SpectraCyte, LLC.
REFERENCES
- [1].Coons AH, Creech HJ, Jones RN and Berliner E, “The demonstration of pneumococcal antigen in tissues by the use of fluorescent antibody,” J Immunol 45(3), 159–170 (1942). [Google Scholar]
- [2].Prasher DC, Eckenrode VK, Ward WW, Prendergast FG and Cormier MJ, “Primary structure of the Aequorea victoria green-fluorescent protein,” Gene 111(2), 229–233 (1992). [DOI] [PubMed] [Google Scholar]
- [3].Heim R and Tsien RY, “Engineering green fluorescent protein for improved brightness, longer wavelengths and fluorescence resonance energy transfer,” Curr. Biol. 6(2), 178–182 (1996). [DOI] [PubMed] [Google Scholar]
- [4].Chalfie M, Tu Y, Euskirchen G, Ward WW and Prasher DC, “Green fluorescent protein as a marker for gene expression,” Science, 802–805 (1994). [DOI] [PubMed] [Google Scholar]
- [5].Kobayashi H, Ogawa M, Alford R, Choyke PL and Urano Y, “New strategies for fluorescent probe design in medical diagnostic imaging,” Chem. Rev. 110(5), 2620–2640 (2009). [DOI] [PMC free article] [PubMed] [Google Scholar]
- [6].Waters JC, “Accuracy and precision in quantitative fluorescence microscopy” (2009). [DOI] [PMC free article] [PubMed] [Google Scholar]
- [7].Alander JT, Kaartinen I, Laakso A, Pätilä T, Spillmann T, Tuchin VV, Venermo M and Välisuo P, “A review of indocyanine green fluorescent imaging in surgery,” J. Biomed. Imaging 2012, 7 (2012). [DOI] [PMC free article] [PubMed] [Google Scholar]
- [8].Schultz RA, Nielsen T, Zavaleta JR, Ruch R, Wyatt R and Garner HR, “Hyperspectral imaging: a novel approach for microscopic analysis,” Cytometry A 43(4), 239–247 (2001). [DOI] [PubMed] [Google Scholar]
- [9].Goetz AFH, “Three decades of hyperspectral remote sensing of the Earth: A personal view,” Remote Sens. Environ. 113, S5–S16 (2009). [Google Scholar]
- [10].Goetz AF, “Measuring the Earth from Above: 30 Years(and Counting) of Hyperspectral Imaging,” Photonics Spectra 45(6), 42–47 (2011). [Google Scholar]
- [11].Lu R and Chen Y-R, “Hyperspectral imaging for safety inspection of food and agricultural products,” presented at Pathogen Detection and Remediation for Safe Eating, 1999, 121–134, International Society for Optics and Photonics. [Google Scholar]
- [12].Liang H, “Advances in multispectral and hyperspectral imaging for archaeology and art conservation,” Appl. Phys. A 106(2), 309–323 (2012). [Google Scholar]
- [13].Hege EK, O’Connell D, Johnson W, Basty S and Dereniak EL, “Hyperspectral imaging for astronomy and space surviellance,” presented at Imaging Spectrometry IX, 2004, 380–392, International Society for Optics and Photonics. [Google Scholar]
- [14].Vo-Dinh T, “A hyperspectral imaging system for in vivo optical diagnostics,” IEEE Eng. Med. Biol. Mag. 23(5), 40–49 (2004). [DOI] [PubMed] [Google Scholar]
- [15].Edelman G, van Leeuwen TG and Aalders MC, “Hyperspectral imaging for the age estimation of blood stains at the crime scene,” Forensic Sci. Int. 223(1), 72–77 (2012). [DOI] [PubMed] [Google Scholar]
- [16].Swayze GA, Smith KS, Clark RN, Sutley SJ, Pearson RM, Vance JS, Hageman PL, Briggs PH, Meier AL and Singleton MJ, “Using imaging spectroscopy to map acidic mine waste,” Environ. Sci. Technol. 34(1), 47–54 (2000). [Google Scholar]
- [17].Khoobehi B, Beach JM and Kawano H, “Hyperspectral imaging for measurement of oxygen saturation in the optic nerve head,” Invest. Ophthalmol. Vis. Sci. 45(5), 1464–1472 (2004). [DOI] [PubMed] [Google Scholar]
- [18].Gowen A, O’Donnell Cp., Cullen P, Downey G and Frias J, “Hyperspectral imaging–an emerging process analytical tool for food quality and safety control,” Trends Food Sci. Technol. 18(12), 590–598 (2007). [Google Scholar]
- [19].Edelman G, Gaston E, Van Leeuwen T, Cullen P and Aalders M, “Hyperspectral imaging for non-contact analysis of forensic traces,” Forensic Sci. Int. 223(1), 28–39 (2012). [DOI] [PubMed] [Google Scholar]
- [20].Yuen PW and Richardson M, “An introduction to hyperspectral imaging and its application for security, surveillance and target acquisition,” Imaging Sci. J. 58(5), 241–253 (2010). [Google Scholar]
- [21].Leavesley S, Jiang Y, Patsekin V, Rajwa B and Robinson JP, “An excitation wavelength–scanning spectral imaging system for preclinical imaging,” Rev. Sci. Instrum. 79(2), 023707 (2008). [DOI] [PubMed] [Google Scholar]
- [22].Favreau P, Hernandez C, Lindsey AS, Alvarez DF, Rich T, Prabhat P and Leavesley SJ, “Thin-film tunable filters for hyperspectral fluorescence microscopy,” J. Biomed. Opt. 19(1), 011017–011017 (2014). [DOI] [PMC free article] [PubMed] [Google Scholar]
- [23].Favreau PF, Hernandez C, Heaster T, Alvarez DF, Rich TC, Prabhat P and Leavesley SJ, “Excitation-scanning hyperspectral imaging microscope,” J. Biomed. Opt. 19(4), 046010–046010 (2014). [DOI] [PMC free article] [PubMed] [Google Scholar]
- [24].Alfano R, Pradhan A, Tang G and Wahl S, “Optical spectroscopic diagnosis of cancer and normal breast tissues,” JOSA B 6(5), 1015–1023 (1989). [Google Scholar]
- [25].Tuchin VV, Utz SR and Yaroslavsky IV, “Tissue optics, light distribution, and spectroscopy,” Opt. Eng. 33(10), 3178–3189 (1994). [Google Scholar]
- [26].Wagnieres GA, Star WM and Wilson BC, “In vivo fluorescence spectroscopy and imaging for oncological applications,” Photochem. Photobiol. 68(5), 603–632 (1998). [PubMed] [Google Scholar]
- [27].Richards-Kortum R and Sevick-Muraca E, “Quantitative optical spectroscopy for tissue diagnosis,” Annu. Rev. Phys. Chem. 47(1), 555–606 (1996). [DOI] [PubMed] [Google Scholar]
- [28].Leavesley SJ, Annamdevula N, Boni J, Stocker S, Grant K, Troyanovsky B, Rich TC and Alvarez DF, “Hyperspectral imaging microscopy for identification and quantitative analysis of fluorescently-labeled cells in highly autofluorescent tissue,” J. Biophotonics 5(1), 67–84 (2012). [DOI] [PMC free article] [PubMed] [Google Scholar]
- [29].Annamdevula N, Sweat B, Favreau P, Lindsey A, Alvarez D, Rich T and Leavesley S, “An Approach for Characterizing and Comparing Hyperspectral Microscopy Systems,” Sensors 13(7), 9267–9293 (2013). [DOI] [PMC free article] [PubMed] [Google Scholar]
- [30].Lu G and Fei B, “Medical hyperspectral imaging: a review,” J. Biomed. Opt. 19(1), 010901–010901 (2014). [DOI] [PMC free article] [PubMed] [Google Scholar]


