

Abstract
Hyperspectral imaging technologies have shown great promise for biomedical applications. These techniques have been especially useful for detection of molecular events and characterization of cell, tissue, and biomaterial composition. Unfortunately, hyperspectral imaging technologies have been slow to translate to clinical devices – likely due to increased cost and complexity of the technology as well as long acquisition times often required to sample a spectral image. We have demonstrated that hyperspectral imaging approaches which scan the fluorescence excitation spectrum can provide increased signal strength and faster imaging, compared to traditional emission-scanning approaches. We have also demonstrated that excitation-scanning approaches may be able to detect spectral differences between colonic adenomas and adenocarcinomas and normal mucosa in flash-frozen tissues. Here, we report feasibility results from using excitation-scanning hyperspectral imaging to screen pairs of fresh tumoral and nontumoral colorectal tissues. Tissues were imaged using a novel hyperspectral imaging fluorescence excitation scanning microscope, sampling a wavelength range of 360–550 nm, at 5 nm increments. Image data were corrected to achieve a NIST-traceable flat spectral response. Image data were then analyzed using a range of supervised and unsupervised classification approaches within ENVI software (Harris Geospatial Solutions). Supervised classification resulted in >99% accuracy for single-patient image data, but only 64% accuracy for multi-patient classification (n=9 to date), with the drop in accuracy due to increased false-positive detection rates. Hence, initial data indicate that this approach may be a viable detection approach, but that larger patient sample sizes need to be evaluated and the effects of inter-patient variability studied.
Keywords: Spectral, Spectroscopy, Signature, Fingerprint, Optical, Biopsy, Classification, EEM
1. INTRODUCTION
Spectral imaging technologies were developed in the mid-twentieth century for satellite imagery and remote sensing applications1,2. These technologies were quickly expanded to the scale of acquiring hundreds of spectral data bands per image. Within the past two decades, spectral imaging technologies have been adapted to a range of biomedical imaging applications3–6, and commercial systems for spectral imaging microscopy are currently available from a range of vendors. Spectral biomedical imaging has shown utility for a great range of assays, including cell identification7, protein quantification8–10, tissue screening11–13, in vivo animal imaging14,15, and others, using either endogenous or exogenous labels. However, spectral imaging approaches have been slow to translate to clinical devices, likely due to the increased cost, instrument complexity, image acquisition times, and complexity of interpreting the multidimensional data. Despite these obstacles, tissue spectroscopy and spectral imaging contain great promise for developing next generation clinical screening devices16–19.
Here, we report initial results in using a new hyperspectral imaging approach that scans the fluorescence excitation spectrum for screening of colorectal tissues. While the study size is small (n=9 patients), preliminary results indicate that fluorescence excitation data may be a feasible means to discriminate tumoral and nontumoral colorectal tissue specimens. We quantitatively evaluated the ability to classify pixels from spectral images of tumoral and nontumoral specimens using a range of supervised classification algorithms, and here we report the results of applying a maximum likelihood classifier algorithm to discriminate spectral signatures. These initial results demonstrate that hyperspectral imaging technologies continue to hold great potential for tissue diagnosis and that further work must be done to translate these technologies to clinical imaging devices that are both accurate and intuitive.
2. METHODS
2.1. Sample procurement and preparation
Pairs of resected tumoral and nontumoral colorectal tissues were obtained through the University of South Alabama Departments of Surgery and Pathology, as described previously20,21 but using a modified protocol where fresh (non-frozen) specimens were obtained. All specimens were obtained as residual (left over) tissues from routine standard of care surgical bowel resections and in accordance with procedures approved by the University of South Alabama Office of Research Compliance and Assurance. After resection by the Department of Surgery, tissues were separated into tumoral and nontumoral specimens by the Department of Pathology. Histology was confirmed through cryoslice, hematoxylin and eosin (H&E) stain, and microscopic examination. The remaining unfixed and unfrozen portion of tissue specimens were transported on ice for imaging.
2.2. Hyperspectral image acquisition
Fresh tissue specimens were placed on 25 mm round glass coverslip, mounted in Attofluor cell chamber (ThermoFisher Scientific), and hydrated with cold phosphate buffered saline (PBS). When appropriate, specimens were subdivided to a size that facilitated mounting and microscopic investigation. Specimens were imaged using a custom hyperspectral imaging fluorescence excitation-scanning (HIFEX) microscope system, described in part elsewhere22–24. In brief, the system consisted of a 300W Xe arc lamp (Titan 300, Sunoptic Technologies), a thin-film tunable filter array (VersaChrome filters, Semrock, IDEX Health & Science, LLC), an automated inverted fluorescence microscope platform (TE2000-U, Nikon Instruments), custom long-pass dichroic filters (Semrock), and an electron-multiplied charge-coupled device camera (Rolera EM-C2, QImaging). Fluorescence hyperspectral image data were acquired using an excitation wavelength range of 360–550 nm, in 5 nm increments. For each specimen, a region with no tissue was also imaged to measure any non-specific background (mixture of stray light, cross-talk, autofluorescent molecules in buffer, etc.).
2.3. Analysis approach
Spectral image datasets were corrected to a flat, NIST-traceable spectral response using previously described calibration procedures7,25. In brief, the spectral response of the system was measured using a fiber-coupled high-sensitivity spectrometer (QE65000, Ocean Optics, Inc.), equipped with an integrating sphere (FOIS-1, Ocean Optics, Inc.) and calibrated to a NIST-traceable illumination source (LS-1-CAL-INT, Ocean Optics, Inc.). A wavelength-dependent intensity correction coefficient was calculated and a custom MATLAB script was used to correct the intensity of all acquired spectral images to NIST-traceable response using the correction coefficient. As part of this process, non-specific background was measured from background regions and subtracted from all sample fields of view for each specimen. Images were then converted to band-sequential (BSQ) file format using a custom MATLAB script for future analysis. Collections of spectral image data from all fields of view from a single specimen and fields of view from multiple specimens were also tiled using a custom MATLAB script.
Corrected spectral image datasets were analyzed using ENVI software (Harris Geospatial Solutions). When appropriate, regions of interest were selected and average spectra from each region were extracted. Supervised classification was performed using a range of classifiers available in ENVI, including maximum likelihood, neural network, Mahalanobis distance, and others. Classifier performance was evaluated using a range of statistical metrics, including sensitivity, specificity, accuracy, and confusion matrix.
3. RESULTS AND DISCUSSION
Hyperspectral imaging approaches may hold great promise for quantitative analysis of cells and tissues, and especially for diagnosis of a range of pathologies, including cancer. Here, we evaluated the preliminary ability of a new form of hyperspectral imaging, HIFEX, for detecting spectral differences between tumoral and nontumoral resected fresh colorectal tissue specimens. In general, hyperspectral images of tumoral and nontumoral specimens displayed marked spectral variations (Figure 1). However, spectral variations were also observed between regions within a single specimen, although visually of less magnitude than the variations between tumoral and nontumoral specimens. Hence, to quantitatively evaluate the ability to distinguish tumoral from nontumoral specimens, a range of supervised classification approaches was evaluated.
Figure 1:
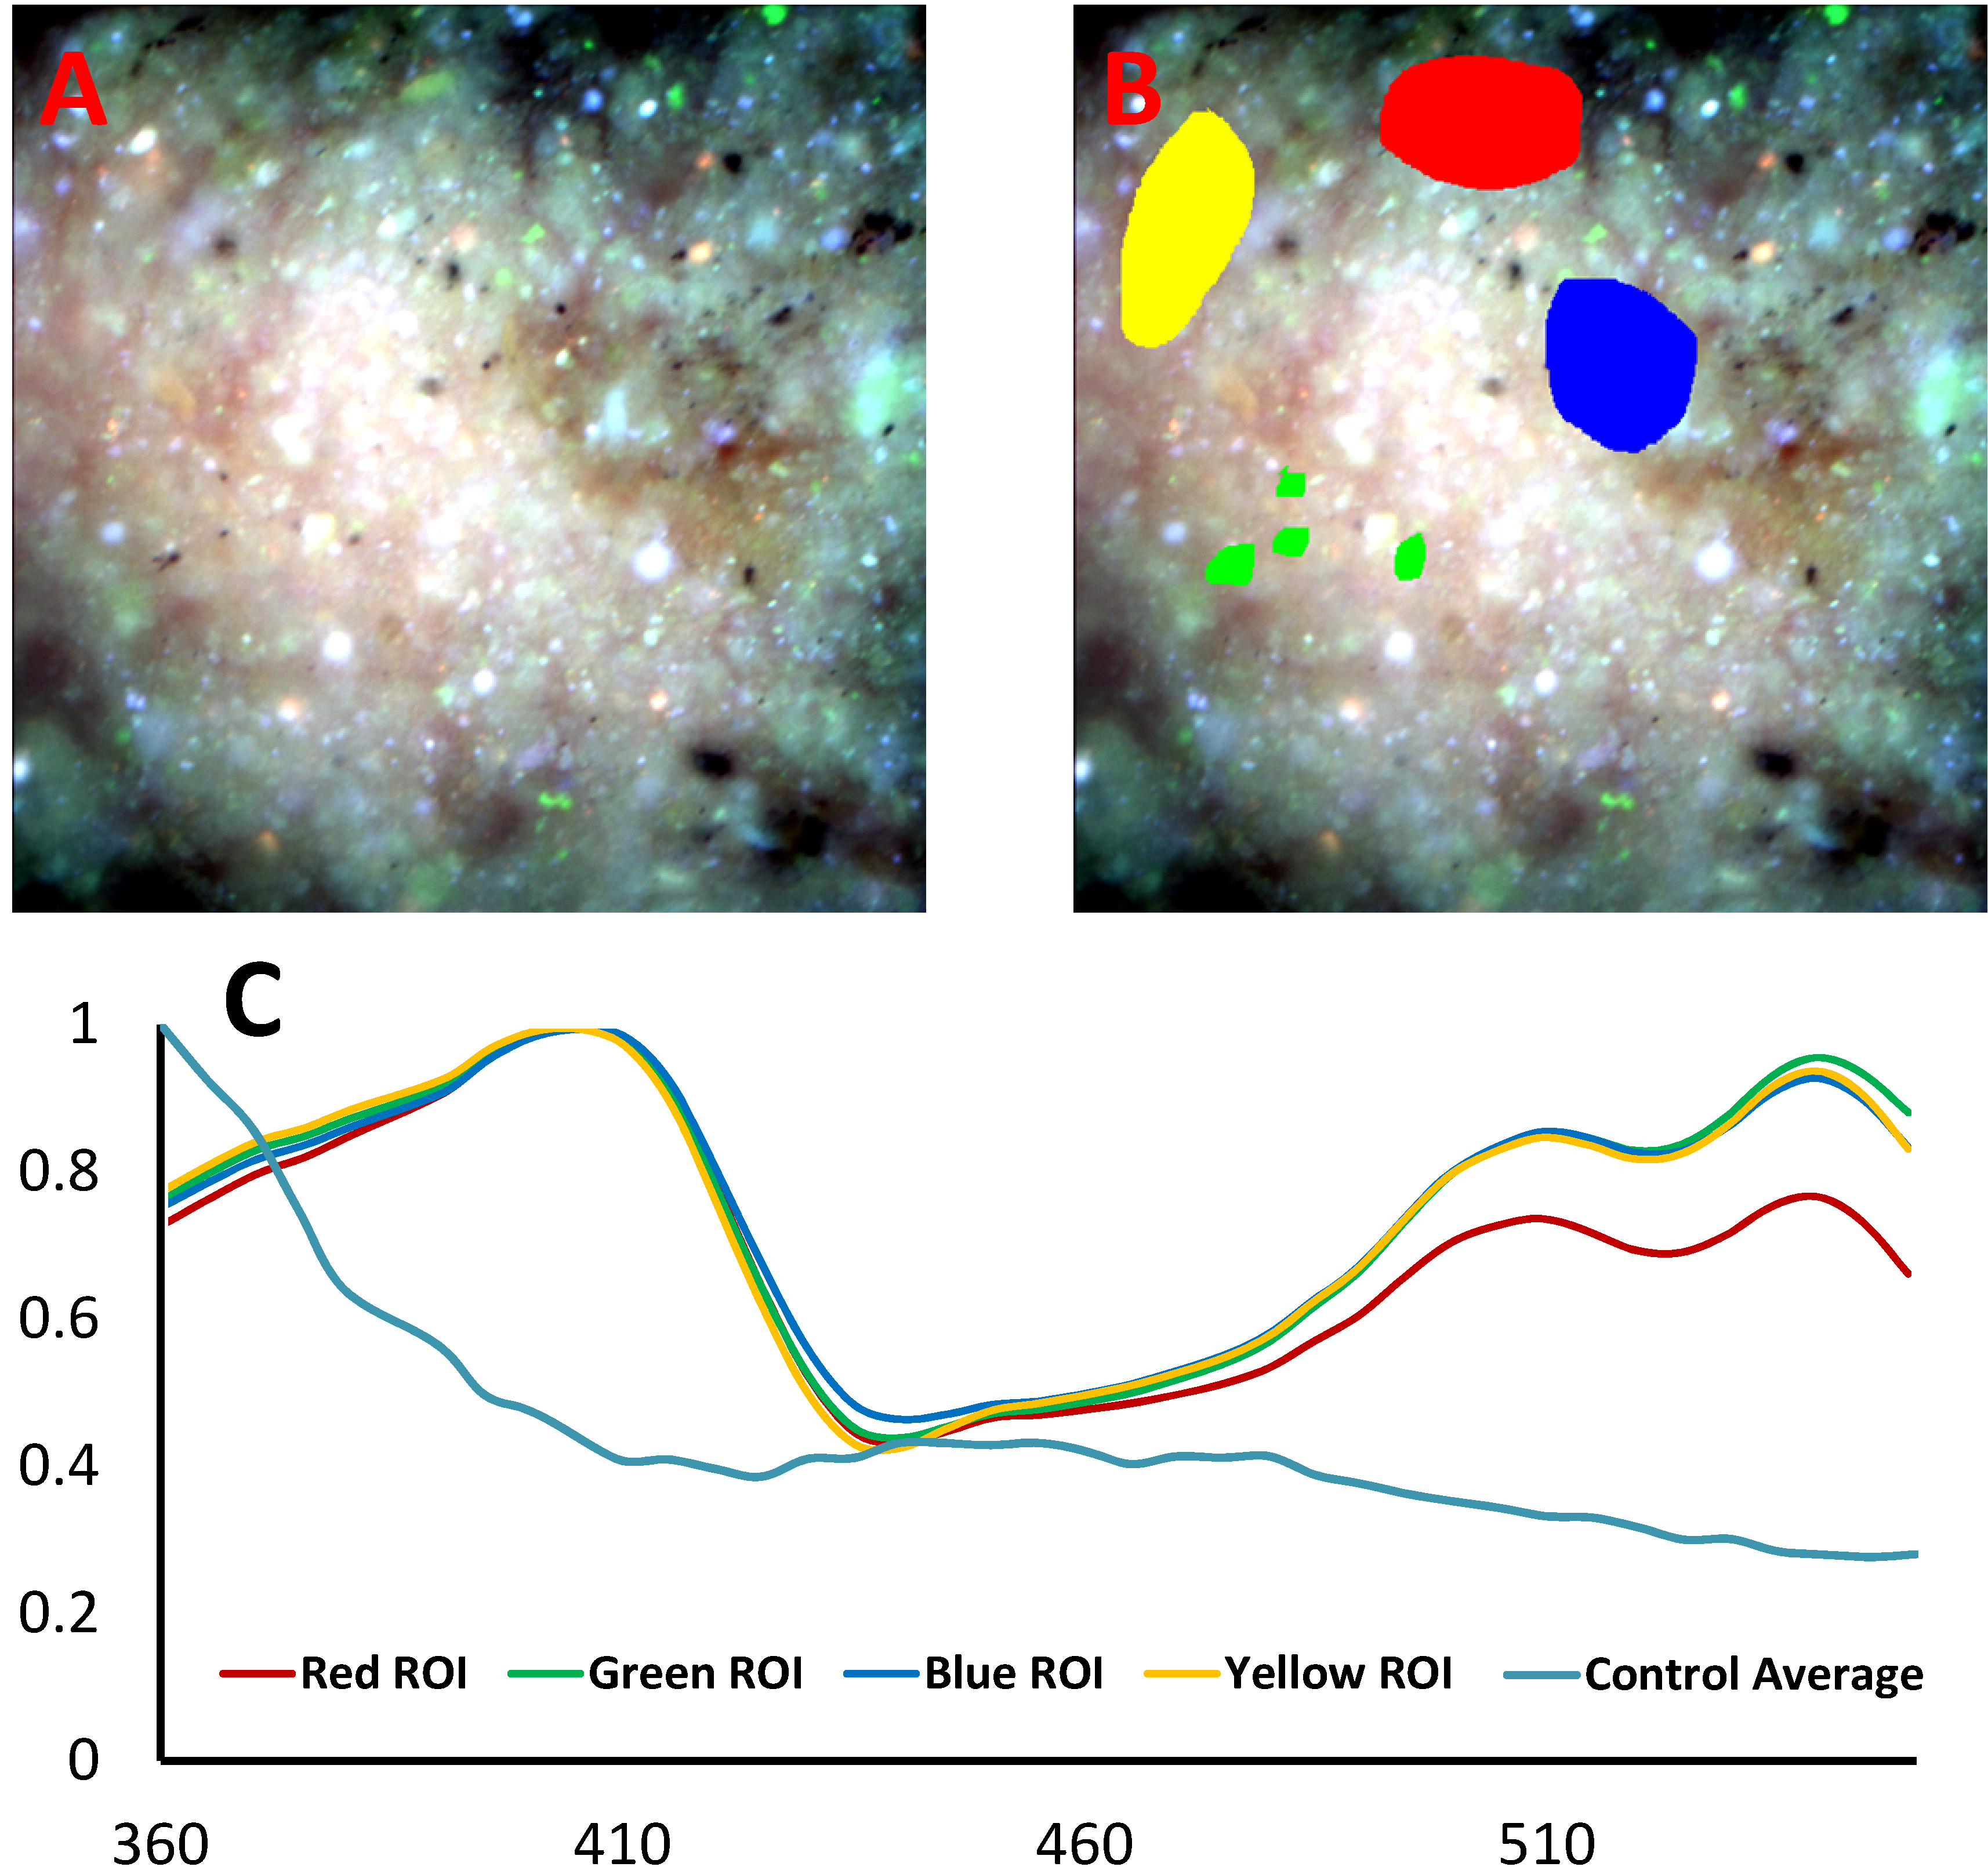
Example spectral image of a tumoral specimen (A) with regions of interest selected (B) to extract representative spectra (C). The average spectrum extracted from the nontumoral (control) specimen is also shown in blue.
To implement supervised classification in the ENVI software environment, spectral image data was first stitched to produce a single image containing all fields of view from each patient, including fields of view from both tumoral and nontumoral specimens (Figure 2). In addition, stitched images were also produced that contained tumoral and nontumoral fields of view from multiple patients, to investigate the effects of patient-to-patient variation on classification performance (Figure 3). Training regions corresponding to a subset of pixels were then defined within a subset of fields from tumoral and nontumoral specimens. Truth regions were also defined to indicate which regions were tumoral and which were nontumoral.
Figure 2:
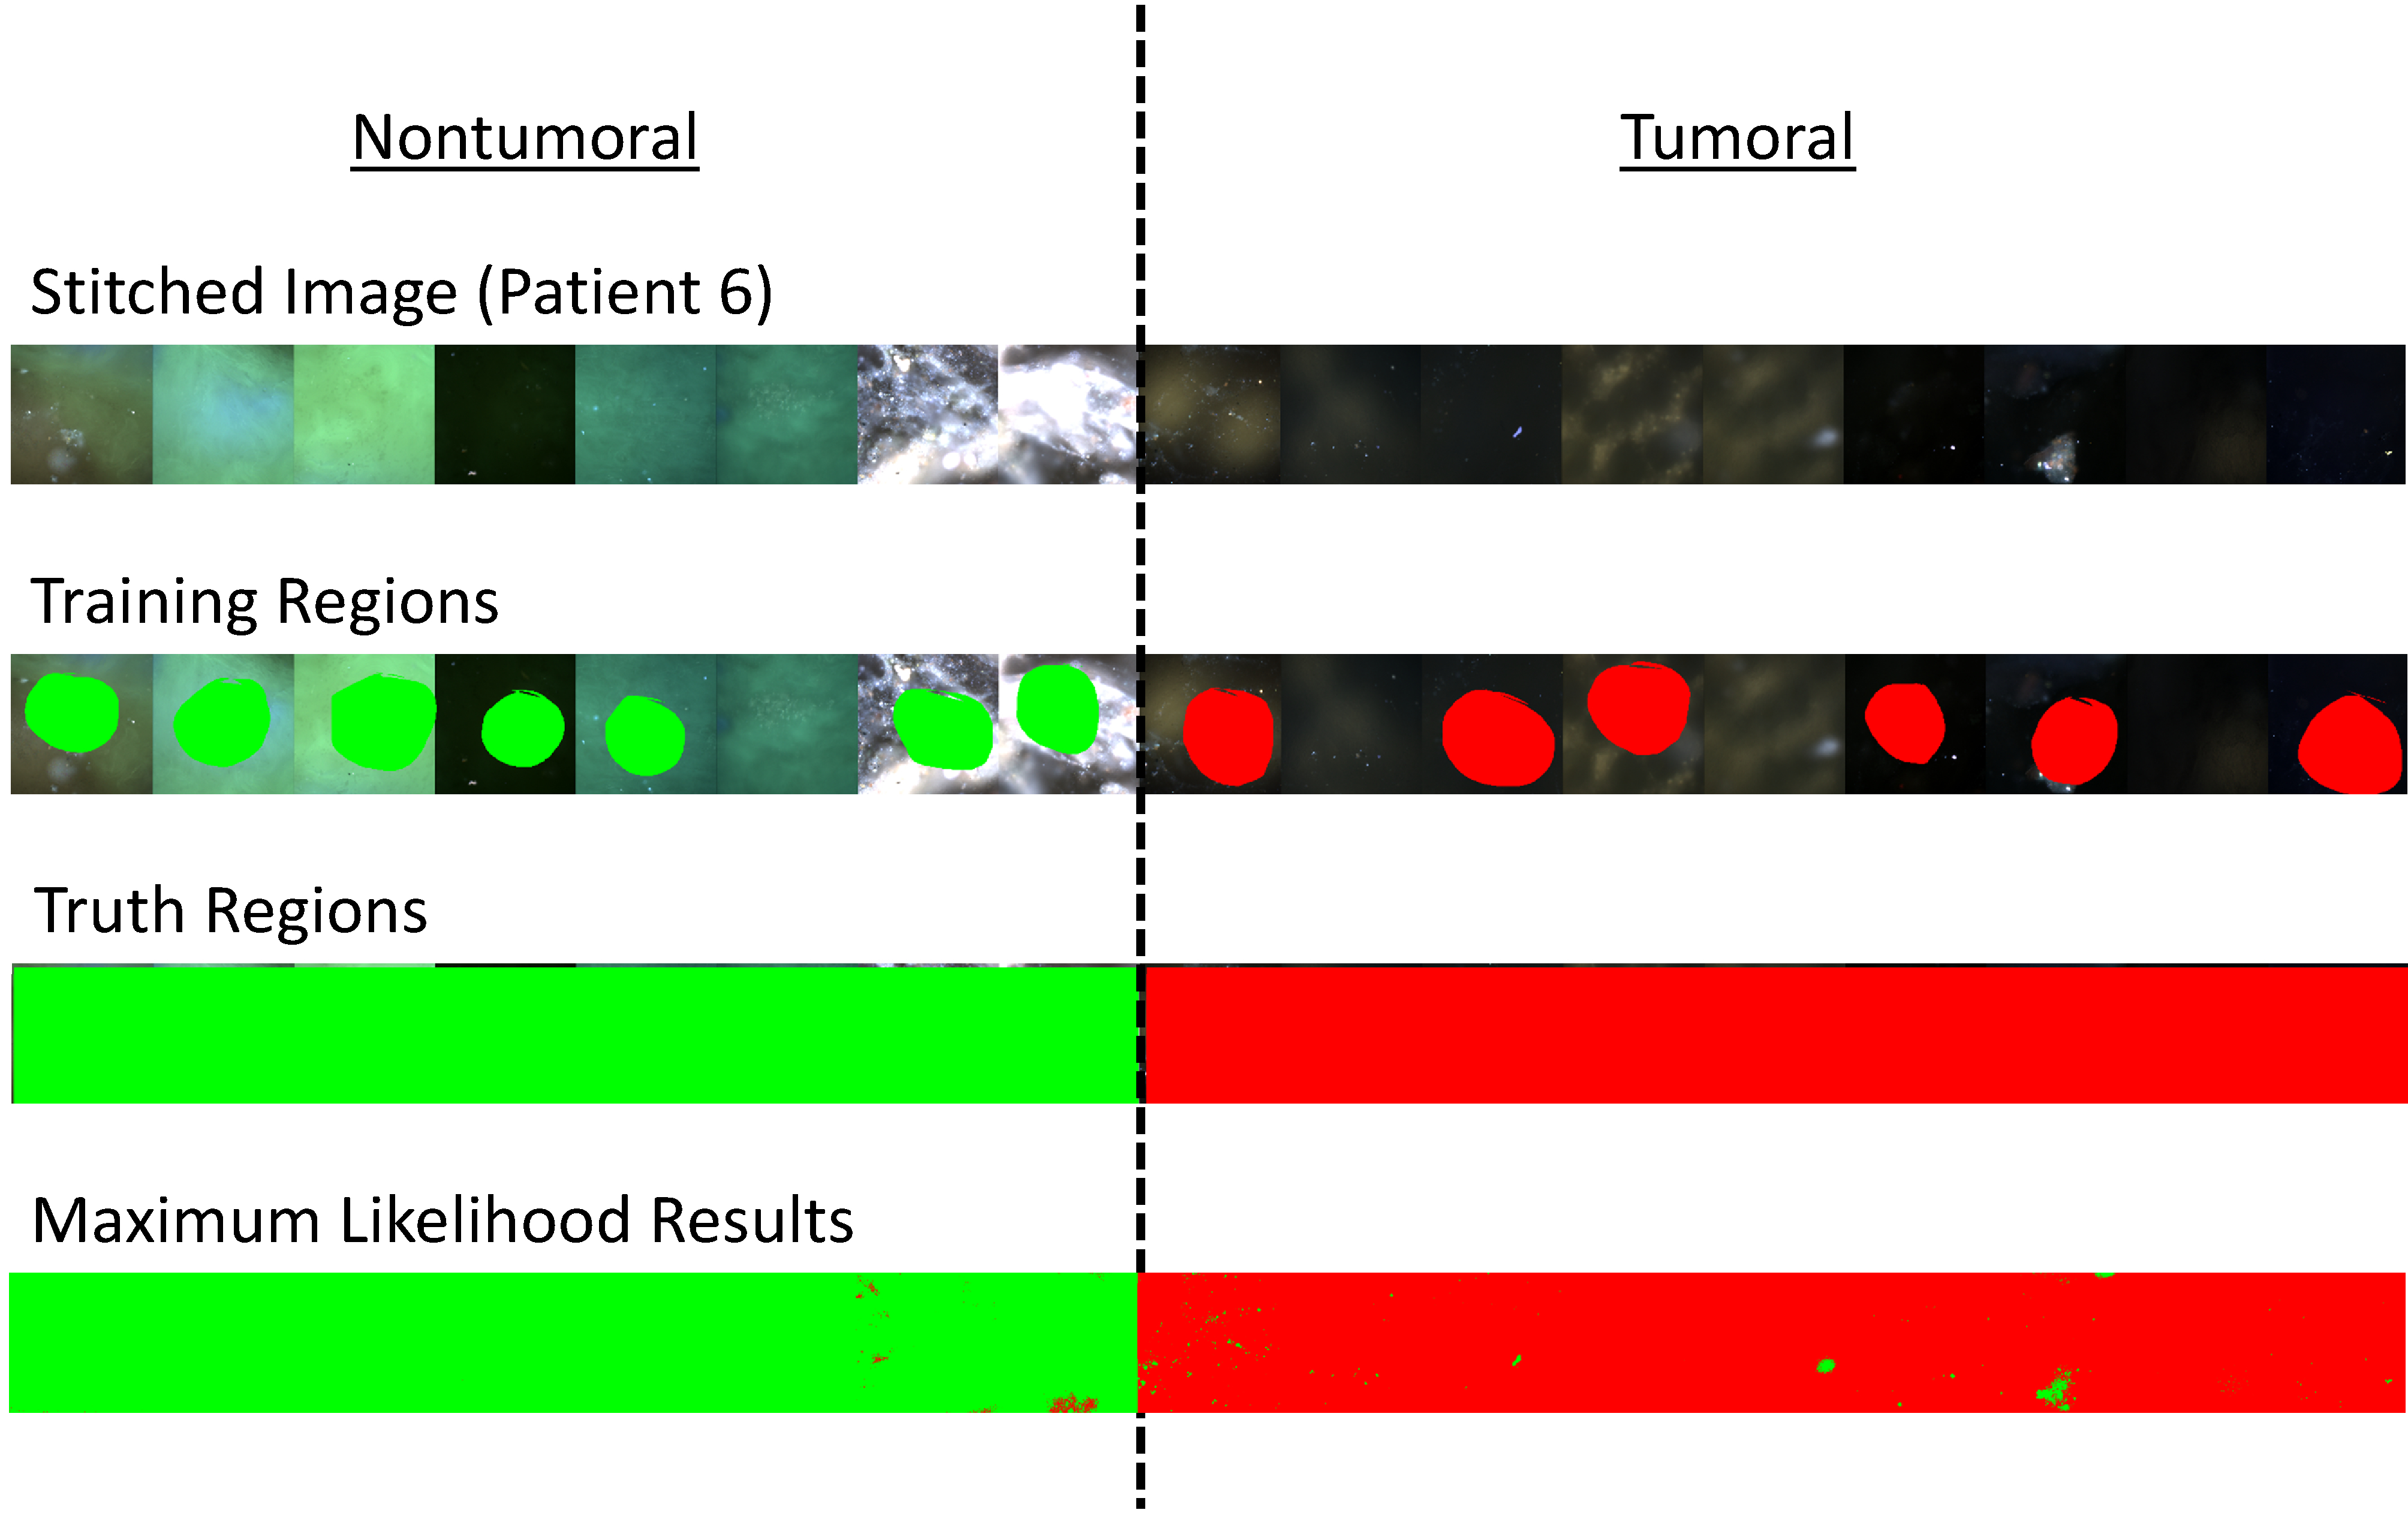
1st Row) Example stitched spectral image of fields of view from patient #6. Fields of view from the nontumoral specimen are shown at left and fields of view from the tumoral specimen are shown at right. 2nd Row) Training regions were selected among a subset of the fields of view. 3rd Row) Truth regions were selected to define all tumoral and nontumoral fields of view. 4th Row) Results from maximum likelihood classification where green pixels were classified as nontumoral and red pixels were classified as tumoral.
Figure 3:
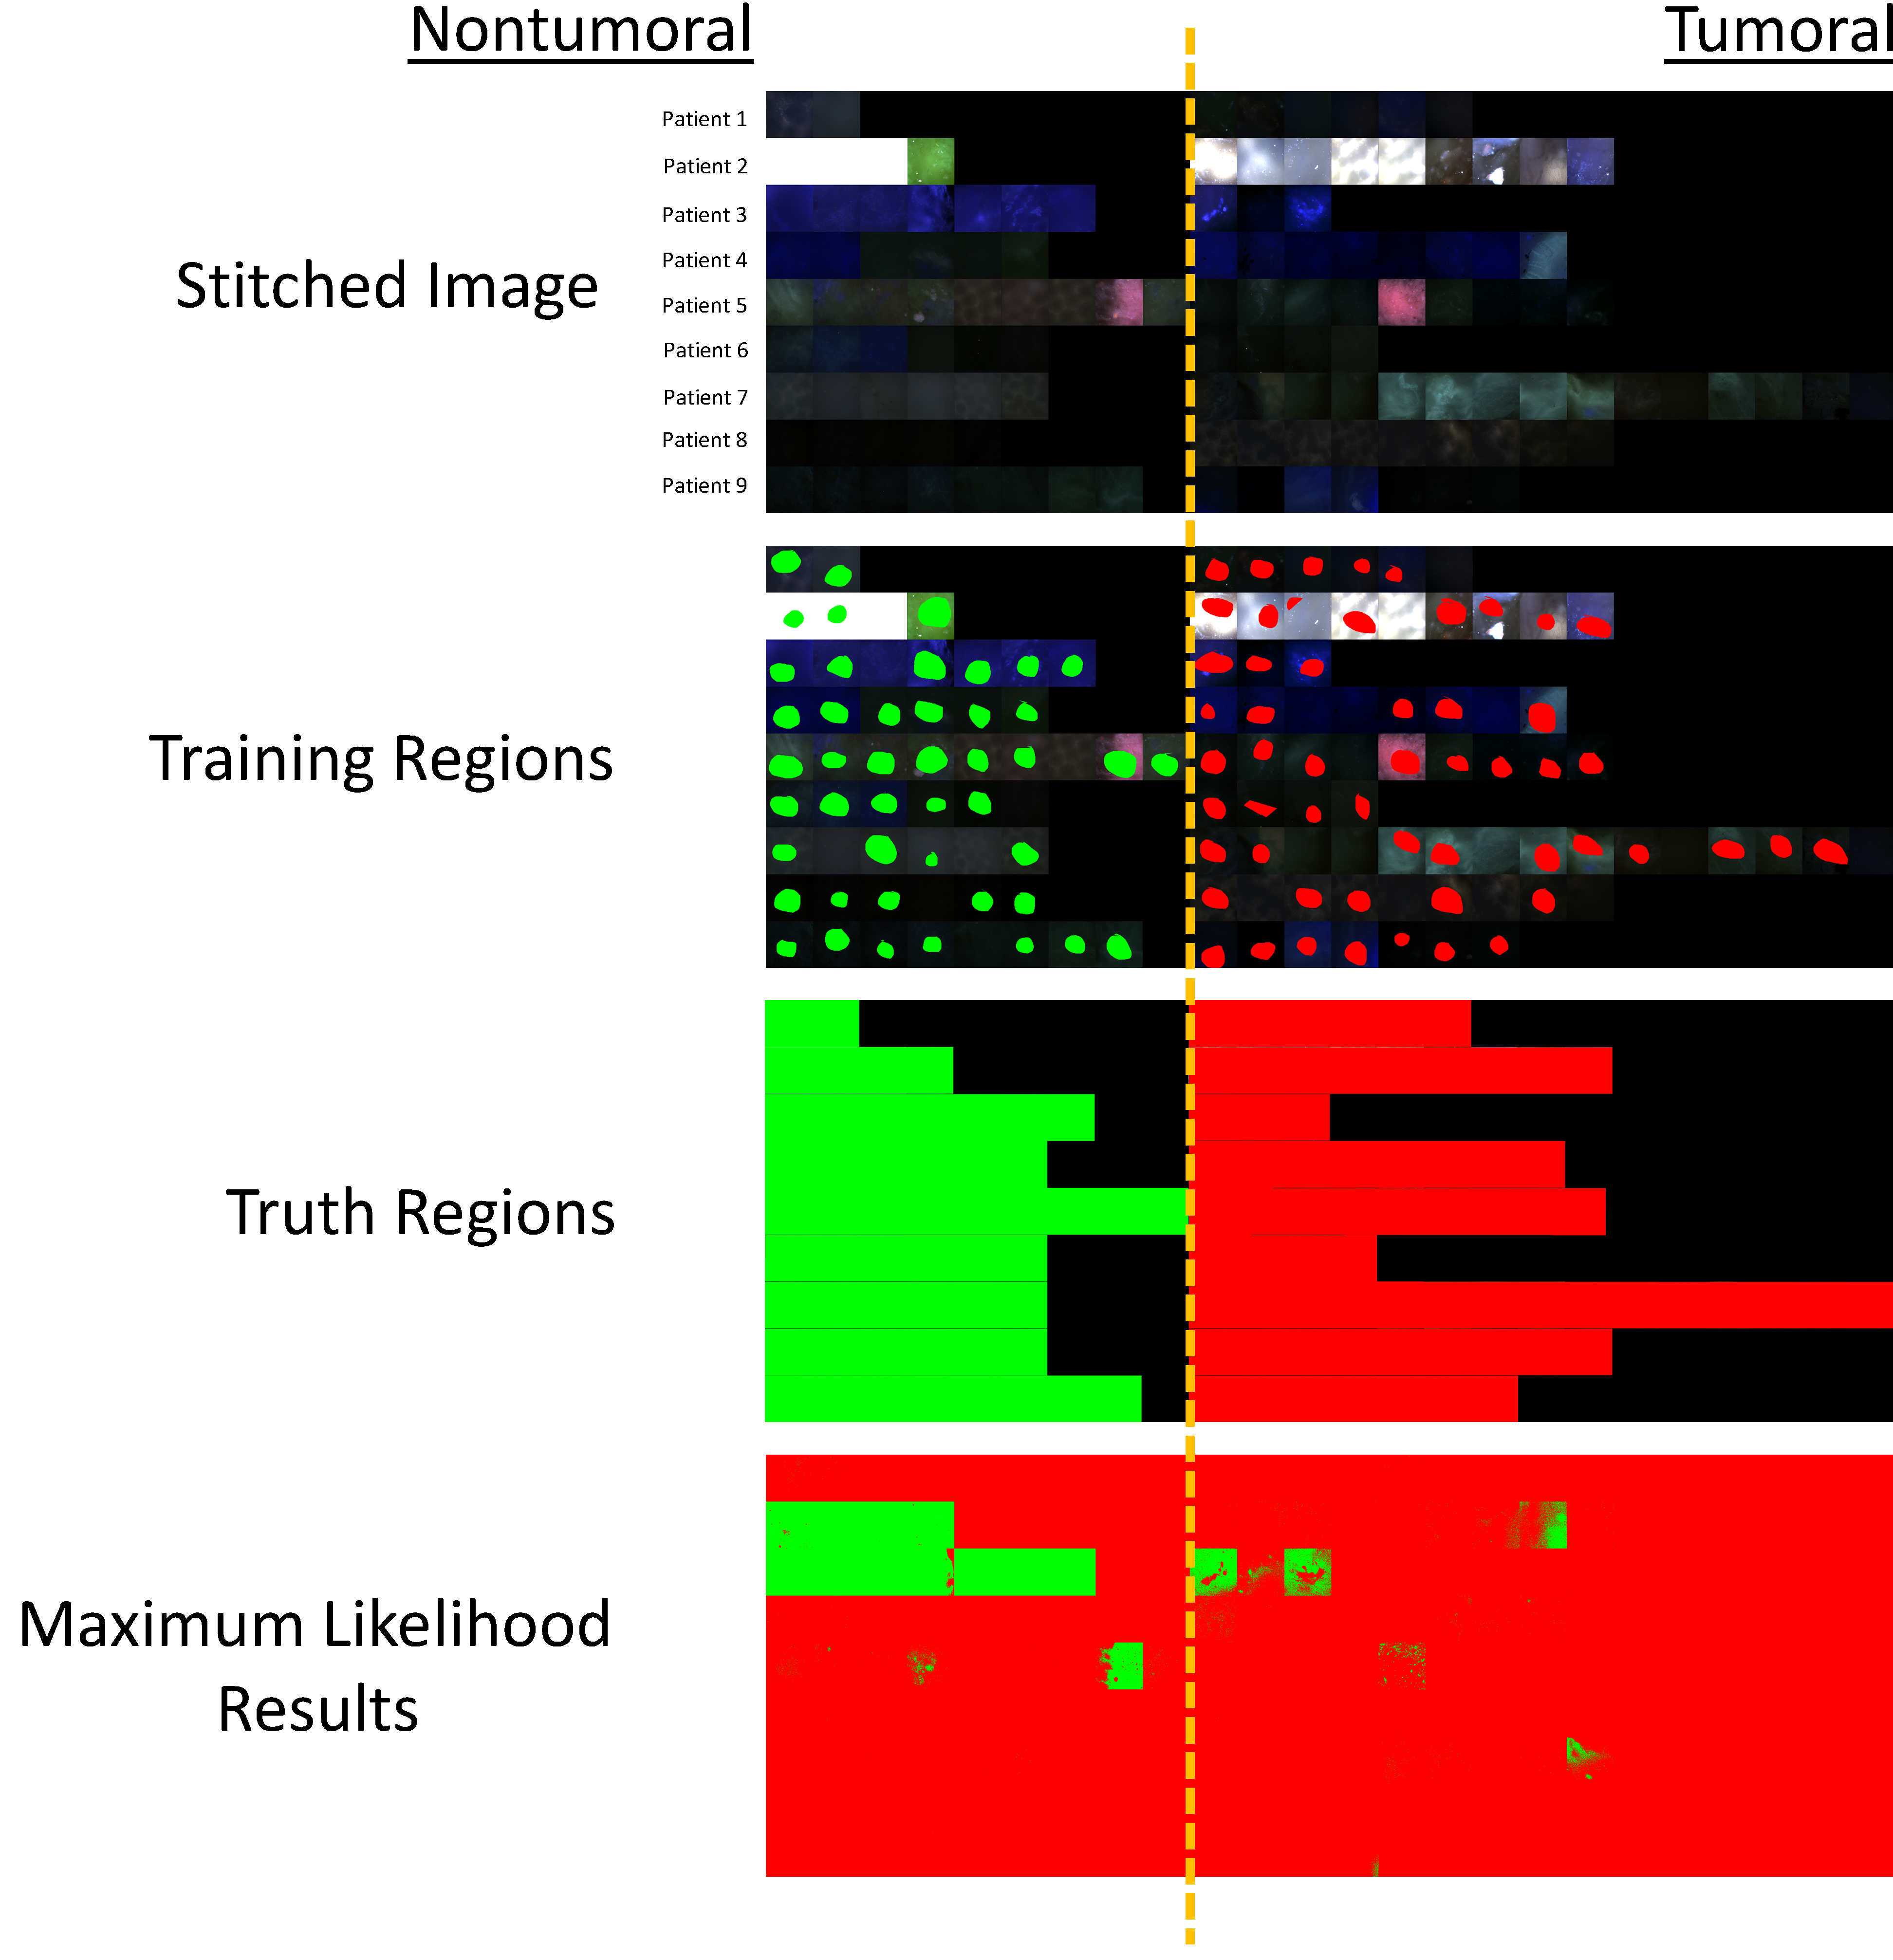
1st Row) Stitched spectral image of fields of view from patients 1–9. Fields of view from the nontumoral specimen are shown at left and fields of view from the tumoral specimen are shown at right. 2nd Row) Training regions were selected among a subset of the fields of view. 3rd Row) Truth regions were selected to define all tumoral and nontumoral fields of view. 4th Row) Results from maximum likelihood classification where green pixels were classified as nontumoral and red pixels were classified as tumoral. Several fields of view can be identified as obvious outliers that were misclassified.
A range of classifiers were examined to evaluate the ability to differentiate tumoral and nontumoral specimens based on excitation spectral signatures. Results from the maximum likelihood classifier indicate that it is, in general, an effective supervised classifier for differentiating spectral images from tumoral and nontumoral colorectal tissues (Figure 4). Of note, intra-patient spectral variations were in general small, resulting in a very high classification accuracy of 99.46%. However, inter-patient spectral variations were more significant, resulting in a lower classification accuracy of 63.98%. However, even with reduced classification accuracy, it should also be noted that the confusion matrix results indicate that 96.66% of tumoral tissues were correctly identified as tumoral, corresponding to a 96% sensitivity for correctly detecting pixels within tumoral spectral images.
Figure 4:
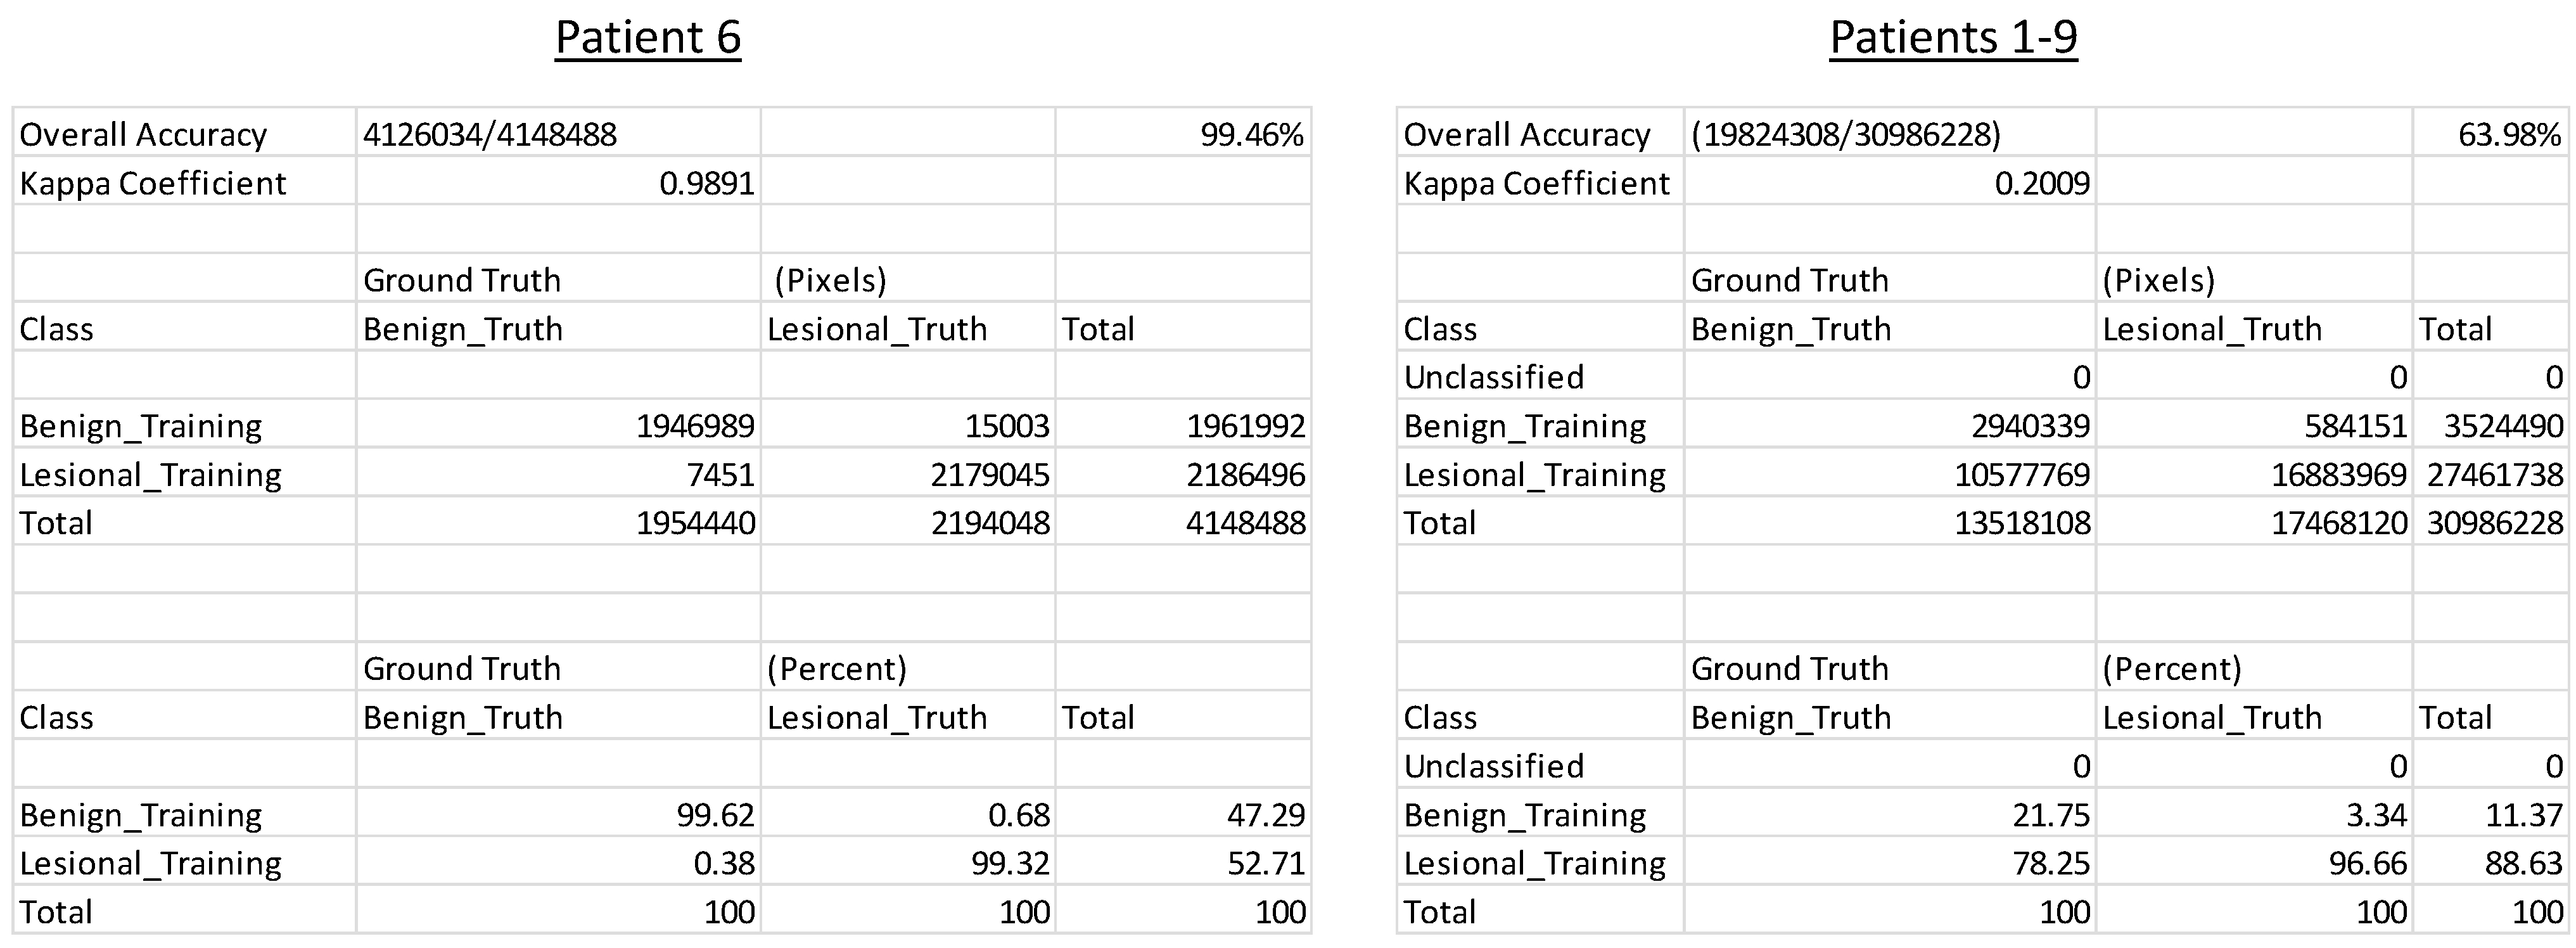
Maximum likelihood classifier results for patient #6 (left) and patients #1–9 (right), corresponding to stitched images shown in Figure 2 and Figure 3, respectively. Classification accuracy (shown in the upper right of each panel) as well as a confusion matrix showing % in each class (shown at the bottom of each panel) are the main metrics of classification performance. All metrics are presented on a pixel-wise basis.
4. CONCLUSIONS AND FUTURE WORK
Hyperspectral imaging technologies began to be adopted from the remote sensing field to biomedical microscopy and other biomedical imaging applications over 2 decades ago. However, these technologies have been slow to become translated to clinical detection devices, due to a range of factors including cost, complexity, image acquisition speed, and data complexity. Here, we show that hyperspectral image data from resected tumoral and nontumoral colorectal tissue specimens can be used with automated classification algorithms to accurately discriminate pixels in tumoral spectral images from those in nontumoral images. However, we also show that patient-to-patient variation in spectral image data is non-negligible. Hence, a potential area of future work is to investigate the nature of patient-to-patient variability in fluorescence excitation spectra of colorectal tissues and to develop classification algorithms that better account for a reasonable range of clinical variability.
5. ACKNOWLEDGEMENTS
The authors would like to acknowledge support from NIH grants P01 HL066299, UL1 TR001417, S10 RR027535, S10 OD020149, NSF grants 1725937, and the Abraham Mitchell Cancer Research Fund. The authors (Drs. Leavesley and Rich) also disclose financial interest in a start-up company, SpectraCyte LLC, formed to commercialize spectral imaging technologies.
REFERENCES
- [1].Fink DJ, “Monitoring earth’s resources from space,” Technology Review 75, 32–41 (1973). [Google Scholar]
- [2].Goetz AFH, Vane G, Solomon JE, and Rock BN, “Imaging spectrometry for earth remote sensing,” Science 228(4704), 1147–1152 (1985). [DOI] [PubMed] [Google Scholar]
- [3].Garini Y, Young I, and McNamara G, “Spectral imaging: principles and applications,” Cytometry Part A 69(8), 735–747 (2006). [DOI] [PubMed] [Google Scholar]
- [4].McNamara G, Gupta A, Reynaert J, Coates TD, and Boswell C, “Spectral imaging microscopy web sites and data,” Cytometry Part A 69(8), 863–871 (2006). [DOI] [PubMed] [Google Scholar]
- [5].Li Q, He X, Wang Y, Liu H, Xu D, and Guo F, “Review of spectral imaging technology in biomedical engineering: achievements and challenges,” Journal of biomedical optics 18(10), 100901–100901 (2013). [DOI] [PubMed] [Google Scholar]
- [6].Lu G, and Fei B, “Medical hyperspectral imaging: a review,” Journal of biomedical optics 19(1), 010901–010901 (2014). [DOI] [PMC free article] [PubMed] [Google Scholar]
- [7].Leavesley SJ, Annamdevula N, Boni J, Stocker S, Grant K, Troyanovsky B, Rich TC, and Alvarez DF, “Hyperspectral imaging microscopy for identification and quantitative analysis of fluorescently-labeled cells in highly autofluorescent tissue,” Journal of Biophotonics 5(1), 67–84 (2012). [DOI] [PMC free article] [PubMed] [Google Scholar]
- [8].Chen Y, Mauldin JP, Day RN, and Periasamy A, “Characterization of spectral FRET imaging microscopy for monitoring nuclear protein interactions,” Journal of Microscopy 228(2), 139–152 (2007). [DOI] [PMC free article] [PubMed] [Google Scholar]
- [9].Leavesley SJ, Britain A, Cichon LK, Nikolaev VO, and Rich TC, “Assessing FRET using spectral techniques,” Cytometry Part A 83(10), 898–912 (2013). [DOI] [PMC free article] [PubMed] [Google Scholar]
- [10].Levy S, Wilms CD, Brumer E, Kahn J, Pnueli L, Arava Y, Eilers J, and Gitler D, “SpRET: Highly sensitive and reliable spectral measurement of absolute FRET efficiency,” Microscopy and Microanalysis 17(02), 176–190 (2011). [DOI] [PubMed] [Google Scholar]
- [11].Andersson-Engels S, Johansson J, and Svanberg S, “Medical diagnostic system based on simultaneous multispectral fluorescence imaging,” Applied Optics 33(34), 8022–8029 (1994). [DOI] [PubMed] [Google Scholar]
- [12].Mansfield JR, Sowa MG, Payette JR, Abdulrauf B, Stranc MF, and Mantsch HH, “Tissue viability by multispectral near infrared imaging: a fuzzyC-means clustering analysis,” Medical Imaging, IEEE Transactions on 17(6), 1011–1018 (1998). [DOI] [PubMed] [Google Scholar]
- [13].Farina B, Bartoli C, Bono A, Colombo A, Lualdi M, Tragni G, and Marchesini R, “Multispectral imaging approach in the diagnosis of cutaneous melanoma: potentiality and limits,” Physics in Medicine and Biology 45(5), 1243–1254 (2000). [DOI] [PubMed] [Google Scholar]
- [14].Leavesley SJ, Jiang Y, Patsekin V, Rajwa B, and Robinson JP, “An excitation wavelength--scanning spectral imaging system for preclinical imaging,” Review of Scientific Instruments 79(2), 023707–023710 (2008). [DOI] [PubMed] [Google Scholar]
- [15].Chaudhari AJ, Darvas F, Bading JR, Moats RA, Conti PS, Smith DJ, Cherry SR, and Leahy RM, “Hyperspectral and multispectral bioluminescence optical tomography for small animal imaging,” Physics in Medicine and Biology 50(23), 5421–5441 (2005). [DOI] [PubMed] [Google Scholar]
- [16].Alfano R, Tata D, Cordero J, Tomashefsky P, Longo F, and Alfano M, “Laser induced fluorescence spectroscopy from native cancerous and normal tissue,” Quantum Electronics, IEEE Journal of 20(12), 1507–1511 (1984). [Google Scholar]
- [17].Bigio IJ, and Mourant JR, “Ultraviolet and visible spectroscopies for tissue diagnostics: fluorescence spectroscopy and elastic-scattering spectroscopy,” Physics in Medicine and Biology 42(5), 803 (1997). [DOI] [PubMed] [Google Scholar]
- [18].Richards-Kortum R, and Sevick-Muraca E, “Quantitative optical spectroscopy for tissue diagnosis,” Annual Reviews in Physical Chemistry 47, 555–606 (1996). [DOI] [PubMed] [Google Scholar]
- [19].Wagnieres GA, Star WM, and Wilson BC, “In vivo fluorescence spectroscopy and imaging for oncological applications,” Photochemistry and photobiology 68(5), 603–632 (1998). [PubMed] [Google Scholar]
- [20].Leavesley SJ, Wheeler M, Lopez C, Baker T, Favreau PF, Rich TC, Rider PF, and Boudreaux CW, “Hyperspectral imaging fluorescence excitation scanning for detecting colorectal cancer: pilot study,” presented at SPIE BiOS, 2016, 970315–970315. [DOI] [PMC free article] [PubMed]
- [21].Leavesley SJ, Walters M, Lopez C, Baker T, Favreau PF, Rich TC, Rider PF, and Boudreaux CW, “Hyperspectral imaging fluorescence excitation scanning for colon cancer detection,” Journal of Biomedical Optics 21(10), 104003–104003 (2016). [DOI] [PMC free article] [PubMed] [Google Scholar]
- [22].Favreau PF, Hernandez C, Heaster T, Alvarez DF, Rich TC, Prabhat P, and Leavesley SJ, “Excitation-scanning hyperspectral imaging microscope,” Journal of biomedical optics 19(4), 046010–046010 (2014). [DOI] [PMC free article] [PubMed] [Google Scholar]
- [23].Favreau PF, Hernandez C, Lindsey AS, Alvarez DF, Rich TC, Prabhat P, and Leavesley SJ, “Thin-film tunable filters for hyperspectral fluorescence microscopy,” Journal of biomedical optics 19(1), 011017–011017 (2014). [DOI] [PMC free article] [PubMed] [Google Scholar]
- [24].Favreau PF, Rich TC, Prabhat P, and Leavesley SJ, “Tunable thin-film optical filters for hyperspectral microscopy,” presented at SPIE BiOS, 2013, 85890R–85890R. [DOI] [PMC free article] [PubMed]
- [25].Annamdevula NS, Sweat B, Favreau P, Lindsey AS, Alvarez DF, Rich TC, and Leavesley SJ, “An approach for characterizing and comparing hyperspectral microscopy systems,” Sensors 13(7), 9267–9293 (2013). [DOI] [PMC free article] [PubMed] [Google Scholar]