

Abstract
Background:
Patients with many different digestive diseases undergo repeated esophagogastroduodenoscopy throughout their life. Tethered capsule endomicroscopy (TCE) is a less invasive method for obtaining high-resolution images of the gastrointestinal mucosa for diagnosis and treatment planning of diseases. In this paper, we present our results from a single center, aimed at testing the safety and the feasibility of TCE for imaging the esophagus, stomach, and duodenum.
Methods:
After swallowed by an unsedated subject, the tethered capsule obtains cross-sectional 10-μm-resolution optical coherence tomography images as the device traverses the alimentary tract. Following imaging, the device is withdrawn through the mouth, disinfected, and reused. Safety and feasibility of TCE were tested, focusing on imaging the esophagus of healthy volunteers and patients with Barrett’s esophagus, and duodenum of healthy volunteers. Images were compared to endoscopy and histopathology findings when available.
Results:
Thirty-eight patients were enrolled. No adverse effects were reported. TCE device swallowing rate was 34/38 (89%). The appearance of physiologic upper gastrointestinal wall, including its microscopic pathology was visualized in esophagus of BE subjects with and without endoscopic evidence of hiatal hernia, as well as in duodenum with a tissue coverage of 85.4 % ± 14.9 %, 90.3 % ± 6.8 % and 84.8% ± 7.4% respectively. A blinded comparison of TCE and endoscopic BE measurements showed a strong to very strong correlation (r = 0.7–0.83; p<0.05) for circumferential extent and a strong correlation (r=0.77–0.78; p< 0.01) for maximum extent (Prague classification). TCE interobserver correlation was very strong, r=0.92 and r=0.84 (p<0.01), for C and M measurements respectively.
Conclusions:
TCE is a safe and feasible procedure for obtaining high-resolution microscopic images of the upper GI tract without endoscopic assistance or sedation.
Graphical Abstract
INTRODUCTION
Esophagogastroduodenoscopy (EGD) is the standard of care for diagnosing upper gastrointestinal disease. EGD provides information about the macroscopic appearance of the surface of the mucosa but is unable to evaluate subsurface and microscopic alterations without requiring excisional biopsies. Despite recent technical improvements in endoscopes, white-light endoscopy-guided biopsies are subject to sampling error in patchy diseases such as esophageal dysplasia in Barrett’s esophagus. EGD is also an invasive procedure, that is often undesirable by patients, as it requires a day-long effort considering the procedure itself, the requirements of sedation, and subsequent recovery.
These limitations of EGD suggest that there is room for improvement in upper gastrointestinal tract diagnostics. For example, premalignant conditions such as Barrett’s esophagus (BE) are not screened for appropriately1, in part due to the lack of sufficiently accurate, well-tolerated, and cost-effective test2. Celiac disease requires a timely and accurate tissue diagnosis prior to committing patients to a gluten-free diet3.
Imaging depth resolved, microscopic architecture (~10 μm resolution) of the esophagus over large areas has been recently introduced, using a balloon catheter and optical coherence tomography (OCT) technology (also known as volumetric laser endomicroscopy - VLE).4 This advanced imaging technology still requires some form of endoscopy and, as a result, has all of the associated limitations. While improvements in patient comfort have been achieved with swallowable video capsule endoscopy and other forms of tethered capsule endoscopy5,6, these devices only enable macroscopic visualization of the mucosal surface. A new device that implements the imaging capabilities of OCT in a tethered, swallowable and reusable capsule has recently been developed (Figure 1A). Early results obtained with tethered capsule endomicroscopy (TCE) have been previously reported for imaging BE7–9.
Figure 1.


(A) Photograph of a tethered capsule endomicroscopy device. (B) Schematic representation of the TCE procedure. TCE images of the: (C) proximal esophagus (at 25 cm from the incisors) showing presence of an adjacent structure that likely represents an extra-esophageal blood vessel (red arrow) compressing the esophageal wall; (D) mid esophagus at 35 cm from the incisors showing the typical anatomical layers of the esophagus: epithelium (e), lamina propria (l), muscularis mucosa (m), submucosa (s), muscularis propria (mp), and adventitia (a); (E) lower esophageal sphincter region showing the homogenous, almost glassy appearance of a thickened squamous epithelium (green line) and high reflectance from the surface (blue dashed line) of a physiologic transformation zone that bridges stratified squamous mucosa as shown in (D) and gastric cardia with “pit pattern” (blue arrows) as shown in (F).
The aim of this study was to test the safety and feasibility of TCE for imaging the esophagus, stomach, and duodenum. We additionally compared TCE and EGD findings for BE assessment.
METHODS
Tethered capsule endomicroscopy
TCE technology consists of an OCT imaging console and a tethered capsule (Figure 1A).7,8 The tethered capsule has a diameter ranging from 11 to 12.8mm and a length of 24 to 24.8mm (see Supplementary Materials and Methods), which is comparable to the size of videoendoscopy capsule, and a flexible 2 meter-long tether that connects it to an OCT imaging console. The custom-built OCT imaging console, like an endoscopy processor, is responsible for light generation, collection of information from the probe, image processing and display. The OCT TCE technology provides images at a frame rate of 20 frames/second (2048 A-lines per frame and 2048 points for each A-line) with 10 μm axial (depth) resolution in tissue and 35 μm resolution along the lateral axis in 2D cross-sections.10 Resolution in the longitudinal direction (image spacing or spatial separation between cross-sections) depends on velocity of the capsule and is controlled by the operator. The imaging console was previously approved by the Massachusetts General Hospital (MGH) Biomedical Engineering department for clinical use.11,12 Nineteen TCE catheters were manufactured at MGH and used in these studies. Each capsule was used an average of 4 ± 3 times.
Study design
The first pilot study was approved by the Partners Institutional Review Board (IRB-2011-P002619) in February 2012, aimed at imaging of healthy volunteers. This study was extended to include subjects with BE. A subset of four subjects was reenrolled to test performance of different generations of the devices (see Supplementary Materials and Methods). Thus, the total number of TCE procedures was larger than the total number of patients. Swallowing rate and procedure preference statistics were calculated after excluding reenrolled subjects. In August 2013, a study conducted to investigate the use of TCE to image the duodenum was approved for healthy volunteers (IRB-2013-P001405).
Patients/subjects
Healthy volunteers were recruited by public announcement on the MGH website. The inclusion criteria for healthy volunteers included age ≥ 18 years old and the absence of a known digestive disease history. BE patients were recruited from the MGH Gastrointestinal Unit. For all study participants, the exclusion criteria were: known esophageal strictures, intestinal strictures, dysphagia, prior gastrointestinal surgery, or history of intestinal Crohn’s disease.
Clinical procedure
Subjects only required minimal preparation prior to TCE that included fasting for 4 hours. Clear liquids were allowed up until two hours before the procedure. After the capsule was swallowed, patients were free to talk normally and were asked to occasionally sip water. During the TCE procedure, patients were seated in a comfortable position, with exception of the studies where patient positioning (e.g. lateral decubitus) was used to navigate the capsule to the pylorus. The subjects were informed that they could stop the procedure at any time. In order to ensure the collection of the best quality data in each patient, the gastrointestinal tract was imaged in multiple passes (Figure 1B). prior to capsule’s removal by pulling the tether out. During the procedure, the OCT data was displayed in real-time on the screen.
Collected data
Each descending or ascending imaging OCT session was recorded to a separate file. OCT files were processed to 1200×1200 pixels movies after the procedure. Three-dimensional reconstructions of the TCE volumetric datasets presented in this paper were rendered in OsirixMD (v7.0, Pixemeo). For Figure 2D, regions with high grade dysplasia (HGD) and intramucosal carcinoma (IMC) were manually segmented, creating a HGD/IMC dataset and fused into original dataset before rendering.
Figure 2.


An 84-year-old male with a history of treated BE and IMC. Endoscopic appearance and corresponding TCE image obtained 2 hours before endoscopic treatment (A) at 28 cm (green arrowhead), (B) at 30 cm with two lesions (yellow arrowheads) showing a large number of atypical glands (enlarged/ irregular) separated by squamous mucosa, and (C) at the gastroesophageal junction with significant architectural atypia that is suggestive of cancer (blue arrowhead). Digitized histological slides of the biopsy obtained at 28cm (A) and at 39 cm (C) are inserted in the EGD pictures. (D) 3D rendering of the TCE dataset shown with a portion of the esophageal wall cut away, demonstrating the proximal part of the esophagus layered with squamous epithelium (SQ), the distal part of the esophagus with the three lesions and hiatal hernia (HH).
The study also was approved for video recording of the TCE procedure and collecting video from the endoscopic examination during the standard of care EGD if applicable. All OCT results were only used for research purposes. Details regarding demographics, EGD reports when available, imaging procedure and a patient questionnaire were collected and managed using REDCap electronic data capture tools hosted at MGH13.
TCE data analysis
To quantitatively assess the amount of tissue visualized by the TCE device, the TCE cross-sectional datasets were re-sliced perpendicular to the radial (depth) axis and summed to generate two-dimensional en-face projections of the organ. Regions where the tissue was not in the field of view were characterized by a lack of signal. En-face views were manually segmented and measured to provide the percent of the tissue visualized by the TCE device.
Capsule positions were determined by recording distance marks on the tether as it passed the incisors, similar to how distance measurements are performed with standard of care endoscopes. Tether marks and corresponding TCE frame numbers were regularly annotated throughout each procedure. This data was used to establish a correspondence between TCE images and results from endoscopy and histology (Figure 2) and estimate the lengths of BE segments and organs imaged with TCE.
To compare TCE to EGD results, 2 readers (GJT, LQ) blinded to the results of EGD assessed anonymized and randomized TCE movies from BE patients who had EGD within one year of the TCE procedure to quantify OCT-derived Prague C and M criteria (See Supplementary Materials and Methods). These values were compared to Prague C and M criteria obtained from the EGD report. Only BE TCE datasets were used because healthy volunteers did not undergo a reference EGD. Both readers underwent TCE training, comprising viewing an OCT training presentation with a post-test14, followed by review of exemplary TCE movies. GJT is also an expert reader of OCT VLE data.
Statistical analysis
All statistical analyses were performed with GraphPadPrism software version 5.00 for Windows (GraphPad Software, Inc, La Jolla, Calif). Data are expressed as the mean ± standard deviation. The relation between two quantitative variables was calculated using linear regression. Medians and frequency comparisons were calculated using Kruskall Wallis test and the Chi-square test, respectively. P values ≤ 0.05 were considered statistically significant.
RESULTS
Patient characteristics
Here we report results obtained in 45 procedures performed in 38 patients, focused on imaging of the esophagus in healthy volunteers and patients with a previous diagnosis of BE, and the proximal small intestine in healthy volunteers. The median age was 51 years (range, 19–84 years) and 68% were male (Table 1).
Table.1.
Summary of patient characteristics and results from the TCE procedure.
| Characteristics | Total | Healthy esophagus | Barret’s esophagus | Healthy duodenum |
|---|---|---|---|---|
| Number of subjects | 38 | 17 | 17 | 4 |
| Age – year (mean ± SD) | 47 ± 18 | 35 ± 13 | 62 ± 11 | 38 ± 15 |
| Men – No (%) | 26 (68%) | 9 (53%) | 13 (76%) | 4 (100%) |
| BMI - kg/m2 (mean ± SD) | 26.8 ± 4.3 | 25.4 ± 3.7 | 28.9 ± 4.2 | 24. ± 4.7 |
| PROCEDURE | ||||
| Swallowing success - No (%) | 34 (89%) | 15 (88%) | 15 (88%) | 4 (100%) |
| Number of swallow attempts - (median ± IQR) | 1.0 ± 1.0 | 1.0 ±1.5 | 1.0 ± 1.0 | 1.0 ± 0.0 |
| Number of swallow attempts in successful cases - (median ± IQR) | 1.0 ± 1.0 | 1.0 ± 1.0 | 1.0 ± 0.5 | 1.0 ± 0:0 |
| Total capsule time – min:sec (mean ± SD) | 5:28 ± 0:50 | 6:30 ± 2:34 | 121:30 ± 35:31 | |
| Procedure preference (mean ± SD) (1 – Would prefer TCE, 2 – Not sure, 3 – Would prefer sedated endoscopy) | 1.54 ± 0.74 | 1.50 ± 0.71 * | 1.71 ± 0.83 | 1.00 ± 0.00 |
Only 10 out of 17 healthy volunteers completed a post procedural questionnaire.
Study design and outcome
All studies were aimed at testing the overall safety and acceptability (Table 1) of the TCE device administered to unsedated patients and the feasibility of collecting high quality OCT data. There were no adverse events. The overall swallowing rate was 34 out of 38 (89%) and did not depend on the capsule size (see Supplementary Materials and Methods). In all successful cases, patients needed only 1–2 attempts (1.0 ± 1.0) to swallow the capsule (Table 1). A total of 18 out of 29 subjects (62%) stated that they would prefer TCE to EGD, 4 (14%) were not sure, and 7 (24%) would prefer sedated EGD (Table 1). TCE vs. EGD preference did not depend on the capsule size (p=0.67), procedure length (p=0.20), history of previous EGD (p=0.37), or subject type (P=0.50). Overall, in 40 out of 45 imaging procedures in subjects who swallowed the capsule, high quality OCT cross-sectional radial frames with corresponding capsule positions were recorded in 124 imaging runs providing more than 120,000 frames (15.8 meters) of esophageal tissue and more than 28,000 frames (3.6 meters) of gastric cardiac. In a subset of 3 procedures, an additional 55,800 frames were recorded in the stomach body, antrum, and pylorus, and more than 58,000 frames were obtained over a total length of 1.6 meters of duodenum. The cross-sectional, longitudinal frame separation, calculated from the recorded capsule positions vs. time in all imaging passes, was 150.1 ± 131.0 μm. The wide longitudinal image spacing distribution was caused by variations in manual control of the capsule’s motion.
Imaging esophagus in healthy volunteers - the “normal” transformation zone
From the TCE images, collected in healthy volunteers, normal variations of characteristic features, like thicknesses of anatomical layers and shapes and distributions of glands and ducts (Figure 1), can be studied as a function of age, gender, and location within the esophagus. A critical step for differentiation between esophageal metaplasia (e.g. BE) vs. normal gastroesophageal junction is the identification and characterization of the normal transformation zone, which (Figure 1E) represents the location where the esophageal squamous mucosa meets the columnar mucosa of the proximal stomach. In most presumably healthy volunteers, this region of tissue was distinct from squamous mucosa (Figure 1C,D) and gastric cardia (Figure 1F), characterized by a homogenous, almost glassy appearance of a thickened squamous epithelium. In addition, not uncommonly, TCE images also showed high reflectance from the transformation zone’s surface (Figure 1E).
Imaging patients with Barrett’s Esophagus
Among 17 subjects: 2 had suspicion of BE without biopsy confirmation for SIM; 8 subjects had confirmed short segment BE; and 7 had long segment BE. Two subjects had a history of low grade dysplasia, 2 of high grade dysplasia, and one had a history of intramucosal carcinoma. Two subjects were imaged after they received treatment (Figure 2). Among the 13 BE subjects who successfully swallowed the capsule and had an EGD within 12 months of the TCE procedure, in 10 BE subjects with endoscopic evidence of hiatal hernia, we were able to clearly visualize the esophageal wall in 85.4 % ± 14.9 % of acquired data, compared with 3 patients without EGD evidence of hernia, where the esophageal wall was clearly seen in 90.3 % ± 6.8 % of all data (p=0.88). A blinded comparison of TCE and EGD measurements of BE circumferential and maximum extents showed a strong to very strong correlation (r=0.7–0.83; p<0.05) for circumferential extent (Prague classification C) and a strong correlation (r=0.77–0.78; p< 0.01) for maximum extent (Prague classification M) (Figure S1). TCE interobserver correlation was very strong, r=0.92 and r=0.84 (p<0.01), for C and M measurements respectively.
Imaging the stomach in healthy volunteers
In most TCE cases, the gastric cardia, was imaged as the capsule descended distally from the esophagus through the lower esophageal sphincter showing relatively shallow image penetration, gastric rugae, and a characteristic “pit pattern,” that can be seen as vertical stripes emanating from the mucosal surface (Figure 3A).15 Similar “pit patterns” can be found in the stomach body and pylorus (Figure 3). While the passive tethered capsule was incapable of imaging the entire stomach, peristalsis was frequently still engaged, resulting in partial circumferential images of the lower part of the stomach’s body and antrum allowing, for example, for three-dimensional reconstruction of a hyperplastic polyp or polypoid foveolar hyperplasia emerging from the mucosal surface in a healthy volunteer (Figure 3D).
Figure 3.


(A) TCE image of the cardia of a 31-year-old female subject, with first gastric rugae (blue asterisk) and gastric “pit pattern” (blue arrows). (B) TCE cross-section of the stomach body of a 22-year-old male subject gastric “pit pattern” (blue arrows) during peristalsis and (C) rendering of the OCT data in the adjacent area showing an example of hyperplastic polyp or polypoid foveolar hyperplasia emerging from the mucosal surface and underlying stomach mucosa. (D) TCE cross-section of the gastric antrum in the same 22-year-old subject showing portion of the stomach (s) lined by a clear layer of mucus (m), interposed between the epithelium and more particulate, highly scattering tissue within the lumen, likely representing chyme (ch). (E) TCE cross-section of the pylorus, showing a gastric “pit pattern” (blue arrows) and chyme (ch) passing to small intestine in the same subject. Green star - reflection artifact.
Imaging the small intestine in healthy volunteers
To test this technology for unsedated imaging of the duodenum,16 the capsule was navigated through the esophagus and the stomach to the pylorus using a patient positioning technique previously employed for the Crosby capsule.17 We found that increasing the capsule’s weight allowed gravity to assist its descent into the duodenum. The lightest capsule (1.34g) did not enter the duodenum throughout the entire procedure. A heavier capsule (4.15g) entered the duodenum in 68 minutes. The heaviest capsule (6.00g) entered the duodenum in 14 and 36 minutes. However, the capsule was accidentally pulled out of the duodenum for these two cases and additional 43 and 22 minutes were needed to pass the device through the pylorus again. This data suggests that the duodenal imaging procedure can be sufficiently short if the capsule is heavy, proper patient positioning is applied, and the procedure is further refined to avoid unintentional removal from the intestine.
Once in the duodenum, the capsule position was zeroed at the pylorus using the tether. The intestine constricted around the capsule in a manner similar to that of the esophagus, propelling the device through the organ via peristalsis and gravity and providing 3D views of both the macro- and microscopic anatomy of the duodenum in vivo (Figure 4, movie S1). TCE image quality was high throughout, without being affected by bile and debris within the lumen. In 84.8% ± 7.4% of acquired data, the duodenal wall was well visualized by TCE. During the procedure, subjects experienced no gagging or coughing related to the tether and none of the subjects reported a sore throat after the procedure.
Figure 4.


(A) Three-dimensional reconstruction of the OCT dataset obtained over a 20 cm length of duodenum from a 44-year-old male subject showing the pylorus (p), the pyloric valve (yellow arrow) and 3 duodenal segments and corresponding cross-sectional images (white dotted arrows). Superior and inferior duodenal flexures (yellow and green asterisks, respectively) appear as indentations in the duodenal surface. (B) Luminal, fly-through view of the 2d portion of the duodenum from a 30-year-old male subject showing circular folds (arrow) and duodenal juice (asterisk). (C) TCE image from another subject showing whorls of digestive juice a denser fluid within the lumen (blue arrows), with smaller and more consistently sized particles than chyme (asterisk), seen together with long papillae (red arrows), reminiscent of valves of Santorini. Green star - reflection artifact.
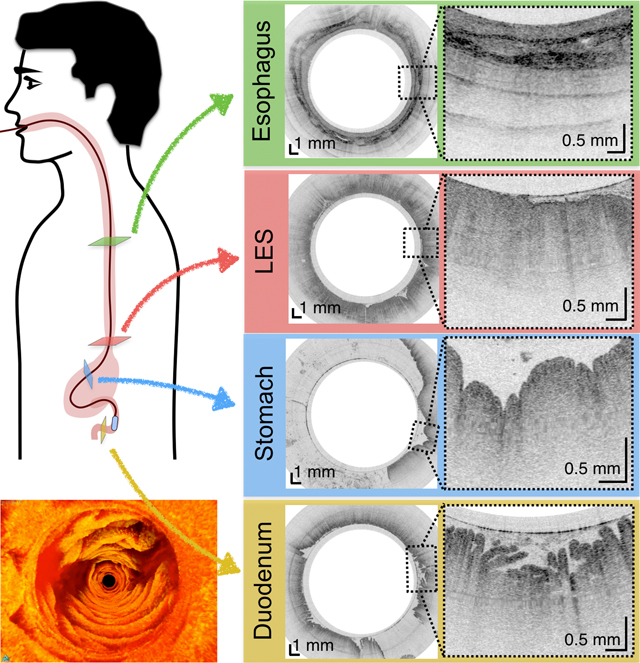
For subjects enrolled in the duodenum imaging study, we also acquired images of the esophagus and stomach along the way, forming a complete picture of the entire upper gastrointestinal tract (Figure 5).
Figure 5.


(A) Schematic diagram of the location of TCE images taken from a 30-year-old male subject showing: (B) Proximal esophagus with typical layered architecture of squamous mucosa. (C) Transformation zone with homogenous, almost glassy appearance of a thickened squamous epithelium with high reflectance from the surface (red arrowhead). (D) Image of the stomach showing partial contact of the wall with the capsule and typical gastric “pit pattern” (blue arrowheads). (E) The third segment of the duodenum demonstrating villi (yellow arrowheads) emanating from the mucosal surface. We were able to determine that our images reached the third portion of the duodenum by the distance the tether traveled (20 cm), and 3D visualization of the inferior duodenal flexure and an increase in the thicknesses of the circular folds. Green star - reflection artifact.
DISCUSSION
This paper demonstrates the feasibility of TCE for obtaining high quality and informative microscopic OCT data from the whole esophagus, portions of the stomach, and 20 cm of the duodenum. Our results highlight the possibility of using TCE for Barrett’s esophagus screening given its acceptability compared to standard EGD and the fact that it does not require sedation. Its application for BE surveillance remains to be determined, but it could be appealing for patients who are reluctant to undergo repeated endoscopic follow-ups. As importantly, we were able to collect a large volume of images in presumably healthy volunteers that may be representative of normal GI tract mucosa. Most published OCT results from the human gastrointestinal tract have been obtained with assistance of endoscopy, thus limiting imaging to patients with preexisting gastrointestinal conditions11,12,15,18–29. Thus, little is known about the OCT appearance of the “normal” esophagus.
As the capsule was progressing to the duodenum, we obtained, for the first time to our knowledge, cross sectional images of the gastric great curvature and the antrum, identifying the normal ‘pits and crypts’ pattern and, in one subject, a probable benign polyp. Imaging the stomach with TCE is challenging because, first, as the lumen is large, the peristalsis does not enable a circumferential contact except in the antrum, second, because some areas such as the fundus are not easily reached and, third, its position cannot be easily controlled. However, by asking the patient to change position, from sitting to left dorsal decubitus for instance, it was possible to navigate the capsule through the body and antrum of the stomach. We think that with further refinement of patient positioning, it should be possible to more systematically image different parts of the stomach. Furthermore, we were able to measure the frequency of antrum contractions, which could be of interest in pathology such as gastroparesis.
Thanks to the close collaboration with clinicians at the device development stage, the form factor, clinical use, and cleaning of the TCE device are similar to that of other devices in gastrointestinal unit (e.g. manometry catheters), making it intuitive and easy to use and operate (see Supplementary Materials and Methods). Almost half of the TCE procedures were done by research nurses, without need of any special equipment and with a subject seated on a regular chair. Research-grade TCE devices in this study were used on average 4 times with a cost-of-goods that in volume should be in the same range as that of capsule videoendoscopy devices. The size of the TCE capsule is comparable to that of a capsule videoendoscopy device, and after the capsule was swallowed, only a thin (~1 mm diameter), flexible tether was present in the pharynx of the patient. For the majority of subjects (89%), neither swallowing nor the presence of the tether induced gagging or discomfort during the procedure. While we did not employ this method, it is possible to administer a topical anesthetic to further improve comfort, as during manometry.30
As our studies progressed, we increased the weight of the capsule by a factor of approximately two in comparison to the weight of the capsule videoendoscopy device to compensate for the influence of the tether on the capsule’s translation and to allow faster duodenal entry. TCE images of the duodenum allowed wide-area villous morphology mapping, which together with the assessment of duodenal inflammation is important for rendering a tissue diagnosis of celiac disease. Owing to its less invasive nature and its capacity to image the entire duodenum and thus reduce sampling uncertainty, TCE mapping of villous atrophy could be useful for obtaining an initial diagnosis of celiac disease in patients with positive serology. Similarly, it could be helpful for in the evaluation of patients with resistance to a gluten-free diet. Taking into account that other unsedated procedures, like esophageal manometry, last for about 20 minutes31, further research will need to be conducted to decrease the time needed to cross the pylorus and image the duodenum.
One limitation of our TCE studies thus far is the lack of biopsy confirmation for some of the TCE findings. BE is the only disease that has been well validated by OCT histopathologic correlative studies and the diagnostic criteria that have been previously published are likely applicable to OCT TCE images15,22–24,32,33. Indeed, comparison of BE extent measured using TCE and EGD demonstrated that Prague C&M classifications were strongly correlated for the two methods. In addition, since the status of subjects recruited as “healthy” volunteers was not confirmed with EGD, the results that we reported in presumably normal subjects should be considered preliminary. While our findings suggest it is feasible to image stomach and duodenum, since the number of patients is small, these results should be considered exploratory, meriting larger studies to define the potential role of TCE for gastric and intestinal evaluation. A large cohort one-to-one correlation study, evaluating the sensitivity and specificity of TCE for diagnosing various diseases of the upper gastrointestinal tract is also necessary. Such a study could be facilitated by incorporating laser cautery marking that has been previously developed for OCT-based VLE34 into the TCE technology.
Further improvements in TCE technology need to take place in order for this procedure to be conveniently conducted in outpatient settings and adopted in clinical practice. The TCE system would ideally be operated by a single user, providing feedback to a nurse or physician’s assistant about the quality of the OCT data in real time. For these early studies, we collected between one and six full imaging runs to ensure that the best quality data was collected. Each imaging run was processed to a movie of less than 1 minute on average (for the esophagus). Taking into account that on average we imaged the organ of interest 4 times, the reader had 4 minutes of OCT movies to review for each patient. It took approximately 10 to 15 minutes to review each case. A capacity to automatically determine and record the position of the capsule within the gastrointestinal tract could be implemented so that TCE findings could be more easily correlated with subsequent endoscopic assessment in order to streamline data reading. Another important development would be software that could in real time automatically discriminate various tissue types and also determine if the gastrointestinal tract wall is in contact with the capsule35 and whether or not additional runs are needed.
This manuscript adds information on the potential utility of OCT-based TCE for evaluating BE and shows a strong relationship between endoscopic Prague criteria and TCE analogues. In addition, this research demonstrates that it is possible to acquire TCE data from the stomach and duodenum, opening up the possibility of using this technology for a wider range of upper GI tract indications. Future studies are merited to validate this technology against endoscopic biopsy and ultimately demonstrate that TCE can be a cost-effective and better tolerated alternative for certain upper gastrointestinal screening applications.
Supplementary Material
Acknowledgments:
The authors thank Catriona Grant, Bill Puricelli, Amna Soomro, and Aubrey Tiernan for facilitating human studies approval process, patient enrollment, data management and assistance in clinical procedures, as well as Thomas Cerruto and his team at the MGH GI Unit. The authors also gratefully acknowledge John and Dottie Remondi and the MGH Research Scholars program for generous funding that enabled some of this work. Lucille Quénéhervé thanks the DHU2020, the DHU Oncogreffe and the SantéDige Foundation for their funding.
Funding: This work was supported in part by US National Institutes of Health grants NIH R01CA103769 (G.J.T.) and 1 R01 DK100569–01A1 (G.J.T.).
REFERENCES
- 1.Dulai GS, Guha S, Kahn KL, et al. Preoperative prevalence of Barrett’s esophagus in esophageal adenocarcinoma: a systematic review. Gastroenterology 2002;122(1):26–33. [DOI] [PubMed] [Google Scholar]
- 2.Soni A, Sampliner RE, Sonnenberg A. Screening for high-grade dysplasia in gastroesophageal reflux disease: is it cost-effective? The American journal of gastroenterology 2000;95(8):2086–93. [DOI] [PubMed] [Google Scholar]
- 3.Rubio-Tapia A, Hill ID, Kelly CP, et al. ACG clinical guidelines: diagnosis and management of celiac disease. The American journal of gastroenterology 2013;108(5):656–76. [DOI] [PMC free article] [PubMed] [Google Scholar]
- 4.Wolfsen HC, Sharma P, Wallace MB, et al. Safety and feasibility of volumetric laser endomicroscopy in patients with Barrett’s esophagus (with videos). Gastrointestinal endoscopy 2015;82(4):631–40. [DOI] [PubMed] [Google Scholar]
- 5.Ramirez FC, Akins R, Shaukat M. Screening of Barrett’s esophagus with string-capsule endoscopy: a prospective blinded study of 100 consecutive patients using histology as the criterion standard. Gastrointestinal endoscopy 2008;68(1):25–31. [DOI] [PubMed] [Google Scholar]
- 6.Seibel EJ, Carroll RE, Dominitz JA, et al. Tethered capsule endoscopy, a low-cost and high-performance alternative technology for the screening of esophageal cancer and Barrett’s esophagus. Biomedical Engineering, IEEE Transactions on 2008;55(3):1032–42. [DOI] [PubMed] [Google Scholar]
- 7.Gora MJ, Sauk JS, Carruth RW, et al. Tethered capsule endomicroscopy enables less invasive imaging of gastrointestinal tract microstructure. Nat Med 2013;19(2):238–40. doi: 10.1038/nm.3052 [DOI] [PMC free article] [PubMed] [Google Scholar]
- 8.Gora MJ, Sauk JS, Carruth RW, et al. Imaging the upper gastrointestinal tract in unsedated patients using tethered capsule endomicroscopy. Gastroenterology 2013;145(4):723–25. [DOI] [PMC free article] [PubMed] [Google Scholar]
- 9.Liang K, Traverso G, Lee H-C, et al. Ultrahigh speed en face OCT capsule for endoscopic imaging. Biomedical optics express 2015;6(4):1146–63. [DOI] [PMC free article] [PubMed] [Google Scholar]
- 10.Yun SH, Tearney GJ, Vakoc BJ, et al. Comprehensive volumetric optical microscopy in vivo. Nat Med 2006;12(12):1429–33. [DOI] [PMC free article] [PubMed] [Google Scholar]
- 11.Vakoc BJ, Shishko M, Yun SH, et al. Comprehensive esophageal microscopy by using optical frequency-domain imaging (with video). Gastrointestinal endoscopy 2007;65(6):898–905. [DOI] [PMC free article] [PubMed] [Google Scholar]
- 12.Suter MJ, Vakoc BJ, Yachimski PS, et al. Comprehensive microscopy of the esophagus in human patients with optical frequency domain imaging. Gastrointest Endosc 2008;68(4):745–53. doi: 10.1016/j.gie.2008.05.014 [DOI] [PMC free article] [PubMed] [Google Scholar]
- 13.Harris PA, Taylor R, Thielke R, et al. Research electronic data capture (REDCap)—a metadata-driven methodology and workflow process for providing translational research informatics support. Journal of biomedical informatics 2009;42(2):377–81. [DOI] [PMC free article] [PubMed] [Google Scholar]
- 14.Sauk J, Coron E, Kava L, et al. Interobserver agreement for the detection of Barrett’s esophagus with optical frequency domain imaging. Dig Dis Sci 2013;58(8):2261–5. doi: 10.1007/s10620-013-2625-x [DOI] [PMC free article] [PubMed] [Google Scholar]
- 15.Evans JA, Bouma BE, Bressner J, et al. Identifying intestinal metaplasia at the squamocolumnar junction by using optical coherence tomography. Gastrointest Endosc 2007;65(1):50–6. doi: 10.1016/j.gie.2006.04.027 [DOI] [PMC free article] [PubMed] [Google Scholar]
- 16.Khan B, Ramirez FC, Shaukat M, et al. String capsule endoscopy: a novel application for the preoperative identification of a small-bowel obscure GI bleeding source (with video). Gastrointestinal endoscopy 2011;73(2):403–05. [DOI] [PubMed] [Google Scholar]
- 17.Crosby WH, Army U, Kugler HW. Intraluminal biopsy of the small intestine. The American journal of digestive diseases 1957;2(5):236–41. [DOI] [PubMed] [Google Scholar]
- 18.Sergeev A, Gelikonov V, Gelikonov G, et al. In vivo endoscopic OCT imaging of precancer and cancer states of human mucosa. Opt Express 1997;1(13):432–40. [DOI] [PubMed] [Google Scholar]
- 19.Kobayashi K, Izatt JA, Kulkarni MD, et al. High-resolution cross-sectional imaging of the gastrointestinal tract using optical coherence tomography: preliminary results. Gastrointestinal endoscopy 1998;47(6):515–23. [DOI] [PubMed] [Google Scholar]
- 20.Li XD, Boppart SA, Van Dam J, et al. Optical coherence tomography: advanced technology for the endoscopic imaging of Barrett’s esophagus. Endoscopy 2000;32(12):921–30. doi: 10.1055/s-2000-9626 [DOI] [PubMed] [Google Scholar]
- 21.Sivak MV, Kobayashi K, Izatt JA, et al. High-resolution endoscopic imaging of the GI tract using optical coherence tomography. Gastrointestinal endoscopy 2000;51(4):474–79. [DOI] [PubMed] [Google Scholar]
- 22.Poneros JM, Brand S, Bouma BE, et al. Diagnosis of specialized intestinal metaplasia by optical coherence tomography. Gastroenterology 2001;120(1):7–12. [DOI] [PubMed] [Google Scholar]
- 23.Evans JA, Poneros JM, Bouma BE, et al. Optical coherence tomography to identify intramucosal carcinoma and high-grade dysplasia in Barrett’s esophagus. Clinical Gastroenterology and Hepatology 2006;4(1):38–43. [DOI] [PMC free article] [PubMed] [Google Scholar]
- 24.Chen Y, Aguirre AD, Hsiung PL, et al. Ultrahigh resolution optical coherence tomography of Barrett’s esophagus: preliminary descriptive clinical study correlating images with histology. Endoscopy 2007;39(7):599–605. doi: 10.1055/s-2007-966648 [DOI] [PubMed] [Google Scholar]
- 25.Zagaynova E, Gladkova N, Shakhova N, et al. Endoscopic OCT with forward-looking probe: clinical studies in urology and gastroenterology. J Biophotonics 2008;1(2):114–28. doi: 10.1002/jbio.200710017 [DOI] [PubMed] [Google Scholar]
- 26.Testoni PA, Mangiavillano B. Optical coherence tomography in detection of dysplasia and cancer of the gastrointestinal tract and bilio-pancreatic ductal system. World J Gastroenterol 2008;14(42):6444–52. [DOI] [PMC free article] [PubMed] [Google Scholar]
- 27.Adler D, Zhou C, Tsai T-H, et al. Three-dimensional optical coherence tomography of Barrett’s esophagus and buried glands beneath neo-squamous epithelium following radiofrequency ablation. Endoscopy 2009;41(9):773. [DOI] [PMC free article] [PubMed] [Google Scholar]
- 28.Masci E, Mangiavillano B, Barera G, et al. Optical coherence tomography in pediatric patients: a feasible technique for diagnosing celiac disease in children with villous atrophy. Digestive and Liver Disease 2009;41(9):639–43. [DOI] [PubMed] [Google Scholar]
- 29.Zhou C, Tsai TH, Lee HC, et al. Characterization of buried glands before and after radiofrequency ablation by using 3-dimensional optical coherence tomography (with videos). Gastrointestinal endoscopy 2012;76(1):32–40. doi: 10.1016/j.gie.2012.02.003 [DOI] [PMC free article] [PubMed] [Google Scholar]
- 30.Bredenoord A, Hebbard G. Technical aspects of clinical high-resolution manometry studies. Neurogastroenterology & Motility 2012;24(s1):5–10. [DOI] [PubMed] [Google Scholar]
- 31.Sadowski DC, Broenink L. High-resolution esophageal manometry: a time motion study. Can J Gastroenterol 2008;22(4):365–8. [DOI] [PMC free article] [PubMed] [Google Scholar]
- 32.Poneros J. Optical coherence tomography and the detection of dysplasia in Barrett’s esophagus. Gastrointest Endosc 2005;62(6):832–3. doi: 10.1016/j.gie.2005.07.027 [DOI] [PubMed] [Google Scholar]
- 33.Isenberg G, Sivak MV, Chak A, et al. Accuracy of endoscopic optical coherence tomography in the detection of dysplasia in Barrett’s esophagus: a prospective, double-blinded study. Gastrointestinal endoscopy 2005;62(6):825–31. [DOI] [PubMed] [Google Scholar]
- 34.Suter MJ, Gora MJ, Lauwers GY, et al. Esophageal-guided biopsy with volumetric laser endomicroscopy and laser cautery marking: a pilot clinical study. Gastrointestinal endoscopy 2014;79(6):886–96. [DOI] [PMC free article] [PubMed] [Google Scholar]
- 35.Ughi GJ, Gora MJ, Swager A-F, et al. Automated segmentation and characterization of esophageal wall in vivo by tethered capsule optical coherence tomography endomicroscopy. Biomedical Optics Express 2016;7(2):409–19. [DOI] [PMC free article] [PubMed] [Google Scholar]
Associated Data
This section collects any data citations, data availability statements, or supplementary materials included in this article.