

Abstract
Objective:
Mutations in phosphatidylinositol-4,5-bisphosphate 3-kinase (PI3K) complex have been associated with a broad spectrum of brain and organ overgrowth syndromes. For example, mutations in phosphatidylinositol-3-kinase regulatory subunit 2 (PIK3R2) have been identified in patients with megalencephaly-polymicrogyria-polydactyly-hydrocephalus (MPPH) syndrome, which includes brain overgrowth. To better understand the pathogenesis of PIK3R2 related mutations, we have developed and characterized a murine model.
Methods:
We generated a knock-in mouse model for the most common human PIK3R2 mutation, p.G373R (p.G367R in mice) using CRISPR/Cas9. The mouse phenotypes, including brain size, seizure activity, cortical lamination, cell proliferation/size/density, interneuron migration, and PI3K pathway activation were analyzed using standard methodologies. For patients with PIK3R2 mutations, clinical data (OFC and epilepsy) were retrospectively obtained from our clinical records (published/unpublished).
Results:
The PI3K-AKT pathway was hyperactivated in these mice, confirming the p.G367R mutation is an activating mutation in vivo. Similar to patients with PIK3R2 mutations, these mice have enlarged brains. We found cell size to be increased but not cell numbers. The embryonic brain showed mild defects in cortical lamination, although not observed in the mature brain. Furthermore, EEG recordings from mutant mice showed background slowing and rare seizures, again similar to our observations in patients.
Interpretation:
We have generated a PIK3R2 mouse model that exhibits megalencephaly and EEG changes, both of which overlap with human patients. Our data provide novel insight into the pathogenesis of the human disease caused by PIK3R2 p.G373R mutation. We anticipate this model will be valuable in testing therapeutic options for MPPH patients.
Introduction:
Megalencephaly-polymicrogyria-polydactyly-hydrocephalus (MPPH) and megalencephaly-capillary malformation (MCAP) syndromes are two closely related disorders mainly characterized by abnormal brain overgrowth (megalencephaly)1,2. The structural brain defects (megalencephaly, polymicrogyria, and hydrocephalus) in these disorders are often accompanied by the clinical phenotypes of intellectual disability and epilepsy3,4,5,6,7. Activating mutations in many components of the PI3K-AKT pathway (AKT3, CCND2, PIK3CA, PIK3R2), have been identified in the MPPH and MCAP syndrome8,9,10,11.
The PI3K-AKT pathway is well studied in cancer12,13 and is known to regulate various cellular functions, including growth, proliferation, motility, survival, and apoptosis14. PI3Ks are a family of kinases that catalyze the conversion of PIP2 (phosphatidylinositol 4,5-bisphosphate) to generate PIP3 (phosphatidylinositol 3,4,5-trisphosphate)15. Class IA PI3Ks are composed of a catalytic subunit (p110) and a regulatory subunit (p85), each of which has three isoforms encoded by PIK3CA, PIK3CB, PIK3CD (p110) and PIK3R1, PIK3R2, PIK3R3 (p85)16, respectively. Upon activation, PI3Ks convert PIP2 to PIP3, providing docking sites for PDK1 and mTORC2 (PDK2), which in turn phosphorylate AKT at Thr-308 and Ser-473, respectively, leading to full activation17,18,19,20. On the other hand, cytoplasmic PTEN negatively regulates the PI3K-AKT pathway through its phosphatase activity converting PIP3 back to PIP2; iit reverses the PI3K kinase function, leading to a reduction in PDK1 activation, thus antagonizing AKT activation21. Once activated, AKT can phosphorylate various cytoplasmic proteins12,13 including mTOR, which forms two multi-protein complexes, mTORC1 and mTORC2. Activated mTORC1 can promote protein synthesis leading to cell growth, through phosphorylation of the ribosomal protein S6 kinase (activation) and the translational inhibitor 4E-BP1 (inactivation)22. Activated AKT can also phosphorylate GSK-3β, leading to inactivation of GSK-3β-mediated phosphorylation/ubiquitination/proteasomal degradation of CCND2, which is required for cell cycle regulation23.
Pathogenic variants in multiple genes leading to PI3K-AKT pathway activation cause similar, yet distinct, phenotypes. PIK3CA (catalytic subunit of PI3K) pathogenic variants are linked to MCAP and other overgrowth syndromes, while PIK3R2 (regulatory subunit of PI3K), AKT3, and CCND2 variants are associated with MPPH and other related megalencephaly syndromes4,8,9,24,25. Several genetic mouse models in this pathway (e.g., Pik3ca and Akt3 mutant mice) were reported to recapitulate major human phenotypes (e.g., megalencephaly)26,27, however no PIK3R2 mouse models have been generated. Given that patients with PIK3R2 variants have unique features not shared with patients having a PIK3CA mutation1,2,4, having a PIK3R2 animal model will help resolve pathogenetic differences, thus providing new biologic insight into this important pathway for human disease.
To understand the pathogenesis of PIK3R2-asociated MPPH, we generated a Pik3r2 c.1099 G>A; p.G367R (human PIK3R2 c.1117G>A; p.G373R) knock-in (KI) mouse line. The p.G373R is the most common variant out of the three reported in patients with MPPH ( p.L401P and p.D557H are the other two)8,28,29,30,31. Here we report that Pik3r2 mutant mice exhibit brain overgrowth and have rare seizures, features overlapping with MPPH patients, the vast majority having a germline variant (heterozygote) or rarely somatic mosaicism30. Our mouse model provides new insight into the pathogenesis of MPPH and furthermore an opportunity to interrogate potential therapeutics for affected patients.
Materials and Methods
Mice
All experiments involving animals were approved by the Institutional Animal Care and Use Committee (IACUC) at the Brigham and Women’s Hospital/Harvard Medical School and Children’s Hospital of Philadelphia.
The PIK3R2 p.G367R knock-in (KI) mice were generated using CRISPR/CAS9 genome engineering32. To produce sgRNA, DNA oligos AAAAAAGCACCGACTCGGTGCCACTTTTTCAAGTTGATAACGGACTAGCCTTATTTTAACTTGCTATTTCTAGCTCTAAAACGCCTTTCCTGTATGCAGGGGCCCTATAGTGAGTCGTATTA and TAATACGACTCACTATAGGG were annealed and transcribed in vitro using a T7 High Yield RNA Synthesis Kit (NEB). Cas9 mRNA (100ng/μl from TriLink Biotechnologies), sgRNA (50 ng/μl), and a donor oligonucleotide carrying the point mutation (100ng/μl) (GAGGCTCCGGTTGGGGAGGTGTCCCACGATAATGACCCCACCCCTGCATACAGGAAAGGCaGGAACAACAAGTTGATCAAAGTCTTCCACCGGGATGGTCACTATGGCTTCTCAGAGCCC) were mixed and injected into C57BL/6 mouse zygotes (pronuclei stage). Three founders were generated from Harvard Medical School (HMS) Transgenic Core (two were used to generate the cohort for this study). The mutational status of the founder mice (Pik3r2KI/+) was confirmed by sequencing. Our sgRNA MIT specificity score is 70 (> 50 is recommended), and off-target sites (0-0-4-28-186 for 0-1-2-3-4 mismatches) are not present in the exon or in the same chromosome (chr. 8) (http://crispor.tefor.net). All mice used in this study were backcrossed (and maintained) to C57BL/6 for a minimum of 6 generations and screened for the single target site, thus any potential off-target sites have been genetically diluted.
Primers for PCR based genotyping included forward_TGGGGAGCAGGGTGGGGCAGATA (Scr_F) and reverse_CCCCAGCGCAGCACACACTTG (Scr_R). An AciI restriction enzyme site was destroyed during the production of the target mutation site (Fig 1A-B), permitting genotyping with a PCR amplified fragment.
Figure 1.

The generation of Pik3r2 KI mice (c.1099 G>A; p.G367R) using CRISPR/CAS9-mediated genome editing. A. A schematic of the oligo-targeting site on mouse chromosome 8, exon 9. Partial sequence of donor oligonucleotide with mutation (in red) shown together with wildtype (WT) sequence; the underlined sequences indicate sgRNA-targeting sequence; the bold and capitalized nucleotides indicate the AciI restriction enzyme site in WT, abrogated in the mutant, used for genotyping; the boxed nucleotides mark codons for amino acid glycine (G) and arginine (R) in the WT and mutant, respectively. The blue bars at each end indicate the primers (Scr_F and Scr_R respectively) binding sites for PCR genotyping. B. PCR genotyping of the engineered mice. PCR products (438bp) from genomic DNAs were digested with AciI. The expected sizes are as follow: wildtype = 245bp/100bp/93bp; mutant = 345bp/93bp. C. Sequencing result (partial) for one of the heterozygous founders. The mutated nucleotide is indicated with a red box and a lower case in the bottom row (note double peaks at the site: A, green; G, black). The upper row is the reference sequence from WT.
The Dlx5/6-Cre-IRES-EGFP mouse line (CD1 background) was a generous gift from Dr. K. Campbell33 and was maintained as described34.
Western Blot
Embryonic brain cortices (E15.5) were lysed in RIPA buffer (50mM Tris-Cl, pH 7.4, 150 mM NaCl, 0.1% Triton X-100, 0.5% sodium deoxycholic acid, 0.1% SDS, 1mM DTT, 1mM EDTA, protease inhibitors, Roche Biochem 11873580001; phosphatase inhibitor, Roche Biochem 4906845001) and sonicated (Branson digital sonifier 250, 10 cycles at 2 sec “On”/3 sec “Off”, 20% output). After centrifugation (13,000 x g, 10min, 4°C), cleared lysates were subjected to 4-15% SDS-PAGE gel (Bio-Rad, Mini-PROTEAN® Precast Gels) and blotted on PVDF membrane (Bio-Rad, Trans-Blot® Turbo™ Mini PVDF Transfer Packs) using Trans-Blot® Turbo™ Transfer System (Bio-Rad). The blot was probed with the indicated primary antibodies (see below) and appropriate secondary antibodies, and developed using an ECL kit (SuperSignal Chemiluminescent Substrate, Thermo Scientific). The image was scanned and quantified using the Bio-Rad ChemiDoc MP imaging system/Image Lab™ Software.
Immunofluorescence/immunohistochemistry/microscopy/image acquisition
Embryonic mouse brains collected for immunofluorescence (IF) were fixed overnight in 4% paraformaldehyde (PFA) at 4°C and processed for cryosectioning (16μm)35. Adult and P15 mice were cardio-perfused with PBS, then 4% PFA, and the brains were fixed in 4% PFA overnight (4°C). Brains collected for immunohistochemistry (IHC) or IF were processed for paraffin and cut at 6μm (Leica microtome [SRM 200 CW], Dana-Farber/Harvard Cancer Center Rodent Histopathology Core for embedding). or as free-floating sections (60μm, Leica vibratome [VT1000S]).
IF and IHC were performed as described with modifications35,36. For antigen retrieval (AR), sections were double boiled in antigen unmask solution (pH 6.0, Vector Laboratories) for 10-20min. Sections were blocked with R.T.U. Animal-Free Blocker® and Diluent (AFB, Vector Laboratories) for 30 min and incubated with primary antibodies (4°C, overnight). For IF, sections were next incubated in Alexa 488/594/647-conjugated (1:300, Invitrogen) secondary antibodies and 4’,6-diamidino-2-phenylindole (DAPI, Molecular Probes) (RT, 1h). For IHC, biotinylated secondary antibodies (1:1000) were applied (RT, 1h), followed by DAB labeling using an ABC kit (Vector Laboratories) and counterstained with hematoxylin.
IF images were captured on a Zeiss LSM 710 confocal microscope. Z-stacks from each section were generated by scanning at intervals of 1μm using filters of appropriate wavelengths at 20X magnifications. IHC images were acquired using a VS120 slide scanners with VS-ASW software and Olympus BX61VS microscope at Neurobiology Imaging Facility at HMS.
Antibodies
For Western blotting, AKT (Cell Signaling Technology, 4691, 1:2000), pAKT S437 (Cell Signaling Technology 4060, 1:2000), S6 (Cell Signaling Technology, 2217S, 1:5000), pS6 S235/236 (Cell Signaling Technology 2211S, 1:3000), pS6 S240/244 (Cell Signaling Technology 5364, 1:3000), and PARP (Cell Signaling Technology 9542, 1:1000); for IF, pS6 S235/236 (Cell Signaling Technology 2211S, 1:200), Reelin (Sigma-Aldrich, mab5364, 1:200), CUX1 (Santa Cruz, sc-13024, 1:250, AR), CTIP2 (Abcam, ab18465, 1:500, AR), TBR1 (Abcam, ab31940, 1:500, AR), NeuN (abcam, ab177487,1:300, AR), and GFAP (Dako, Z033429-2, 1:500); finally, for IHC (paraffin sections), somatostatin (Abcam, ab111912, 1:50, AR), parvalbumin (Millepore, MAB1572, 1:200, AR), calretinin (swant, 7697, 1:200, AR), and calbindin (swant, CB38, 1:10000, AR) antibodies were used.
EdU incorporation
Ethynyl deoxyuridine (EdU; Invitrogen) was administered intraperitoneally (50mg/kg)37 to pregnant mice (E14.5 or E16.5 for 1h, or E14.5 or E16.5 for 24h). Click-iT™ EdU cell proliferation kit (Invitrogen) was used to label EdU+ cells.
Image analysis
For cortical layer markers, the entire pallium was divided into 10 bins from the pial (bin 1) to ventricular surfaces (bin 10). A single counting bin (200μm wide for E17.5, 300μm wide for P15) or 3 adjacent bins (each 150μm wide separated by 100μm) (adult) were used. The same sections were also used for DAPI+ cell number quantification. For relative layer marker thickness, E17.5 cortical layer marker immunolabeling (CTIP2 and TBR1) were used (relative thickness was calculated as layer marker thickness/section thickness).
For EdU incorporation and pS6 immunolabeling, a 150μm counting bin was captured from the mid cortex at the coronal level of the habenular nucleus of the thalamus. EdU counting was done manually and pS6 fluorescence intensity was measured in Image J (mean intensity over the same area). For nuclear size analysis, 1000 random DAPI+ nuclei from a 384μm wide and full depth area of cerebral cortex were used for nuclear area measurements in Image J (sections taken from the somatosensory cortex; Bregma −2.10mm)38. For cell soma size analysis, 150 random NeuN+ cells in a 200μm wide and lower half depth of cerebral cortex (200μm) at the same level as DAPI+ counting were selected and their boundaries traced and used to measure cell area in Image J.
For interneuron subtype markers, coronal sections were taken from the levels between Bregma −2.10mm and −2.70mm38. The entire cortical length was measured by tracing the outline of the cortex from the dorsal midline above the corpus callosum to the ventral hypothalamus (Image J). Only the dorsal half of this cortical length was used to define the region of interest (ROI). The outline of the ROI was traced along the pial surface of the cortex, from the dorsal midline above the corpus callosum to the defined dorsal half of the cortex. Then a line perpendicular to the cortex was drawn toward the ventricle and finally along the boundary of the white matter back to the midline starting point, thus creating a closed field. The total numbers of SST+, PV+, CB+, and CR+ cells in this ROI were counted both manually and automatically (Thresholding method: Otsu), and then divided by the area of the ROI (in μm2). The results from manual counting were used in final calculations (The automatic counting produced similar results).
Electroencephalographic (EEG) recordings and analysis
Video-EEGs were performed on adult animals (6-9 months old) as previously described34,39. The animals were kept in a temperature-controlled environment with 12 hours day-night schedule and free access to food and water. The implant procedure, under isoflurane anesthesia with ketamine/xylazine pre-sedation, included the stereotaxic placement (all coordinates from Bregma) of 5 electrodes (bifrontal cortex (0.5mm Anterior–Posterior [A–P], 1.0mm medial–lateral [M–L]), bilateral parietal (−0.7 A-P, 3mm M-L), and a hippocampal depth (−2.2mm A–P, 2.0mm M–L and 1.2mm ventral), similar to the coordinates used previously34,39. Screws (#000 Small Parts Co.) were placed in the frontal and parietal cortical locations and a 0.005 in. stainless steel wire (125μm; A-M systems, Carlsborg, WA) was placed in the dorsal hippocampus. The screws and silver wire were attached to a six pin Delran pedestal (Plastics One, Roanoke, VA). Ground and reference electrodes were placed on either side of the midline directly behind the Lambda suture. After 48 hours recovery in their home cage the animals were transferred to the recording cage and recorded at 1000Hz sampling rate on a Stellate EEG recording system (Natus Technologies, Natick MA) for 72 hours. The EEG was viewed using on-line low-pass (100Hz) and high-pass (0.5Hz) filters with a 60Hz notch filter in place.
Four Pik3r2+/+, eight Pik3r2KI/+ and six Pik3r2KI/KI mice were recorded for 3 days each. To clean the EEG prior to performing Fast Fourier Transform (FFT) calculations, the EEG was analyzed by our in-house algorithm that performs EEG artifact detection. For EEG artifact rejection, the root mean squared amplitude and skew was calculated and a channel with a Root Mean Squared (RMS) > 200 or < 30 and skew > 0.4 was rejected outright. The RMS and skew cut offs were generated by measuring these values in normal EEG and then choosing thresholds that were only observed in artifact channels. After the channel-based analysis, an RMS z-score was generated for each 5 second segment and then the segment FFT was not analyzed if the z-score was > 3. This method allows a completely unbiased analysis of the background EEG40. For analysis, the video EEGs were reviewed for the presence of seizures. The frequency of the background EEG was quantified by measuring the entire EEG recording in 5 second segments. For each segment, FFT was calculated (MATLAB 2010b, Mathworks, Inc., Natick, MA) and the power in selected bandwidths (Delta 0.1-3.5Hz, Theta 3.5-8.5Hz, Alpha 8.5-13Hz, Beta 13-25Hz, and Gamma 25-100Hz) was determined using a TrapZ function in Matlab. The resultant power bands were normalized by dividing by total FFT power (0.5-200Hz). Light on and light off times were analyzed separately, followed by the entire recording. The percent power in each bin was averaged across genotype and compared using a two-way ANOVA (and Tukey post hock test) in Prism. Genotype and Frequency Band were the two main variables (interaction term was considered to be significant if < 0.05).
Human Studies
Clinical data, including occipitofrontal circumference (OFC) and epilepsy data, were collected by curating our published literature on MPPH families with the PIK3R2 (G373R) mutation1,8,30 or unpublished families enrolled at the Center for Integrative Brain Research (CIBR) at the Seattle Children’s Research Institute that recruits children with megalencephaly syndromes nationally and internationally under an institutional review board (IRB) approved protocol. Children with clinically and molecularly confirmed MPPH due to the recurrent PIK3R2 G373R mutation were included. The clinical diagnosis of MPPH was confirmed by review of brain MRI and clinical data. The molecular diagnosis was confirmed using a wide variety of targeted sequencing methods performed either clinically or on a research setting, but the presence of the PIK3R2 G373R mutation was verified in all individuals in this study by the investigators. Relevant clinical data regarding OFC and epilepsy were retrospectively obtained from clinical records. OFC assessments were standardized by converting measurements to age- and sex-specific Z-scores and descriptive statistics were used to summarize outcomes of interest using statistical mean.
Statistical analysis
All statistical analyses were done in GraphPad Prism v.8.3 software or SAS9.4 software. All histogram graphs are plotted as mean ± the standard error of the mean (SEM).
Results
The PIK3R2 p.G367R mutation in mice results in PI3K-AKT pathway activation, megalencephaly, and ventriculomegaly
The PIK3R2 p.G367R mutation (corresponding to the human PIK3R2 c.1117G>A; p.G373R mutation) was introduced into the mouse genome (knock-in, KI) using an sgRNA targeting a 19bp sequence adjacent to the mutation site (Fig 1A and Materials and Methods). Homologous directed repair (HDR)-mediated genome editing was performed by pronuclear co-injection of Cas9 mRNA, sgRNA, and single-stranded donor DNA oligo. The genetically engineered mice were confirmed by sequencing (founder mice) and genotyped by PCR followed by AciI restriction enzyme digestion (Fig 1B-C).
Both heterozygous and homozygous KI mice, Pik3r2KI/+ and Pik3r2KI/KI respectively, survived into adulthood. Given that patients with the PIK3R2 p.G373R mutation exhibit megalencephaly, the weight and dimensions of adult Pik3r2 KI mouse brains were compared between genotypes. Overall, the brains of Pik3r2KI/KI mice weighed significantly more than those of control mice (Fig 2A). To determine if the increased brain weight reflected overall body weight differences or was independent of body weight, we selected mice from 9-12 month of age and analyzed relative brain weight over body weight41. While no significant difference in body weight was detected between genotypes (Fig 2B), Pik3r2KI/KI mice showed significantly higher ratio of brain weight to body weight, indicating the increased brain weight was independent of body weight (Fig 2C). We also considered the brain weight and the brain to body weight ratio, with respect to gender. However, gender had no effect on those indices (Fig 2A-C).
Figure 2.

PIK3R2 KI mice have megalencephaly with ventriculomegaly. A-C. Measurements of the adult brain weight (A), body weight (B) and the ratio of the brain to body weight (C). (n(+/+) = 11 [male: 6; female: 5]; n(KI/+) = 11 [male: 5; female: 6]; n(KI/KI) = 9 [male: 4; female: 5]. For brain weight total [+/+, KI/+, KI/KI]: 0.46 ± 0.01g, 0.51 ± 0.02g, 0.55 ± 0.02g, ****p < 0.0001; male [+/+, KI/+, KI/KI]: 0.46 ± 0.01g, 0.51 ± 0.02g, 0.56 ± 0.01g, **p(+/+ vs KI/+) = 0.0065, **p(+/+ vs KI/KI) = 0.0048, *p = 0.0159; female [+/+, KI/+, KI/KI]: 0.46 ± 0.01g, 0.51 ± 0.02g, 0.55 ± 0.02g, **p(+/+ vs KI/+) = 0.0043, **p(+/+ vs KI/KI) = 0.0079, *p = 0.0108; For brain weight/body weight ratio total [+/+, KI/+, KI/KI]: 1.54 ± 0.23%, 1.67 ± 0.24%, 0.91 ± 0.22%, **p = 0.0091; male [+/+, KI/+, KI/KI]: 1.40 ± 0.11%, 1.46 ± 0.12%, 1.67 ± 0.20%, *p = 0.0381; female [+/+, KI/+, KI/KI]: 1.84 ± 0.07%, 1.86 ± 0.16%, 1.99 ± 0.07%, **p = 0.0079. Mann-Whitney test). D. Representative lateral (top row) and dorsal (bottom row) views of adult Pik3r2+/+, Pik3r2KI/+ and Pik3r2KI/KI brains. Equal size boxes (dashed white lines) are used for comparison between genotypes. D′. Representative images of the coronal vibratome sections taken from three different levels along the anterior (“A”) to posterior (“P”) axis. Boxed image: an example of the width and height measurement in 2E; yellow lines marked as “L”, “M”, “R”: three positions the cortex thickness was measured in 2F; red area with a yellow frame: ventricle area measured in 2G. Scale bar = 5mm. E-F. Quantification of the adult brain size (E) and cortical thickness (F). The images from the two different levels (‘anterior’ labeled as “A” is from the first row and ‘posterior’ labeled as “P” is from the third row in figure 2D′) were used for the measurement (For adult brain size: n = 3. Anterior: height (+/+) = 6091.2 ± 93.2μm, height (KI/KI) = 6580.9 ± 106.7μm, *p = 0.0190. Posterior: height (+/+) = 6396.02 ± 136.6μm, height (KI/KI) = 7195.2 ± 83.4μm, *p = 0.0211. Kruskal-Wallis test, Dunn’s multiple comparisons test [post hoc]. For adult cortex thickness: n = 6 from 3 mice. Anterior: Pik3r2+/+, 1274.71 ± 80.33μm; Pik3r2KI/KI, 1422.40 ± 111.01μm; *p = 0.0121. Posterior: Pik3r2+/+, 785.96 ± 81.47μm; Pik3r2KI/KI, 942.11 ± 89.98μm; *p = 0.0374. Nested one-way ANOVA, Tukey test [post hoc]). G. Measurement of the adult ventricles. (n = 3. Pik3r2+/+, 0.67 ± 0.13mm2; Pik3r2KI/+, 0.9067 ± 0.15mm2; Pik3r2KI/KI, 1.23 ± 0.10mm2; **p = 0.0044; *p = 0.0241. Nested one-way ANOVA, Tukey test [post hoc]). H-J. Measurements of the embryonic (E15.5 and E17.5) brain size (DV: measurement from the ventral midline to the dorsal apex of the coronal section through the anterior commissure. LL: from the lateral edge of one hemisphere to the lateral edge of the opposite hemisphere in the same sections used for the DV measurement).
To analyze the brain size phenotype, we compared the height and width of the brains and found they were increased in Pik3r2KI/KI mice. For quantification of these brain dimensions, coronal sections of the forebrain at the multiple levels along the anterior-posterior axis were used (n = 3, sections from 3 brains for each genotype). The height of the forebrain (along the dorsal-ventral axis) was significantly increased in Pik3r2KI/KI mice when compared to that in Pik3r2+/+ mice at two different anterior to posterior coronal levels (Fig 2D-E). The width of the forebrain (from one lateral side to the other) was also bigger in Pik3r2KI/KI mice, although the measurements did not reach statistical significance (Fig 2D′, 2E).
Next, we measured cortical thickness at the same anterior-posterior levels used for the height analyses, and detected significant expansion in Pik3r2KI/KI mice (Fig 2D′, 2F). In these same sections we found that the ventricles were also enlarged in the Pik3r2KI/KI adult mice, recapitulating ventriculomegaly in human patients (Fig 2D′, 2G, see outlined ventricles marked with red areas). Embryonic brain sizes at E15.5 and 17.5 were also compared for height (dorsal to ventral [DV]) and width (lateral to lateral [LL]). No significant differences were detected between genotypes (Fig 2H-J).
To assess the PI3K-AKT pathway activity in the Pik3r2 KI mice, we analyzed the level of pAKT and pS6, markers of pathway activation. By Western blot using E15.5 brains, phosphorylation of AKT at serine 437 (pAKT_S437), and S6 at serines 235/236 (pS6_S235/236) and 240/244 (pS6_S240/244) were all significantly increased in Pik3r2KI/KI mice when compared to controls, while total AKT and S6 levels were not changed (Fig 3A-G). Similarly, immunofluorescence staining of cortical sections (E15.5) showed pS6_235/236 labeling more intensely in Pik3r2KI/KI mice when compared to Pik3r2+/+, especially in the intermediate zone (IZ) and cortical plate (CP). Further indicating hyperactivation of the PI3K-AKT pathway during embryogenesis (Fig 3H-L)
Figure 3.
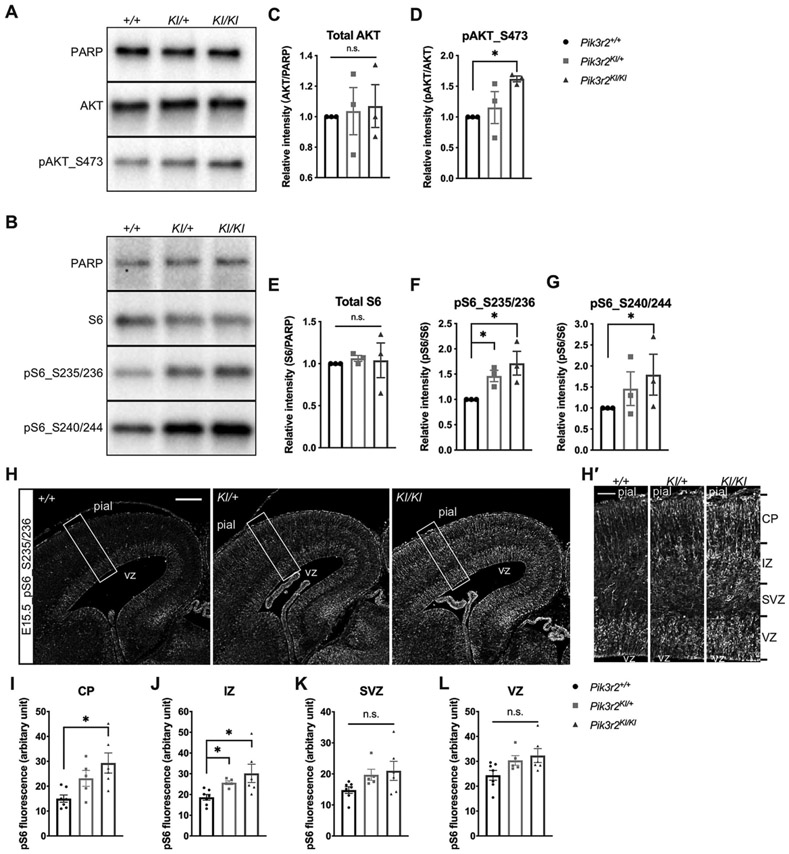
PI3K-AKT-S6 pathway constitutively activated in Pik3r2KI/KI mice. A-B. Representative western blot analyses of phospho-AKT (pAKT_S473) (A) and phospho-S6 (pS6_S235/236, S240/244) (B) protein levels in each genotype (E15.5, cortical lysate). Expression of total AKT and S6, compared to PARP, show no significant changes between genotypes; while increased phosphorylation is observed for pAKT_S473, pS6_S235/236 and pS6_S240/244 in Pik3r2KI/KI mice. C-G. Quantification of the Western blot analyses. Total AKT and S6 expression levels were normalized with the expression level of PARP and the protein levels from Pik3r2+/+; the levels of pAKT_S473, pS6_S235/236 and pS6_S240/244 were normalized with their total protein level and the protein levels from Pik3r2+/+. One-tailed Mann-Whitney test reveals statistically significant increases in Pik3r2KI/KI when compared to Pik3r2+/+. (n = 3. all values of Pik3r2+/+ were set as the stander = 1, pAKT_S473KI/KI = 1.62 ± 0.08; *p = 0.0500; pS6_S235/236KI/+ = 1.26 ± 0.20, *p = 0.0500; pS6_S235/236KI/KI = 1.72 ± 0.41, *p = 0.0500; pS6_S240/244KI/KI = 1.79 ± 0.08, *p = 0.0500). H. Representative cortical images of pS6-immunofluorescent labeling (E15.5). White boxes indicate the areas where the magnified images in H’ were taken from. Pial: pial surface; VZ, ventricular zone; SVZ: subventricular zone. Scale bar = 200μm. H′. Magnified images of the boxed areas in H. Sections from Pik3r2KI/KI brains show stronger pS6-positivity in cells, especially in the CP and IZ area. Pik3r2KI/+ shows an intermediate level of pS6 labeling. Scale bar = 50μm. I-L. Quantification of pS6 immunostaining. The fluorescence intensity of each image was measured in VZ, SVZ, IZ and CP using Image J and compared between each genotype (n = 7, 5, 6 for Pik3r2+/+, Pik3r2KI/+, and Pik3r2KI/KI respectively. CP: Pik3r2+/+, 15.0 ± 3.9; Pik3r2KI/KI, 29.3 ± 9.9, *p = 0.0147; IZ: Pik3r2+/+, 18.7 ± 3.7; Pik3r2KI/+, 25.7 ± 2.0, Pik3r2KI/KI, 30.2 ± 10.8, *p = 0.0268 between Pik3r2+/+ and Pik3r2KI/+; *p = 0.0140 between Pik3r2+/+ and Pik3r2KI/KI; Kruskal-Wallis test, Dunn’s multiple comparisons test [post hoc]).
Together, these data indicate that we have successfully generated Pik3r2KI/KI mutant mice, and both heterozygous and homozygous mice are able to survive into adulthood and breed normally. As predicted, the p.G367R mutation in mice activates the PI3K-AKT pathway in vivo and results in a megalencephaly with ventriculomegaly (enlarged brain and ventricles) phenotype, most pronounced in the homozygous mutant mice.
PIK3R2 p.G367R mutant mice have a mild embryonic cortical lamination defect
Patients with PI3K-AKT pathway activating mutations are reported to have megalencephaly and disordered cortical lamination, as do several mouse models5,26. To evaluate cortical lamination in Pik3r2KI/KI mice, we assayed a series of lamina specific markers on sections from embryonic, postnatal, and adult mouse brains. Specifically, immunofluorescence was performed using antibodies to Reelin (marginal zone for E17.5), CUX1 (layer II-IV for adult, upper layers at E17.5), TBR1 and CTIP2 (layer V-VI for adults, deep layer at E17.5). No significant differences were found in the number of Reelin+ cells/per area or their distribution in the marginal zone (Fig 4A-B). Likewise, the distribution of CUX1+ cells in the embryonic (E17.5) and adult brains were similar in the Pik3r2KI/KI mice and controls. In contrast, the distributions of TBR1+ and CTIP2+ cells (deep layer neurons) at E17.5 were abnormally shifted to deeper cortical layers in Pik3r2KI/KI mice and this was particularly true for TBR1. This phenotype, however, was not observed in the adult brains (Fig 4C-D).
Figure 4.

PIK3R2 p.G367R mutant mice display abnormalities in deep cortical layers. A. Coronal section images of Pik3r2+/+ and Pik3r2KI/KI forebrains with Reelin immunofluorescence (E17.5). The area between the two arrowheads was used for counting of Reelin+ cells. Scale bar = 500μm. Insert shows higher magnification of Reelin+ cells (Scale bar = 50μm). B. Quantification of the Reelin+ cell numbers (per 100μm cortex). No significant differences were observed between genotypes (n = 5; Mann-Whitney test). C-D. Coronal sections from Pik3r2+/+ and Pik3r2KI/KI embryonic (C, E17.5) and adult (D) brains immunolabeled for CUX1, CTIP2 and TBR1. C′. Lower magnification images of CTIP2 (red) and TBR1(green) immunostaining (E17.5). White boxes: the positions of the sections selected for higher magnification images; white dashed lines: pial and ventricular surfaces; numbers 1-10: ten equivalent bins used for counting ; bin 1 was located at the pial surface (E17.5 and adult) and bin 10 at the ventricular surface (E17.5) or at the junction of the cortex with the white matter (adult). Cortical layers in the adult section have the following approximate correlation with bins: bin 1-layer 1, bins 2 and 3-layers 2/3, bins 4 and 5-layer 4, bins 6 to 8-layer 5, and bins 9 and 10-layer 6. WM: white matter; vz: ventricular zone. Scale bars = 50μm (500μm for C′). E-J. Quantification of the CUX1+, CTIP2+, and TBR1+ cell numbers in each bin for E17.5 brains (E-G), and adult brains (H-J). The number of cells in each bin is plotted for bin 1 through bin 10 (CUX1+: E17.5: n(+/+) = 6, n(KI/KI) = 8; Adult: n = 4. CTIP2+: E17.5: n(+/+) = 7, n(KI/KI) = 9; Adult: n = 3. TBR1+: E17.5: n(+/+) = 7, n(KI/KI) = 9; Adult: n(+/+) = 4, n(KI/KI) = 3. CTIP2(E17.5, Bin 3): Pik3r2+/+, 113.1 ± 41.8; Pik3r2KI/KI, 92.0 ± 37.8,*p = 0.0182; TBR1(E17.5, Bin 3): Pik3r2+/+, 50.4 ± 10.4; Pik3r2KI/KI, 42.6 ± 18.0, *p = 0.0178; TBR1(E17.5, Bin 5): Pik3r2+/+, 97.1 ± 34.6%; Pik3r2KI/KI, 136.1 ± 39.0, *p = 0.0207; unpaired multiple t-test, Holm-Sidak multiple comparisons test). K-L. Quantification of the CTIP2+ (K) or TBR1+ (L) cell numbers in each bin (For CTIP2, n(+/+) = 4, n(KI/KI) = 2; bin 9: Pik3r2+/+, 42.95 ± 6.38 cells; Pik3r2KI/KI, 34.00 ± 4.95 cells, *p = 0.0261. For TBR1, n(+/+) = 3, n(KI/KI) = 4; No significant changes. Unpaired multiple t-tests, Holm-Sidak multiple comparisons test). M-N. Quantification of the relative layer marker thickness at E17.5. No significant differences in thickness of the CTIP2+ and TBR1+ cell layers were detected between Pik3r2KI/KI and Pik3r2+/+ brains (For CTIP2, n(+/+) = 7, n(KI/KI) = 9; p = 0.1829. For TBR1, n(+/+) = 6, n(KI/KI) = 9; p = 0.3884. Mann-Whitney test). The quantification was done with the same sections used in Fig 4C, C’, and E-G.
To quantify these observations, the entire pallial wall (from the pia surface to ventricular surface) was divided into ten equal bins (see Methods). In embryonic Pik3r2KI/KI brains (E17.5), significantly more TBR1+ cells were found in bin 5, while fewer cells were present in bin 3 when compared to the Pik3r2+/+. CTIP2+ cells trended similar to TBR1+ cells but only reached significance in bin 3 (Fig 4F-G). In contrast, the distribution of CUX1+ cells was similar between genotypes (Fig 4E). In adults, the distribution of all laminar markers was comparable between genotypes (Fig 4H-J). We also examined CTIP2+ and TBR1+ cell distributions in the postnatal brains (P15). CTIP2+ cells in bin 9 were reduced in Pik3r2KI/KI brains (Fig 4K), while TBR1+ cells did not show significant difference between genotypes (Fig 4L). When we measured the relative thickness of each layer marker at E17.5, no significant difference between genotypes was found (Fig 4M-N). Together, these results suggest that the early development (distribution) of deeper layer neurons (CTIP2+ and TBR1+) is disrupted, whereas that of the upper layer neurons (CUX1+) is unaffected in the embryonic cortices (E17.5). The embryonic cortical lamination defects appear to largely resolve in the postnatal period where only minor alterations in the distribution of CTIP2+ cells were noted (P15). Furthermore, by adulthood, no differences in laminar marker distributions were observed.
Patients with PIK3CA activating mutations along with a Pik3ca mutant mouse model have cortical dysplasia with ectopic neurons in the white matter26. Both of these pathologies are believed to arise from a migration defect. Thus, to establish if the Pik3r2 mutant mice might have ectopic neurons in the white matter and increased numbers of layer I neurons (a feature of some cortical dysplasia), the existence of subcortical white matter and cortical layer I neurons was evaluated in Pik3r2KI/KI mice. For this, adult mouse brain sections were labeled with NeuN (Rbfox3), a marker of mature neurons42. Only rare NeuN+ neurons were detected in the ectopic region of Pik3r2KI/KI mouse brains, and their distribution was similar to Pik3r2+/+ mouse brains. Thus, we conclude there is no apparent cortical or white matter dysplasia phenotype in the Pik3r2KI/KI mouse brain (data not shown).
Cortical neuron density is decreased and cell size increased in the Pik3r2KI/KI mice
Brain enlargement (megalencephaly) often reflects abnormal cell proliferation, cell cycle dysregulation, or both43. We postulated that a defect in cell proliferation or cell cycle dysregulation might exist in Pik3r2KI/KI mouse brains, underlying the basis of their megalencephaly. To test this hypothesis, we performed EdU incorporation experiments at several embryonic ages. Exposure of E14.5 or E16.5 embryos to EdU for one hour revealed normal cerebral cortical progenitor proliferation in Pik3r2KI/KI mice (Fig 5A-D). Next, we calculated a cell cycle index by 24 hour-labeling of EdU (injected at E14.5 or E16.5) together with Ki67 immunostaining. The percentages of the cells that exit the cell cycle (EdU+ Ki67−/EdU+) are similar in both Pik3r2KI/KI and Pik3r2+/+ mice, without statistical difference (Fig 5E-H). Together these data suggest that megalencephaly in mutant mice is not caused by significant changes in cell proliferation or cell cycle exit rate.
Figure 5.

G367R mutation affects the cell density and size but not the proliferation in the neocortex. A-B. Coronal section images of the Pik3r2+/+ and Pik3r2KI/KI embryonic cortices injected with EdU at E14.5 (A) or E16.5 (B) and immunolabeled for EdU (harvested 1 hour after injection). C-D. Quantification of the cell proliferation rate (EdU+ cell number/DAPI+ cell number) using images as shown in figure A and B. (E14.5: Pik3r2+/+, 23.79 ± 1.48%, n = 4; Pik3r2KI/KI, 24.92 ± 1.97%, n = 5; p = 0.2619; E16.5: Pik3r2+/+, 14.98 ± 2.55%; Pik3r2KI/KI, 13.38 ± 2.26%; n = 4, p = 0.3429, Mann-Whitney test). E-F. Coronal section images of the Pik3r2+/+ and Pik3r2KI/KI embryonic cortex injected with EdU at E14.5 (E) or E16.5 (F) and immunolabeled for EdU (green) and Ki67 (red) (harvested 24 hours after injection). G-H. Quantification of the cell cycle exit rate (EdU+Ki67− cell number/EdU+ cell number) using images as shown in E and F (E14.5-15.5: Pik3r2+/+, 45.35 ± 3.52%; Pik3r2KI/KI, 43.97 ± 3.56%; n = 4, p = 0.7714; E16.5-17.5: Pik3r2+/+, 55.71 ± 5.57%; Pik3r2KI/KI, 53.26 ± 7.57%; n = 3, p = 0.7000; Mann-Whitney test). I. Representative images of the adult free-floating sections stained with NeuN and DAPI to measure the cell soma size, nuclei size, and cell density. Images in the bottom row are the magnified images of each boxed area (yellow) of the corresponding lower magnification images as indicated. Arrow heads mark the representative cells in each genotype. J-K. Quantification of the nuclear size (J) and the soma size (K) using DAPI and NeuN staining as shown in I. The colored dashed lines, blue for the Pik3r2+/+ and red for the Pik3r2KI/KI, are the average size for each genotype. Both nuclear and cell soma size were increased in Pik3r2KI/KI brains. Notably, the Pik3r2KI/KI brains show a greater percentage of larger nuclei (n = 1000 nuclei from three brains, n = 150 NeuN+ cells from 3 brains; For DAPI+ nucleus size: Pik3r2+/+, 51.3 ± 26.6μm2; Pik3r2KI/KI, 64.5 ± 35.1μm2; ****p < 0.0001; For NeuN+ soma size: Pik3r2+/+, 94.6 ± 28.6μm2; Pik3r2KI/KI, 111.3 ± 38.9μm2; ****p < 0.0001; Mann-Whitney test). L-M. Quantification of cell density using DAPI (L) staining, and hematoxylin (M) staining. DAPI+ cell numbers were counted in a 150μm width of cortex (3 sections for each brain, 4 brains for Pik3r2+/+ and 3 brains for Pik3r2KI/KI were used; Pik3r2+/+, 8.8 × 10⁻³ ± 1.2 × 10⁻³ cells/μm2; Pik3r2KI/KI, 6.3 × 10⁻³ ± 0.6 × 10⁻³ cells/μm2; *p = 0.0238; unpaired t-test). Total hematoxylin+ cell numbers were counted in the entire cortical area (n = 8, p = 0.6806; sections from 4 mice per genotype, unpaired t-test). The corresponding cortical area in each case was measured in Image J. Scale bars = 50μm (10μm in the magnified image).
Since the proliferation indices were normal in the Pik3r2KI/KI brains, we next asked whether the cell size might be larger, as the PI3K-AKT pathway is also known to influence cell size12,44. The average nuclear size was established by measuring the area of DAPI labeling, while cell soma size by the area of NeuN labeling (Fig 5I-K)26,45. The average nuclear size of the cortical cells from Pik3r2KI/KI mice was significantly increased when compared to Pik3r2+/+ mice (Fig 5I-J). We also noted that the increased nuclear size reflected a higher proportion of larger (pyramidal) cortical cells than the smaller cortical cells (Fig 5J). The nuclear size of cortical cells from Pik3r2KI/+ mice was intermediate between Pik3r2+/+ and Pik3r2KI/KI cells (data not shown). Furthermore, the average cell soma size for cortical neurons was also greater in Pik3r2KI/KI mice (Fig 5K).
Interestingly, the density of DAPI+ cells was significantly less in Pik3r2KI/KI mice, while the total cell number in the entire cortex stained with hematoxylin was similar to controls (Fig 5L-M). These data indicate that the cell population density (cell number/μm2) is decreased in Pik3r2KI/KI cortex without changes in total number of cells. Since the average cell size is increased and the total number of cells is unchanged, we conclude the enlarged brain results from a defect in cell size and not a proliferation defect, also consistent with our proliferation studies.
Finally, an additional explanation for the increased brain size could be the contribution of glia, specifically the abnormal increase in astrocyte numbers or size. Mutations in the tuberous sclerosis complex (TSC) are known to activate mTOR signaling and result in an astrocytosis (abnormal increase in the number of astrocytes)46,47,48. GFAP labeling in Pik3r2KI/KI mice showed no evidence of an astrocytosis (data not shown), suggesting any brain enlargement was not due to an astrocyte phenotype.
Together, these data indicate that the megalencephaly of the Pik3r2KI/KI mice is attributable, at least in part, to an enlarged average neuron size (both nucleus and soma), but not a change in the number of neurons or astrocytes.
Pik3r2KI/KI mice have rare seizures and background EEG abnormalities
Overall, the EEG background of the Pik3r2KI/KI and Pik3r2KI/+ mice appeared similar to wildtype except for consistently more slowing in the frontal electrodes during both dark (night/awake) and light (day/asleep) cycles in the Pik3r2KI/KI mice (Fig 6A). The EEGs were reviewed for the presence of seizures or other intermittent events. Only one Pik3r2KI/KI mouse was observed to have 2 clusters of seizures separated by 22 hours. Both seizure clusters occurred during the first part of the light cycle (day/asleep) (over all incidence of seizures in Pik3r2KI/KI mice being 16.7%). The seizures were identical both electrophysiologically and behaviorally. In this mouse, there began to be infrequent high amplitude sharp and slow wave discharges that occurred sporadically. Prior to a seizure, the sharps occurred more regularly but without fixed periodicity. The seizure began with a fast run of spikes in all leads that then had rhythmic spiking lasting for ~20 seconds before the entire recording attenuated (Fig 6B). Behaviorally, the mouse’s tail stiffened and raised, back hunched, and the animal moved backwards with forepaw movements during the electrographic portion of the seizure. There was no visible movement or change in the animal during the proceeding large spikes. As there was only a single cluster of seizures recorded, we next quantified the EEG background to look for differences between genotypes. The entire EEG recording was analyzed after automated rejection of periods of obvious artifact using an amplitude and kurtosis-based measure. Analysis of EEG frequency data shows mild differences between the Pik3r2+/+ and Pik3r2KI/KI animals, primarily with less slowing in the parietal leads (decreased delta activity) (Fig 6C). The frontal electrodes were slower (contained more delta) in the heterozygous mutant mice when compared to control and homozygous mutant mice (Fig 6C Day Time and top two tracings in Fig 6A are examples of frontal slowing). There was a concomitant loss of theta and alpha activity in the frontal leads as well, although this did not reach statistical significance. In contrast, the decreased delta activity was noted in the hippocampus, again more prominently in Pik3r2KI/+ animals than in Pik3r2KI/KI that also showed increased but not statistically significant theta and alpha activity (Fig 6C Day Time). The parietal lobe, similar to the hippocampus, showed a statistically significant decrease in delta activity between Pik3r2+/+ and Pik3r2KI/KI animals, while that of Pik3r2KI/+ animals was not found to be significant. Differences in the night time EEG were similar, although less obvious. We noted the changes in the Pik3r2KI/+ animals were generally greater than the Pik3r2KI/KI animals, however both were in the same overall direction of change (Fig 6C). Together, the EEG recordings show subtle changes, predominately in the parietal and hippocampal electrodes with no differences in the frontal electrodes, and rare seizures in mutant mice.
Figure 6.
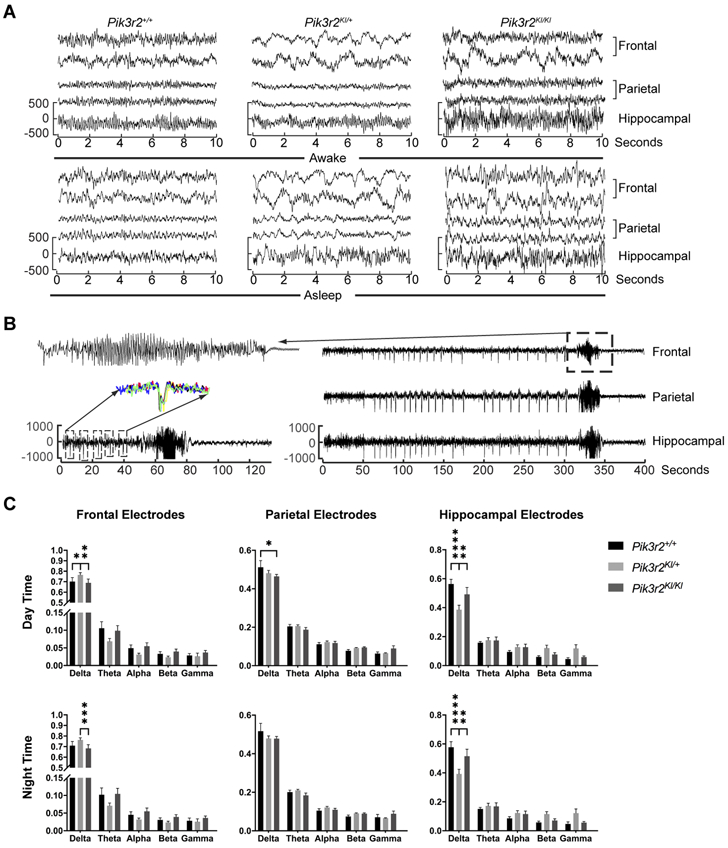
Electroencephalogram recording from the Pik3r2KI/KI mice. A. Awake (upper) and asleep (lower) tracings from Pik3r2+/+, Pik3r2KI/+, and Pik3r2KI/KI adult mice are presented. Two frontal, two parietal and one hippocampal electrode is shown. B. Rare seizures in a Pik3r2KI/KI mouse were recorded with frequent large amplitude spikes that preceded the seizure. Slow time scale recording (on right - 1 frontal, parietal and hippocampal electrodes are shown) with box highlighting seizure which is expanded on upper left. Lower left tracing expands the time scale to show only the 60 seconds prior to the seizure, the seizure, and 60 seconds post ictal EEG. Each box expands the 5 seconds around the high amplitude spike and highlights the consistent morphology by overlapping the individual spikes (left middle). C. Quantification of the frequency content of the EEG is presented in each recorded region (Frontal-upper, Parietal-middle, Hippocampal-bottom) and during the day (left) and night (right). Percent of total power at each frequency band (Delta: 0.1-4Hz; Theta: 4-8Hz; Alpha: 8-13Hz; Beta:13-25Hz; and Gamma: 25-70Hz) is quantified. Frontal and parietal electrodes: n = 8, 14, 12 for Pik3r2+/+, Pik3r2KI/+, and Pik3r2KI/KI respectively; Hippocampal electrodes: n = 4, 8, 6 for Pik3r2+/+, Pik3r2KI/+, and Pik3r2KI/KI respectively. Ordinary two-way ANOVA was used to determine the significance and Tukey’s multiple comparisons test was used for post hoc analyses (All differences happed in the delta wave. Frontal day time: Pik3r2+/+, 0.70 ± 0.11; Pik3r2KI/+, 0.77 ± 0.08; Pik3r2KI/KI, 0.69 ± 0.12; *p = 0.0202 between Pik3r2+/+ and Pik3r2KI/+; **p = 0.0012 between Pik3r2KI/+ and Pik3r2KI/KI. Parietal day time: Pik3r2+/+, 0.51 ± 0.10; Pik3r2KI/KI, 0.46 ± 0.03; *p = 0.0146. Hippocampal day time, Pik3r2+/+, 0.56 ± 0.06; Pik3r2KI/+, 0.39 ± 0.09; Pik3r2KI/KI, 0.49 ± 0.12; ****p < 0.0001 between Pik3r2+/+ and Pik3r2KI/+; **p = 0.0041 between Pik3r2KI/+ and Pik3r2KI/KI. Frontal night time: Pik3r2+/+, 0.71 ± 0.11; Pik3r2KI/+, 0.76 ± 0.08; Pik3r2KI/KI, 0.68 ± 0.13, ***p = 0.0006 between Pik3r2KI/+ and Pik3r2KI/KI. Hippocampal night time: Pik3r2+/+, 0.58 ± 0.08; Pik3r2KI/+, 0.39 ± 0.09; Pik3r2KI/KI, 0.52 ± 0.12; ****p < 0.0001 between Pik3r2+/+ and Pik3r2KI/+; **p = 0.0012 between Pik3r2KI/+ and Pik3r2KI/KI).
Interneuron migration and populations are normal in Pik3r2KI/KI mice
Cortical interneuron defects have been associated with epilepsy in animal models and their association have been proposed for many human disorders49,50,51. To assess the status of interneurons in Pik3r2KI/KI mice, we first evaluated interneuron migration. From their origin in the ganglionic eminence to the cerebral cortex, interneurons take a circuitous migratory path which we have followed by genetically labeling these neurons with eGFP using the Dlx5/6-cre-IRES-EGFP (Dlx5/6-CIE) mouse line. When this line is crossed into the Pik3r2 KI line, we observed normal migration of eGFP labeled interneurons in both the superficial and deep streams (in the marginal zone and subventricular/intermediate zone, respectively), to the cortical plate at E13.5 (Fig 7A-B). The tangential migration was quantified by comparing the percentage of the interneurons (eGFP+) detected in each cortical level over those detected in the entire cortical length along the migration route between genotypes (cortical wall was divided into five bins along the migration route from the pallial-subpallial boundary, close to bin 1, to the apex of the cortex, close to bin 5), and our quantification data show no significant difference between genotypes (Fig 7A-B).
Figure 7.
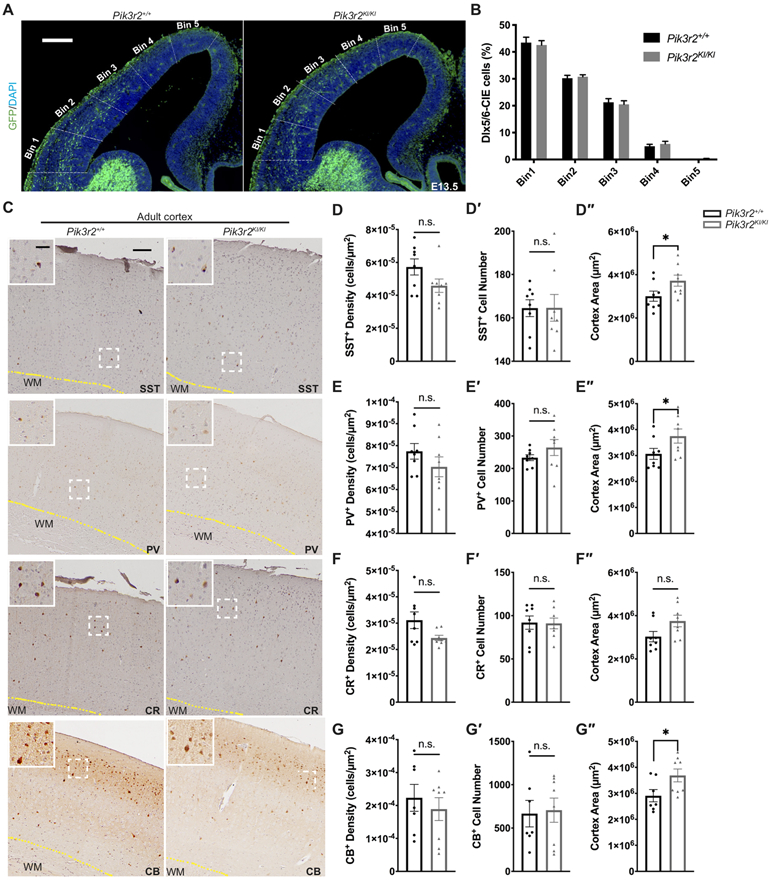
Cortical interneuron subtype generation and migration are normal in the Pik3r2KI/KI brains. A. Coronal section images of Pik3r2+/+ and Pik3r2KI/KI mice crossed to the Dlx5/6-CIE line, immunolabeled for eGFP as a marker of interneurons. Scale bar = 200μm. B. Quantification of the interneuron migration. The entire cortical wall was segmented into five equivalent bins as shown in A. The percentages of interneurons detected in each bin over all five bins were quantified for each genotype. Unpaired multiple t-tests, corrected for multiple comparisons with the Holm-Sidak method, revealed no significant difference between the genotypes (n = 4). C. Coronal section images of the adult Pik3r2+/+ and Pik3r2KI/KI brains immunolabeled for interneuron markers, SST, PV, CR, and CB (DAB staining). Images in the white box at the top left corner of each image show the magnified images of the areas in the white dashed box. Scale bars = 100μm (30μm for the magnified images); WM: white matter. D-G″. Quantification of the interneuron populations in the adult Pik3r2+/+ and Pik3r2KI/KI brains immunolabeled for SST (C-C″), PV (D-D″), CR (E-E″), and CB (F-F″). No significant differences in SST+, PV+, CR+, CB+ cell numbers were observed in mutants. The cortical area measurement (see Methods) is increased in the mutants (n = 8 from 4 mice; SST: Pik3r2+/+, 3.0 x 10⁶ ± 6.6 x 105μm2; Pik3r2KI/KI, 3.7 x 10⁶ ± 7.3 x 105μm2; *p=0.0499. PV: Pik3r2+/+, 3.1 x 10⁶ ± 6.0 x 105μm2; Pik3r2KI/KI, 3.7 x 10⁶ ± 7.7 x 105μm2; *p=0.0499. CB: Pik3r2+/+, 2.9 x 10⁶ ± 6.2 x 105μm2; Pik3r2KI/KI, 3.7 x 10⁶ ± 7.0 x 105μm2; *p=0.0401; Mann-Whitney test) and the interneuron cell density shows a trend of decrease in mutants without reaching statistical significance (SST: Pik3r2+/+, 5.724 x 10⁻⁵ ± 1.386 x 10⁻⁵ cells/μm2; Pik3r2KI/KI, 4.584 x 10⁻⁵ ± 1.143 cells/μm2; PV: Pik3r2+/+, 7.743 x 10⁻⁵ ± 1.001 x 10⁻⁵ cells/μm2; Pik3r2KI/KI, 7.037 x 10⁻⁵ ± 1.272 x 10⁻⁵ cells/μm2; CR: Pik3r2+/+, 3.113 x 10⁻⁵ ± 8.888 x 10⁻⁶ cells/μm2; Pik3r2KI/KI, 2.441 x 10⁻⁵ ± 2.851 x 10⁻⁶ cells/μm2; CB: Pik3r2+/+, 2.968 x 10⁻⁴ ± 7.351 x 10⁻⁵ cells/μm2; Pik3r2KI/KI, 2.569 x 10⁻⁵ ± 2.476 x 10⁻⁵ cells/μm2; p > 0.05, Mann-Whitney test).
Next, we investigated if normal numbers and subtypes of interneurons populated the neocortex, by immunohistochemistry using primary antibodies to interneuron markers such as somatostatin (SST), parvalbumin (PV), calretinin (CR), and calbindin (CB) onto adult mouse brain sections. No significant difference in the number of each interneuron subtype was detected between the Pik3r2KI/KI and Pik3r2+/+ neocortices (Fig 7C-G′′). With the increased cortical area in Pik3r2KI/KI as expected, we do see the trend of decreased density of these cells in Pik3r2KI/KI cortex, which is consistent with the total cell density data using DAPI in Figure 5. Together our data reveal that interneuron migration and populations are normal in the Pik3r2KI/KI mice, suggesting that seizures or abnormal EEG activity observed in these mice is unlikely to be attributable to an anatomic defect in interneurons.
Individuals with the PIK3R2 pathogenic variant have megalencephaly with or without epilepsy
To correlate our findings with clinical data from children with PIK3R2 pathogenic variant, we reviewed available occipitofrontal circumferences (OFC) and epilepsy data on individuals with the heterozygous and recurrent PIK3R2 G373R variant from both published and unpublished families (n = 34)1,8,30,52. The OFC at birth across this cohort were variable ranging from normocephaly to severe megalencephaly; with an increased average OFC of 3.9 SD above the mean. However, all patients had megalencephaly postnatally, with only one exception, suggesting that the abnormal brain size observed in these patients may reflect continuing postnatal brain over-growth. This is consistent with the findings in our mouse model where both average nuclear and cell soma size are significantly increased in the mutant mouse. In addition to brain overgrowth, a history of seizures or epilepsy was present in at least 20 (59%) individuals, and it was assessed to be mild in 9 (26%) (Table 1; see Materials and methods). The assessment of epilepsy as mild was based on the following criteria: (1) rare or infrequent episodes; (2) no evidence of intractable epilepsy (as defined by resistance to 2 or 3 anti-epileptic drugs). We do note that this assessment is largely descriptive and based on limited epilepsy data, rather than systematic and quantitative epilepsy assessments in this cohort. In summary, our mouse model, which had few and relatively mild seizures, nicely mirrors the epilepsy and brain size phenotypes observed in patients with syntenic pathogenic variant.
Table 1.
Human MPPH patients with PIK3R2 G373R variant
| Pt.#. and ref.* |
Sex | Age last assessed |
OFC at birth, cm (SD) |
OFC at last assessment, cm (SD) |
Epilepsy (age at onset) |
Epilepsy (type) |
|---|---|---|---|---|---|---|
| 130 | F | 22y | 3 | 3 | 4.2y | Frequent focal seizures with unresponsiveness |
| 230 | M | 14y | 2 | 2.5 | 18m | Rare focal seizures with unresponsiveness |
| 3 | M | 5y | ND | ND | 4y 11m | Febrile seizure, developed right sided focal seizures |
| 430 | F | 16y | 3.5 | 4 | 12y | Rare GTC, off AEDs |
| 58 | M | 10y | 4.1 | ND | NA | — |
| 68 | F | 12y | 3.9 | 6.9 | birth | SZ in first days of life, but subsequently rare SZ, last SZ ~2y ago, on AED monotherapy |
| 78 | F | 14y | ND | 5.6 | 7m | Clusters of unknown type; intractable, s/p VNS, on multiple AEDs |
| 81,8 | M | 8m | 4 | 4 | NA | AAS, ISS; multiple AEDs |
| 91,8 | F | 4y | ND | 5-6 | NA | — |
| 101,8 | M | 9y | ND | 8 | NA | — |
| 111,8 | F | 5y | +5-6 | 6 | 4.5y | 3 febrile SZ of focal onset with secondary generalization; on VPA |
| 121,8 | M | 9y | >2 | 6 | NA | ND, GTC and eye deviation, intractable; multiple AEDs |
| 1330 | M | 6y | NA | 5 | 1y | Focal seizures with unresponsiveness; on AED monotherapy |
| 14 | M | 7m | 2 | 4-5 | NA | — |
| 151,30 | M | 2.5y | 3.5 | 4.5 | NA | — |
| 168 | F | 6y | ND | 4.30 | ND | Rare SZ of unknown type; multiple AEDs |
| 178 | M | 18m | 1.3 | 4.1 | 14m | CPS; multiple AEDs |
| 1830 | M | 4y | 5 | 7.5 | 15m | PS with unresponsiveness; multiple AEDs |
| 1930 | F | 2.5y | 8 | 8.5 | NA | Epilepsy (NA) |
| 2030 | F | 2.5y | NA | 2 | NA | Epilepsy (NA) |
| 2130 | F | 3y | 7 | 4.5 | NA | — |
| 2230 | F | 14m | 4 | 1 | NA | — |
| 2330 | F | 4y | 4 | 3.5 | 1m | PS with unresponsiveness; on AED monotherapy |
| 2430 | M | 18y | 4.5 | 6 | 2y | PS with unresponsiveness; multiple AEDs |
| 2530 | F | 2y | NA | 4 | NA | — |
| 2630 | F | 8.5y | 3 | 2.5 | 15m | PS with unresponsiveness; AED monotherapy |
| 2730 | M | 4y | 4.5 | 4.5 | 2m | PS with unresponsiveness, intractable |
| 2830 | M | 5y | 5.5 | 5 | NA | — |
| 2930 | F | 8.6y | NA | 6 | 1y | ISS evolved into MC; intractable; multiple AEDs |
| 3030 | F | 3y | 5 | 3 | NA | — |
| 3130 | F | 4y | NA | 2.5 | 6m | Complex febrile SZ, MC; multiple AEDs |
| 32 | M | 1y | ND | 5.5 | 8m | Subclinical seizures, Generalized symptomatic epilepsy |
| 33 | M | 10m | ND | ND | ND | — |
| 34 | F | 3m | 0.1 | 1.4 | 7w | MC; AED monotherapy |
Abbreviations:
AAS: Atypical absence seizures; AED: Anti-epileptic drug; CPS: Complex partial seizures; GTC: Generalized tonic-clonic seizures; F: Female; ISS: Infantile spasms; M: Male; m: month; MC: Myoclonic seizures; NA: Not available; ND: No data; OFC: Occipitofrontal circumference; PS: Partial seizures; Pt.
: patient number; ref: reference; SD: Standard deviations; SZ: Seizure; U: Unknown; VNS: Vagus nerve stimulator; VPA: Valproic acid; w: weeks; y: years.
: Bold, Bold italic and Regular font of the patient number represent mosaic, likely mosaic and germline - pathogenic variants of PIK3R2 G373R respectively.
Discussion
Germline mutations in PIK3R2 have been associated with MPPH syndrome, a constellation of neurodevelopmental disorder that includes megalencephaly, polymicrogyria, focal cortical dysplasia, and hydrocephalus, as well as multiple neurological symptoms including oromotor dysfunction, intellectual disability, and epilepsy2,8,30. Further, somatic PIK3R2 mutations have also been reported in individuals with polymicrogyria without additional features of MPPH syndrome30. To better understand the pathogenesis of these and related disorders, we generated a mouse model carrying the most common mutation in PIK3R2, p.G373R (p.G367R in mouse). This mouse model shares many features with patients, including megalencephaly and an abnormal EEG with rare seizures. We found that the megalencephaly in this mouse model reflects a defect in the cell size (both nuclear and soma size increase), but not a proliferation defect, at least not detected in our assays. Brain overgrowth detected in our mouse model with no overt differences during embryonic stages (Fig 2H-J) seems to be consistent with brain overgrowth in human patients where OFC increase is more prominent later in life than at birth. It should be noted, though, that the pathway is activated during embryonic stage according to pAKT and pS6 quantification results (Fig 3). We speculate that even though the pathway is activated embryonically, the actual overgrowth is not detectable until neuronal maturation,. We also identified mild defects in cortical lamination in embryonic stage brains and to a lesser extent postnatally. However, the adult cortex was normally laminated according to the lamination markers we tested, presumably reflecting an early developmental defect that was able to compensate or catch up over time. We have also demonstrated that the p.G367R mutation is an activating mutation in vivo, confirming prior in vitro studies8. Thus, our mouse model represents an excellent model to help understand the pathobiology underlying MPPH syndrome.
Previous studies established roles of the PI3K/AKT/mTOR pathway in the pathogenesis of megalencephaly. For example, MPPH syndrome can result from mutations in PIK3R2, AKT3 and CCND2; while MCAP is associated with PIK3CA mutations4,8,9,24,25,27. PTEN loss-of-function mutations have been found in a subset of autistic patients with macrocephaly10,11. In the MPPH syndrome, megalencephaly is one of the two cardinal features for clinical diagnosis, the other being bilateral perisylvian polymicrogyria (BPP). Ventriculomegaly, observed in most patients, hydrocephalus (present in approximately 50% of patients) and a rare case of focal cortical dysplasia are also reported components of the syndrome2,31. Furthermore, neurologic symptoms associated with this syndrome include mild to severe intellectual disability (100%), oromotor dysfunction (100%), and epilepsy (nearly 50%)2. In addition, postaxial polydactyly has been reported in 50% of MPPH patients (polydactyly was not observed in our mouse model), although rarely in patients with PIK3R2 mutations2,9. On the other hand, the MCAP syndrome includes, in addition to megalencephaly, cutaneous capillary anomalies (a defining feature for MCAP) or syndactyly, neither of which have been reported with MPPH1. The phenotypic variations observed in MCAP syndrome are believed to reflect variable levels of mosaicism and tissue distribution8,30. Given the similarities and differences in mutational consequences, it is of inherent interest to understand the pathobiology underlying various phenotypes mediated by different genes as well as different mutations of the same gene in this pathway. The various mouse models that have been generated with pathway mutations have helped clarify the basis of these differences8,26,27.
The Pik3r2 mutant mice we have generated share similarities with the Pik3ca (encoding catalytic subunit of PI3K) mutant mice but also exhibit differences. The two mouse models of the two most common activating PIK3CA mutations, p.H1047R and p.E545K, both reveal PI3K-AKT pathway hyperactivation and brain overgrowth26. Using neuronal-specific Cre-driver lines to induce expression of p.H1047R (transgenic) or p.E545K (knock-in) alleles in subsets of neural progenitors, it has been shown that p.H1047R mutation has a more severe phenotype when compared to mice with the p.E545K mutation26. Specifically, the p.H1047R mice show hydrocephalus, dysplastic white matter, medial pallium enfolding, and are post-weaning lethal. In contrast, mice with the p.E545K mutation survive into adulthood, show no evidence of hydrocephalus, but develop epilepsy26. Similar to the PIK3CA p.H1047R mice, our PIK3R2 p.G367R KI mice have an increased cortical thickness and hydrocephalus but survive into adulthood like PIK3CA p.E545K mice26. Another mouse model in this pathway that carries missense Akt3 mutation (enhancing AKT activity), also exhibits similar phenotypes (brain size and weight increases and low seizure threshold), although distinct phenotypes such as ectopic hippocampal neurons have been reported as well27.
The increased cortical thickness in our Pik3r2 KI mice appears to result from increased cell size, and decreased cell density, but not from changes in cell proliferation or cell cycle exit. In contrast, PIK3CA p.E545K mice showed elevated proliferation and cell cycle exit at the late embryonic stage (E16.5), in addition to changes in soma size. These results suggest two differential mechanisms underlying oversized brain: increased proliferation (cell number) vs overgrowth (cell size) without changes in proliferation. Abnormal accumulation of cyclin D2 (encoded by CCND2) has been reported as a mechanism for enhanced proliferation and cell cycle exit in PI3K-AKT-mTOR pathway-associated megalencephaly9, whereas the elevated level of protein S6 phosphorylation is the mechanism for cell size increase (cell growth)26. In our Pik3r2 KI mice, as well as in PIK3CA p.H1047R mice, enhanced cell growth, probably achieved through increased protein synthesis mediated by increment of protein S6 phosphorylation (Fig 3), which results from activated AKT as shown with amplified phosphorylation level at Ser 473 (see Fig 3A), appears to be the underlying pathogenesis for the increased brain size. On the other hand, in PIK3CA p.E545K mice, proliferation, in addition to cell growth, both seem to contribute to the increased brain size. Together, our data indicate that the PIK3R2 p.G367R mutation-induced PI3K/AKT/mTOR/S6 pathway activation, resulting in enhanced cell size, represents the most likely mechanism for the associated megalencephaly. Interestingly we did not observe an enlarged head size despite the enlarged brain. It is likely that the relatively modest increase in brain size does not extend to the overall head size.
Another prominent cortical malformation in both PIK3CA- and PIK3R2-associated disorders is cortical lamination defect26. During the embryonic stage, the Pik3r2 KI mice showed dyslaminated cortex, like Pik3ca mutant mice. However, unlike the PIK3CA p.E545K mice which show both upper layer marker (CUX1) and deep layer marker (TBR1/CTIP2) defects at both embryonic (E16.5) and postnatal (Postnatal day 3, P3) ages, our PIK3R2 p.G367R KI mice showed only defects in deep layers and not in the upper layers at E17.5 and P15. Moreover, TBR1 and CTIP2 showed a widely expanded pattern in the PIK3CA p.E545K mice but only showed a mild expansion in our PIK3R2 p.G367R mice. Surprisingly, cortical lamination in the adult brain appeared normal in our mice, suggesting that the lamination defects seen at embryonic ages may reflect a developmental defect with apparent catch up. However, given the recent studies showing the importance of correct lamination of cortical projection neurons during the embryonic stage in establishing cortical interneuron circuit formation and/or lamination53,54,55,56, we can postulate that these embryonic defects might lead to abnormal cortical circuits and seizure in our mouse model. Patients with PIK3R2 mutations, approximately 50%, manifest early-onset epilepsy2 and our PIK3R2 p.G367R KI mice have similar features with abnormal EEGs and rare seizures. Although using a strict multiple comparison correction resulted in none significant differences between wildtype and mutant mice, in part due to the variability of recordings, the general patterns suggest the background EEG is slower in mutants when compared to control animals, again similar to what is observed in patients.
Our data also suggest that the severity of the EEG background abnormality does not correlate with that of brain size or hydrocephalus phenotype (the increased brain size of heterozygous mutant mice was intermediate between the more severe homozygous mutant mice and controls, yet some heterozygous mice displayed an equal or even more severe EEG abnormality when compared to homozygous mutant mice), implying that they are affected by independent mechanisms. Frequently, interneuron abnormality has been implicated in epilepsy, including defects in their numbers, lamination, and circuit formation57. Even though the interneuron population and migration per se are not affected in mutant mice, we cannot rule out the possibility of impaired interneuron synapse formation during embryonic development. This is because we detected cortical projection neuron lamination defects in our embryonic mutants, which have been shown to influence interneuron circuit formation53,54,55,56. Thus, it will be important, in future studies, to investigate cortical circuit formation and function in these mice.
In summary, our Pik3r2 mutation mouse model, together with other established models, provide us with a useful tool to better understand and explain the pathways and mechanisms of how the PIK3R2 mutations cause human diseases. Furthermore, this mouse model may assist in the development of therapeutic options for human patients with MPPH and related disorders. Furthermore, owing to the role the PI3K-AKT pathway plays in cancer, multiple therapeutics have been developed providing an opportunity for testing these therapeutics for their potential role in treating patients harboring similar mutations.
Acknowledgments:
This work was supported by R01 NS100007 (JAG) and K08NS092898 (GMM) from the National Institute of Neurological Disorders and Stroke (NINDS), by the Cotran Endowment (JAG) from Harvard Medical School, by Jordan’s Guardian Angels and the Brotman Baty Institute (GMM), and by the Chinese Scholarship Council (XS).
We would like to thank Alexander Bruce (Department of Pathology, BWH) for his help with image scanning, and Dr. Wei Wang for her generous assistance with statistical analyses, supported by the Harvard Catalyst∣The Harvard Clinical and Translational Science Center (National Center for Advancing Translational Sciences, National Institues of Health Award UL 1TR002541) and financial contributions from Harvard University and its affiliated academic healthcare centers. The content is solely the responsibility of the authors and does not necessarily represent the official views of Harvard Catalyst, Harvard University and its affiliated academic healthcare centers, or the NIH.
The Neurobiology Department and the Neurobiology Imaging Facility at Harvard Medical School provided consultation and instrument availability that supported this work. This facility is supported in part by the Neural Imaging Center as part of an NINDS P30 Core Center (grant #NS072030). The Rodent Histopathology Core at the Dana-Farber/Harvard Cancer Center provided paraffin block embedding service. The Dana-Farber/Harvard Cancer Center is supported in part by an NCI Cancer Center Support Grant # NIH 5 P30 CA06516.
Footnotes
Potential Conflicts of interest: Authors declare no conflict of interest.
Reference:
- 1.Mirzaa GM, Conway RL, Gripp KW, et al. Megalencephaly-capillary malformation (MCAP) and megalencephaly-polydactyly-polymicrogyria-hydrocephalus (MPPH) syndromes: Two closely related disorders of brain overgrowth and abnormal brain and body morphogenesis. Am. J. Med. Genet. Part A 2012;158 A(2):269–291. [DOI] [PubMed] [Google Scholar]
- 2.Mirzaa G MPPH syndrome summary [Internet]. In: Adam MP, Ardinger HH, Pagon RA, Wallace SE, editors. GeneReviews® [Internet]. Seattle (WA): 2016. Available from: https://www.ncbi.nlm.nih.gov/books/NBK396098/ [Google Scholar]
- 3.Mirzaa GM, Poduri A. Megalencephaly and hemimegalencephaly: Breakthroughs in molecular etiology. Am. J. Med. Genet. Part C Semin. Med. Genet 2014;166(2):156–172. [DOI] [PubMed] [Google Scholar]
- 4.Mirzaa GM, Rivière JB, Dobyns WB. Megalencephaly syndromes and activating mutations in the PI3K-AKT pathway: MPPH and MCAP. Am. J. Med. Genet. Part C Semin. Med. Genet 2013;163(2):122–130. [DOI] [PubMed] [Google Scholar]
- 5.Jansen LA, Mirzaa GM, Ishak GE, et al. PI3K/AKT pathway mutations cause a spectrum of brain malformations from megalencephaly to focal cortical dysplasia. Brain 2015;138(6):1613–1628. [DOI] [PMC free article] [PubMed] [Google Scholar]
- 6.Mirzaa GM, Campbell CD, Solovieff N, et al. Association of mTOR mutations with developmental brain disorders, including megalencephaly, focal cortical dysplasia, and pigmentary mosaicism. JAMA Neurol. 2016;73(7):836. [DOI] [PMC free article] [PubMed] [Google Scholar]
- 7.Pavone P, Praticò AD, Rizzo R, et al. A clinical review on megalencephaly: A large brain as a possible sign of cerebral impairment. Medicine (Baltimore). 2017;96(26):e6814. [DOI] [PMC free article] [PubMed] [Google Scholar]
- 8.Rivière JB, Mirzaa GM, O’Roak BJ, et al. De novo germline and postzygotic mutations in AKT3, PIK3R2 and PIK3CA cause a spectrum of related megalencephaly syndromes. Nat. Genet 2012;44(8):934–940. [DOI] [PMC free article] [PubMed] [Google Scholar]
- 9.Mirzaa GM, Parry DA, Fry AE, et al. De novo CCND2 mutations leading to stabilization of cyclin D2 cause megalencephaly-polymicrogyria-polydactyly-hydrocephalus syndrome. Nat. Genet 2014;46(5):510–515. [DOI] [PMC free article] [PubMed] [Google Scholar]
- 10.Varga EA, Pastore M, Prior T, et al. The prevalence of PTEN mutations in a clinical pediatric cohort with autism spectrum disorders, developmental delay, and macrocephaly. Genet. Med 2009;11(2):111–117. [DOI] [PubMed] [Google Scholar]
- 11.McBride KL, Varga EA, Pastore MT, et al. Confirmation study of PTEN mutations among individuals with autism or developmental delays/mental retardation and macrocephaly. Autism Res. 2010;3(3):137–141. [DOI] [PubMed] [Google Scholar]
- 12.Fruman DA, Chiu H, Hopkins BD, et al. The PI3K Pathway in Human Disease. Cell 2017;170(4):605–635. [DOI] [PMC free article] [PubMed] [Google Scholar]
- 13.Mayer IA, Arteaga CL. The PI3K/AKT Pathway as a Target for Cancer Treatment. Annu. Rev. Med 2016;67(1):11–28. [DOI] [PubMed] [Google Scholar]
- 14.Ersahin T, Tuncbag N, Cetin-Atalay R. The PI3K/AKT/mTOR interactive pathway. Mol. Biosyst 2015;11(7):1946–1954. [DOI] [PubMed] [Google Scholar]
- 15.Auger KR, Serunian LA, Soltoff SP, et al. PDGF-dependent tyrosine phosphorylation stimulates production of novel polyphosphoinositides in intact cells. Cell 1989;57(1):167–175. [DOI] [PubMed] [Google Scholar]
- 16.Engelman JA, Luo J, Cantley LC. The evolution of phosphatidylinositol 3-kinases as regulators of growth and metabolism. Nat. Rev. Genet 2006;7(8):606–619. [DOI] [PubMed] [Google Scholar]
- 17.Franke TF, Yang S-I, Chan TO, et al. The protein kinase encoded by the Akt proto-oncogene is a target of the PDGF-activated phosphatidylinositol 3-kinase. Cell 1995;81(5):727–736. [DOI] [PubMed] [Google Scholar]
- 18.Sarbassov DD, Guertin DA, Ali SM, Sabatini DM.. Phosphorylation and Regulation of Akt/PKB by the Rictor-mTOR Complex. Science. 2005;307(5712):1098–1101. [DOI] [PubMed] [Google Scholar]
- 19.Alessi DR, James SR, Downes CP, et al. Characterization of a 3-phosphoinositide-dependent protein kinase which phosphorylates and activates protein kinase Bα. Curr. Biol 1997;7(4):261–269. [DOI] [PubMed] [Google Scholar]
- 20.Stokoe D, Stephens LR, Copeland T, et al. Dual role of phosphatidylinositol-3,4,5-trisphosphate in the activation of protein kinase B. Science 1997;277(5325):567–70. [DOI] [PubMed] [Google Scholar]
- 21.Salmena L, Carracedo A, Pandolfi PP. Tenets of PTEN Tumor Suppression. Cell 2008;133(3):403–414. [DOI] [PubMed] [Google Scholar]
- 22.Dibble CC, Cantley LC. Regulation of mTORC1 by PI3K signaling. Trends Cell Biol. 2015;25(9):545–555. [DOI] [PMC free article] [PubMed] [Google Scholar]
- 23.Huang W, Chang HY, Fei T, et al. GSK3β mediates suppression of cyclin D2 expression by tumor suppressor PTEN. Oncogene 2007;26(17):2471–2482. [DOI] [PubMed] [Google Scholar]
- 24.Kurek KC, Luks VL, Ayturk UM, et al. Somatic mosaic activating mutations in PIK3CA cause CLOVES syndrome. Am. J. Hum. Genet 2012;90(6):1108–1115. [DOI] [PMC free article] [PubMed] [Google Scholar]
- 25.Lee JH, Huynh M, Silhavy JL, et al. De novo somatic mutations in components of the PI3K-AKT3-mTOR pathway cause hemimegalencephaly. Nat. Genet 2012;44(8):941–945. [DOI] [PMC free article] [PubMed] [Google Scholar]
- 26.Roy A, Skibo J, Kalume F, et al. Mouse models of human PIK3CA-related brain overgrowth have acutely treatable epilepsy. Elife 2015;4(December 2015):1–25. [DOI] [PMC free article] [PubMed] [Google Scholar]
- 27.Tokuda S, Mahaffey CL, Monks B, et al. A novel Akt3 mutation associated with enhanced kinase activity and seizure susceptibility in mice. Hum. Mol. Genet 2011;20(5):988–999. [DOI] [PMC free article] [PubMed] [Google Scholar]
- 28.Tapper WJ, Foulds N, Cross NCP, et al. Megalencephaly syndromes: Exome pipeline strategies for detecting low-level mosaic mutations. PLoS One 2014;9(1) [DOI] [PMC free article] [PubMed] [Google Scholar]
- 29.Nakamura K, Kato M, Tohyama J, et al. AKT3 and PIK3R2 mutations in two patients with megalencephaly-related syndromes: MCAP and MPPH. Clin. Genet 2014;85(4):396–398. [DOI] [PubMed] [Google Scholar]
- 30.Mirzaa GM, Conti V, Timms AE, et al. Characterisation of mutations of the phosphoinositide-3-kinase regulatory subunit, PIK3R2, in perisylvian polymicrogyria: a next-generation sequencing study. Lancet Neurol. 2015;14(12):1182–1195. [DOI] [PMC free article] [PubMed] [Google Scholar]
- 31.Terrone G, Voisin N, Alfaiz AA, et al. De novo PIK3R2 variant causes polymicrogyria, corpus callosum hyperplasia and focal cortical dysplasia. Eur. J. Hum. Genet 2016;24(9):1359–1362. [DOI] [PMC free article] [PubMed] [Google Scholar]
- 32.Wang H, Yang H, Shivalila CS, et al. One-Step Generation of Mice Carrying Mutations in Multiple Genes by CRISPR/Cas-Mediated Genome Engineering. Cell 2013;153(4):910–918. [DOI] [PMC free article] [PubMed] [Google Scholar]
- 33.Stenman J, Toresson H, Campbell K. Identification of Two Distinct Progenitor Populations in the Lateral Ganglionic Eminence: Implications for Striatal and Olfactory Bulb Neurogenesis. J. Neurosci 2003;23(1):167–174. [DOI] [PMC free article] [PubMed] [Google Scholar]
- 34.Marsh E, Fulp C, Gomez E, et al. Targeted loss of Arx results in a developmental epilepsy mouse model and recapitulates the human phenotype in heterozygous females. Brain 2009;132(6):1563–1576. [DOI] [PMC free article] [PubMed] [Google Scholar]
- 35.Cho G, Lim Y, Cho IT, et al. Arx together with FoxA2, regulates Shh floor plate expression. Dev. Biol 2014;393(1):137–148. [DOI] [PMC free article] [PubMed] [Google Scholar]
- 36.Myers AK, Meechan DW, Adney DR, Tucker ES. Cortical Interneurons Require Jnk1 to Enter and Navigate the Developing Cerebral Cortex. J. Neurosci 2014;34(23):7787–7801. [DOI] [PMC free article] [PubMed] [Google Scholar]
- 37.Chehrehasa F, Meedeniya ACB, Dwyer P, et al. EdU, a new thymidine analogue for labelling proliferating cells in the nervous system. J. Neurosci. Methods 2009;177(1):122–130. [DOI] [PubMed] [Google Scholar]
- 38.Hof Patrick R., Young WG Bloom FE, et al. Comparative Cytoarchitectonic Atlas of the C57BL/6 and 129/Sv Mouse Brains. Elsevier; 2000. [Google Scholar]
- 39.Simonet JC, Sunnen CN, Wu J, et al. Conditional loss of arx from the developing dorsal telencephalon results in behavioral phenotypes resembling mild human arx mutations. Cereb. Cortex 2015;25(9):2939–2950. [DOI] [PMC free article] [PubMed] [Google Scholar]
- 40.Yun S, Reynolds RP, Petrof I, et al. Stimulation of entorhinal cortex-dentate gyrus circuitry is antidepressive. Nat. Med 2018;24(5):658–666. [DOI] [PMC free article] [PubMed] [Google Scholar]
- 41.Lessard-Beaudoin M, Laroche M, Demers MJ, et al. Characterization of age-associated changes in peripheral organ and brain region weights in C57BL/6 mice. Exp. Gerontol 2015;63(May):27–34. [DOI] [PubMed] [Google Scholar]
- 42.Sarnat HB, Nochlin D, Born DE. Neuronal nuclear antigen (NeuN): A marker of neuronal maturation in the early human fetal nervous system. Brain Dev. 1998;20(2):88–94. [DOI] [PubMed] [Google Scholar]
- 43.Chenn A, Walsh CA. Regulation of Cerebral Cortical Size by Control of Cell Cycle Exit in Neural Precursors. 2002;297(5580):365–369. [DOI] [PubMed] [Google Scholar]
- 44.Kozma SC, Thomas G. Regulation of cell size in growth, development and human disease: PI3K, PKB and S6K. BioEssays 2002;24(1):65–71. [DOI] [PubMed] [Google Scholar]
- 45.Wang XP, Ye P, Lv J, et al. Expression Changes of NMDA and AMPA Receptor Subunits in the Hippocampus in rats with Diabetes Induced by Streptozotocin Coupled with Memory Impairment. Neurochem. Res 2019;44(4):978–993. [DOI] [PubMed] [Google Scholar]
- 46.Sosunov AA, Wu X, Weiner HL, et al. Tuberous sclerosis: A primary pathology of astrocytes?. Epilepsia 2008;49:53–62. [DOI] [PubMed] [Google Scholar]
- 47.Zeng L-H, Xu L, Gutmann DH, Wong M. Rapamycin prevents epilepsy in a mouse model of tuberous sclerosis complex. Ann. Neurol 2008;63(4):444–453. [DOI] [PMC free article] [PubMed] [Google Scholar]
- 48.Roux PP, Shahbazian D, Vu H, et al. RAS/ERK signaling promotes site-specific ribosomal protein S6 phosphorylation via RSK and stimulates cap-dependent translation. J. Biol. Chem 2007;282(19):14056–14064. [DOI] [PMC free article] [PubMed] [Google Scholar]
- 49.Bozzi Y, Casarosa S, Caleo M. Epilepsy as a neurodevelopmental disorder. Front. Psychiatry 2012;3(MAR):1–14. [DOI] [PMC free article] [PubMed] [Google Scholar]
- 50.Cobos I, Calcagnotto ME, Vilaythong AJ, et al. Mice lacking Dlx1 show subtype-specific loss of interneurons, reduced inhibition and epilepsy. Nat. Neurosci 2005;8(8):1059–1068. [DOI] [PubMed] [Google Scholar]
- 51.Wang Y, Dye CA, Sohal V, et al. Dlx5 and Dlx6 regulate the development of parvalbumin-expressing cortical interneurons. J. Neurosci 2010;30(15):5334–5345. [DOI] [PMC free article] [PubMed] [Google Scholar]
- 52.Mirzaa G, Dodge NN, Glass I, et al. Megalencephaly and Perisylvian Polymicrogyria with Postaxial Polydactyly and Hydrocephalus: A Rare Brain Malformation Syndrome Associated with Mental Retardation and Seizures. Neuropediatrics 2004;35(6):353–359. [DOI] [PubMed] [Google Scholar]
- 53.Molyneaux BJ, Arlotta P, Hirata T, et al. Fezl is required for the birth and specification of corticospinal motor neurons. Neuron 2005;47(6):817–831. [DOI] [PubMed] [Google Scholar]
- 54.Lodato S, Rouaux C, Quast KB, et al. Excitatory projection neuron subtypes control the distribution of local inhibitory interneurons in the cerebral cortex. Neuron 2011;69(4):763–779. [DOI] [PMC free article] [PubMed] [Google Scholar]
- 55.Ye Z, Mostajo-Radji MA, Brown JR, et al. Instructing perisomatic inhibition by direct lineage reprogramming of neocortical projection neurons. Neuron 2015;88(3):475–483. [DOI] [PMC free article] [PubMed] [Google Scholar]
- 56.Wester JC, Mahadevan V, Rhodes CT, et al. Neocortical projection neurons instruct inhibitory interneuron circuit development in a lineage-dependent manner. Neuron 2019;102(5):960–975.e6. [DOI] [PMC free article] [PubMed] [Google Scholar]
- 57.Powell EM. Interneuron development and epilepsy: Early genetic defects cause long-term consequences in seizures and susceptibility. Epilepsy Curr. 2013;13(4):172–176. [DOI] [PMC free article] [PubMed] [Google Scholar]