Abstract
G protein coupled receptors (GPCRs) are the largest superfamily of transmembrane proteins and the targets of over 30% of currently marketed pharmaceuticals. Although several structures have been solved for GPCR-G protein complexes, few are in a lipid membrane environment. Here, we report cryo-EM structures of lipid bilayer-bound complexes of neurotensin, neurotensin receptor 1, and Gαi1β1γ1 protein in two conformational states, resolved to 4.1 and 4.2 Å resolution. The structures were determined in a lipid bilayer without any stabilizing antibodies/nanobodies, and thus provide a native-like platform for understanding the structural basis of GPCR-G protein complex formation. Our structures reveal an extended network of protein-protein interactions at the GPCR-G protein interface compared to in detergent micelles, defining roles for the lipid membrane in modulating the structure and dynamics of complex formation, and providing a molecular explanation for the stronger interaction between GPCR and G protein in lipid bilayers. We propose an allosteric mechanism for GDP release, providing new insights into the activation of G proteins for downstream signaling.
G protein coupled receptors (GPCRs) sense extracellular stimuli including odorants, hormones, neurotransmitters, and photons1,2. A stimulus leads to a shift in the conformational equilibrium of the GPCR towards a state which favors binding of the intracellular signal transducer, GDP-bound heterotrimeric Gαβγ protein3. Binding causes perturbation of the GDP binding pocket, leading to replacement of GDP by GTP and the dissociation of the Gα and Gβγ subunits from each other and the GPCR4. The released Gα and Gβγ subunits remain anchored to the membrane through lipid modifications but diffuse and interact with downstream effectors to stimulate signaling cascades3.
Recent advances in X-ray crystallography and cryo-EM have allowed the determination of several GPCR-G protein complex structures5–18. However, due to difficulties in preparing stable GPCR-G protein complexes in detergent micelles, a range of stabilization techniques had to be employed for most of the structures reported to date, including binding to antibodies or nanobodies, dominant-negative Gα subunits, or mini-G proteins that lack the α-helical domain (AHD) of Gα. Furthermore, the majority of previous structural studies reconstituted GPCR-G protein complexes in detergent micelles, with the only exception being a recently published structure of D2 dopamine receptor in complex with a dominant negative Gi and a stabilizing antibody scFv16 in lipid nanodiscs19. The detergent structures fail to replicate the properties of the native lipid bilayer environment of GPCRs, including membrane thickness, lateral pressure, and curvature20. It has been reported that various GPCRs exhibit higher stability and better functionality when incorporated into lipid bilayers as compared to detergent micelles21,22. Additionally, negatively charged lipids have been found to allosterically modulate GPCR activation and its selective interaction with G proteins23–25. Therefore, structural and dynamical information for the GPCR–G protein interaction in a lipid bilayer environment is necessary to understand the GPCR signal transduction mechanism.
To investigate the interaction between GPCR and G proteins in lipid bilayers, we used the neurotensin receptor 1 (NTSR1)-Gi interaction as a model system. NTSR1 is a class A GPCR that responds to neurotensin (NTS), a 13-residue peptide implicated in the pathogenesis of schizophrenia, antinociception, hypothermia, Parkinson’s disease and tumor growth1,26. To reconstitute and determine the structure of the NTS8–13-NTSR1-Gαi1β1γ1 complex in a lipid bilayer environment we used circularized nanodiscs (cNDs) prepared with covalently circularized membrane scaffold proteins27, which also allowed structure determination in the absence of external stabilizing factors. Comparison with structures of the GDP-bound G protein heterotrimer28 and GPCR-G protein complexes in detergent micelles, including the cryo-EM structure of the NTSR1-Gαi1β1γ2 complex stabilized by scFv16 and in complex with a pseudopeptide analog of NTS12, provide insights into the mechanism by which a G protein is activated by the interaction with GPCR in a lipid bilayer.
Results
Lipid bilayers enhance the efficiency of NTS-NTSR1-Gαi1β1γ1 complex formation
To enable efficient expression of NTSR1 for purification and structural studies, we took advantage of the TM86V-L167R ΔIC3B construct29. Compared to the inactive TM86V construct, TM86V-L167R contains a back mutation of L167R which restores NTSR1 functionality29. The TM86V-L167R ΔIC3B29 exhibits similar downstream signaling functionality to wild-type NTSR1 as measured by the production of inositol-1-phosphate (IP1), the final metabolite of the inositol phosphate cascade, with a EC50 of 2.7 nM for wild-type NTSR1 and 0.22 nM for TM86V-L167R ΔIC3B (Extended Data Fig. 1a, left). The single mutation of R1673.50L (superscripts denote Ballesteros–Weinstein numbering30) in the TM86V ΔIC3B construct completely quenched IP1 production (Extended Data Fig. 1a, right). As we discuss later, R1673.50 directly interacts with Gi, partially explaining the critical role of this residue in the signaling process.
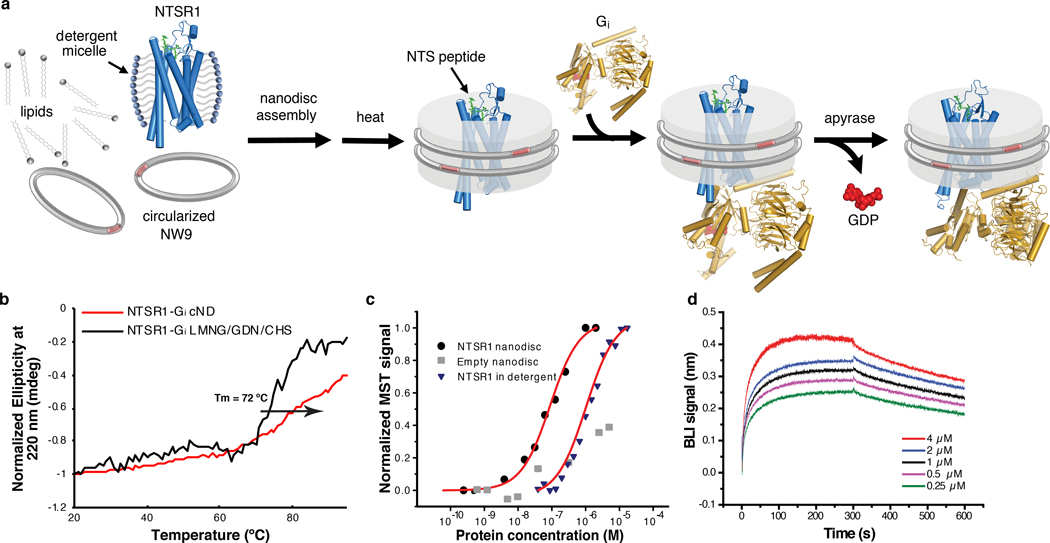
NTSR1 was affinity purified using immobilized NTS8–13, which ensured selection of properly folded NTSR1 only. The purified NTS-NTSR1 complex was then incorporated into 9-nm diameter covalently circularized nanodiscs (cNDs), containing a mixture of zwitterionic lipid POPC and negatively charged lipid POPG, and belted by circularized membrane scaffold protein cNW9 (ref.27) (Fig. 1a and Extended Data Fig. 1). Heat-treating the purified nanodiscs at 42 ºC for 24 hours improved sample homogeneity (Extended Data Fig. 1d). Circular dichroism measurements showed increased thermostability of NTSR1 in cNDs as compared to in detergent micelles, with a transition temperature about 18 ºC higher (Extended Data Fig. 2a–c). This sample was stable at 45 ºC for at least 15 days, showing well dispersed and reproducible peaks on two-dimensional nuclear magnetic resonance (2D NMR) spectra (Extended Data Fig. 3a). These observations agree with studies showing that GPCRs are more stable in membrane environments31. When Gαi1β1γ1 was incorporated into cNDs using the same method, its thermostability also improved relative to in detergent micelles (Extended Data Fig. 2d–f).
Fig. 1 |. Assembly and biophysical characterization of the NTS-NTSR1-Gαi1β1γ1 complex in circularized nanodiscs (cNDs).
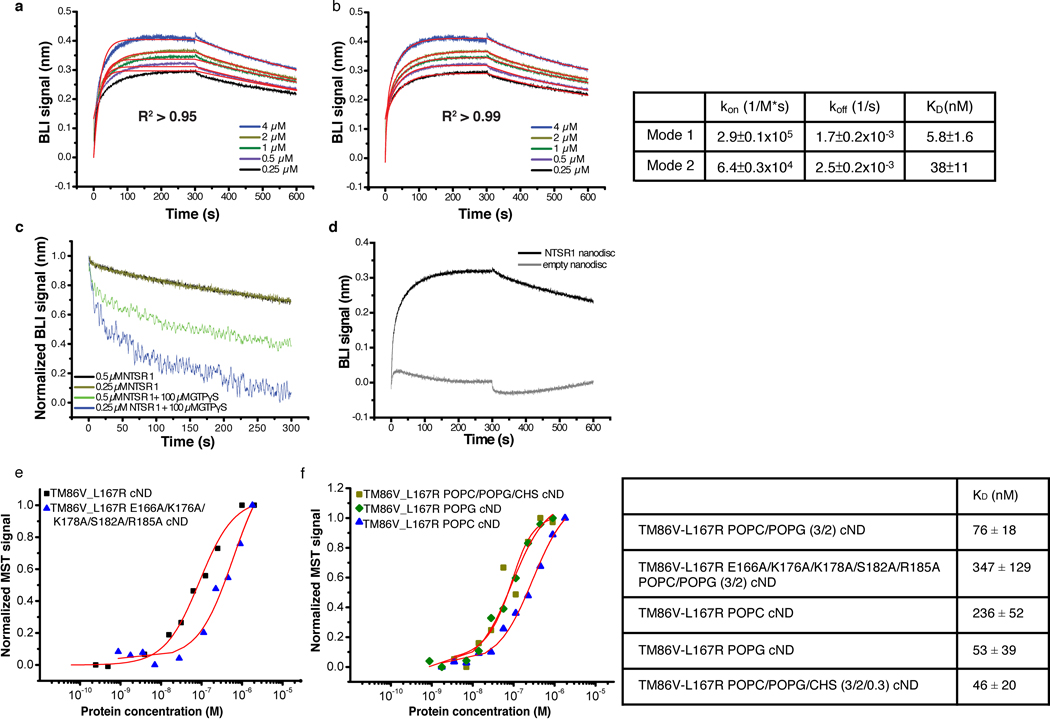
a, Schematic showing the assembly of the NTS-NTSR1-Gi complex in lipid nanodiscs using the circularized membrane scaffold protein cNW9. b, Circular dichroism thermostability assays on NTS-NTSR1-Gi complex in LMNG/GDN/CHS micelles (black line) and in cNDs (red line). c, Microscale thermophoresis data fitting for the interaction between NTS-NTSR1 and Gi in diheptanoylphosphatidylcholine detergent (DH7PC) yields a KD of 1400±100 nM (blue triangles). The interaction between NTS-NTSR1-cND and Gi (black circles) yields a KD of 76±18 nM. Two independent biological samples were used in the measurements each with three technical repeats. A representative curve is shown for each sample. Weak binding between empty nanodiscs and Gi is shown as gray squares. d, Bio-layer interferometry (BLI) traces of Gi binding to NTS-NTSR1-cND at five different concentrations. Data fitting results are shown in Extended Data Fig. 4a, b. Three independent biological samples were used in the measurements.
To reconstitute the signaling complex, we incubated NTS-NTSR1-cND with wild-type heterotrimeric human Gαi1β1γ1, which is myristoylated on Gαi1 and prenylated on Gγ1 (Extended Data Fig. 1e). The NTS-NTSR1-Gαi1β1γ1 complex in cNDs exhibits high thermostability (Fig. 1b and Extended Data Fig. 2g–h), and the binding affinity of NTSR1 to Gαi1β1γ1 is higher in cNDs than in detergent micelles (KD of 76 nM compared to 1.4 μM) (Fig. 1c), reflecting the essential role the membrane plays in efficient GPCR-G protein complex formation. Further binding kinetic measurements revealed two binding modes in cNDs with KD of 5.8 nM and 38 nM, respectively (Fig. 1d and Extended Data Fig. 4a, b). The complex in cND is capable of GDP/GTP exchange, as shown by a much higher dissociation rate upon addition of GTPγS (Extended Data Fig. 4c). However, for the following structural studies, we used apyrase to hydrolyze free GDP, which stabilizes the NTS-NTSR1-Gαi1β1γ1 complex.
Cryo-EM structure of the NTS-NTSR1-Gαi1β1γ1 complex in cNDs
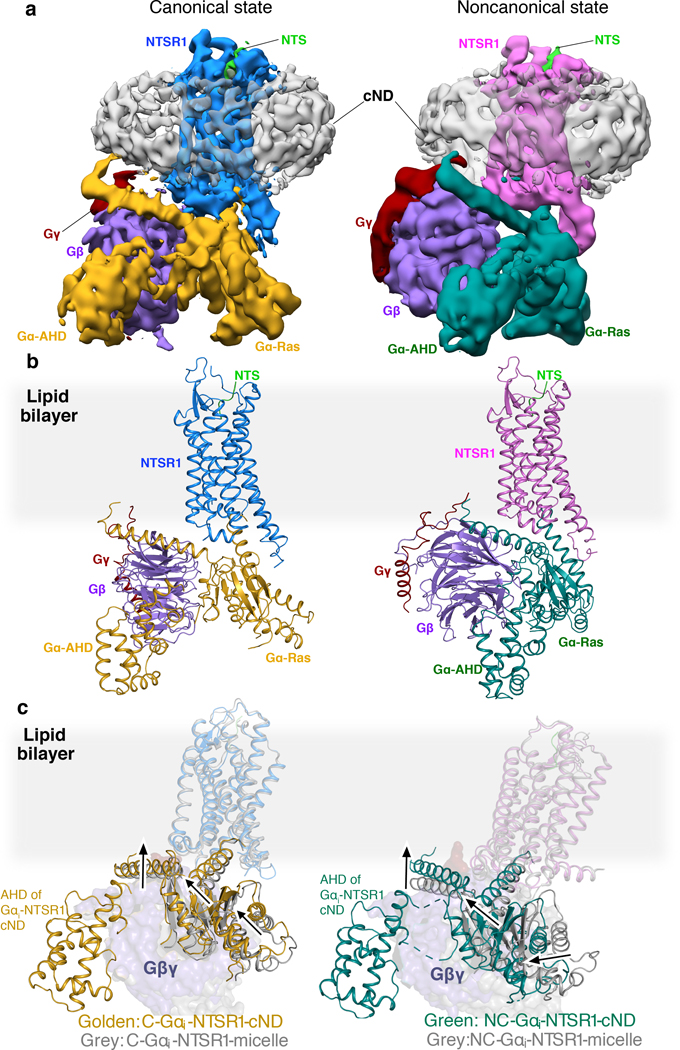
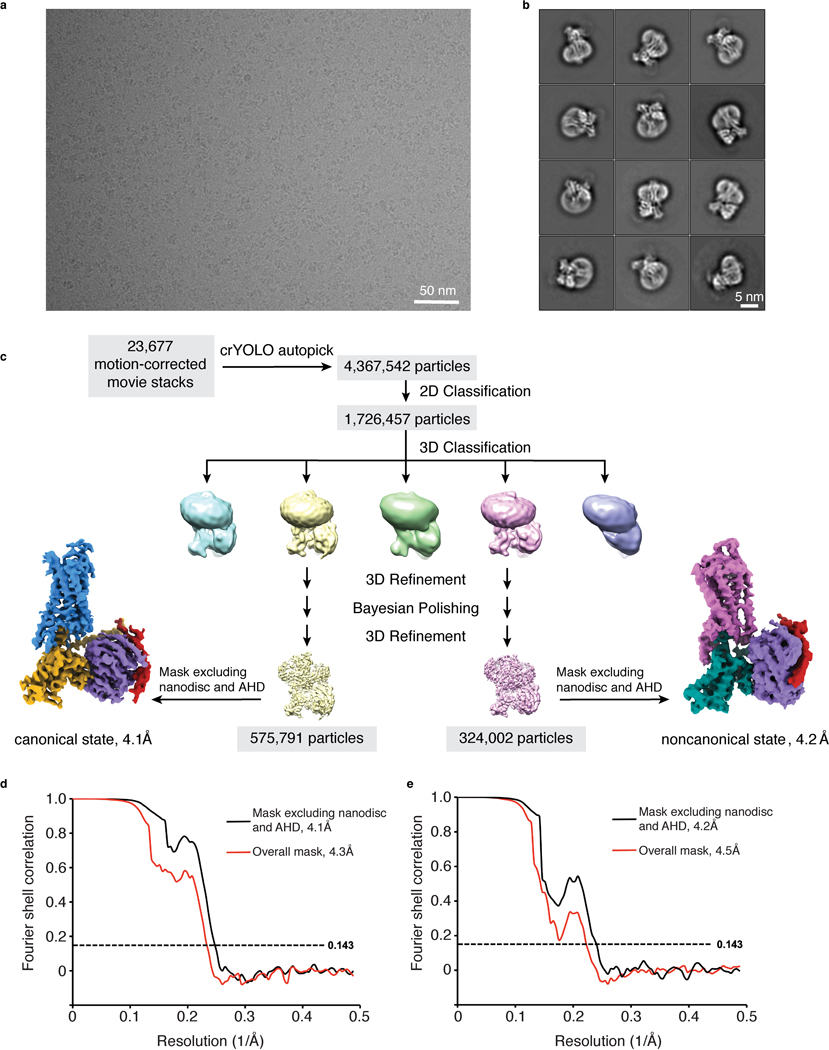
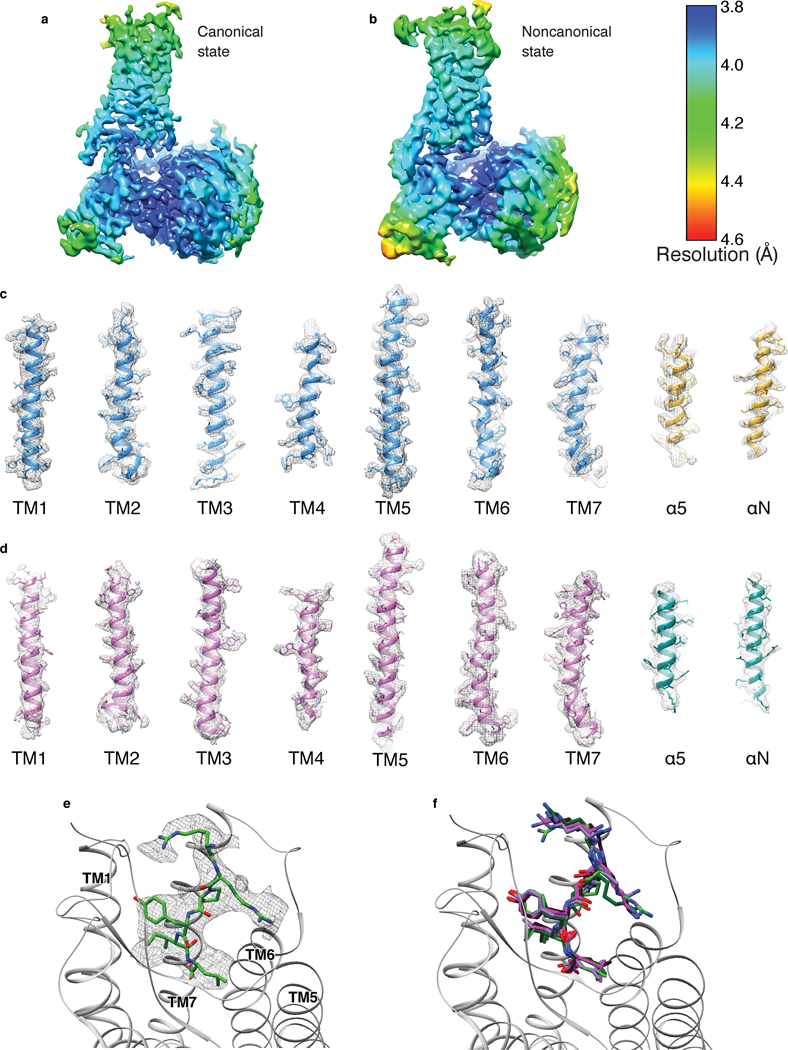
The higher affinity and improved thermostability of the NTS-NTSR1-Gαi1β1γ1 complex in lipid bilayers relative to in detergent micelles allowed us to collect cryo-EM data (Fig. 2, Extended Data Fig. 5) for the complexes without the need for further stabilization by antibodies/nanobodies or engineered G proteins. Two-dimensional class averages showed intact complexes within cNDs with uniform 9-nm diameters (Extended Data Fig. 5). Three-dimensional classification of these projections revealed two well-resolved classes, corresponding to “canonical” (C) and “noncanonical” (NC) states of the NTS-NTSR1-Gαi1β1γ1 complex, at 4.3 and 4.5 Å resolution, respectively (Extended Data Fig. 5). Two main conformational states were also seen in the recent cryo-EM study of the scFv16-stabilized NTSR1-Gαi1β1γ2 complex in detergent micelles12, but, as we describe below, these states are different from those that we observe (Fig. 2c). Additional density surrounds NTSR1, corresponding to the cNW9 membrane scaffold protein and the lipid bilayer it encloses. Masking out these densities improved the resolutions of the C and NC states to 4.1 Å and 4.2 Å respectively (Extended Data Fig. 5). In these maps, the pitch of helices and many sidechains are clearly resolved (Extended Data Fig. 6), allowing us to confidently place and remodel known atomic models of NTS, NTSR1 and Gαi1β1γ1 (ref.28,29,32). The density of NTS is well revolved in both conformations (Extended Data Fig. 6), and adopts similar structure and interactions to those observed in detergent micelles12,33. The N-terminal helices of Gβ and Gγ both show weak densities, presumably due to flexibility.
Fig. 2 |. Cryo-EM structures of NTS-NTSR1-Gi-cND.
a, Cryo-EM density maps of NTS-NTSR1-Gi-cND complex in the canonical state (left) and in the noncanonical state (right). The maps are low-pass filtered to 5 Å and colored by subunit. Higher-resolution maps were obtained by masking out density for the nanodisc (cND) and Gα−AHD domain. b, Atomic models of NTS-NTSR1-Gi-cND complex in the canonical state (left) and in the noncanonical state (right). The models are shown in the same orientation as the maps in (a). c, Structural superimposition of C-NTS-NTSR1-Gi-cND with C-NTSR1-scFv16-micelle (PDB 6OS9) (left) and NC-NTS-NTSR1-Gi-cND with NC-NTSR1-scFv16-micelle (PDB 6OSA) (right). Structural displacement is highlighted with arrows. The models are superimposed on the NTSR1.
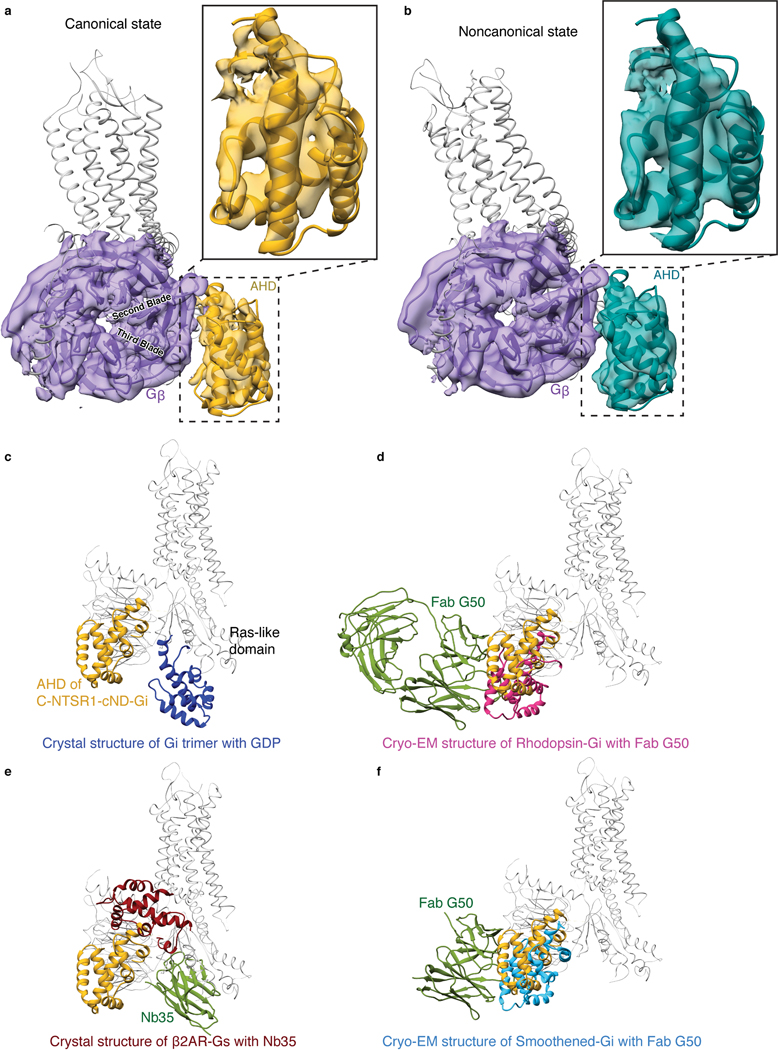
Compared to most reported structures9–18, the α-helical domain (AHD) of Gαi1 is resolved in both states (Fig. 2a, Extended Data Fig. 7a, b). In the few structures that do report the position of the AHD5,6,8, the position may be affected by crystal contacts and/or the nanobodies/antibodies that were included for stabilization (Extended Data Fig. 7c–f). Our structures lack these constraints and therefore more closely reflect the native orientation and localization of the AHD in the nucleotide-free state. In comparison to the crystal structure of the GDP-bound Gi trimer28, the AHD moves away from its close association with the Ras-like domain of Gα and interacts with the outer strands of the second and third β blades of Gβ after GDP release (Fig. 2b, Extended Data Fig. 7a–c). As we discuss later, the large-scale movement of AHD is an important step in the GDP release pathway.
Lipid bilayer modulates GPCR-G protein interaction
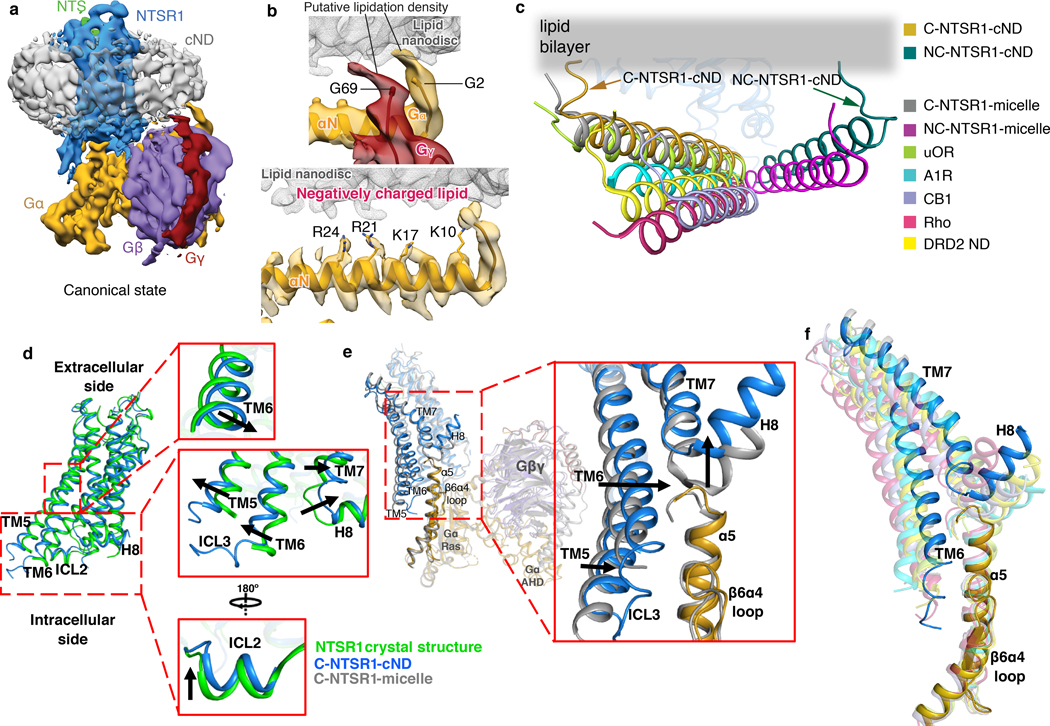
The NTS-NTSR1-Gαi1β1γ1 complex shows interactions with the lipid bilayer in both the C and NC states (Fig. 3a, Extended data Fig. 8). Density at the beginning of the αN-helix of Gα is observed protruding into the lipid bilayer, which corresponds to the myristoylation site of the Gα (Fig. 3b, top panel). Similar density at the C-terminus of Gγ corresponds to the prenylation site (Fig. 3b, top panel). Similar interactions are also observed in the DRD2-Gi structure19, the only other available GPCR-Gi complex structure in nanodisc, revealing how protein lipidation helps anchor G proteins to membranes. Lipid density is also observed above the positively charged αN-helix of Gα (Fig. 3b, bottom panel). The sidechains of arginine and lysine residues within this helix are oriented towards the membrane and likely form electrostatic interactions with the negatively charged lipid POPG (Fig. 3b, bottom panel). Consistent with previous observations that negatively charged lipids strengthen the interaction between NTSR1 and G protein25, binding studies on the complex in a neutral lipid bilayer (POPC) resulted in weaker binding (KD of 236 nM) than in negatively charged POPG (53 nM) (Extended Data Fig. 4f). Electrostatic interactions with the lipid headgroups may explain why the αN-helices of the complexes solved here are located closer to the membrane than in structures of class A GPCR-Gi complexes in detergent micelles (Fig. 3c). The αN-helix is also closer to the membrane than in the DRD2-Gi ND structure (Fig. 3c), perhaps reflecting differences among GPCR-G-protein pairs or a consequence of the stabilizing single-chain antibody used in that structure. The observed hydrophobic and electrostatic interactions ensure close proximity of Gi to NTSR1, and thus enhance Gi binding to NTSR1, particularly between the αN-β1 hinge of Gi and ICL2 of NTSR1 as described below (Fig. 4a).
Fig. 3 |. Impact of lipid bilayer on the NTSR1-Gi complex.
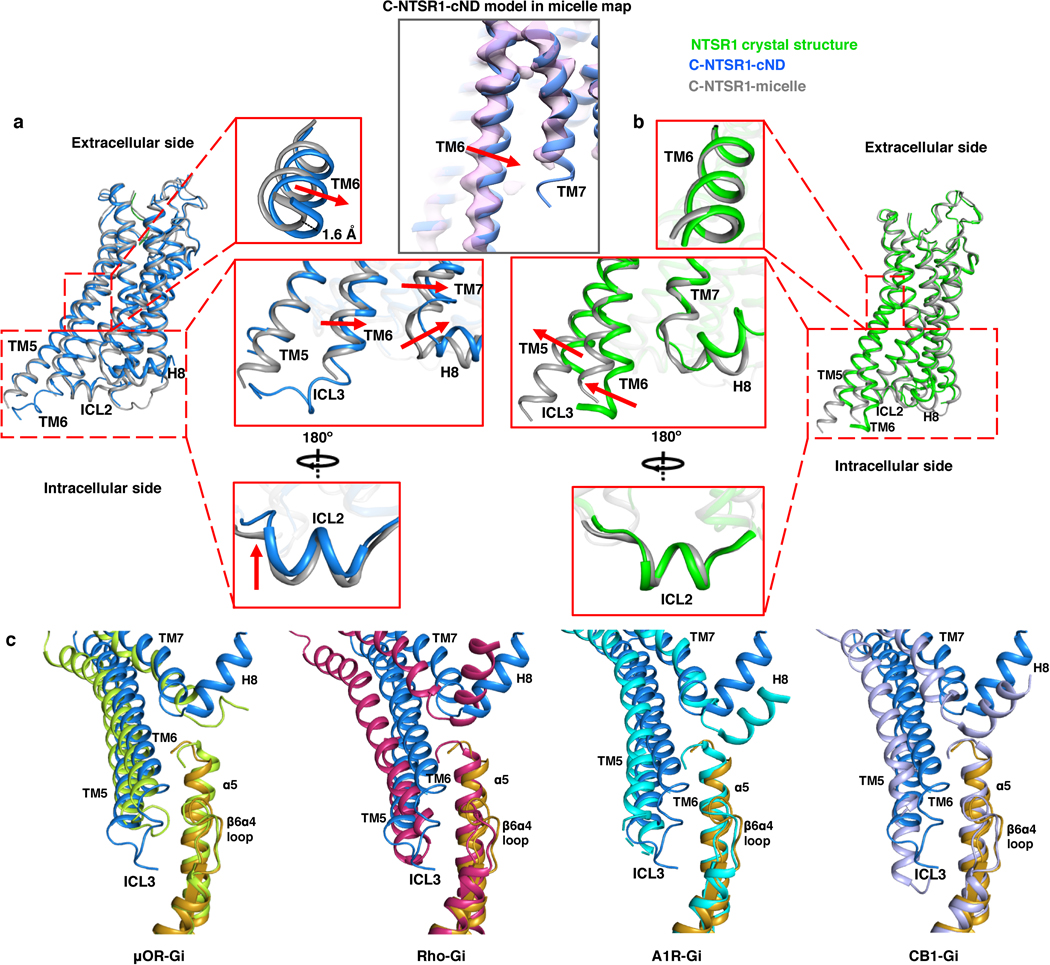
a, Cryo-EM density map of the NTS-NTSR1-Gi-cND complex in the canonical state. The map is low-pass filtered to 5 Å to aid visualization and colored by subunit. b, Top panel, density for the putative lipid modifications of glycine 2 (G2) of Gαi1 and glycine 69 (G69) of Gγ1. Nanodisc density is shown as gray mesh. The density map of the canonical state is low-pass filtered to 5 Å. Bottom panel, positively charged residues of the αN helix of Gαi1 face the negatively charged lipid bilayer. The 4.1 Å density map of the canonical state is shown. c, Comparison of the αN helices of GPCR-Gi complexes. C-NTSR1-cND and NC-NTSR1-cND indicate the canonical and noncanonical states of the NTS-NTSR1-Gi complex in nanodiscs. C-NTSR1-micelle and NC-NTSR1-micelle indicate the canonical and noncanonical states of JMV449-NTSR1-Gi complex in detergent micelles. Other Class A GPCR-Gi complexes: μOR-Gi (lime green; PDB 6DDE), A1R-Gi (cyan; PDB 6D9H), CB1-Gi (purple; PDB 6N4B), Rho-Gi (hot pink; PDB 6CMO) and DRD2-Gi (yellow; PDB 6VMS). The models are superposed on the GPCR. d, Structural comparison between NTSR1 from the canonical state NTS-NTSR1-Gi complex in lipid nanodiscs (blue) and the crystal structure of NTSR1 in detergent (green). Zoomed-in views are shown on the right. e, Structural comparison between the canonical states of NTSR1-Gi in lipid bilayer (blue) and detergent (gray), superposed on the Ras-like domain of Gα (gold). Zoomed-in view of the cytoplasmic side of TM5-TM6, ICL3, TM7-H8, as well as the α5 helix and α4β6 loop of Gα is shown on the right. f, Comparison of the location of TM6 relative to the α5 helix of Gα in the canonical state NTSR1 (blue) in complex with Gi (gold) with other class A GPCR-Gi complex structures, including the canonical state of NTSR1-Gi in detergent micelle (gray, PDB 6OS9), μOR-Gi (lime green; PDB 6DDE), Rho-Gi (hot pink; PDB 6CMO), A1R-Gi (cyan; PDB 6D9H), CB1-Gi (purple; PDB 6N4B) and DRD2-Gi (yellow; PDB 6VMS). The models are superposed on the Ras-like domain of Gα.
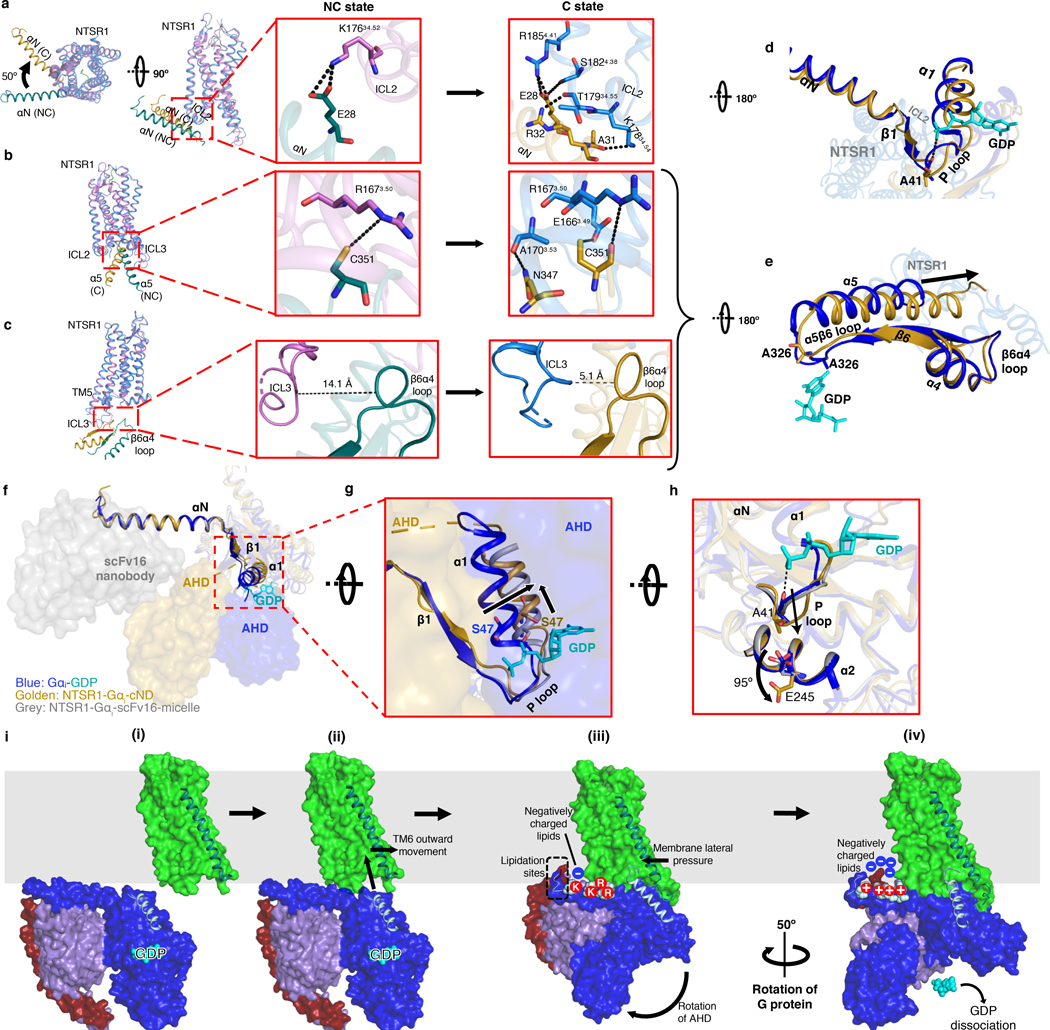
Fig. 4 |. Allosteric modulation of the GDP binding pocket by the NTSR1-Gi interaction.
a-c, Superposition between C-state NTSR1 (blue) and αN helix of Gα (gold) with the NC-state NTSR1 (orchid) and αN helix of Gα (dark cyan). Models are superposed on NTSR1. Overview (left) and zoomed-in views of the NC state (middle) and C state (right) are shown. a, ICL2-αN helix interactions. Compared to the NC state, the αN helix of Gα of the C state is rotated by 50°. b, NTSR1-α5 helix interactions. c, ICL3-α4β6 loop interactions. The backbones of ICL3 and α4β6 are closer in the C state and form interactions predicted by molecular dynamics simulations (Extended Data Fig. 12a). d, Intracellular view showing perturbation of the P-loop in the C state (gold) relative to the crystal structure of GDP-bound Gi (blue; GDP in cyan, PDB 1GP2). e, Intracellular view showing perturbation of the β6α5 loop in the C state (gold) relative to the structure of GDP-bound Gi (blue; GDP in cyan, PDB 1GP2). In d-e, the models are superposed on the Gα Ras-like domain. f, Structures of GDP-bound Gαi (blue; GDP in cyan, PDB 1GP2), NTSR1-bound Gαi in detergent (grey, PDB 6OS9) and NTSR1-bound Gαi in lipid bilayer (gold) showing the different locations of the AHD and the stabilizing antibody scFv16. The structures are superposed on αN-β1. g, Zoom-in view showing lateral displacement of α1 helix including S47 from the phosphates of GDP in NTSR1-Gi-cND. h, Rotation of the sidechain of E245 in NTS-NTSR1-Gi-cND (gold) by 95º compared to the GDP-Gi structure (blue, PDB 1GP2) to sterically accommodate the P-loop. This rotation is not observed in detergent (grey, PDB 6OS9). i, Model of the proposed insertion-rotation mechanism: (i) Lateral diffusion of NTSR1 and Gi in the membrane; (ii) Recognition of NTSR1 by Gi, allowing insertion of α5 into the open cavity of NTSR1; (iii) Formation of the NC state including displacement of the AHD; (iv) Formation of the C state following rotation of Gi.
As expected, the majority of NTSR1 is buried inside the lipid bilayer, including TM1–4 and TM7, the N-terminal half of TM5, and the C-terminal half of TM6. ICL2 and H8 are partially buried at the membrane surface (Extended Data Fig. 8c). Membrane burial of H8 is also observed in the DRD2-Gi ND structure19. To reveal the effects of the lipid bilayer on the GPCR, we compared our structures with the crystal structure of rat NTSR1 (X-rNTSR1, PDB 4XEE)33 and the cryo-EM structure of human NTSR1 in the canonical state (C-hNTSR1, PDB 6OS9)12 (representing structures of agonist-bound NTSR1 in detergent in the absence and presence of Gi, respectively). In lipid bilayers, the core of NTSR1 is more compact due to an inward movement of the middle of TM6 (Fig. 3d, Extended Data Fig. 9a), whereas X-rNTSR1 and C-hNTSR1 superpose well with each other (Extended Data Fig. 9b). Compression of TM6 is likely due to lateral pressure from the lipid bilayer. It is also possible in principle that the compression is caused by stabilization mutations in our construct (Extended Data Fig. 1b) but examination of structures of NTSR1 with very different mutations (PDB: 4BUO, 3ZEV, 4BWB) shows that these structures are virtually identical29. Additionally, only one of these mutations is in TM6 (H6.32R). This conservative mutation maintains hydrogen bonding with V7.56, suggesting that it has little impact on the overall position of TM6. Relative to the detergent structures, ICL2 and the cytoplasmic side of TM7 and H8 show an upward movement, indicative of membrane association (Fig. 3d, Extended Data Fig. 9a). Overall, the increased compaction and better membrane association of NTSR1 agrees with the improved thermostability observed in lipid bilayers (Fig. 1b, Extended Data Fig. 2g–h).
Upon insertion of the α5 helix of Gα into the core of NTSR1, the cytoplasmic side of TM5, TM6 and ICL3 move outward to accommodate the α5 helix (Fig. 3d). Structural and dynamical changes are also observed in 2D NMR experiments on 1H15N-NTSR1 upon binding to Gi in cNDs (Extended Data Fig. 3c). In the presence of the lipid bilayer, this movement appears to be more restricted than the large outward movement observed in detergent, potentially due to the lateral pressure from the lipid bilayer (Fig. 3e). The reduced movement of TM5 and TM6 relative to C-hNTSR1 maintains closer contacts with the α5 helix (Fig. 3e). Comparison of TM6 positions among class A GPCR-Gi complexes reveals that TM6 in the C-state NTSR1 exhibits closest proximity to the α5 helix, resulting in more potential interactions (Fig. 3f and Extended Data Fig. 9c). Taken together, these observations suggest that the lipid bilayer constrains the conformation of NTSR1 to enhance its interaction with Gi, agreeing with our observation of higher binding affinity in lipid bilayer (Fig. 1c).
The NTSR1-Gαi1β1γ1 interface
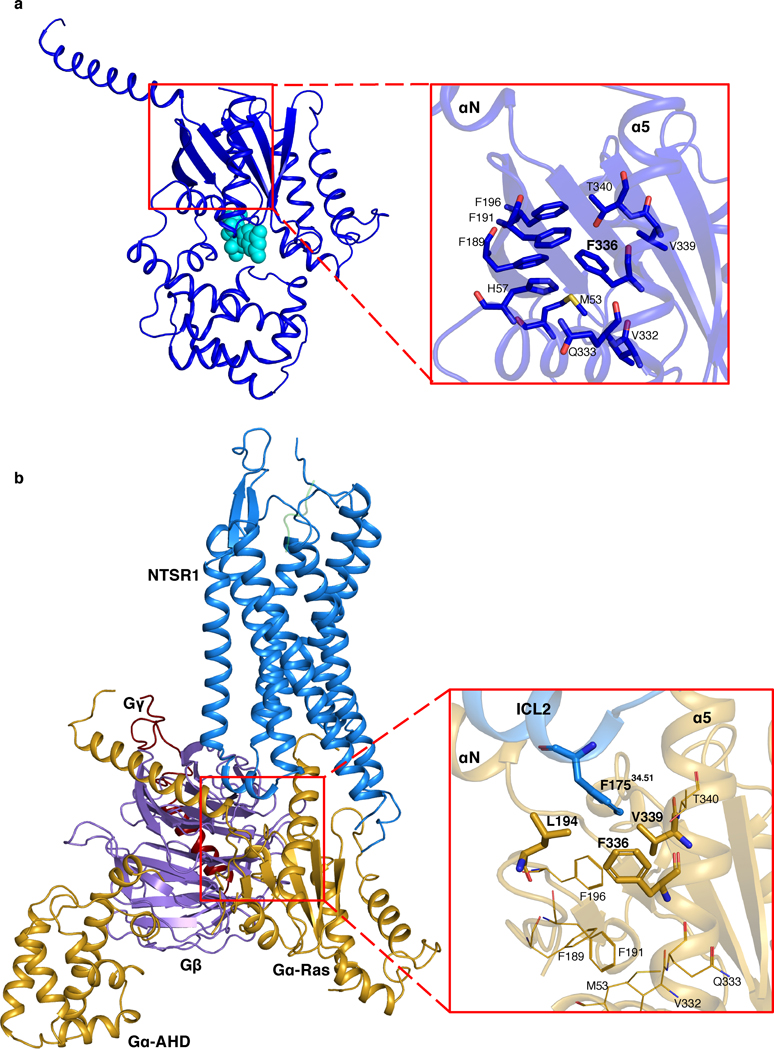
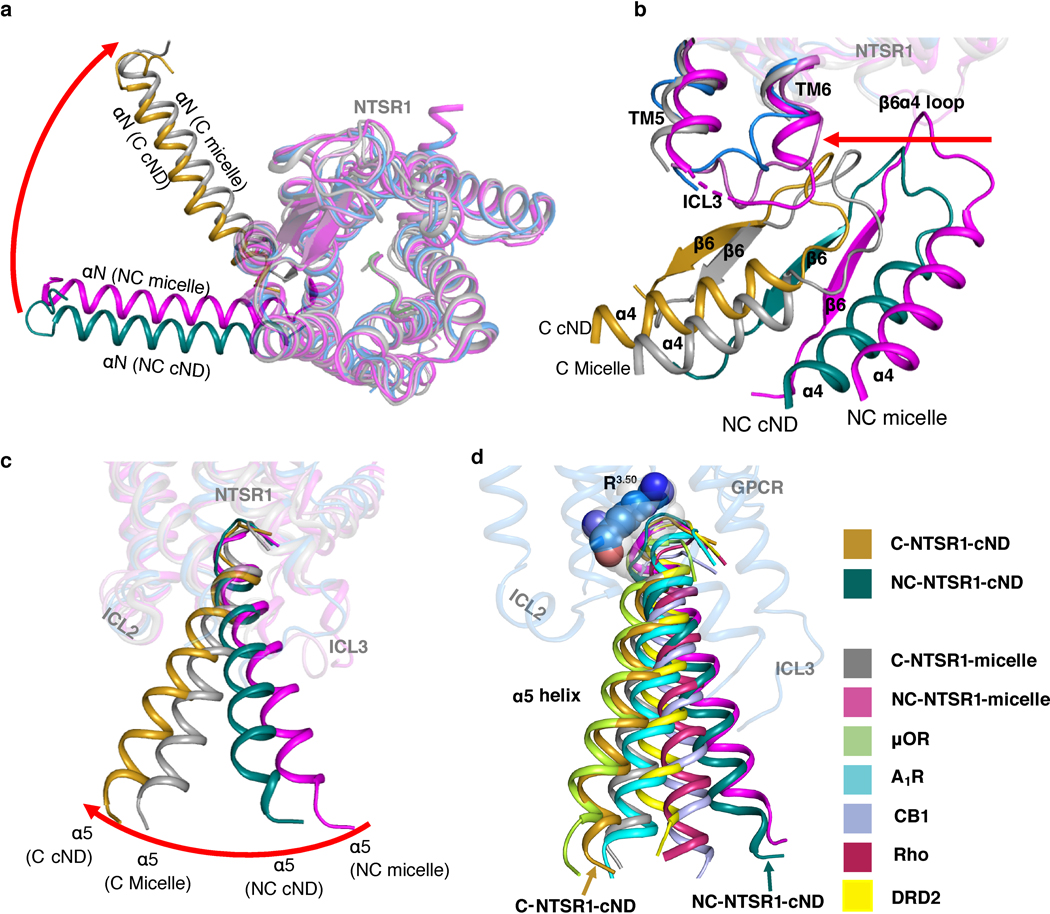
The C and NC states show different NTSR1-Gi interactions, with a total buried surface area of 1285 Å2 in the C state and 1185 Å2 in the NC state. The two states are related by a 50º rotation of Gi relative to NTSR1 (Fig. 4a). This change in orientation results in different interactions between the αN helix and ICL2. In the C state, a potential salt bridge is observed between E28 and R1854.41, as well as potential hydrogen bonds between E28 and S1824.38, R32 and T17934.55, and A31 and K17834.54 (Fig. 4a). In contrast, only one potential hydrogen bond (between R32 and T17834.55) is observed in C-hNTSR1 in detergent micelles12. These additional contacts with ICL2 in the presence of the lipid bilayer likely result from the closer proximity of the αN helix to the membrane and NTSR1 (Fig. 3c). In addition, the highly conserved bulky residue F17534.51 on ICL2 is found to be inserted into a hydrophobic pocket within Gαi involving residues F336 and V339 on α5 as well as L194 on β3 (Extended Data Fig. 10b). This interaction has been suggested to be important for GDP dissociation for secondary GPCR-Gi/o coupling, such as NTSR1-Gi34. Many of these interactions are absent in the NC state, where we observe only one potential salt bridge between E28 and K17634.52. Fewer contacts in the NC state suggest that it could be less stable than the C-state complex. These interactions are not observed in the NTSR1-β-arrestin1 complex structure35, implying an important role for ICL2 in transducer selectivity for downstream signaling.
The orientation of the α5 helix relative to NTSR1 is also different between the two states, although the depth of insertion is the same (Fig. 4b). Examination of multiple class A GPCR-Gi structures shows that it is common for α5 insertion to stop at R3.50 (Extended Data Fig. 11d). Thus, R3.50 might serve as both an interaction hot-spot and an “stopping point” that decides the depth of α5 insertion. In the C state, several potential hydrogen bonds are observed between α5 and NTSR1, including C351 with E1663.49, C351 with R1673.50, and N347 with A1703.53 (Fig. 4b). The interaction between N347 and A1703.53 is also observed in the C-hNTSR1 structure12. E1663.49 and R1673.50 belong to the highly conserved D/ERY motif. R1673.50 is found to be essential for downstream signaling (Extended Data Fig. 1a) and has been reported to be critical for GDP/GTP exchange through mutagenesis studies29. The NC state displays fewer interactions with only one possible hydrogen bond between C351 and R1673.50 (Fig. 4b).
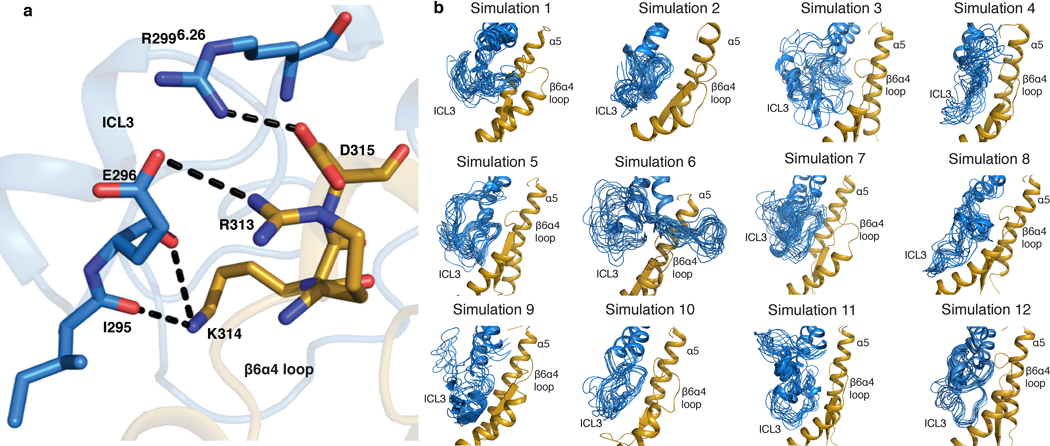
Rotation of Gi also results in the α4β6 loop moving closer to ICL3 in the C state than in either the NC state (Fig. 4c) or detergent structures (Extended Data Fig. 11b). Although the map quality of ICL3 prevents a detailed analysis, molecular dynamics simulations show potential salt bridges and hydrogen bonds forming between ICL3 and α4β6 loop in the C state (Extended Data Fig. 12). Similar interactions between ICL3 and the α4β6 loop have been observed in the structure of the adenosine A1 receptor (A1R)-Gαi2β1γ2 complex16.
Compared to detergent NTSR1-Gi structures, the cND structures in the current study have several additional interactions between Gi and NTSR1, namely between E28 and R1854.41, E28 and S1824.38, A31 and K17834.54, E28 and K17634.52, C351 with E1663.49. To verify the importance of these interactions, we mutated R1854.41, S1824.38, K17834.54, K17634.52, and E1663.49 to alanine and measured binding affinity in cNDs using microscale thermophoresis (MST). The 5-alanine mutant shows weaker binding than the unmutated construct (KD of 347 nM compared to 76 nM) (Extended Data Fig. 4e), suggesting that the additional interactions observed in the cND complex structure contribute to the higher binding affinity compared to the detergent structure.
Structural changes in the GDP-binding pocket of Gi
Comparison between the NTSR1-bound Gi and GDP-bound Gi (PDB 1GP2) shows structural changes in the GDP-binding pocket. This pocket consists of two loops: the β6α5 loop that binds the guanine ring of GDP, and the β1α1 loop (the P-loop) that binds the phosphates of GDP. In the presence of NTSR1, both loops adopt different conformations. The β6α5 loop moves away from GDP showing dissociation between A326 and the guanine ring (Fig. 4d). The P-loop that wraps around GDP in the GDP-bound Gi structure and the detergent NTR1-bound Gi structure un-wraps GDP in lipid bilayer showing dissociation between A41 and the β-phosphate of GDP. The displacement of the P-loop also appears sterically coordinate with a 95º rotation of the sidechain of E245 α2 (Fig. 4h). In addition, movement of α1 appears to be correlated with movement of the AHD to which it is tethered. The AHD-linked α1 moves both horizontally and vertically away from GDP, potentially displacing S47 from the phosphate of GDP (Fig. 4f–g). Similar changes are not observed in the detergent NTSR1-Gi complex structures (Fig. 4f–h). These observations, when combined with previously reported findings, allow us to propose a more complete mechanism for GDP release, as discussed below.
Discussion
An insertion-rotation model for Gi activation
Comparison of our two conformational states with one another and with previous structures allows us to propose a mechanism of G-protein activation in a lipid environment. The presence of more GPCR-Gi contacts in the C state than the NC state, suggests that the NC state might be an intermediate, lower-affinity state. This implies that in addition to the close proximity between GPCR and Gi regulated by lipid bilayer, a certain orientation of Gi relative to GPCR is also required to enable efficient complex formation. This is consistent with our kinetics experiments which showed both high (5.8 nM) and lower affinity (38 nM) binding modes (Fig. 1d and Extended Data Fig. 4). A sequential model was also proposed to link the states observed with scFv16-stabilized hNTSR1-Gi in detergent micelles12. Following this hypothesis, it appears that the interaction between NTSR1 and Gi goes through an insertion-rotation mechanism (Fig. 4i). NTSR1 and Gi first laterally diffuse in membrane until they meet. The cavity in NTSR1 allows insertion of the α5 helix into the open core of NTSR1. Subsequently, Gi rotates around α5 by approximately 50º, which maximizes protein-protein interactions (Fig. 4, Extended Data Fig. 11). The rotation stops when the α4β6 loop collides with ICL3, the αN-β1 hinge is caught by ICL2, the F336 hydrophobic pocket encircles F17534.51, and the α5 helix forms most contacts with the core of NTSR1, eventually leading to GDP dissociation. Alternatively, full insertion of the α5 helix in both states (Extended Data Fig. 11d) may happen after GDP dissociation, as it has been reported that changes in α5 conformation continues long after GDP release4. This flexible interaction between α5 and the core of NTSR1 might facilitate subsequent GTP association and downstream signaling.
A multipartite mechanism for GPCR-catalyzed nucleotide exchange
Based on comparison of our structures with the structure of GDP-Gi28, we propose a multipartite mechanism for receptor-catalyzed nucleotide exchange (Fig. 5) that is supported by prior functional studies. In the unbound G-protein, the nucleotide is buried between the Ras-homology domain (RHD) and the AHD of Gα. It has been suggested that when the G-protein encounters the receptor, the α5 helix is straightened and forms early interactions with the GPCR, which initiates the GDP release process36. The AHD dissociates from the RHD, and, as we show here, interacts with the outermost strands of Gβ (Extended Data Fig. 7a, b). Similar observations have also been reported for the rhodopsin-GT complex structure which shows stabilization of AHD by Gβ32. Previous computational simulations have shown that separation of the AHD is necessary (presumably to create an exit pathway for GDP) but not sufficient for rapid nucleotide release37,38. Here we observe that multiple allosteric pathways converge on structural rearrangements of the GDP binding site, and it is the combination of these pathways that are responsible GDP dissociation.
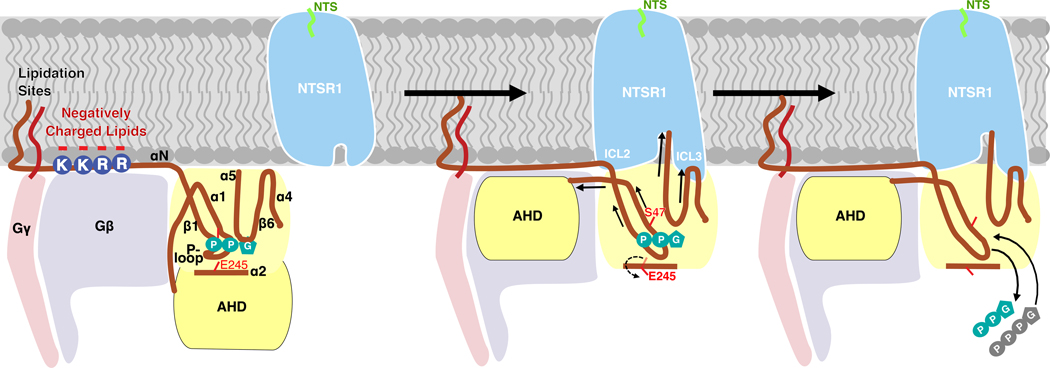
Fig. 5 |. Proposed mechanism of GDP release.
The interaction between Gi and NTSR1 leads to allosteric modulation of the GDP-binding site via three pathways: (1) Movement of the AHD to Gβ is correlated with movement of the directly linked α1. Movement of α1 results in its dissociation from the phosphate groups of GDP; (2) Interaction between ICL2 of NTSR1 and αN-β1 hinge of Gi perturbs the P-loop though β1, resulting in P-loop dissociation from the phosphate groups of GDP, which is coupled with a 95º rotation of the sidechain of E245 on α2; (3) Interactions between α5 and core of NTSR1 and between α4β6 loop and ICL3 pull the β6α5 loop away from the guanine ring of GDP. The transition of α5 increases α1 flexibility, resulting in dissociation of α1 from AHD and GDP. The multi-point coordination of these structural elements leads to dissociation of GDP from Gi. Release of GDP vacates the nucleotide-binding pocket for subsequent GTP binding, thus completing the GDP/GTP exchange process.
In the first pathway, insertion and rotation of the α5 helix into the core of NTSR1 by two helical turns compared to the GDP-Gi structure28 displaces the β6α5 loop, which is responsible for binding the guanine ring of GDP in the nucleotide-bound state (Fig. 4e). This is consistent with structural studies showing that the β6α5 loop perturbation induced by the rotational translation of α5 helix is essential for GDP dissociation5,6,8–18,32,39,40. As a result of this perturbation, A326 in the highly conserved TCAT motif moves away from its position in the GDP-Gi structure, resulting in loss of contact with GDP. This agrees with a previous mutagenesis study showing that A326 is essential for GDP binding41. The conformation of the α5β6 loop is different from that in the detergent structure, potentially as a result of the different angles with which the α5 helix inserts into NTSR1 (Extended Data Fig. 11c, d). This agrees with computational simulations in which the tilt angle of the α5 helix was found to directly correlate with the conformation of the β6α5 loop38. The new conformation of the β6α5 loop, and therefore the dynamics of GDP loss, may be affected by the neighboring interaction between ICL3 and the α4β6 loop (Fig. 4c, e, Extended data Fig. 12). Insertion of α5 also breaks the highly conserved hydrophobic pocket linking F336 on α5 with α1, β2 and β3 in the GDP-bound state (Extended Data Fig. 10a), while establishing a new hydrophobic network engaging the conserved bulky hydrophobic residue F17534.51 on ICL2 of NTSR1 (Extended Data Fig. 10b). As reported previously, this structural transition could increase the flexibility of α1, which destabilizes its interaction with both the GDP and AHD, contributing to domain opening and GDP dissociation4,42,43.
In the second pathway, displacement of AHD is likely coordinated with movement of the α1 helix to which it is tethered (Fig. 4f, g). This lateral movement causes residues within α1, including S47, to dissociate from the phosphate group of GDP (Fig. 4f, g). The S47N mutation is dominant-negative10, suggesting that this movement is a key step towards GDP release. Furthermore, previous mutagenesis44, hydrogen-deuterium exchange mass spectrometry (HDX)39 and computational45 studies have all suggested that perturbations in α1 play important roles in accelerating GDP dissociation.
In the third pathway, the interaction between ICL2 of NTSR1 and the αN-β1 hinge, including a potential salt bridge between E28 and R1854.41, several potential hydrogen bonds between E28 and S1824.38, R32 and T17934.55, and A31 and K17834.54 (Fig. 4a), propagates through the β1 strand and perturbs the GDP phosphate-binding P-loop (β1α1 loop) (Fig. 4d). P-loop perturbation by the αNβ1-ICL2 interaction is also supported by previous structural6,14,15 and HDX39 studies. This perturbation results in a displacement of the P-loop, breaking the interaction between the mainchain of residue A41 and the β-phosphate of GDP (Fig. 4d). To sterically accommodate the displaced P-loop, the sidechain of E245 on α2 has rotated by 95º (Fig. 4h). This implies a coupling of P-loop disorder with E245 rotation in the GDP dissociation process, and conversely a role for E245 in maintaining a stable GDP-bound G protein conformation, which coincides with the E245A mutant having a dominant negative effect16,41. This rotation is not observed in the detergent-embedded NTSR1-Gi structure, and the P-loop adopts a conformation more similar to the one observed in the GDP-Gi structure28 (Fig. 4h). In contrast to the NTSR1-Gi complex structures, the P-loop of the recently reported β1AR-Gs complex structure is more disordered, which also leads to GDP dissociation. The different patterns of P-loop perturbation upon GPCR-G protein interaction could be due to different G protein types.
Together, this multi-point coordination mechanism leads to dissociation of GDP from Gi and the creation of a free nucleotide binding pocket for GTP association (Fig. 5).
Understanding the structural basis for the interaction between GPCRs and G-proteins under physiological conditions has been challenging due to the poor stability of the complexes in detergent micelles. Most of the published structures required antibodies/nanobodies and/or engineered G proteins for additional stability, which rendered the complexes incapable of GDP/GTP exchange. Using our recently developed covalently circularized nanodiscs27, we have determined two structures, representing different conformational states, of the NTS-NTSR1-Gαi1β1γ1 complex in a lipid bilayer without the need for external stabilization. These structures identified several additional interaction hot-spots between NTSR1 and Gi as compared to the detergent structures, explaining the observation of tighter binding and more stable NTSR1-Gi complex in lipid bilayer as compared to in detergent micelles. The lateral movement of TM6, which is considered a signature of active receptors in detergents, is found to be restricted by the membrane, highlighting the importance of the membrane in modulating the dynamics of GPCR-G protein interactions and the affinity between NTSR1 with Gi. Additionally, a combination of hydrophobic and electrostatic interactions between the lipid bilayer and Gi is uncovered, suggesting the importance of membrane-Gi interaction in NTSR1-Gi complex formation. The absence of stabilizing antibody/nanobody enabled observation of unconstrained AHD movement, which contributes to a more complete view of the complex GDP dissociation mechanism. Our structures also revealed several conformational changes in the GDP binding pocket that are absent in the detergent structures, allowing us to unravel the interconnected roles of NTSR1-Gi interaction, membrane-protein interaction and G-protein activation in the GDP dissociation process. The proposed multipartite allosteric mechanism of GDP release reveals a competition between GDP and NTSR1 for binding Gi. This observation agrees with a previous NMR study showing that the interaction between NTSR1 and Gα is strongest when Gα is nucleotide free46. Our study therefore provides new insights into the signal transduction process triggered by GPCR-G protein complex formation and will serve as a model for future studies of GPCR signaling in lipid bilayers.
Methods
No statistical methods were used to predetermine sample size. The experiments were not randomized and the investigators were not blinded to allocation during experiments and outcome assessment.
Preparation of NTSR1 in cNDs
Expression and purification of a thermostable variant of rat NTSR1 (TM86V-L167R ΔIC3B) was performed as described previously with some modifications29,47. This NTSR1 variant consists of residues G50-G390, contains a deletion of E273-T290 in intracellular loop (ICL) 3, and has ten stabilizing mutations (Extended Data Fig. 1b). Briefly, the full-length fusion protein consisting of maltose-binding protein (MBP), NTSR1, and thioredoxin (TrxA) was expressed in Tuner™ (DE3) Competent Cells (Novagen) in LB medium at 37 ºC, 200 rpm and induced at an OD600 of 0.75 with 1 mM IPTG. Cells were grown for another 24 hours at 20 °C, 160 rpm and harvested by centrifugation (5,000 × g, 30 min, 4 °C). Cells were then lysed and solubilized by sonication in buffer containing 100 mM HEPES (pH 8.0), 20% glycerol, 400 mM NaCl, 2.5 mM MgCl2, 0.6/0.12% CHAPS/cholesterol, 1.7% n-decyl-β-D-maltopyranoside (DM), 100 mg lysozyme, one tablet of protease inhibitor, and 250 U benzonase. Cell lysate was centrifuged, and the supernatant was mixed with pD-NT resin47 pre-equilibrated with 25 mM HEPES (pH 8.0), 10% glycerol, 600 mM NaCl and 0.5% DM at 4 °C for 1 hour. The flow-through from the pD-NT resin was then discarded, and the resin was washed with 25 mM HEPES (pH 7.0), 10% glycerol, 150 mM NaCl, 2 mM DTT and 0.3% DM. The resin was then mixed with 3C protease for 1 hour at 4 °C to cleave off MBP and TrxA from NTSR1, as well as NTS-NTSR1 from pD resin47. The resin was washed with 10 mM HEPES (pH 7.0), 10% glycerol, 2 mM DTT and 0.3% DM, which was combined with the flow-through and loaded onto a SP cation exchange chromatography column (GE Healthcare) pre-equilibrated in the same washing buffer. The SP column was washed with 10 mM HEPES (pH 7.7), 10% glycerol, 35 mM NaCl, 2 mM DTT and 1% diheptanoylphosphatidylcholine (DH7PC), and then eluted with 10 mM HEPES (pH 7.7), 10% glycerol, 350 mM NaCl, 2 mM DTT and 0.2% DH7PC. The eluate was concentrated to below 500 μL and subjected to size-exclusion chromatography on a Superdex 200 10/300 Increase Analytical (S200a) column (GE Healthcare) equilibrated with 10 mM HEPES (pH 7.7), 150 mM NaCl, 2 mM DTT, 0.1% DH7PC and 0.1 μM NT. Fractions containing NTSR1 were collected and mixed with a 3:2 molar ratio of 1-Palmitoyl-2-oleoyl-phosphatidylcholine (POPC) to 1-palmitoyl-2-oleoyl-phosphatidylglycerol (POPG) solubilized in 100 mM sodium cholate at a NTSR1:lipid molar ratio of 1:160. The mixture was incubated on ice for 30 min before addition of cNW9 at a cNW9:NTSR1 molar ratio of 4:1 followed by another 30 min incubation on ice. The mixture was then treated with 5% volume of Bio-Bead SM-2 resin (Bio-Rad) with shaking on ice for 15 min, followed by addition of another 20% volume of Bio-Beads every 20 min for detergent removal. After two-hour incubation with Bio-Beads, the flow-through was then subjected to size-exclusion chromatography with a S200a column equilibrated in 20 mM sodium phosphate (pH 6.9), 50 mM NaCl, 1 mM DTT, 0.5 mM EDTA, 0.1 μM NT. Fractions containing NTSR1-cND were concentrated to below 500 μL and incubated at 42 °C for 24 hours, followed by filtration through 0.22 μm cut-off filters. The flow-through was subjected to another round of size-exclusion chromatography. Fractions were pooled, concentrated and stored at 4°C.
Preparation of Gαi1β1γ1 in micelles and cNDs
G protein composed of Gαi1, Gβ1 and Gγ1 was expressed and purified as detailed before29,48. Briefly, Spodoptera frugiperda (Sf9) were grown in suspension in ESF921 medium (Expression Systems, California), infected at a density of 2–3 × 10⁶/mL with a single baculovirus encoding all three subunits (Gαi1β1γ1), harvested within 72 hours post inoculation, and stored at −80 ºC until use.
Cells were lysed in 10 mM HEPES (pH 7.4), 20 mM KCl, 10 mM MgCl2, 10 μM GDP, 2 mM β-mercaptoethanol (β-ME), and 1 protease inhibitor tablet with sonication. The suspension was then ultra-centrifuged at 180,000 × g for 45 min at 4 ºC. The membrane pellet was solubilized in 50 mM HEPES (pH 7.4), 150 mM NaCl, 10 mM MgCl2, 10 μM GDP, 2 mM β-ME, 10% glycerol, 1 protease inhibitor tablet, 1.2% DM at 4 ºC for 3 hours. The suspension was ultra-centrifuged again and the supernatant was purified through Ni-NTA resin. The eluate was concentrated and run through a Superdex 200 prep 16/60 column (S200p; GE Healthcare) equilibrated in 20 mM HEPES (pH 7.4), 100 mM NaCl, 0.1 mM MgCl2, 4 mM β-ME, and 0.5% DM. Fractions containing Gαi1β1γ1 were pooled and concentrated to 10 mg/mL, flash-frozen in liquid nitrogen and stored at −80 ºC.
Gαi1β1γ1-cNDs were prepared similarly as for NTSR1-cNDs. After Bio-Bead removal, the Gαi1β1γ1-cNDs were purified through Ni-NTA to remove empty cNDs, followed by S200a chromatography to remove aggregates. Fractions containing pure Gαi1β1γ1-cNDs were collected, concentrated, and stored at 4°C.
Complex formation of NTS-NTSR1-Gαi1β1γ1 in cNDs
Purified Gαi1β1γ1 in micelle was diluted in buffer A (20 mM HEPES (pH 6.9), 50 mM NaCl, 5 mM CaCl2, 1 mM DTT, 0.1 μM NT) until the DM concentration dropped below 0.08% (the critical micelle concentration of DM), and mixed with NTSR1-cND at 1:1 molar ratio. The mixture was incubated on ice for 30 min, followed by addition of Bio-Beads at 10% volume every 30 min. The mixture was incubated on ice with shaking for a total of 2 hours and then the Bio-Beads were removed. Apyrase, diluted with buffer A and pretreated with Bio-Beads for 30 min on ice, was added to the complex at 1 U/mL concentration. The mixture was incubated at 4 ºC overnight, and then subjected to a S200a SEC column equilibrated in 20 mM sodium phosphate (pH 6.9), 50 mM NaCl, 1 mM DTT, 0.5 mM EDTA, 0.1 μM NT. Peak fractions were characterized with SDS-PAGE and negative-stain EM. The fractions containing NTS-NTSR1-Gαi1β1γ1 in cNDs were used for cryo-EM structure determination.
Circular Dichroism (CD) spectroscopy
CD spectra were measured on a JASCO J-815 spectropolarimeter equipped with a Peltier cell temperature controller. Both spectrum scan measurement and variable temperature measurement were carried out for the following samples: NTSR1 in DH7PC micelles, NTSR1-cNDs, Gαi1β1γ1 in DH7PC micelles, Gαi1β1γ1-cNDs, NTSR1-Gαi1β1γ1 in LMNG/GDN/CHS micelles (0.00375% LMNG, 0.00125% GDN and 0.000375 CHS) and NTSR1-Gαi1β1γ1 in cNDs. Spectrum scan measurements were performed at 20 ºC, before and after variable temperature measurements, collecting data from 260 nm to 190 nm. Variable temperature measurements were carried out at 220 nm increasing temperature from 20 ºC to 95 ºC at a rate of 1 ºC/min. Spectrum Manager 2 software was used to analyze the transition temperature for each sample.
Binding affinity and kinetics measurement
Binding affinity and kinetics between NTSR1 and Gαi1β1γ1 in detergent micelles and cNDs were measured using MicroScale Thermophoresis (MST) and Biolayer Interferometry (BLI).
For MST, the measurements were performed on a Monolith NT.115 system (NanoTemper Technologies). We measured the fluorescence signal from Gαi1β1γ1 by using the Monolith His-Tag Labeling Kit RED-tris-NTA 2nd Generation kit (NanoTemper Technologies). The samples were prepared in a buffer containing 20 mM sodium phosphate (pH 6.9), 50 mM NaCl, 0.05% DH7PC for cND titrations and 0.2% DH7PC for titrations in detergent micelle. The concentration of DH7PC for cND titrations is below its critical micellar concentration. The experiments were carried out as fast as possible (within 1–2 minute for sample preparation) to prevent degradation of Gαi1β1γ1. The concentration of Gαi1β1γ1 was constant at 10 nM. NTS-NTSR1 in DH7PC, NTS-NTSR1-cND, or empty cND was titrated in two-fold dilution steps beginning at 4 μM. For the measurement the samples were filled into premium-coated capillaries. The measurement was performed at 2 % LED and 20 % MST power, 30 sec Laser-On, and 5 sec Laser-Off. Fluorescence was excited at 605–645 nm, and emission was detected at 680–685 nm. The results were analyzed using the MO Affinity Analysis software (NanoTemper Technologies). The dissociation constant (KD) was then determined using a single-site model for data fitting. Two independent biological samples were used for the measurement in POPC/POPG (3/2) cND, detergent micelles, POPC cND, POPG cND and the Alanine mutant TM86V-L167R (E66A/K176A/K178A/S182A/R185A) in POPC/POPG (3/2) cND, each with three technical repeats. One biological sample was used for the measurement in POPC/POPG/CHS (3/2/0.3) cND with three technical repeats. Two biological samples were used for measurement in empty POPC/POPG (3/2) cND.
BLI experiments were performed on an Octet RED384 (ForteBio, California) using Anti-His antibody-coated Dip and Read Biosensors (HIS1, ForteBio) and 384 well plates (ForteBio) with 60 μL volume. 500 nM of His-tagged Gαi1β1γ1 was bound for 5 min in a binding buffer consisting of 20 mM HEPES (pH 7.4), 100 mM NaCl, 0.1 mM MgCl2, 4 mM β-ME, and 0.5% DM. To test for nonspecific binding of His-tagged Gαi1β1γ1, reference tips were incubated in buffer alone. The tips were washed with buffer for 2 min to obtain a baseline reading and then transferred to wells in various concentrations of NTS-NTSR1-cND (4, 2, 1, 0.5, 0.25 μM) in buffer containing 20 mM sodium phosphate (pH 6.9), 50 mM NaCl, 1 mM DTT, 0.5 mM EDTA, 0.1 μM NT for 5 min. After measuring the association phase, tips were moved to wells containing buffer with and without GTPγS, and dissociation was measured for 5 min. The data were processed and analyzed using the Octet data analysis software version 11.0 (ForteBio). Association-dissociation curves for each concentration were fit to a 2:1 model. Three independent biological samples were used for the measurement of NTSR1-Gi binding in cNDs. Two independent biological samples were used for the measurement of GTPγS dissociation and empty cND-Gi binding.
Nuclear Magnetic Resonance (NMR) spectroscopy
Uniformly 15N-labeled NTS-NTSR1 in POPC/POPG (3:2) cNW9 nanodiscs at 200 μM alone and in complex with unlabeled Gαi1β1γ1 at a molar ratio of 5:1 were prepared as described above in NMR buffer (20 mM sodium phosphate (pH 6.9), 50 mM NaCl, 1 mM DTT, 0.5 mM EDTA, 10% D2O). Two-dimensional Transverse Relaxation Optimized Spectroscopy (TROSY) Heteronuclear Single Quantum Coherence (HSQC) were collected with 2000 scans, 200 increments at 45 °C on a Bruker 800-MHz spectrometer equipped with a TXO cryogenic probe. TROSY HSQC measurements were repeated for NTS-NTSR1-cND on an Agilent 700-MHz spectrometer to verify that NTS-NTSR1-cND stays intact after long data acquisition in the magnet at 45 ºC. Data were processed using the NMRPipe software package49.
Functional Assay
Ligand-induced IP1 (a metabolite of IP3) accumulation was measured in transiently transfected HEK293T/17 cells as described before50. Wild type rNTSR1 or mutants thereof were directly sub-cloned into a mammalian expression vector containing an N-terminal SNAP-tag (pMC08). Twenty-four hours after transfection, cells were washed with PBS, detached with Trypsin-EDTA (Sigma) and resuspended in assay buffer (10 mM HEPES pH 7.4, 1 mM CaCl2, 0.5 mM MgCl2, 4.2 mM KCl, 146 mM NaCl, 50 mM LiCl, 5.5 mM glucose, 0.1% (w/v) BSA). Cells were seeded at 20,000 cells per well in white 384-well plates (Greiner) and incubated for 2 hrs at 37 °C with a concentration range of NTS8–13 (Anawa) diluted in assay buffer. IP1 accumulation was measured using the HTRF IP-One kit (Cisbio) according to the manufacturer’s protocol. To confirm cell surface expression of NTSR1 and its mutants, transfected cells were plated on poly-D-lysine treated 384-well plates (Greiner) at 20,000 cells/well in growth medium. The following day, medium was removed and cells were incubated with 50 nM SNAP-Lumi4-Tb (CisBio) in labelling buffer (CisBio) for 2 hrs at 37 °C. Thereafter, cells were washed 4 times with wash buffer (20 mM HEPES pH 7.5, 100 mM NaCl, 3 mM MgCl2 and 0.2% (w/v) nonfat milk). Fluorescence intensity of Tb3+-labelled receptors was measured on an Infinite M1000 fluorescence plate reader (Tecan) with an excitation wavelength of 340 nm and emission wavelength of 620 nm. To generate concentration-response curves, data were normalized to receptor expression at the cell surface and to response of NTSR1 at maximal ligand concentration and were analysed by a non-linear curve fit in GraphPad Prism.
Negative-stain electron microscopy
Three microliters of NTS-NTSR1-Gαi1β1γ1-cND complex at a concentration of 0.02 mg/mL was applied onto a glow-discharged continuous carbon grid (Electron Microscopy Sciences, Inc.). After two minutes of adsorption, the grid was blotted with filter paper to remove the excess sample, immediately washed twice with 50 μL of MiliQ water, once with 50 μL 0.75% uranyl formate solution and incubated with 50 μL of 0.75% uranyl formate solution for an additional one minute. The grid was then further blotted with filter paper followed by vacuum aspiration to remove excess stain, and finally examined with a Tecnai T12 electron microscope (Thermo Fisher Scientific) equipped with an LaB6 filament and operated at 120-kV acceleration voltage, using a nominal magnification of 52,000× at a pixel size of 2.13 Å.
Cryo-EM sample preparation
Cryo-EM grids were prepared using a Vitrobot Mark IV (Thermo Fisher Scientific). Three microliters of NTS-NTSR1-Gαi1β1γ1-cND at a concentration between 1.5 mg/mL to 1.7 mg/mL was applied onto glow discharged C-flat holy carbon grids (R1.2/1.3, 400 mesh copper, Electron Microscopy Sciences) or Quantifoil holy carbon grids (R1.2/1.3, 400 mesh gold, Quantifoil Micro Tools). The grids were blotted for 7.5 s with a blot force of 16 and 100% humidity before being plunged into liquid ethane cooled by liquid nitrogen.
Cryo-EM data collection
Images of NTS-NTSR1-Gαi1β1γ1-cND were acquired on Titan Krios I at the Harvard Cryo-EM Center for Structural Biology equipped with a BioQuantum K3 Imaging Filter (slit width 20 eV) and a K3 direct electron detector (Gatan) and operating at an acceleration voltage of 300 kV. Images were recorded at a defocus range of −1.2 μm to −2.5 μm with a nominal magnification of 105,000×, resulting in a pixel size of 0.825 Å. Each image was dose-fractionated into 38 movie frames with a total exposure time of 1.5 s, resulting in a total dose of ~57 electrons per Å2. SerialEM was used for data collection51.
Image processing
A total of 23,677 movie stacks, which were collected during two sessions, were motion corrected and electron-dose weighted using MotionCor2 (ref.52). Parameters of the contrast transfer function were estimated from the motion-corrected micrographs using CTFFIND4 (ref.53). To generate a reference, particles from 10 micrographs were picked manually in EMAN2.2 (ref.54), crYOLO55 was then trained for picking particles automatically. All subsequent 2D and 3D analyses were performed using RELION-3.0 or RELION-3.1-beta56.
1,726,457 particles were selected after several rounds of 2D classification from 4,367,542 auto-picked particles. Density map of the human NTSR1 in complex with the agonist JMV449 and the heterotrimeric Gi1 protein (EMDB-20180)12 was low-pass filtered to 20 Å and used as the initial model for the first round of 3D classification, yielding five different classes. Two classes of the NTS-NTSR1-Gαi1β1γ1-cND complex were relatively better resolved and particles from these two classes were subject to 3D refinements. Bayesian polishing was then performed, followed by 3D refinement and post-processing, yielding two density maps at resolutions of 4.3 Å (canonical state) and 4.5 Å (noncanonical state), respectively. To further improve the resolution of the core of the complex, masks excluding the nanodisc and the AHD were applied during the 3D refinement, yielding the 4.1 Å (canonical state) and 4.2 Å (noncanonical state) density maps, respectively. Per-particle CTF refinement was performed but did not lead to an improvement in map resolution or quality.
Model building and refinement
The crystal structures of NTS-NTSR1 complex (PDB: 4BUO)29 and G protein heterotrimer Gαi1β1γ2 (PDB: 1GP2)28 and the cryo-EM structure of GαTβ1γ1 (PDB: 6OY9)57 were fitted into the density map of the canonical NTS-NTSR1-Gαi1β1γ1-cND complex using the Fit in Map function of Chimera58. The αi1β1 subunits of Gαi1β1γ2 and γ1 subunit of GαTβ1γ1 were merged with the NTS-NTSR1 structure and the amino acids were modified in Coot version 0.9-pre to match our constructs59. The amino acids F291-R299 of NTSR1 of the canonical state were mutated to poly-alanine due to the lack of sidechain densities. The model was manually adjusted and refined in Coot with torsion, planar peptide, trans peptide and Ramachandran restraints applied. For the noncanonical state, the subunits of the refined atomic model of the canonical state were fitted into the density map as separate rigid bodies. The model was manually adjusted and refined in Coot. For both states, the AHD was extracted from the crystal structure of the human Gαi1 (PDB: 3UMR) and docked into the density as a rigid body using Chimera.
Models were refined with Phenix.real_space_refine60. The AHD was not refined due to the lack of sidechain information for this domain. During refinement, the resolution limit was set to match the map resolution determined by the FSC=0.143 criterion in post-processing. Secondary structure, Ramachandran, rotamer, and reference restraints from the JMV449-NTSR1-Gi-scFv16 complex (PDB 6OS9)12 were applied throughout refinement. The final models were validated using MolProbity v.4.3.1 (ref.61) with model statistics provided in Table S1.
Molecular dynamics simulations
The molecular system for the molecular dynamics (MD) simulations was prepared based on the canonical state structure of NTS-NTSR1-Gαi1β1γ1-cND which was preprocessed with Maestro from Schrödinger62,63. Bond orders were assigned, hydrogens added, disulfide bonds created, and het states generated at pH 7.0±2.0. The sidechains of residues 291 to 299 were assigned and the truncated residues 273 to 290 in NTSR1 construct were added with the Crosslink Proteins tool of Maestro62,63.
The membrane and solvent environment, as well as the input files for Amber were generated using the Membrane Builder tool of CHARMM-GUI64,65. The terminal groups of each chain were patched with standard N-terminus and C-terminus patch residues, except for the N-terminus of Gα for which a GLYP patch residue was used. For orienting the complex appropriately, the PPM (Positioning of Proteins in Membrane) server of the OPM (Orientations of Proteins in Membranes) database was used66. A lipid bilayer containing a total of 527 lipids, composed of a 3:2 molar ratio of POPC to POPG, was added to the aligned complex with Membrane Builder64,65. A rectangular solvation box was added by adding water layers of at least 22.5 Å above and below the membrane. The system was ionized and neutralized by adding 50 mM of sodium and chloride ions. The resulting system contained a total of 286,109 atoms.
In total, 12 simulations of the prepared system were run using Amber18 (ref.67). The Amber FF14SB68 and Amber Lipid17 (ref.69) force fields were used for the proteins and the lipid bilayer, respectively. The TIP3P model70 was used for the water molecules. During the energy minimization, 2500 steps of steepest descent followed by 2500 steps of conjugate gradient were carried out. The equilibration steps were carried out according to the standard Membrane Builder protocols71. The production MD simulations were carried out at 310 K and 1 bar in an NPT ensemble using a Monte Carlo barostat and a Langevin thermostat. The cutoff for the nonbonded interactions was set to 10 Å, and the particle mesh Ewald method was used for the long-range electrostatic interactions. Hydrogen mass repartitioning was enabled, and a time step of 4 fs applied. Postprocessing was carried out with AmberTools 18 and VMD 1.9.4 (ref.67) The simulation lengths of the runs were between 600 ns and 1 μs.
Extended Data
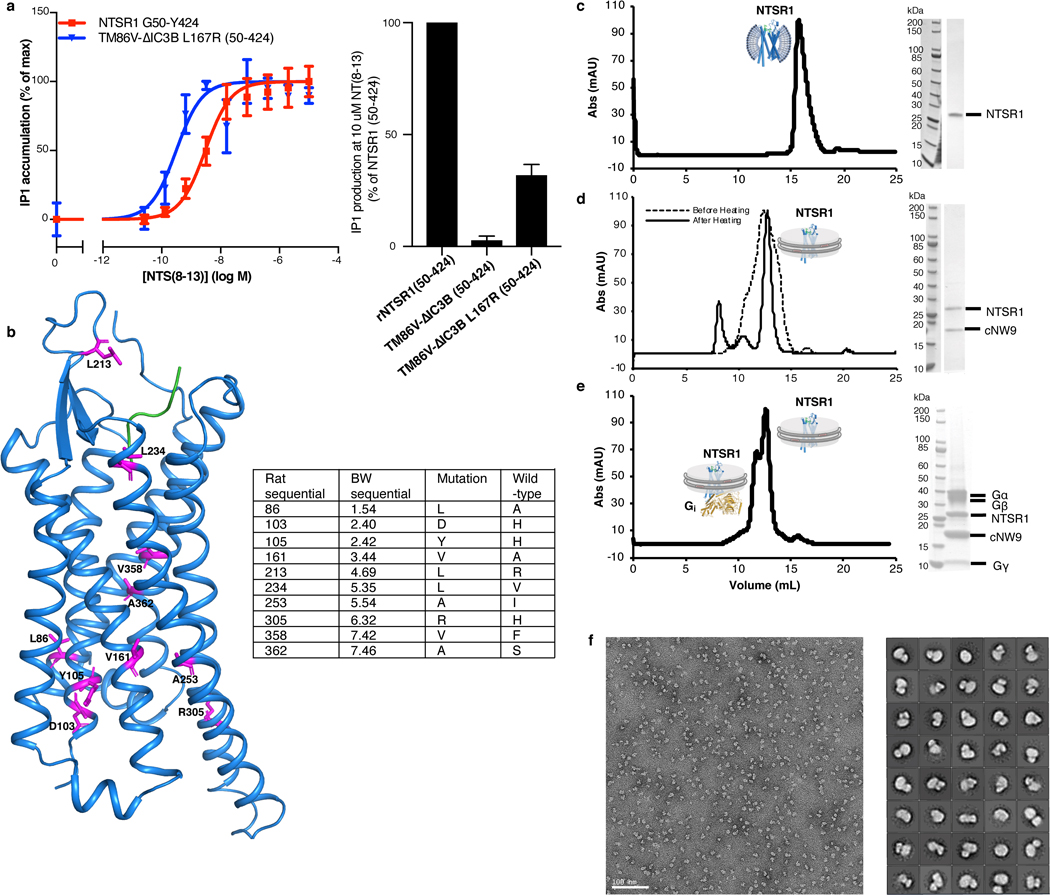
Extended Data Fig. 1 |. Signaling competency and preparation of NTS-NTSR1-Gi complex in cNDs.
a, Signaling competency of NTSR1 constructs. Wild-type NTSR1 (50–424) or NTSR1 variants were transiently transfected into HEK293T/17 cells, and activation of Gαq signaling was quantified by measuring of inositol-1-phosphate (IP1) accumulation after stimulation with NTS8–13. Data were normalized to receptor expression at the cell surface and represented as mean ± SEM of 4 independent experiments performed in duplicate. Left, dose dependent IP1 production expressed as percentage of IP1 accumulation at maximal ligand concentration. Fitting of the curves result in EC50 of 2.7 nM for wild-type NTSR1 and 0.22 nM for TM86V ΔIC3B L167R. Right, bar graph showing IP1 production level at 10 μM agonist NTS8–13. The NTSR1 variant TM86V ΔIC3B lacking the L167R back mutation exhibits no IP1 production, suggesting the critical role of R1673.50 in signal transduction. b, Residues mutated in the TM86V-L167R construct shown as magenta sticks on the left and listed in the table on the right. c-e, Size-exclusion chromatograms and corresponding SDS-PAGE gels for (c) NTSR1 in DH7PC detergent micelles, (d) NTSR1 in POPC/POPG cNW9 nanodiscs before (dashed line) and after (solid line) heating, and (e) NTSR1-Gi complex in POPC/POPG cNW9 nanodiscs. f, Fractions corresponding to the NTS-NTSR1-Gi complex in (e) were analyzed by negative-stain EM, and then used for cryo-EM structure determination. Left, representative negative-stain EM micrograph of NTS-NTSR1-Gi complexes in cNDs. Right, 2D class averages.
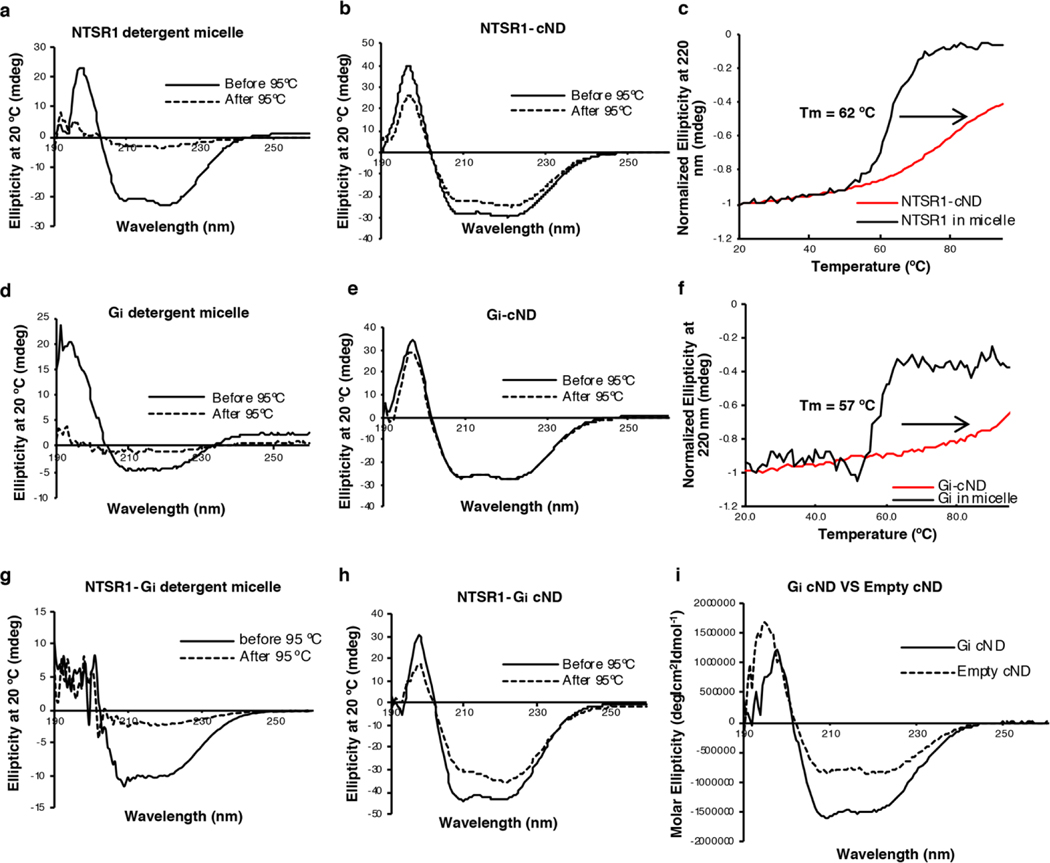
Extended Data Fig. 2 |. Thermostability enhancement of NTSR1, Gi, and NTSR1-Gi complexes by incorporation into cNDs.
a-b, Circular Dichroism (CD) spectra at 20 ºC before (solid line) and after (dashed line) treatment at 95 ºC of (a) NTSR1 in DH7PC detergent micelles; (b) NTSR1 in cNDs. c, Temperature-dependent CD signals of NTSR1 in detergent micelles (black) and cNDs (red) at 220 nm. d-e, CD spectra at 20 ºC before (solid line) and after (dashed line) treatment at 95 ºC of (d) Gi in DH7PC detergent micelles; (e) Gi in cNDs. Gi was reconstituted into cNDs by incubation with POPC/POPG lipid, cNW9, and cholate, followed by detergent removal and size-exclusion chromatography. f, Temperature-dependent CD signals of Gi in detergent micelles (black) and cNDs (red) at 220 nm. The melting temperature (Tm) of cNDs is 93 ºC (data not shown) and therefore does not affect transitions before this temperature. g-h, CD spectra at 20 ºC before (solid line) and after (dashed line) treatment at 95 ºC of (g) NTSR1-Gi in LMNG/GDN/CHS detergent micelles; (h) NTSR1-Gi in cNDs. i, CD spectra of 2 μM Gi-cND (solid line) and 2 μM empty cND (dashed line), showing nearly 50% signal contribution from Gi. NTSR1 and Gi account for at least 50% of CD signals even in the presence of cNDs. NTSR1 in detergent micelles irreversibly unfolds during temperature increase with a Tm of 62 ºC. In contrast, NTSR1-cND changes structure around 80 ºC and does not lose much secondary structure after decreasing temperature to 20 ºC. Similar observations were made for Gi, where the protein irreversibly and completely unfolds with Tm of 57 ºC in detergent micelles but displays no clear transition temperature in cNDs. For the NTSR1-Gi complex in cND, only mild unfolding was observed around 82 ºC. These observations indicate that lipid bilayers improve the stability of NTSR1, Gi and NTSR1-Gi complexes relative to detergent micelles.
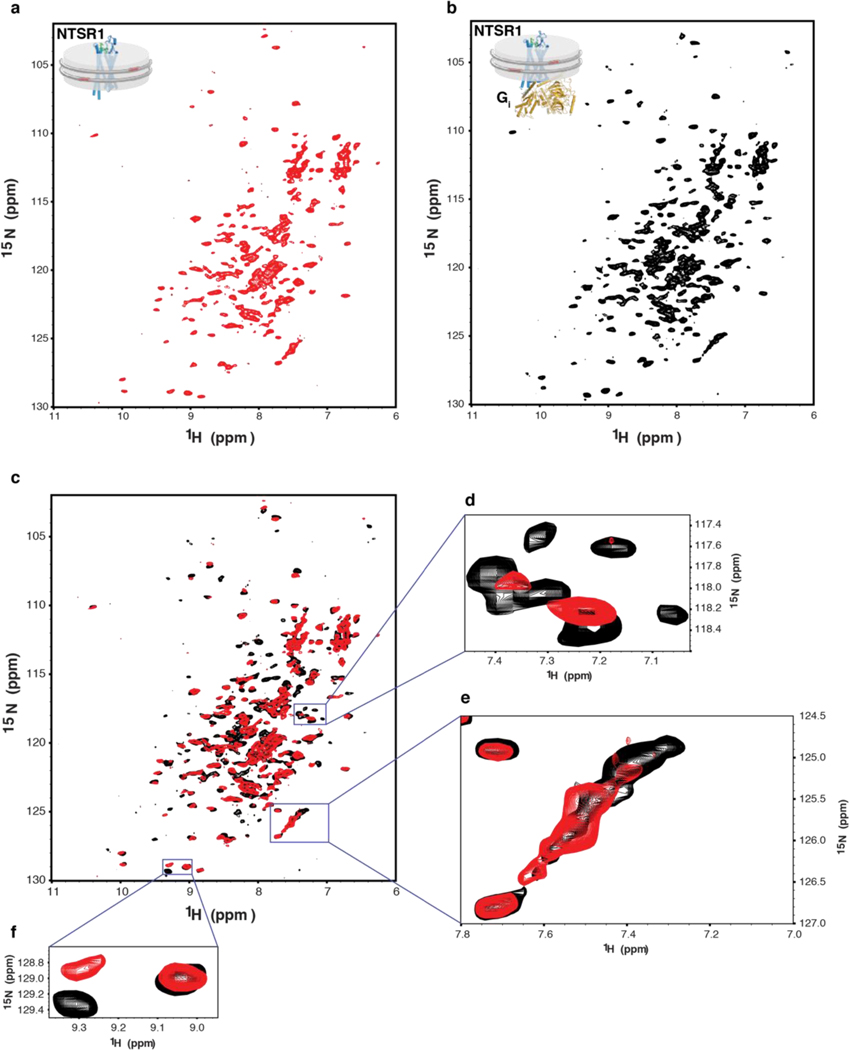
Extended Data Fig. 3 |. Characterization of the interaction between NTS-NTSR1 and Gi in cNDs by two-dimensional 1H, 15N-TROSY HSQC NMR spectroscopy.
a-b, NMR spectrum of 15N-labeled NTS-NTSR1 in cNDs in the (a) absence and (b) presence of Gi. c, Overlay of (a) (red) onto (b) (black) showing structural and dynamical changes of NTS-NTSR1 upon binding to Gi in cNDs. d, A region showing conformational stabilization of NTSR1. More peaks are observed in the presence of Gi, suggesting that NTSR1 is highly dynamic in the absence of Gi and resonances are averaged out among a wide range of conformers resulting in low signal-to-noise ratio and even disappeared peaks. Upon interaction with Gi, NTSR1 is stabilized into fewer conformers and becomes less dynamic, which leads to better signal-to-noise ratio and more resonances being observed. e, A region showing dynamically slow-exchange shift of NTSR1 upon interaction with Gi. f, A region showing chemical shift perturbation of NTSR1, suggesting conformational change of NTSR1 upon binding to Gi in cNDs.
Extended Data Fig. 4 |. Characterization of the binding kinetics between NTS-NTSR1 and Gi in cNDs.
a-b, Fitting of Bio-Layer Interferometry (BLI) traces of Gi binding to NTS-NTSR1-cND using (a) one binding mode and (b) two binding mode shows better fitting using two binding mode. Right, a table showing kon, koff and KD from the two binding mode fitting. c, Dissociation between Gi and NTS-NTSR1-cND in the absence (black and brown) and presence (green and blue) of GTPγS, showing faster dissociation of the complex in the presence of GTPγS, suggesting that the NTSR1-Gαi1β1γ1 complex in cNDs is capable of GDP/GTP exchange. d, Association and dissociation kinetics of Gi binding to NTS-NTSR1-cND (dark) and empty cND (gray), showing much slower association and faster dissociation of Gi binding to empty cND compared to NTS-NTSR1-cND, suggesting that interaction between Gi and NTS-NTSR1-cND is driven by Gi binding to NTSR1 rather than to the nanodisc. e, Microscale thermophoresis (MST) data for the binding between NTSR1 and Gi (square mark), as well as the binding between mutant TM86V-L167R E166A/K176A/K178A/S182A/R185A and Gi (triangle mark) in POPC/POPG (3/2) cND. f, MST data for the binding between NTSR1 and Gi in POPC cND (triangle mark), POPG cND (diamond mark) and POPC/POPG/CHS cND (square mark). Right, a table showing KD from e-f.
Extended Data Fig. 5 |. Cryo-EM data processing.
a, Representative micrograph showing the distribution of NTS-NTSR1-Gi-cND particles in vitreous ice. b, Selected two-dimensional class averages showing secondary structure features. The cND has an approximate diameter of 9 nm. c, Simplified flow chart of the cryo-EM processing. Two datasets were collected and processed similarly; the number of particles shown here are a conflation of both datasets. Two well-resolved classes corresponding to canonical and noncanonical states were identified. Further rounds of classification did not identify additional classes or improve the resolution or map quality. d-e, Fourier shell correlation (FSC) curves for the (d) canonical state and (e) noncanonical state with masks that either include or exclude the cND and AHD.
Extended Data Fig. 6 |. Cryo-EM density.
a-b, Local resolution of the NTS-NTSR1-Gi complex in the (a) canonical state and (b) noncanonical state. The local resolution is calculated in Relion. c-d, Density and model for the transmembrane helices of NTSR1 and the α5 and αN helices of Gαi1 in the (c) canonical state and (d) noncanonical state. e, Density and model for NTS8–13. f, Superposition of the atomic models of NTS8–13 from the NTS-NTSR1-Gi-cND complex in the canonical (light green), and noncanonical state (dark green) with NT from the NTS-NTSR1 crystal structure (purple; PDB 4XEE) and JMV449 (a NT analog) from the NTSR1-Gi-detergent complex in the canonical (magenta; PDB 6OS9) and noncanonical state (dark red; PDB 6OSA).
Extended Data Fig. 7 |. Structure and position of the α-helical domain (AHD).
a, Density maps and models showing the interaction between Gβ1 (purple) and Gαi1 AHD (gold) in the canonical state. Zoom-in view of the Gαi1 AHD is shown. b, Density maps and models showing the interaction between Gβ1 (purple) and Gαi1 AHD (dark green) in the noncanonical state. Zoom-in view of the Gαi1 AHD is shown. The models in (a) and (b) are superposed on the Gβ1 subunits and are shown in the same view. AHD in both states interacts with the second and third blades of Gβ1. c-f, Comparison of the AHD of the canonical state NTS-NTSR1-Gi-cND (gold) with c, A crystal structure of GDP-Gi (blue; PDB 1GP2), d, A crystal structure of β2AR-Gs with nanobody Nb35 (AHD is dark red and Nb35 is green; PDB 3SN6), e, A cryo-EM structure of Rhodopsin-Gi with Fab G50 (AHD is pink and Fab G50 is green; PDB 6CMO), and f, A cryo-EM structure of Smoothened-Gi with Fab G50 (AHD is light blue and Fab G50 is green; PDB 6OT0). The models are superposed on the Gα Ras-like domain.
Extended Data Fig. 8 |. Cryo-EM structure of the NTS-NTSR1-Gi complex in lipid nanodiscs and the interaction with lipid.
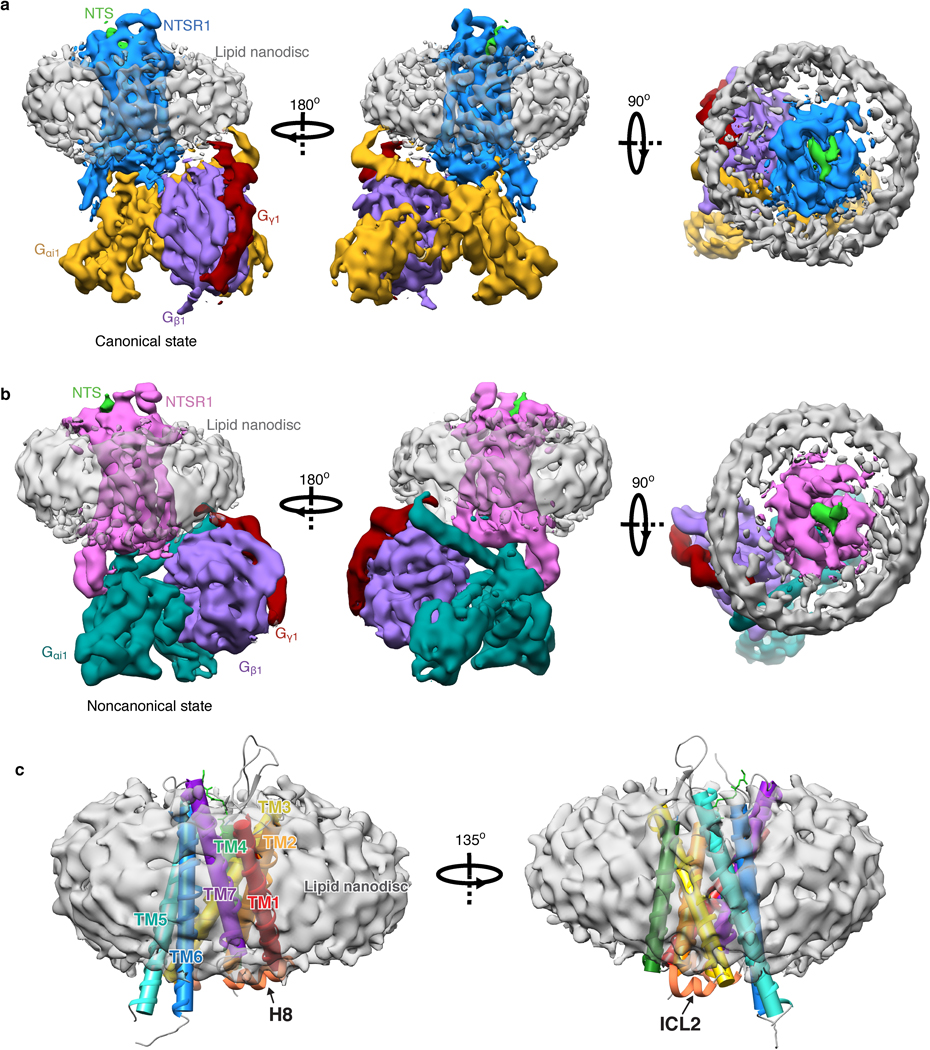
a, Three views of the cryo-EM density map of the NTS-NTSR1-Gi-cND complex in the canonical state. b, Three views of the cryo-EM density map of the NTS-NTSR1-Gi-cND complex in the noncanonical state. The maps in panels (a) and (b) are low-pass filtered to 5 Å and colored by subunit. c, Two views of NTS-NTSR1 surrounded by nanodisc density. The transmembrane helices are shown in cylinder representation using the rainbow coloring scheme. ICL2 and helix H8 are partially submerged in lipid.
Extended Data Fig. 9 |. Impact of the lipid bilayer on the structure of NTSR1.
a, Comparison between the cryo-EM structures of the canonical states of NTSR1 (with Gi) in lipid bilayer (blue) and detergent (gray, PDB 6OS9). TM6 is shifted by 1.6 Å (based on Cα of V309) inwards in lipid bilayer. Right, comparison of the C-NTS-NTSR1-Gi-cND model (blue) with the density map of C-NTSR1-Gi-micelle (pink) (EMD-20180, low-pass filtered to 5 Å) confirms this shift to be significant. b, Structural comparison between the crystal structure of NTSR1 in detergent (green, PDB 4XEE) and the cryo-EM structure of the canonical state of NTSR1 in complex with Gi in detergent (gray, PDB 6OS9). The atomic models in (a) and (b) are superposed on NTSR1. c, Comparison of the localization of TM5-TM6 relative to α5 helix of Gα in class A GPCR-Gi complex structures, including the canonical state NTSR1 (blue) in complex with Gi (gold) structure reported in the current study, μOR-Gi (lime green; PDB 6DDE), Rho-Gi (hot pink; PDB 6CMO), A1R-Gi (cyan; PDB 6D9H), and CB1-Gi (purple; PDB 6N4B). The models are superposed on the Ras-like domain of Gα.
Extended Data Fig. 10 |. ICL2 interaction with a hydrophobic pocket of Gi.
a, Structure of GDP-Gαi showing a hydrophobic network surrounding F336 in the zoomed-in view. Residues involved in the network are shown as sticks. b, Atomic model of C-NTS-NTSR1-Gi-cND showing insertion of F17534.51 from ICL2 of NTSR1 into a hydrophobic pocket involving residues F336, L194 and V339 of Gαi. Residues involved in the network are shown as sticks. Residues from the network in (a) are shown in lines. A transition of F336 on Gαi from the network in (a) in the GDP-bound state to a new network in (b) in the NTSR1-bound state is observed.
Extended Data Fig. 11 |. Comparison of NTSR1-Gi interaction in lipid bilayer with detergent micelles.
a-c, Superposed structure of C-state NTSR1 (blue) and Gα (gold) in cND, NC-state NTSR1 (orchid) and Gα (dark cyan) in cND, C-state NTSR1 and Gα in micelle (gray, PDB 6OS9), NC-state NTSR1 and Gα in micelle (magenta, 6OSA). The models are superposed on NTSR1. a, extracellular view of NTSR1 and αN helix; b, side view of NTSR1 ICL3 and α4β6 loop; c, side view of NTSR1 and α5 helix. d, Comparison of the localization of α5 helix relative to GPCR in class A GPCR-Gi complex structures, including the canonical (gold) state and noncanonical (dark cyan) state structure reported in the current study, canonical (gray) and noncanonical (magenta) state of NTSR1-Gi in detergent micelle, μOR-Gi (lime green; PDB 6DDE), A1R-Gi (cyan; PDB 6D9H), CB1-Gi (purple; PDB 6N4B), Rho-Gi (hot pink; PDB 6CMO) and DRD2-Gi (yellow; PDB 6VMS). The structures are superposed on the GPCR. Residue R3.50 is shown as colored spheres in C-state NTSR1 and as partially transparent gray spheres in the other GPCRs.
Extended Data Fig. 12 |. Molecular dynamics (MD) simulation for the interaction between ICL3 and the α4β6 loop.
a, MD simulation showing salt bridges and hydrogen bonds form between TM6-ICL3 and α4β6-loop in the canonical state of NTS-NTSR1-Gi-cND represented by simulation 12. b, Dynamics of ICL3 for each independent simulation of the canonical state of NTS-NTSR1-Gi-cND. Frames are sampled every 40 ns from each individual simulation. All 12 simulations show various interactions including salt bridges/hydrogen bonds between ICL3 and the α4β6-loop. An example of detailed interactions is shown in (a). NTSR1 is colored in blue and Gi in gold in (a-b).
Extended Data Table 1.
Cryo-EM data collection, refinement and validation statistics
| NTS-NTSR1-Gi-cND canonical state, AHD and nanodisc mask out (EMD-23099, PDB 7L0P) | NTS-NTSR1-Gi-cND canonical state, overall (EMD-23100, PDB 7L0Q) | NTS-NTSR1-Gi-cND noncanonical state, AHD and nanodisc mask out (EMD-23101, PDB 7L0R) | NTS-NTSR1-Gi-cND noncanonical state, overall (EMD-23102, PDB 7L0S) | |
|---|---|---|---|---|
| Data collection and processing | ||||
| Magnification | 105,000 | 105,000 | 105,000 | 105,000 |
| Voltage (kV) | 300 | 300 | 300 | 300 |
| Electron exposure (e-/Å2) | 57 | 57 | 57 | 57 |
| Defocus range (μm) | −1.2 to −2.5 | −1.2 to −2.5 | −1.2 to −2.5 | −1.2 to −2.5 |
| Pixel size (Å) | 0.825 | 0.825 | 0.825 | 0.825 |
| Symmetry imposed | C1 | C1 | C1 | C1 |
| Initial particle images (no.) | 4,367,542 | 4,367,542 | 4,367,542 | 4,367,542 |
| Final particle images (no.) | 575,791 | 575,791 | 324,002 | 324,002 |
| Map resolution (Å) | 4.1 | 4.3 | 4.2 | 4.5 |
| FSC threshold | 0.143 | 0.143 | 0.143 | 0.143 |
| Refinement | ||||
| Initial model used (PDB code) | 4BUO, 1GP2, 6OY9 | |||
| Map sharpening B factor (Å2) | −245 | −222 | −204 | −228 |
| Model composition | ||||
| Non-hydrogen atoms | 6954 | 7892 | 6968 | 7906 |
| Protein residues | 882 (6896 atoms) | 996 (7834 atoms) | 881 (6910 atoms) | 995 (7848 atoms) |
| Ligands | 1 (6 residues, 58 atoms) | 1 (6 residues, 58 atoms) | 1 (6 residues, 58 atoms) | 1 (6 residues, 58 atoms) |
| B factors (Å2) | ||||
| Protein | 73.6 | 69.75 | 73.63 | 69.79 |
| Ligand | 66.76 | 66.76 | 66.76 | 66.76 |
| R.m.s. deviations | ||||
| Bond lengths (Å) | 0.006 | 0.007 | 0.007 | 0.008 |
| Bond angles (°) | 1.051 | 1.286 | 1.368 | 1.508 |
| Validation | ||||
| MolProbity score | 1.9 | 1.84 | 1.96 | 2 |
| Clashscore | 8.36 | 7.82 | 9.79 | 9.27 |
| Poor rotamers (%) | 0.53 | 0.7 | 1.05 | 1.39 |
| Ramachandran plot | ||||
| Favored (%) | 93.1 | 93.69 | 93.44 | 93.99 |
| Allowed (%) | 6.9 | 6.31 | 6.56 | 6.01 |
| Disallowed (%) | 0 | 0 | 0 | 0 |
Supplementary Material
Acknowledgments:
Cryo-EM data were collected at the Harvard Cryo-Electron Microscopy Center for Structural Biology. We thank F. Koh, P. Egloff, P. Heine, M. Hillenbrand, and J. Schöppe for their contribution to the early stages of this project, S. Sterling, R. Walsh, and Z. Li for microscopy support, SBGrid for computing support, M. Deluigi for supervising the signaling experiments, and R. Walker, K. Bayer, P. Imhof and M. Bagherpoor for their advice and discussions regarding the molecular dynamics simulations. M.G. is supported by a Merck-BCMP fellowship. A.B. is supported by the International Retinal Research Foundation, the E. Matilda Ziegler Foundation for the Blind, the Richard and Susan Smith Family Foundation, and the Pew Charitable Trusts. We acknowledge support by NIH grants GM129026 and AI037581 to G.W. and GM131401 to M.L.N. G.W. and A.P. are supported by HFSP RGP0060/2016. A.P. is supported by Swiss National Science Foundation grant 31003A_182334.
Footnotes
Competing interests: M.L.N. and G.W. founded the company NOW Scientific to sell assembled cNDs, but a plasmid for expressing the NW9 membrane scaffolding protein is available through the Addgene plasmid depository (catalog number 133442) for academic/nonprofit institutions. Otherwise, the authors declare no competing interests.
Data and materials availability: Structural data have been deposited into the Worldwide Protein Data Bank (wwPDB) and the Electron Microscopy Data Bank (EMDB). The EM density maps for the canonical and noncanonical states of NTS-NTSR1-Gi complex in lipid nanodiscs have been deposited under accession codes EMD-23100 and EMD-23102. The masked EM density maps excluding the nanodisc and AHD of the canonical and noncanonical states have been deposited under accession codes EMD-23099 and EMD-23101. The corresponding atomic models have been deposited under PDB accession codes 7L0Q, 7L0S, 7L0P and 7L0R. Other data are available upon reasonable request.
References
- 1.Griebel G. & Holsboer F. Neuropeptide receptor ligands as drugs for psychiatric diseases: The end of the beginning? Nature Reviews Drug Discovery 11, 462–478 (2012). [DOI] [PubMed] [Google Scholar]
- 2.Shimada I, Ueda T, Kofuku Y, Eddy MT & Wüthrich K. GPCR drug discovery: Integrating solution NMR data with crystal and cryo-EM structures. Nature Reviews Drug Discovery 18, 59–82 (2018). [DOI] [PMC free article] [PubMed] [Google Scholar]
- 3.Hilger D, Masureel M. & Kobilka BK Structure and dynamics of GPCR signaling complexes. Nat. Struct. Mol. Biol 25, 4–12 (2018). [DOI] [PMC free article] [PubMed] [Google Scholar]
- 4.Du Y. et al. Assembly of a GPCR-G protein complex. Cell 177, (2019). [DOI] [PMC free article] [PubMed] [Google Scholar]
- 5.Qi X. et al. Cryo-EM structure of oxysterol-bound human Smoothened coupled to a heterotrimeric Gi. Nature (2019). doi: 10.1038/s41586-019-1286-0 [DOI] [PMC free article] [PubMed] [Google Scholar]
- 6.Rasmussen SGF et al. Crystal structure of the β2 adrenergic receptor-Gs protein complex. Nature 477, 549–557 (2011). [DOI] [PMC free article] [PubMed] [Google Scholar]
- 7.Zhao L-H et al. Structure and dynamics of the active human parathyroid hormone receptor-1. Science 364, 148–153 (2019). [DOI] [PMC free article] [PubMed] [Google Scholar]
- 8.Kang Y. et al. Cryo-EM structure of human rhodopsin bound to an inhibitory G protein. Nature 558, 553–558 (2018). [DOI] [PMC free article] [PubMed] [Google Scholar]
- 9.Liang YL et al. Cryo-EM structure of the active, Gs -protein complexed, human CGRP receptor. Nature 561, 492–497 (2018). [DOI] [PMC free article] [PubMed] [Google Scholar]
- 10.Liang YL et al. Phase-plate cryo-EM structure of a biased agonistbound human GLP-1 receptor-Gs complex. Nature 555, 121–125 (2018). [DOI] [PubMed] [Google Scholar]
- 11.García-Nafría J, Lee Y, Bai X, Carpenter B. & Tate CG Cryo-EM structure of the adenosine A2A receptor coupled to an engineered heterotrimeric G protein. Elife 7, (2018). [DOI] [PMC free article] [PubMed] [Google Scholar]
- 12.Kato HE et al. Conformational transitions of a neurotensin receptor 1–Gi1 complex. Nature 572, 80–85 (2019). [DOI] [PMC free article] [PubMed] [Google Scholar]
- 13.García-Nafría J, Nehmé R, Edwards PC & Tate CG Cryo-EM structure of the serotonin 5-HT1B receptor coupled to heterotrimeric Go. Nature 558, 620–623 (2018). [DOI] [PMC free article] [PubMed] [Google Scholar]
- 14.Zhang Y. et al. Cryo-EM structure of the activated GLP-1 receptor in complex with a G protein. Nature 546, 248–253 (2017). [DOI] [PMC free article] [PubMed] [Google Scholar]
- 15.Liang YL et al. Phase-plate cryo-EM structure of a class B GPCR-G-protein complex. Nature 546, 118–123 (2017). [DOI] [PMC free article] [PubMed] [Google Scholar]
- 16.Draper-Joyce CJ et al. Structure of the adenosine-bound human adenosine A1 receptor-Gi complex. Nature 558, 559–563 (2018). [DOI] [PubMed] [Google Scholar]
- 17.Koehl A. et al. Structure of the μ-opioid receptor-Gi protein complex. Nature 558, 547–552 (2018). [DOI] [PMC free article] [PubMed] [Google Scholar]
- 18.Krishna Kumar K. et al. Structure of a signaling cannabinoid receptor 1-G protein complex. Cell 176, 448–458.e12 (2019). [DOI] [PMC free article] [PubMed] [Google Scholar]
- 19.Yin J. et al. Structure of a D2 dopamine receptor–G-protein complex in a lipid membrane. Nature 2020, (2020). [DOI] [PMC free article] [PubMed] [Google Scholar]
- 20.Lee AG How lipids affect the activities of integral membrane proteins. Biochimica et Biophysica Acta - Biomembranes 1666, 62–87 (2004). [DOI] [PubMed] [Google Scholar]
- 21.Whorton MR et al. Efficient coupling of transducin to monomeric rhodopsin in a phospholipid bilayer. J. Biol. Chem 283, 4387–94 (2008). [DOI] [PMC free article] [PubMed] [Google Scholar]
- 22.Kofuku Y. et al. Functional dynamics of deuterated β2-adrenergic receptor in lipid bilayers revealed by NMR spectroscopy. Angew. Chemie - Int. Ed 53, 13376–13379 (2014). [DOI] [PubMed] [Google Scholar]
- 23.Strohman MJ et al. Local membrane charge regulates β2 adrenergic receptor coupling to Gi3. Nat. Commun 10, (2019). [DOI] [PMC free article] [PubMed] [Google Scholar]
- 24.Yen H-Y et al. PtdIns(4,5)P2 stabilizes active states of GPCRs and enhances selectivity of G-protein coupling. Nature 559, 423–427 (2018). [DOI] [PMC free article] [PubMed] [Google Scholar]
- 25.Inagaki S. et al. Modulation of the interaction between neurotensin receptor NTS1 and Gq protein by lipid. J. Mol. Biol 417, 95–111 (2012). [DOI] [PMC free article] [PubMed] [Google Scholar]
- 26.Kitabgi P. Targeting neurotensin receptors with agonists and antagonists for therapeutic purposes. Curr. Opin. Drug Discov. Devel 5, 764–76 (2002). [PubMed] [Google Scholar]
- 27.Nasr ML et al. Covalently circularized nanodiscs for studying membrane proteins and viral entry. Nat. Methods 14, 49–52 (2016). [DOI] [PMC free article] [PubMed] [Google Scholar]
- 28.Wall MA et al. The structure of the G protein heterotrimer Giα1β1γ2. Cell 83, 1047–58 (1995). [DOI] [PubMed] [Google Scholar]
- 29.Egloff P. et al. Structure of signaling-competent neurotensin receptor 1 obtained by directed evolution in Escherichia coli. Proc. Natl. Acad. Sci 111, E655–E662 (2014). [DOI] [PMC free article] [PubMed] [Google Scholar]
- 30.Ballesteros JA & Weinstein H. Integrated methods for the construction of three-dimensional models and computational probing of structure-function relations in G protein-coupled receptors. Methods Neurosci. 25, 366–428 (1995). [Google Scholar]
- 31.Knepp AM, Grunbeck A, Banerjee S, Sakmar TP & Huber T. Direct measurement of thermal stability of expressed CCR5 and stabilization by small molecule ligands. Biochemistry 50, 502–511 (2011). [DOI] [PMC free article] [PubMed] [Google Scholar]
- 32.Gao Y. et al. Structures of the rhodopsin-transducin complex: insights into G-protein activation. Mol. Cell 75, 781–790.e3 (2019). [DOI] [PMC free article] [PubMed] [Google Scholar]
- 33.Krumm BE, White JF, Shah P. & Grisshammer R. Structural prerequisites for G-protein activation by the neurotensin receptor. Nat. Commun 6, 7895 (2015). [DOI] [PMC free article] [PubMed] [Google Scholar]
- 34.Kim HR et al. Structural mechanism underlying primary and secondary coupling between GPCRs and the Gi/o family. Nat. Commun 11, (2020). [DOI] [PMC free article] [PubMed] [Google Scholar]
- 35.Huang W. et al. Structure of the neurotensin receptor 1 in complex with β-arrestin 1. Nature 579, 303–308 (2020). [DOI] [PMC free article] [PubMed] [Google Scholar]
- 36.Liu X. et al. Structural insights into the process of GPCR-G protein complex formation. Cell 177, 1243–1251.e12 (2019). [DOI] [PMC free article] [PubMed] [Google Scholar]
- 37.Dror RO et al. Structural basis for nucleotide exchange in heterotrimeric G proteins. Science 348, 1361–1365 (2015). [DOI] [PMC free article] [PubMed] [Google Scholar]
- 38.Sun X, Singh S, Blumer KJ & Bowman GR Simulation of spontaneous G protein activation reveals a new intermediate driving GDP unbinding. Elife 7, (2018). [DOI] [PMC free article] [PubMed] [Google Scholar]
- 39.Chung KY et al. Conformational changes in the G protein Gs induced by the β2 adrenergic receptor. Nature 477, 611–617 (2011). [DOI] [PMC free article] [PubMed] [Google Scholar]
- 40.Erlandson SC, McMahon C. & Kruse AC Structural basis for G protein–coupled receptor signaling. Annu. Rev. Biophys 47, 1–18 (2018). [DOI] [PubMed] [Google Scholar]
- 41.Iiri T, Bell SM, Baranski TJ, Fujita T. & Bourne HR A Gsα mutant designed to inhibit receptor signaling through Gs. Proc. Natl. Acad. Sci. U. S. A 96, 499–504 (1999). [DOI] [PMC free article] [PubMed] [Google Scholar]
- 42.Su M. et al. Structural basis of the activation of heterotrimeric Gs-protein by isoproterenol-bound β1-adrenergic receptor. Mol. Cell 80, 59–71.e4 (2020). [DOI] [PMC free article] [PubMed] [Google Scholar]
- 43.Kaya AI et al. A conserved phenylalanine as a relay between the α5 helix and the GDP binding region of heterotrimeric Gi protein α subunit. J. Biol. Chem 289, 24475–24487 (2014). [DOI] [PMC free article] [PubMed] [Google Scholar]
- 44.Sun D. et al. Probing Gαi1 protein activation at single-amino acid resolution. Nat. Struct. Mol. Biol 22, 686–694 (2015). [DOI] [PMC free article] [PubMed] [Google Scholar]
- 45.Flock T. et al. Universal allosteric mechanism for Gα activation by GPCRs. Nature 524, 173–179 (2015). [DOI] [PMC free article] [PubMed] [Google Scholar]
- 46.Goricanec D. et al. Conformational dynamics of a G-protein α subunit is tightly regulated by nucleotide binding. Proc. Natl. Acad. Sci 113, E3629–E3638 (2016). [DOI] [PMC free article] [PubMed] [Google Scholar]
- 47.Egloff P, Deluigi M, Heine P, Balada S. & Plückthun A. A cleavable ligand column for the rapid isolation of large quantities of homogeneous and functional neurotensin receptor 1 variants from E. coli. Protein Expr. Purif 108, 106–114 (2015). [DOI] [PubMed] [Google Scholar]
- 48.Hillenbrand M, Schori C, Schöppe J. & Plückthun A. Comprehensive analysis of heterotrimeric G-protein complex diversity and their interactions with GPCRs in solution. Proc. Natl. Acad. Sci. U. S. A 112, E1181–90 (2015). [DOI] [PMC free article] [PubMed] [Google Scholar]
- 49.Delaglio F. et al. NMRPipe: A multidimensional spectral processing system based on UNIX pipes. J. Biomol. NMR 6, 277–293 (1995). [DOI] [PubMed] [Google Scholar]
- 50.Ehrenmann J. et al. High-resolution crystal structure of parathyroid hormone 1 receptor in complex with a peptide agonist. Nat. Struct. Mol. Biol 25, 1086–1092 (2018). [DOI] [PubMed] [Google Scholar]
- 51.Schorb M, Haberbosch I, Hagen WJH, Schwab Y. & Mastronarde DN Software tools for automated transmission electron microscopy. Nat. Methods 16, 471–477 (2019). [DOI] [PMC free article] [PubMed] [Google Scholar]
- 52.Zheng SQ et al. MotionCor2: Anisotropic correction of beam-induced motion for improved cryo-electron microscopy. Nature Methods 14, 331–332 (2017). [DOI] [PMC free article] [PubMed] [Google Scholar]
- 53.Rohou A. & Grigorieff N. CTFFIND4: Fast and accurate defocus estimation from electron micrographs. J. Struct. Biol 192, 216–221 (2015). [DOI] [PMC free article] [PubMed] [Google Scholar]
- 54.Tang G. et al. EMAN2: An extensible image processing suite for electron microscopy. J. Struct. Biol 157, 38–46 (2007). [DOI] [PubMed] [Google Scholar]
- 55.Wagner T. et al. SPHIRE-crYOLO is a fast and accurate fully automated particle picker for cryo-EM. Commun. Biol 2, (2019). [DOI] [PMC free article] [PubMed] [Google Scholar]
- 56.Zivanov J. et al. New tools for automated high-resolution cryo-EM structure determination in RELION-3. Elife 7, (2018). [DOI] [PMC free article] [PubMed] [Google Scholar]
- 57.Gao Y. et al. Structures of the Rhodopsin-Transducin Complex: Insights into G-Protein Activation. Mol. Cell 75, 781–790.e3 (2019). [DOI] [PMC free article] [PubMed] [Google Scholar]
- 58.Pettersen EF et al. UCSF Chimera - A visualization system for exploratory research and analysis. J. Comput. Chem 25, 1605–1612 (2004). [DOI] [PubMed] [Google Scholar]
- 59.Emsley P. & Cowtan K. Coot: Model-building tools for molecular graphics. Acta Crystallogr. Sect. D Biol. Crystallogr 60, 2126–2132 (2004). [DOI] [PubMed] [Google Scholar]
- 60.Afonine PV et al. Real-space refinement in PHENIX for cryo-EM and crystallography. Acta Crystallogr. Sect. D Struct. Biol 74, 531–544 (2018). [DOI] [PMC free article] [PubMed] [Google Scholar]
- 61.Williams CJ et al. MolProbity: More and better reference data for improved all-atom structure validation. Protein Sci. 27, 293–315 (2018). [DOI] [PMC free article] [PubMed] [Google Scholar]
- 62.Epik S. Schrödinger Suite 2018–2 Protein Preparation Wizard. (2019). [Google Scholar]
- 63.Madhavi Sastry G, Adzhigirey M, Day T, Annabhimoju R. & Sherman W. Protein and ligand preparation: Parameters, protocols, and influence on virtual screening enrichments. J. Comput. Aided. Mol. Des 27, 221–234 (2013). [DOI] [PubMed] [Google Scholar]
- 64.Jo S, Kim T, Iyer VG & Im W. CHARMM-GUI: A web-based graphical user interface for CHARMM. J. Comput. Chem 29, 1859–1865 (2008). [DOI] [PubMed] [Google Scholar]
- 65.Lee J. et al. CHARMM-GUI Membrane Builder for Complex Biological Membrane Simulations with Glycolipids and Lipoglycans. J. Chem. Theory Comput 15, 775–786 (2019). [DOI] [PubMed] [Google Scholar]
- 66.Lomize MA, Pogozheva ID, Joo H, Mosberg HI & Lomize AL OPM database and PPM web server: Resources for positioning of proteins in membranes. Nucleic Acids Res. 40, (2012). [DOI] [PMC free article] [PubMed] [Google Scholar]
- 67.Case DA et al. AMBER 2018. (2018). [Google Scholar]
- 68.Maier JA et al. ff14SB: Improving the Accuracy of Protein Side Chain and Backbone Parameters from ff99SB. J. Chem. Theory Comput 11, 3696–3713 (2015). [DOI] [PMC free article] [PubMed] [Google Scholar]
- 69.Dickson CJ et al. Lipid14: The amber lipid force field. J. Chem. Theory Comput 10, 865–879 (2014). [DOI] [PMC free article] [PubMed] [Google Scholar]
- 70.Jorgensen WL, Chandrasekhar J, Madura JD, Impey RW & Klein ML Comparison of simple potential functions for simulating liquid water. J. Chem. Phys 79, 926–935 (1983). [Google Scholar]
- 71.Lee J. et al. CHARMM-GUI Input Generator for NAMD, GROMACS, AMBER, OpenMM, and CHARMM/OpenMM Simulations Using the CHARMM36 Additive Force Field. J. Chem. Theory Comput 12, 405–413 (2016). [DOI] [PMC free article] [PubMed] [Google Scholar]
Associated Data
This section collects any data citations, data availability statements, or supplementary materials included in this article.


