

Abstract
Bone is a hierarchical material primarily composed of collagen, water, and mineral that is organized into discrete molecular, nano-, micro-, and macroscale structural components. In contrast to the structural knowledge of the collagen and mineral domains, the nanoscale porosity of bone is poorly understood. In this study, we introduce a well-established pore characterization technique, positron annihilation lifetime spectroscopy (PALS), to probe the nanoscale size and distribution of each component domain by analyzing pore sizes inherent to hydrated bone together with pores generated by successive removal of water and then organic matrix (including collagen and noncollagenous proteins) from samples of cortical bovine femur. Combining the PALS results with simulated pore size distribution (PSD) results from collagen molecule and microfibril structure, we identify pores with diameter of 0.6 nm that suggest porosity within the collagen molecule regardless of the presence of mineral and water. We find that water occupies three larger domain size regions with nominal mean diameters of 1.1, 1.9, and 4.0 nm—spaces that are hypothesized to associate with intercollagen molecular spaces, terminal segments (d-spacing) within collagen microfibrils, and interface spacing between collagen and mineral structure, respectively. Subsequent removal of the organic matrix determines a structural pore size of 5–6 nm for deproteinized bone—suggesting the average spacing between mineral lamella. An independent method to deduce the average mineral spacing from specific surface area (SSA) measurements of the deproteinized sample is presented and compared with the PALS results. Together, the combined PALS and SSA results set a range on the mean mineral lamella thickness of 4–8 nm.
Keywords: bone, positron annihilation lifetime spectroscopy (PALS), nanocomposite, hierarchical structure, porosity, mineral lamella, collagen
Graphical Abstract
Bone is a complex hierarchical nanocomposite consisting of protein fibrils (primarily type I collagen), polycrystalline mineral (carbonated hydroxyapatite), and water.1–4 The weight fraction range reported for each component is 18–25%, 65–70%, and 10–12%, respectively, and the volume fraction range of each component is 32–44%, 33–43%, and 15–25%, respectively.5–11 The hierarchical structure of the bone composite from macroscopic to microscopic size scales results in stiffness and toughness properties exceeding those of the individual components.2 Mechanical heterogeneity related to these multiple length scales present in bone has also been proposed to reduce microcrack formation by contributing to both ductility and energy dissipation.12–14
With the μ-CT technique, the micro and submicrostructure of bone (Figure 1), such as osteonal and Volkmann canals (50–100 μm) and smaller lacuna-canalicular network spaces (100–200 nm) have been studied.15–17 Recently, Peryin and co-workers have advanced the understanding of the ultrastructure in bone by employing synchrotron nano-CT having 30–60 nm voxel sizes.18–21 Specifically related to recent findings regarding the lacuna-canalicular network with synchrotron nano-CT, Wittig et al.22 found enlarged spaces where multiple canaliculi cross (canalicular junctions) and Yu et al.21 estimated the volume fraction of the lacuna-canalicular network to be on average 1.45% (lacunae, 1.1%; canaliculi, 0.35%) of the total bone volume. In addition to synchrotron nano-CT, the ultra and nanostructure of bone (Figure 1) has been characterized by a number of techniques including scanning electron microscope (SEM),23 transmission electron microscope (TEM),24 X-ray diffraction (XRD),25 and atomic force microscope (AFM).26 On the basis of a variety of experimental physicochemical data including XRD and SEM, Petruska and Hodge proposed an average two-dimensional structure of staggered collagen molecules in bone with a regular 67 nm repeating unit.27 On the basis of a more detailed XRD study, Orgel et al. developed a fully three-dimensional average packing model illustrating how collagen molecules pack to form microfibrils.28 Before Orgel and his colleagues’ work on the three-dimensional packing of the collagen structure, the widely accepted model of the mineralized fibril in bone contained staggered collagen molecules uniaxially aligned with mineral plates located between collagen microfibrils.2,29,30 However, the physical dimensions reported for the mineral plates assuming this simple model (length = 15–50 nm, width = 2–30 nm, and thickness = 0.6–10 nm) exhibit awide variation that has been attributed to a number of possible factors including differences in animal species, tissue locations, and sample preparation,5 as well as the variation in sensitivity/resolution of the characterization techniques themselves (AFM,31 TEM,32,33 and XRD).25,34,35 Moreover, recent high-resolution 3D scanning transmission electron microscopy (STEM) tomography studies suggest that the well-ordered uniform mineral plate model depicted in Figure 1 is too simplistic. Grandfield et al.36 report that most of the mineral of human cortical bone occurs as “mineral lamellae”. Not to be confused with the larger 3–5 μm microstructural features that are observed through polarized light microscopy, mineral lamellae refer to long thin polycrystalline layers, some of which are flat and stacked between collagen fibrils and others that curve in segments around the fibrils. No observation is made of the lateral shape of the lamellae but studies by Reznikov et al. indicate the presence of 100 nm stacked clusters of irregular shaped platelets (formed by combining long acicular crystals ~5 nm across) that are continuous across the fibrillar collagen structure.37
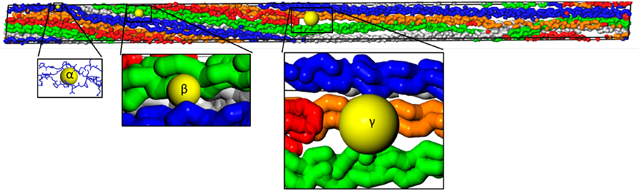
Figure 1.

Schematic showing a hierarchical nature of the bone structure from macro to molecular level.38 This study probes the nanostructure, ultrastructure and molecular structure of bone by utilizing positron annihilation lifetime spectroscopy (PALS). Reprinted with permission from ref 38. Copyright 2014 Elsevier.
This evolving and more complex view of the three-component nanocomposite “ultrastructure” of bone prompted us to consider a technique, positron annihilation lifetime spectroscopy (PALS),39 with proven sensitivity to voids/pores at the nanometer and subnanometer scale. Open (empty) pores play a crucial enabling role in this study. In addition to measurements on hydrated bone structure, dehydration allows measurement of voids templated by the water-filled pores, and deproteinization reveals the open space between the mineral components. In this Article, we present the hierarchy in pore size of voids presented in hydrated bone, water-filled pores, and average mineral spacing in bovine cortical bone as revealed by PALS. For comparison with these results, we also present an independent method to combine traditional measurements of specific surface area (SSA) of deproteinized bone mineral with a simple measurement of the corresponding porosity (ratio of void volume to total volume) to independently determine the average mineral lamella spacing. Furthermore, our deduced spacing range, when limited by the measured porosity and the reported lateral size ranges of the lamellae, sets a narrower range on average mineral thickness than previously published.
Positron Annihilation Lifetime Spectroscopy (PALS) for Porosity Characterization.
Unlike the material characterization techniques employed to date to characterize bone, such as SEM, TEM, XRD, AFM, and SSA, whose signal intensity derives from the physical presence of solid material, PALS utilizes positronium (Ps, the hydrogen-like bound state of an electron and its antiparticle, the positron) to detect and probe the absence of material (i.e., voids or pores). Ps is naturally formed by electron capture when positrons from a radioactive β+-decay source stop in a porous material, and the Ps so formed is energetically driven to localize in the open volume pores. The positron in Ps will annihilate with either its bound electron or with electrons in the material surrounding the pore, and it is this latter process that becomes increasingly dominant at the nanometer pore size. As a result, the average Ps annihilation lifetime measured in PALS can be directly related to pore size. The sensitivity range of PALS to pore size is ~0.3–30 nm.39 The method has been employed to measure size and distribution of open void volumes in many materials including polymer composites,40 unmineralized collagen, and denatured collagen in the form of gelatin.41,42 PALS has been cross checked with other porosity measurement techniques, such as ellipsometric porosimetry (EP), nitrogen gas adsorption, and small angle neutron scattering (SANS).39,43 Despite its widespread and well-documented application in probing voids in hard and soft materials for some 50 years, PALS has not been previously used to systematically study bone nanocomposite. PALS pore data complements the data from XRD, TEM, AFM, and SSA to present a fuller picture of nanoscale structure (collagen, mineral, and water) of bone.
RESULTS/DISCUSSION
Mass and Volume Measurements of Mineral, Protein, and Water Constituents in Bovine Femur.
Mass (by precision balance) and total volume (by μ-CT) were measured at each stage of processing for hydrated, dehydrated, and deproteinized bone samples. The total sample volume did not change significantly under treatment conditions (Table S1). Consistent with the literature,5–10 it was found that water makes up 12% of the sample bone mass while the organic matrix accounts for 20% of the bone mass (Table 1). For samples dried below 100 °C after the chemical deproteinization process, the mineral accounts for the remaining 68% of the bone mass. However, ashing (thermally removing collagen and other organic materials at high temperature) of the bovine femur at 600 °C revealed the mineral mass fraction to be 66% where an additional 2% water was further removed by high temperature (600 °C). This is also consistent with literature reporting that more tightly bound water is released at elevated temperature (>500 °C).44 Therefore, the deproteinization from chemical treatment is completed with 2% of water by mass remaining in the mineral content of bone. We treat this bound water as occupying no explicit volume fraction except insofar as to add mass and some small volume to the mineral. The relative volume occupied by these component masses can then be estimated using accepted values for the respective densities of water, collagen (since collagen is the largest component in the organic matrix), and hydroxyapatite as presented in Table 1. The porosity (P) of a sample is defined as the fraction of the total volume that is void. After dehydration, we expect P to be 24.3 ± 0.5% (the volume fraction of free water removed as shown in Table 1), whereas after deproteinization and dehydration, we expect P to be 55.6 ± 1.0% (with the error ranges on P determined by how the bound water volume fraction is handled).
Table 1.
Summary of Mass and Volume Constituents of One Gram of Hydrated Bovine Femur
| constituent | mass fraction (%) | density (g/cm3) | mass (g) | volume (cm3) | volume fraction (%) |
|---|---|---|---|---|---|
| free watera | 12 | 1.0 | 0.12 | 0.120 | 24.3 |
| Organic matrixb | 20 | 1.345 | 0.20 | 0.154 | 31.3 |
| Mineral | 68 | 3.146 | 0.68 | 0.219 | 44.4 |
| total | 100 | 1.00 | 0.493 | 100 |
Free water: Water removed under the vacuum condition at 80 °C.
Organic matrix includes collagen and noncollagenous proteins.
Specific Surface Area (SSA) of Deproteinized Bovine Femur by Nitrogen Adsorption.
The SSA and pore volume distribution were measured with a Quantachrome-NOVA nitrogen adsorption analyzer. From a Brunauer–Emmett–Teller (BET) analysis of the adsorption isotherm, the SSA of the deproteinized bone was 118 m2/g mineral (not per gram of bone). This is in a good agreement with earlier bovine femur SSA measurements around 100–115 m2/g using BET.44,47 However, more recent determinations using cross polarization NMR spectroscopy on mice and chicken bones present higher SSA values in the 137–177 m2/g range (the mean value of the individual SSA values is 154 ± 15 m2/g).48 Utilizing the nonlocal density functional theory (NLDFT)49 adsorption model, the pore volume distribution was computed for deproteinized bone (Figure 2).
Figure 2.
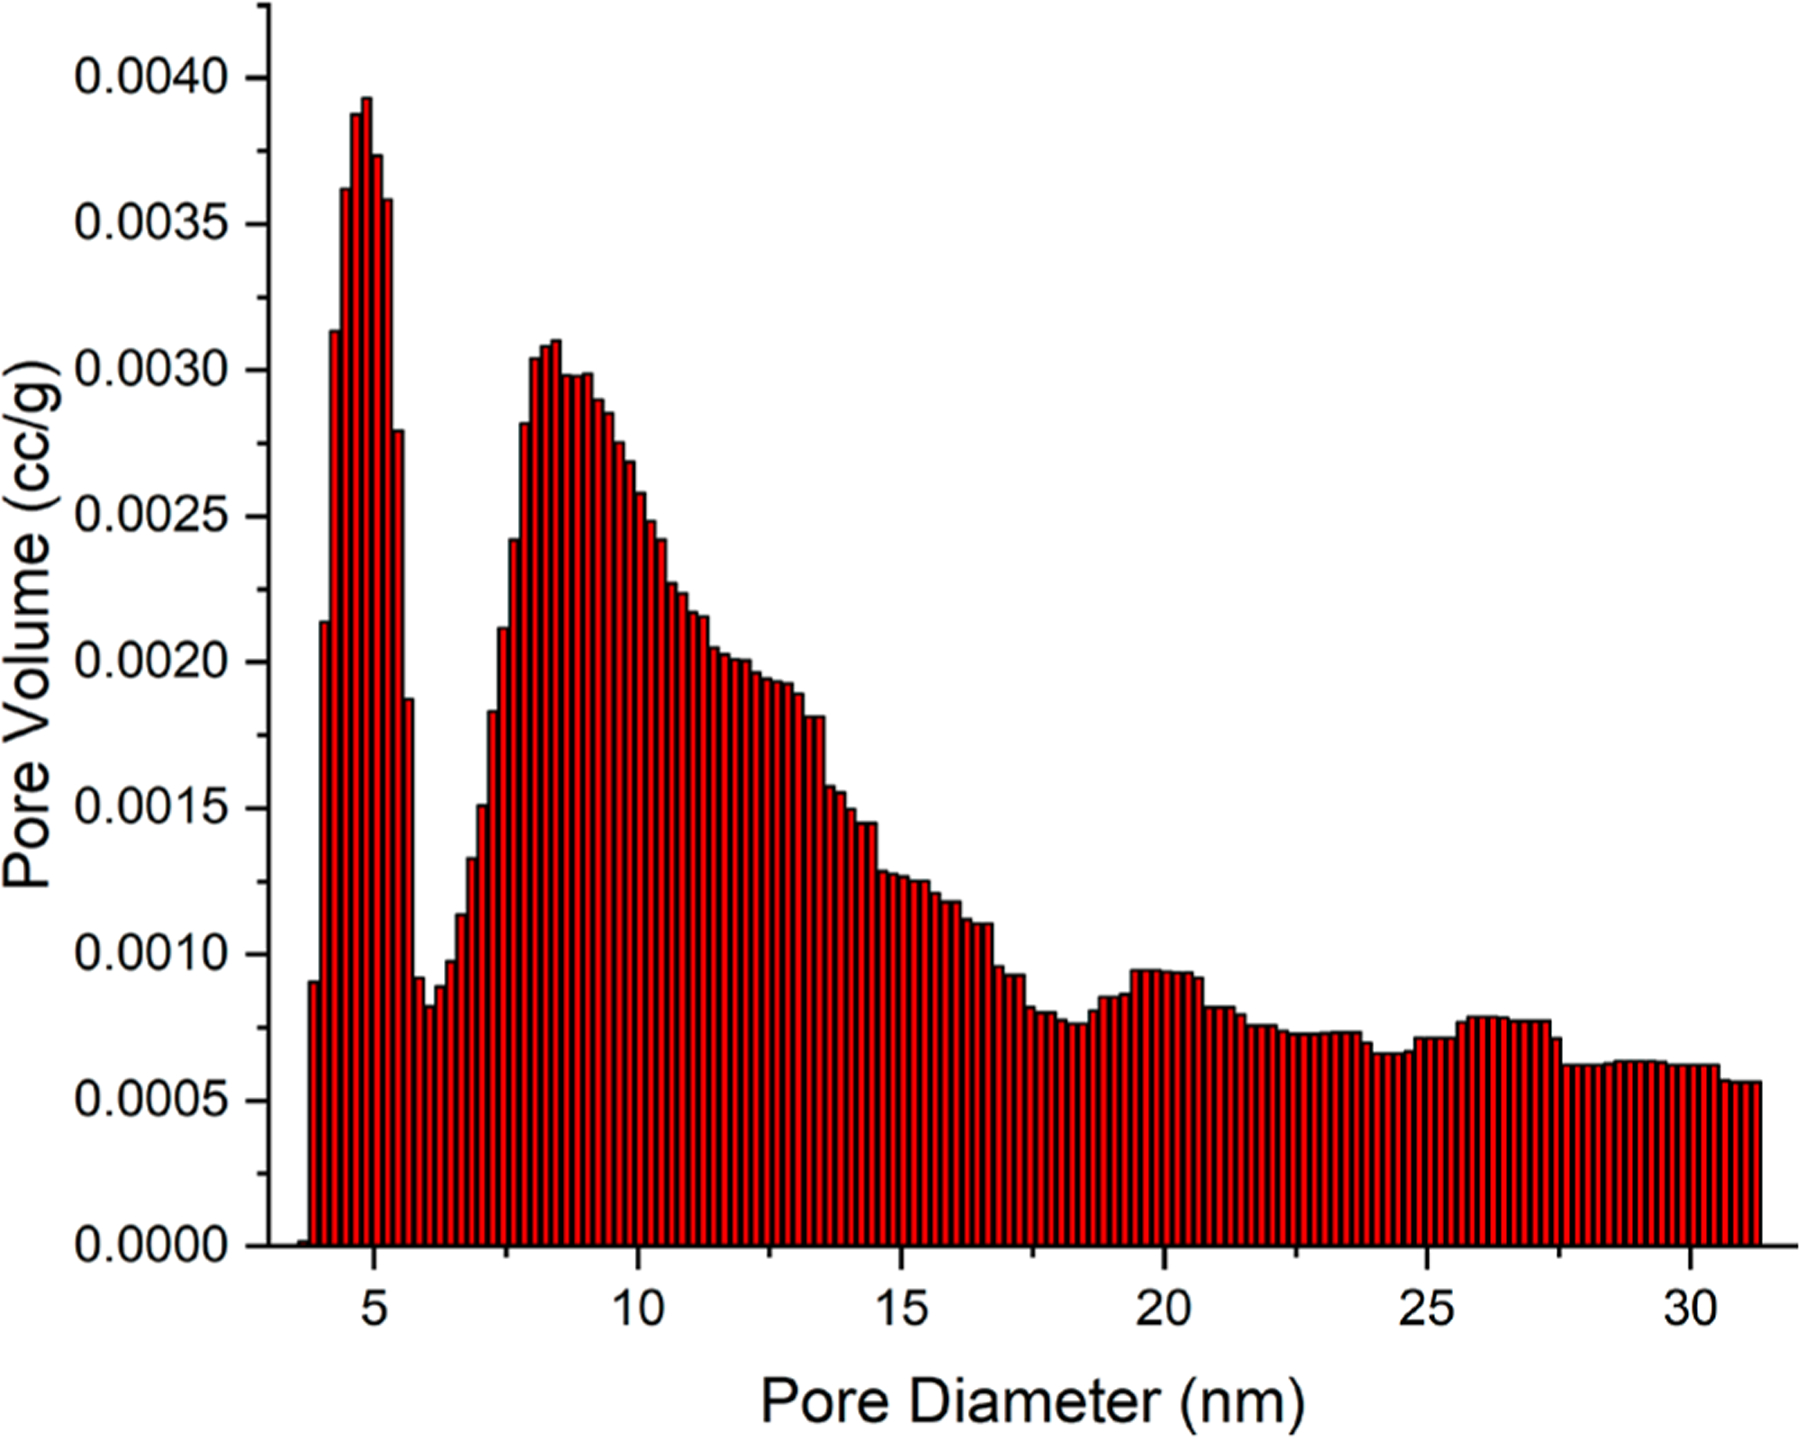
NLDFT pore size distribution from nitrogen adsorption data of the deproteinized bovine femur based on a cylindrical/ spherical pore model shows a bimodal distribution.
PALS on Intact Collagen from Rat Tail Tendon, Collagen Powder from Bovine Tendon, and Demineralized Bovine Femur.
To provide a control for the demineralized bone femur data, we obtained PALS spectra from intact rat tail tendon collagen (vacuum-dried without heating) and collagen powder from bovine tendon under the three experimental conditions (as-received in air, vacuum-dried without heating, and vacuum-dried at 80 °C). Both the rat tail and bovine tendon powder collagen samples required two Ps (positronium) lifetimes, ~1.4 and ~3 ns, for adequate fitting. As shown in Table 2, these two lifetimes were converted into corresponding pore sizes based on different assumed pore geometries. Assuming either a spherical or long cylindrical pore shape yields the diameters Dsphere or Dcylinder. While Ps lifetime reflects pore size, Ps intensity is a measure of the fraction of positrons from the source that annihilate as Ps in each pore and, thus, reflects relative amounts of each corresponding pore size. Our discrete two-lifetime spectrum fitting does not rule out the possibility that collagen has a distribution of Ps lifetimes over the ~1–3 ns range for which two discrete lifetimes adequately account for the breadth of the distribution. Indeed, the intensity-weighted average Ps lifetime for each sample is about 2 ns. Thus, there could be a corresponding distribution in pore sizes in collagen about a mean pore diameter (~0.56 nm for a sphere and ~0.45 nm for a cylinder from the Ps lifetime of 2.0 ns). PALS data on the demineralized bovine femur exhibited two lifetimes, 1.28 ± 0.04 ns and 2.70 ± 0.05 ns, which are similar to those of the rat tail collagen and the collagen powder, suggesting commonly conserved collagen pores across hydrated, dehydrated, and demineralized sources. It should be noted that substantial shrinkage of 50% or more in total volume accompanied dehydration of the rat tail tendon and the demineralized bovine femur (the collagen powder was already partially air-dried as received) indicating that the subnanometer voids deduced in Table 2 are those that survived a more widespread pore collapse and collagen helix reorientation. The lack of any larger remnant water voids in dehydrated collagen should be contrasted with the hierarchy of pores observed in the next section for dehydrated bone with its support structure of rigid mineral to curtail collapse.
Table 2.
Summary of Ps Lifetime Components and Corresponding Pore Sizes Based on Different Geometries of Collagena
| intact collagen from rat tail tendon | collagen powder from bovine tendon | demineralized bovine femur | ||||
|---|---|---|---|---|---|---|
| Ps lifetimes | 1.48 ± 0.03 ns | 3.09 ± 0.06 ns | 1.40 ± 0.03 ns | 2.90 ± 0.03 ns | 1.28 ± 0.04 ns | 2.70 ± 0.05 ns |
| D sphere | 0.459 ± 0.007 nm | 0.732 ± 0.008 nm | 0.440 ± 0.007 nm | 0.706 ± 0.004 nm | 0.411 ± 0.010 nm | 0.678 ± 0.007 nm |
| D cylinder | 0.356 ± 0.006 nm | 0.593 ± 0.007 nm | 0.340 ± 0.006 nm | 0.571 ± 0.004 nm | 0.314 ± 0.009 nm | 0.546 ± 0.006 nm |
| Ps intensity | 7.1 ± 0.1% | 2.2 ± 0.2% | 7.1 ± 0.1% | 5.9 ± 0.2% | 2.9%b | 1.7%b |
Identical values were obtained for as-received material and that vacuum dried at 80 °C. Intensity indicates the percentage of positrons from the source that annihilate as positronium in each lifetime component.
Absolute Ps intensity should be ignored since the radioactive source was partially dissolved by water leaching out of demineralized collagen during the data acquisition
PALS on Hydrated and Dehydrated Bovine Femurs.
The cortical portion of bovine femur was chosen for this study because it provided a large enough volume of bone mass to fully stop the energetic source positrons thereby maximizing the Ps signal while maintaining the ability to process samples into desired shapes. Since the depth of positron penetration of bulk PALS is up to ~1 mm, a sample thickness of ≥1 mm was chosen. The following experimental tests were chosen with sample identifiers noted (Table 3, Figure S1). Hydrated 1 sample was tested to characterize pores in bone when water, organic matrix and mineral components were still present. The same hydrated 1 sample was serially dehydrated (dehydrated 1) and demineralized (demineralized bovine femur). Reproducibility within identical samples and preparation conditions were assessed using sample treatments dehydrated 1 and dehydrated 2. To determine whether the heat applied for the dehydration process affected the nanoscale pore structure, dehydrated 1, dehydrated 2, and dehydrated 3 were compared. Impact of source location on Ps intensity and lifetimes was assessed using dehydrated 4. Sample thickness and chemical treatment effects on Ps intensity were assessed using deproteinized 1, deproteinized 2, deproteinized 3, and deproteinized 4. For dehydrated 2 and deproteinized 3 and dehydrated 3 and deproteinized 4, the same bovine femur pieces were serially dehydrated and deproteinized.
Table 3.
Summary of Bovine Femur Samples Employed in the Paper with the Experimental Conditions
| sample name | sample thickness (mm) | sample geometry | sample treatment |
|---|---|---|---|
| hydrated 1 | 3.5 | single femura | sonicated in nanopure water for 4 min |
| dehydrated 1 | 3.5 | single femur | dehydrated overnight at 80 °C under vacuum |
| dehydrated 2 | 3.5 | single femur | dehydrated overnight at 80 °C under vacuum |
| dehydrated 3 | 3.5 | single femur | dehydrated overnight under vacuum with no heat |
| dehydrated 4 | 3.5 | two femorab | dehydrated overnight at 80 °C under vacuum |
| deproteinized 1 | 1 | single femur | 8.25% bleach for over 30 days |
| deproteinized 2 | 1 | single femur | 2.6% bleach for over 30 days |
| deproteinized 3 | 3.5 | single femur | 8.25% bleach for over 30 days |
| deproteinized 4 | 3.5 | single femur | 2.6% bleach for over 30 days |
| ashed bovine femur | 3.5 | single femur/granulated | 600 °C for 18 h, further granulated after an initial PALS measurement on the same intact ashed femur |
| demineralized bovine femur | 3.5 | single femur | 20% EDTA for over 30 days |
| collagen powder | granulated | dehydrated under vacuum at 80 °C and with no heat | |
| rat tail tendon | segmented | dehydrated under vacuum |
Single femur indicates that one bovine femur covering the radioactive source for PALS measurement.
Two femora indicate that two bovine femur pieces engulfing the radioactive source for PALS measurement.
PALS fitting of hydrated bone spectra shows a single Ps lifetime value of 1.81 ± 0.05 ns (Table 4) or two Ps lifetime values of 1.02 ± 0.05 ns and 1.95 ± 0.02 ns, depending on whether one or two lifetime components were utilized to fit the Ps spectra. Notably, no Ps lifetime components longer than 1.95 ns were identified for the hydrated sample. Upon dehydration, the 2.2 ns lifetime component, which is in a comparable Ps lifetime range to the Ps lifetime values from both hydrated femur (~1.8 ns) and three different collagen sources in Table 2, persists along with the appearance of three new longer lifetime components of 6.5, 21, and 56 ns (Figure 3, Table 4). The pores corresponding to Ps lifetime shorter than 2.2 ns existed regardless of water presence in bone and showed the highest Ps intensity, while the pores emerging following dehydration and corresponding to Ps lifetimes 6.5 and 21 ns displayed an equal intensity between them. The pores corresponding to Ps lifetime 56 ns showed the smallest occupation by Ps. Vacuum drying with or without 80 °C heating did not affect the lifetime or intensity values as long as the sample was evacuated under vacuum for at least 24 h. All but the subnanometer voids (~2.2 ns Ps lifetime component) are the result of removing the “free water” (see Table 1) to produce a 24.3% porosity organic–mineral bone nanocomposite. In addition to the dehydrated bovine femur samples in Figure 3, we also tested a dehydrated mouse tibia, chicken femur, and rabbit femur. PALS data collected from the four animal species (Figure S6) displayed comparable Ps lifetime and intensity values. This suggests that the nanoscale pore structures occupied by water are similar across different animal species and bone locations despite differing lamellar microstructures.
Table 4.
Summary of Average Ps Lifetime Components and Corresponding Pore Sizes Based on Different Pore Geometries Measured from Hydrated and Dehydrated Bovine Femurs (an Average of Dehydrated 1–3)a
| Ps lifetimes in hydrated/dehydrated states | Ps lifetimes appearing in dehydrated state | |||
|---|---|---|---|---|
| Ps lifetime | 1.81 ± 0.05/2.16 ± 0.06 ns | 6.5 ± 0.2 ns | 21.4 ± 0.7 ns | 56.0 ± 1.5 ns |
| D sphere | 0.53 ± 0.01/0.59 ± 0.01 nm | 1.08 ± 0.01 nm | 1.92 ± 0.03 nm | 4.01 ± 0.14 nm |
| D cylinder | 0.42 ± 0.01/0.47 ± 0.01 nm | 0.90 ± 0.01 nm | 1.61 ± 0.03 nm | 3.07 ± 0.08 nm |
| X slabb | 0.27 ± 0.01/0.30 ± 0.01 nm | 0.63 ± 0.01 nm | 1.20 ± 0.02 nm | 2.11 ± 0.05 nm |
| Ps intensity | 4.9 ± 0.2% | 2.3 ± 0.1% | 2.2 ± 0.1% | 1.5 ± 0.1% |
The first column highlights the comparison between the smallest pores present in both the hydrated and dehydrated bone samples.
X slab indicates an empty space between two infinite area slabs.
Figure 3.
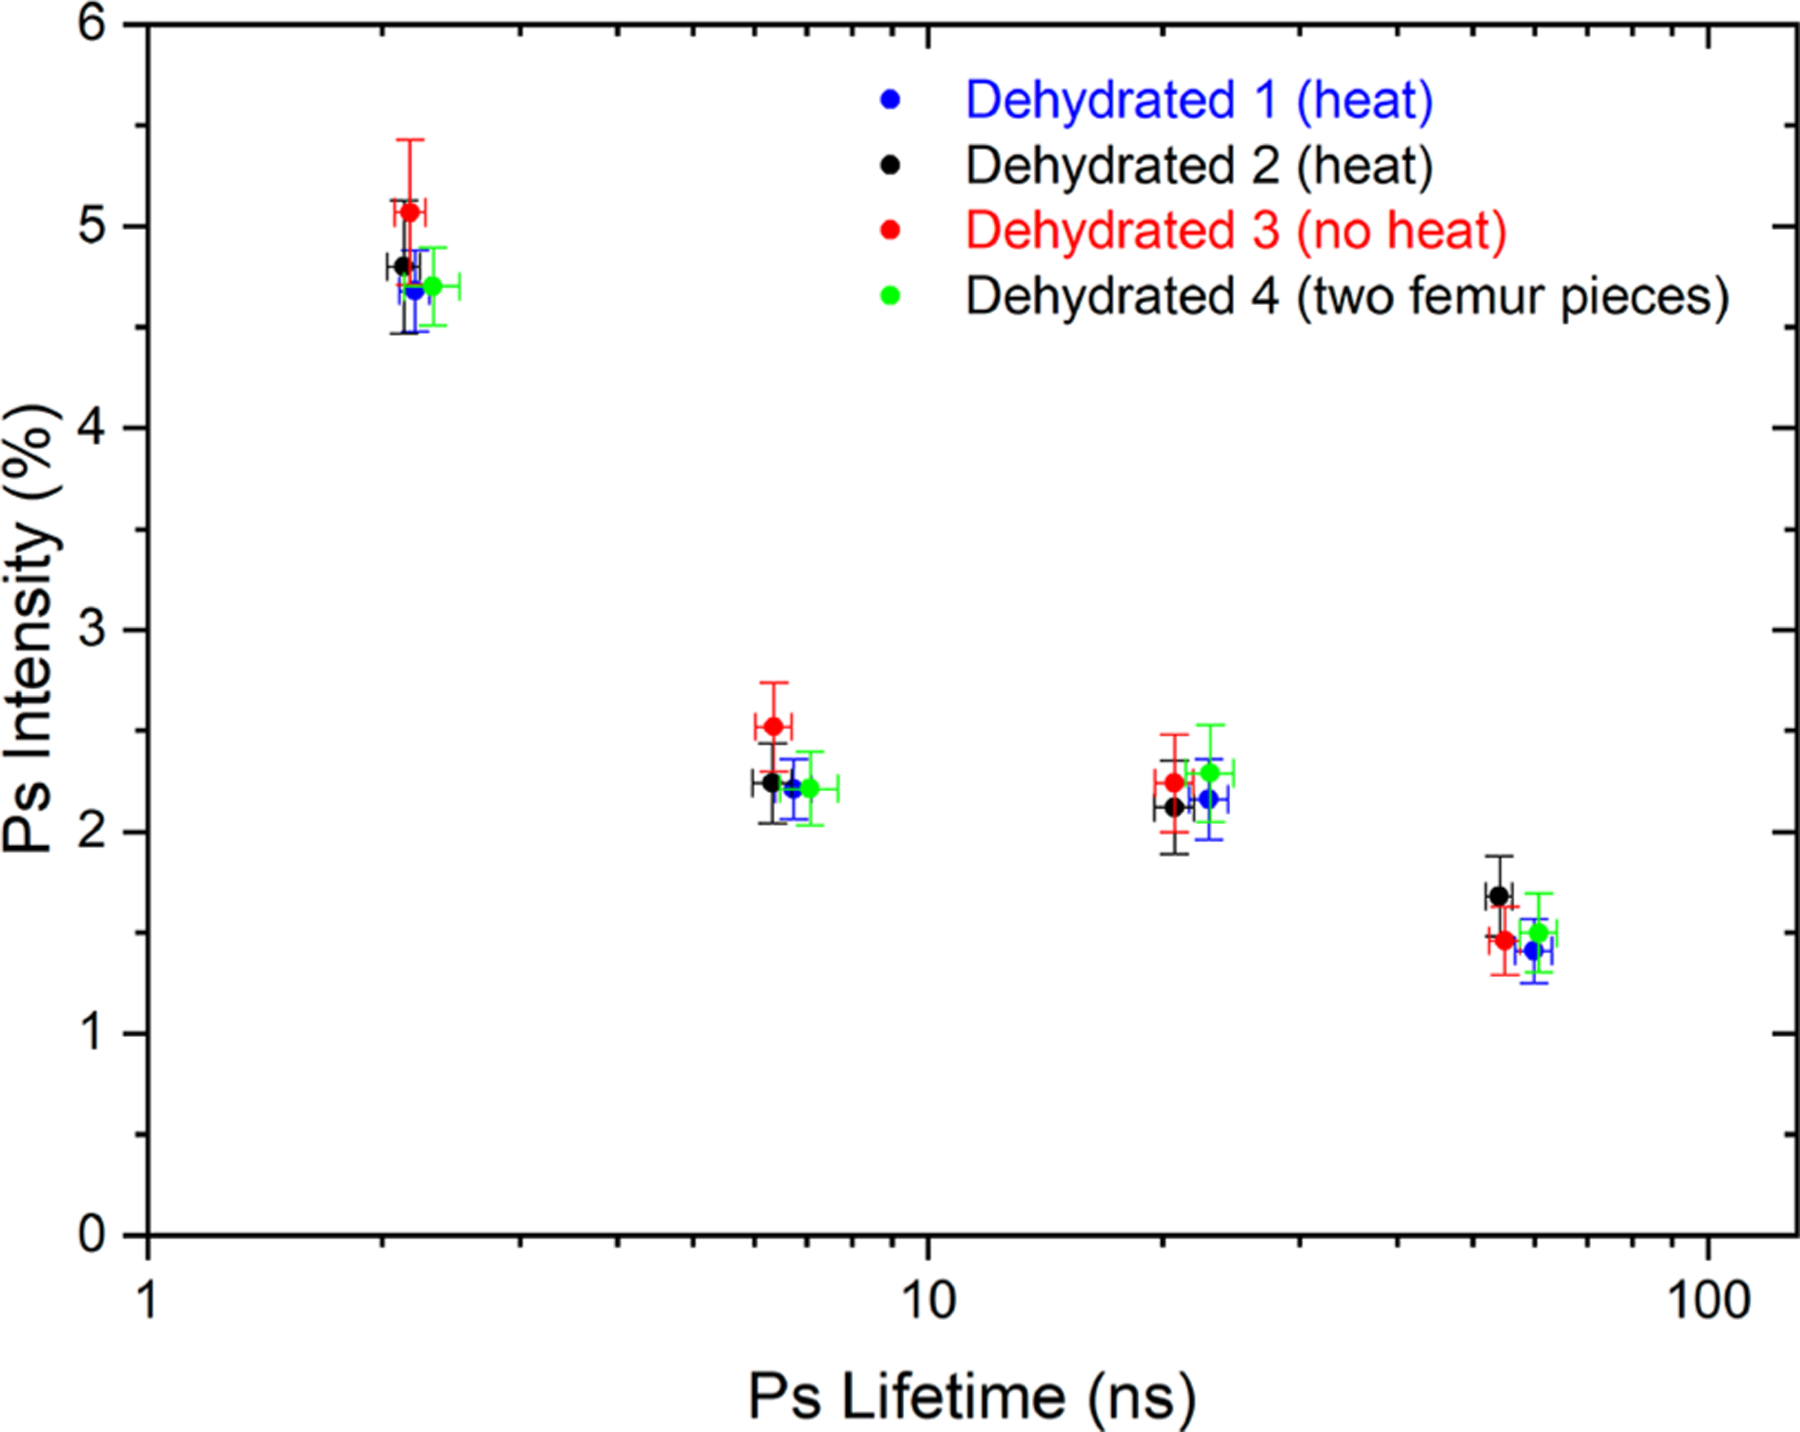
Four fitted Ps lifetimes and their corresponding fitted Ps intensities for dehydrated bovine cortical femur bone. Dehydrated 1 and dehydrated 2 were dehydrated under vacuum with heat. Dehydrated 3 was dehydrated under vacuum with no heat. Dehydrated 4 (two bovine femur pieces surrounding the source) had its fitted intensities reduced by a normalization factor to account for its special source geometry. The four independent sample treatments showed consistent results.
PALS on Deproteinized Bovine Femurs.
A variety of deproteinization treatments involving different bleach concentrations, durations, and temperatures up to 50 °C were utilized for bovine bone samples ranging in thickness from 1 to 3.5 mm. It was found that all of the treatments asymptotically converged where the final dehydrated and deproteinized sample weighed 68% of the hydrated bone mass (Table 1). To confirm the complete deproteinization process by bleach, a bovine bone sample was ashed at 600 °C for 18 h. The ashed bovine sample showed 66% weighed mass fraction. The 2% mass fraction differential between the bleached and ashed bovine samples could be explained by the removal of bound water (water that could be only removed under high temperature). Thus, low temperature bleach deproteinization is complete without the irreversible mineral nanostructure change observed in the PALS results from the ashed bovine sample (see Figure S3 and Table S2).
The PALS spectrum for bleached deproteinized bovine femur is both quantitatively and qualitatively different from the spectra obtained on dehydrated bone. Deproteinization shifted the dominant fitted Ps lifetimes upward into the 75–110 ns range (Figure 4). All other components, except that of the subnanometer voids, effectively disappeared in these high porosity mineral samples for which the void volume fraction of 55.6% is larger than the mineral volume fraction of 44.4%. Additionally, PALS data from deproteinized 1 (treated in 8.25% bleach) and deproteinized 2 (treated in 2.6% bleach) confirm there is no change observed by PALS in nanoscale porosity as a function of two different bleach (sodium hypochlorite) concentrations employed for deproteinization. This result agrees with XRD data from Driscoll et al.50 showing that treatment with 5% concentration of sodium hypochlorite for 30 min or 24 h at the room temperature results in no significant lattice parameter change for the apatite mineral in human dentin. Additionally, Su et al.51 independently confirmed with XRD that sodium hypochlorite does not alter the mineral component of cortical bone under a treatment of 0.35 M sodium hypochlorite solution for 6 days. The deproteinization method employing sodium hypochlorite has been routinely used for studying bone. Recently, Nyman et al.52 and Pang et al.53 deproteinized human and swine cortical bones to study changes in the bound water fraction by a removal of the organic matrix and a continuous phase in the mineral structure and its mechanical contribution to cortical bone properties, respectively. Interestingly, if mineral recrystallization changes were occurring, we may well detect this directly in PALS as the method is exquisitely sensitive to vacancy defects that trap positrons or to structural changes that can alter the positronium intensity. No such changes ascribable to mineral recrystallization are observed in our data.
Figure 4.

PALS discrete lifetime fitting results for deproteinized 1, 2, and 4 bone samples. Average data for dehydrated 1, 2, and 3 bone is provided for comparison. Dehydrated 3 and deproteinized 4 data are from the same bovine femur piece. The black dotted line guides the eye through dehydrated sample data. The blue dotted line connects data from the deproteinized samples.
For such high porosity samples, we expect the voids to be percolated into a continuous open network (conceptually one pore that extends throughout the sample) in which the light and mobile Ps atom probes an average spacing between mineral lamella and results in a single fitted Ps annihilation lifetime. However, the discrete lifetime fitting presented in Figure 4 requires at least two long lifetimes, suggesting that there is a range or distribution of Ps lifetimes present in the PALS spectrum. This prompted us to use a continuum lifetime fitting program called CONTIN54 that fits a distribution and determines an average Ps lifetime from that distribution without the bias induced by preselecting the number of Ps lifetimes to be fitted in discrete lifetime fitting.
Ps lifetime spectra from four different deproteinized treatments measured by PALS with the high gamma detection efficiency spectrometer (appropriate for measuring the longer Ps lifetime) were fit with CONTIN, yielding mean Ps lifetimes that ranged from 99.7 ± 0.2 to 106.3 ± 0.2 ns (Table 5), and a range of lifetime values from ~80 to 115 ns. On the basis of the evolving view of recent literature that bone mineral lamellae are composed of thin polycrystalline plates of irregular area (fused into arches or stacked as sheets),2,29,30,36,37 we have adopted, such a model with PALS to determine the average spacing between mineral lamellae X (lamella can be flat plates or curved, parallel or inclined to each other as shown in the Figure S2). For the quantum mechanical calculation of pore size from fitted Ps lifetime,55 we use a parallel plate geometry to simplify calculation of positronium wave functions between lamella. There should be no loss of generality since for all the lamella shapes in Figure S2 the classical mean free path MFP is identical; and thus, quantum mechanical differences from nonexact wave functions will be negligible. We interpret X = (1/2)MFP as an average lamella spacing for the general case, as discussed in the SI.
Table 5.
Results of Ps Continuum Lifetime Fitting for Four Deproteinized Treatmentsa
| deproteinized sample | mean lifetime τmean (ns) | X(τmean) (nm) | Xmean (plate spacing) (nm) |
|---|---|---|---|
| deproteinized 1 | 101.9 ± 0.2 | 4.88 ± 0.03 | 5.38 ± 0.03 |
| deproteinized 2 | 106.3 ± 0.2 | 5.52 ± 0.03 | 6.00 ± 0.03 |
| deproteinized 3 | 100.6 ± 0.2 | 4.72 ± 0.03 | 5.14 ± 0.025 |
| deproteinized 4 | 99.7 ± 0.2 | 4.61 ± 0.03 | 4.95 ± 0.02 |
| deproteinized 4b | 100.5 ± 0.2 | 4.70 ± 0.03 | 5.02 ± 0.03 |
The mean Ps lifetime of the distribution is shown along with the deduced value of X(τmean) using the infinite plate model. The correctly averaged spacing, Xmean, is shown in bold.
Repeated PALS experiment with the same sample.
As a further technical point about averaging to get X, because of the breadth of this PALS lifetime distribution, it is not correct to convert the mean Ps lifetime to a plate/lamella spacing. This value is called X(τmean). Instead, one needs to first convert the CONTIN-fitted number distribution of Ps decays in lifetime τ, dNPs/dτ, to a distribution in X, dNps/dX, and then determine the average in X. To obtain the number distribution of decays in plate spacing X, we need the following:
Our version of CONTIN has been modified to directly fit the lifetime spectrum into a parallel plate pore geometry to determine the appropriate number distribution in X and, hence, the correct average spacing Xmean. A typically fitted distribution in X is shown for the deproteinized 1 sample in Figure 5. Overall, Xmean is found to be 7–10% larger than X(τmean) as shown below in Table 5.
Figure 5.

Typical distribution in plate/lamella spacing X (based on the infinite plate model) deduced using the continuum fitting program, CONTIN. The area under the curve is normalized to unity. For deproteinized 1, the average of this distribution is Xmean = 5.38 ± 0.03 nm.
In addition to the fitted Ps lifetime, the concomitantly fitted Ps intensity carries useful structural information for bone. The fitted total Ps intensity at about 11% (regardless of discrete lifetime or continuum fitting) was largely unchanged by the removal of the organic matrix to leave just the self-supporting mineral framework. We know from Table 2 that pure collagen forms Ps intensity at 13%, but the organic matrix only comprises ~20% of the dehydrated bone mass (it is mass that stops positrons and forms Ps). Clearly, the mineral is forming Ps with intensity at ~11%. This is a surprisingly large Ps formation since one observes no Ps formation in macroscopic apatite crystals. We acquired a PALS spectrum on a cm-sized single crystal facet of a larger fluorapatite mineral specimen and observed no Ps formation as expected (the pore space between atoms in the single crystal is too small for Ps to form). The high Ps formation fraction must be related to the nanometer-sized crystals of bone mineral. It is well-known that positrons in nondefective solids can diffuse up to ~10 nanometers before annihilating or encountering a solid surface where positrons can trap in surface states or form Ps that is emitted into the vacuum (there is an extensive body of literature in which low energy (keV) positrons beams (see below) are employed to probe Ps formation near surfaces).39 As a check for consistency with existing bone modeling, bone mineral thickness must therefore be at this small 1–10 nm size scale to form Ps at such a high 11% fraction.
Depth-Profiled Beam-PALS on Deproteinized Bovine Femur.
As a test of how well interconnected the space between mineral lamellae is, a 5 mm diameter focused beam of positrons with variable energy was used to implant positrons at controlled mean distances (from 30 nm to 1 μm) below the surface of a deproteinized sample in high vacuum. This PALS beam technique is much more sensitive to the sample surface compared to bulk PALS where the depth of penetration is ~1 mm. To minimize the damage to this surface from cutting and preparation, it was successively polished with diamond and then alumina paste down to 50 nm grit. All the Ps lifetime spectra acquired at beam energies from 1.2 (mean depth 30 nm) to 10 keV (mean depth 1.0 μm) have the same feature in common: copious Ps formation (~15%) and one fitted Ps lifetime ≈ 140 ns corresponding to that of Ps annihilating in vacuum. The interpretation is simply that all Ps formed inside the sample up to at least 1 μm deep can readily diffuse between the mineral lamella and escape through the sample surface into the vacuum of the spectrometer. This confirms our suspicion that deproteinized bovine femur is a fully interconnected void network in which Ps has the ability to diffuse at least a couple of micrometers (this experiment sets no upper limit).
Simulated Pore Size Distribution (PSD) Result of Single Type I Collagen Molecule and Collagen Microfibril.
When the single collagen molecule with triple-helix structure containing amino acid side chains constructed by Gautieri et al.56 was analyzed using the Voronoi decomposition of the void space, a nominal spherical pore diameter of around 0.3 nm was identified. These subnanometer pores were found within the triple helical structure of the collagen molecule itself as displayed by the portion of the PSD result highlighted as blue in Figure 6A and noted as α in Figure 6B. Such an intramolecule PSD would correspond to Ps lifetimes in the range from ~0.8 to 3.2 ns based on the spherical model. This Ps lifetime range of ~0.8–3.2 ns is consistent with the previously published PALS experimental result obtained from collagen in plasma water, showing ~2 ns Ps lifetime.41 When a collagen microfibril containing the carbon backbone of 5 collagen molecules without the presence of the amino acid side chains was constructed based on the coordinates reported by Orgel et al.,28 two distinct porosity ranges were found as shown in Figure 6A. Pores ranging from 0.9 to 1.3 nm (corresponding to 4.5 to 8.9 ns Ps lifetimes based on the spherical model) were found in the region between the collagen molecules (within collagen microfibril), as noted β in Figure 6B. In addition, 1.6–2.1 nm pores (corresponding to 15–25 ns Ps lifetimes based on the spherical model) were found at the terminal segments of the collagen molecules within the collagen microfibril, noted as γ in Figure 6B. The same pore range of 1.6 to 2.1 nm (γ) from the PSD result also corresponds to 21–35 ns Ps lifetimes based on the cylindrical model, which more closely resembles the elongated pore shape at the terminal segments of the collagen molecules (Figure S5). When the PALS intensity percentage (indicated by three gray circles on each gray dotted line (α, β, and γ)) is compared to the simulated porosity percentage from Figure 6A, there is a reasonably good agreement between the PALS intensity and the peaks of the simulated PSD.
Figure 6.

(A) Calculated pore size distribution (PSD) functions of collagen molecule (blue color) and collagen microfibril (red color) assuming spherical geometry. Three gray dotted lines indicate experimentally determined pore diameter sizes, corresponding to 2.16, 6.5, and 21.4 ns Ps lifetimes, based on the spherical pore shape. Three gray circles on the gray dotted lines indicate experimentally determined Ps intensity values for each lifetime component from Table 4. (B) Visualization of the collagen microfibril illustrating where three pore sizes are located. α indicates pores within collagen molecules. β indicates pores between collagen molecules. γ indicates pores that are located at the termini of collagen molecules within the collagen microfibril.
Pores within Collagen Structure without Mineral and Water Presence.
PALS results from the hydrated bone and dehydrated collagen from intact rat tail tendon and collagen powder from bovine tendon indicate two Ps lifetimes (Table 2), suggesting the presence of either a bimodal distribution containing at least two different void sizes or a broad, unimodal distribution of subnanometer voids. The collagen from our demineralized and dehydrated bovine femur showed PALS results consistent with those of the tail tendon and collagen powder. Such voids at 0.5 nm diameter scale exist in intermolecular regions governed by weak interchain van der Waals forces and are typical of polymeric materials.43
When the hydrated bovine femur was characterized by PALS, the Ps decay could be fit by one lifetime of 1.81 ns or fit by two lifetimes of 1.02 and 1.95 ns. PALS measurements from the dehydrated bovine femurs displayed a persistent and comparable 2.2 ns Ps lifetime component. We know that there are larger voids in bovine femur as shown in Table 4 and Figure 3. However, when they are filled with water, they are not detected as voids. The fitting of a single (1.81 ns) Ps lifetime or two Ps lifetimes (1.02 and 2.9 ns) in the hydrated bone was still shorter than 2.2 ns Ps lifetime from the dehydrated bone and 1.28 and 2.70 ns Ps lifetimes from the dehydrated and demineralized bone, respectively, indicating that water is partially filling the subnanometer voids (narrowing the range of void sizes) and/or that the packing structure of collagen in between the mineral structure (to form a nanocomposite) is now different from that of the pure collagen packing. The simulated PSD result from the collagen molecule with the amino acid side chains (Figure 6A) supports the claim that both Ps lifetime components (1.4 and 2.9 ns) from the pure collagen without mineral and the shortest Ps lifetime components (1.81 and 2.2 ns) from the hydrated and dehydrated bone come from intracollagen molecular spacing.
Spacing between Collagen Molecules Occupied by Water.
Ps lifetime data of the dehydrated bovine femur shows three additional longer Ps lifetimes after the dehydration process (Table 4). The three additional Ps lifetime components have greater total Ps intensity combined than that of the subnanometer voids inherent to the collagen (6.0% intensity after dehydration at 80 °C for overnight vs 4.9% before dehydration). Since the additional lifetimes appeared only after removing water in bone, it is reasonable to conclude that Ps is probing the 24.3% by volume in bone that water used to occupy. The PSD result (noted as β in Figure 6A) shows the range of the converted Ps lifetime, from 4.5 to 8.9 ns, based on the identified porosity sizes, which covers the 6.5 ns Ps lifetime. Thus, the 6.5 ns Ps lifetime component from the dehydrated bone is most likely from pores located between adjacent collagen molecules. The PSD result also shows the nominal pore diameter range of 1.6–2.1 nm (15–25 ns Ps lifetime) found at the terminal segments within the collagen microfibril suggesting that the 21 ns Ps lifetime component most likely comes from the termini of collagen molecules within a collagen microfibril, associated with the D-spacing commonly observed in EM and AFM images. Despite its low Ps intensity, the 56 ns component corresponding to void diameters in the 3–4 nm range would be difficult to reconcile with intrafibril voids. Since the largest identified pores from the collagen microfibril structure is ~2.1 nm, the 56 ns Ps lifetime component could come from intercollagen microfibrils or from the interface between the collagen and mineral structure. This intimate interaction with the surfaces of nanoscale mineral crystals appears to stabilize and largely preserve the natural packing of collagen fibrils during the dehydration process, thus, resulting in some unusually large voids. Indeed, the volume vacated by water (24.3%) is comparable to the volume occupied by the collagen itself (31.3%) as shown in Table 1. Unlike other conventional material characterization techniques such as XRD or TEM, PALS measures signal from empty space, which enabled us to measure the voids created by water removal. The existence of these four separate Ps lifetimes indicate that four distinct void sizes at the 0.6, 1.1, 1.9, and 4.0 nm level exist in the collagen rich region between the mineral crystals. These pores sizes are consistent with the mineral lamella spacing since the larger voids that are detected (2.11–4.01 nm component) are smaller than a maximum size set by the mean lamella spacing itself of ~5 nm (see Table 5). These different-sized voids compete for and trap Ps which leads to different intensities of Ps annihilating in each respective pore size. Also, the porosity comparison between the dehydrated collagen and the dehydrated bone demonstrates the importance of rigid mineral as a structural component. It is the mineral component that stabilizes the dehydrated bone to preserve the hierarchical porosity structure from 0.63 to 4.01 nm as opposed to the collapsed dehydrated collagen structure with just intracollagen molecule porosity remaining. The next step was to remove the collagen altogether to reveal the full-size scale available for the collagen (and water) packing.
Independent Method for Assessing the Spacing between Mineral Lamella from Specific Surface Area (SSA) Measurements.
The deproteinized and dehydrated bovine femur in PALS presented a broad Ps lifetime distribution about a centroid value in the 100–106 ns range. If we assume the mineral crystals are thin lamellae, this corresponds to average mineral lamellae spacing in the 5–6 nm range as shown for Xmean in Table 5. In addition, the specific surface area of one of our deproteinized bovine femur samples was measured by BET analysis to be SSA of 118 m2/g. When combined with our determination of the porosity P of the deproteinized bone (55.6 ± 1.0%), our SSA data provides a completely independent measurement of average mineral plate spacing as discussed below.
A general measure of the distance an atom or molecule would travel between collisions with the surface of a collection of arbitrarily shaped solid particles (or the distance between collisions inside a closed pore of any shape) is called the mean free path, MFP. From the kinetic theory of gases the MFP for a gas atom or molecule is
where Vvoid and Svoid are the volume and surface area of the void (for our sample, one can think of the void as all of the network volume vacated by water and collagen and the surface as that of all the mineral crystals, which is determined by SSA).
Since porosity P is defined as then and
| (1) |
We can equivalently use in the above formula the specific mineral volume per gram of mineral (which is simply the inverse of the density, 1/ρmineral) and the void surface area per gram (which is the SSA) to relate MFP directly to SSA and P as
| (2) |
This formula is independent of crystal shape, but if we assume for comparison to PALS a thin mineral lamella model, then the average lamella gap is X = (1/2)MFP (see derivation in SI). For a mineral density of 3.16 g/cm3 and P of 55.6 ± 1.0%, we can thus know the ratio P/(1 − P) to about ± 4% accuracy. The real limitation might well be the accuracy to which we know the SSA. There is the absolute error (accuracy, a systematic error that is mainly relevant in comparing SSA using different techniques) and the statistical error for each measurement (precision, which can be determined experimentally by simply rerunning the same sample many times). The error in accuracy appears to be quite large since we have different SSA values from BET (our value at 118 m2/g agrees well with literature values in the 100–115 m2/g range44,47) compared with SSA from NMR that is 30% higher at 154 m2/g.48 Using the equation above, we determine XBET (lamella spacing based on SSA by BET) to be 6.7 nm and XNMR (lamella spacing based on SSA by NMR) to be 5.1 nm. This range agrees quite well with the range of Xmean from PALS, but closer inspection of Table 5 indicates that all but the sample 6 results clearly favor the lower value from XNMR.
Setting Limits on Lamella Thickness t.
Using the generalized model of mineral lamella, we derived in the SI the relation between t and the MFP (and hence X = (1/2)MFP) to be . For P = 55.6%, we have t ≥ 0.80X, where the lower limit pertains to lamella of infinite lateral extent. To calculate the effect of finite lamella size, we need to pick a lamella geometry to provide an example. For ease of calculation, we assume a rectangular solid mineral plate with dimensions t (thickness), w (width), and L (length) and with surface area 2(tw + tL + wL) and volume twL, then
| (3) |
Substituting this expression for SSA back into eq 2 and continuing to use the mineral lamella model where X = (1/2)MFP we find after some rearranging
| (4) |
Once we pick a porosity and mineral plate shape, such that t/w and t/L are constant, then X is linearly related to thickness.
This linear connection between X and t, shown graphically in Figure 7 specifically for a rectangular plate model, assumes the value of P = 55.6% and for four shapes of mineral plates that vary from infinite width and length to quite small plates with w = 3t and L = 6t. For these finite size examples, we have constrained the length to be twice the width consistent with several reports in the literature, sometimes referred to as the “plywood sheet” model (L ~ 2w).57,58 A range of thickness values is deduced for each value of SSA. From the NMR result, we deduce a “hard” lower limit on t of 4.1 nm when w and L are infinitely larger than t. It is a hard-lower limit because it is general to any mineral lamella shape and finite size effects increase t. It is nonetheless a lower limit on the average value of t averaged over the millimeter size scale of our samples. The upper limit of t = 6.1 nm as the crystal size approaches (t × 3t × 6t) is considered a “soft” upper limit because it is specific to a plate model and a lower crystal size limit is surmised. For the BET result, the range on t is 5.4–8.0 nm. Overall, our range on deduced lamella thickness of ~4.1–8 nm nominally agrees with the mineral plate thickness of ~5–8 nm revealed by electron microscopic techniques.30,36,59
Figure 7.

Example of how finite size mineral lamella effects the deduced lamella thickness for a rectangular plate model. Lamella spacing X is linearly related to mineral plate thickness t with porosity fixed at 55.6% for four different rectangular shapes of mineral plates. Constraints on the average value of X imposed by results from PALS and SSA from BET and NMR (plus porosity measurement) determine a range in the deduced average mineral plate thickness in bovine femur. Selected plate sizes for rectangular plates are assumed to have length that is twice the width.
The recent article by Reznikov et al.37 suggests a more complicated arrangement of platelets very close to the size deduced herein (5 nm × 25 nm × 75 nm) but then 2–4 of the platelets are stacked together with a gap of only 1–2 nm. If we had solely depended on the PALS data, we could argue that Ps would not really probe the close spacing interior to the putative stacks since any Ps formed at these interior surfaces would quickly diffuse into the inter-stack space and not return to probe the narrow 1–2 nm gap spacing. Ps is a quantum mechanical particle and the zero-point energy in such a narrow gap is too high a barrier to surmount once Ps has approached thermalization in the larger spaces. However, the nitrogen adsorption and SSA measurements by NMR should be fully sensitive to both the interior and exterior surface area of the stacks and the comparably large values of deduced plate spacing do not support such small gaps between platelets. Moreover, on the basis of the equations for calculating SSA of the platelet-shaped crystal and the acicular crystallite using specific dimensions for both shapes chosen by Reznikov et al.,37 the SSAs are 158 and 290 m2/g, respectively (SSA is conventionally measured as per gram of mineral). In ref 37, eqs 1–3 contain an extra multiplicative factor of 0.32, which appears to be related to the fact that mineral is 32% of a whole body skeletal mass,60 indicating the SSA per gram of skeleton rather than per gram of mineral. The calculated SSA of the platelet-shaped crystal of 158 m2/g is closer to our measured SSA value of 118 m2/g and previously reported values of 100–115 m2/g measured by BET and 154 ± 15 m2/g measured by nitrogen adsorption and NMR, respectively. These SSA results support the conclusion that the mineral structure in bone is likely to resemble a general lamella/platelet shape (see refs 44 and 47). The SSA results do not support an isolated, acicular mineral crystal shape but also do not exclude a platelet of side-by-side bonded acicular crystals as described in ref 37.
Interconnected Nature of Space Surrounding Mineral Structure in Bone.
The results of PALS depth-profiling below the surface of deproteinized bone indicate that the voids surrounding the mineral lamella are an interconnected network. If Ps is delocalized in a sample-wide porous network (as opposed to localized in voids of various sizes which produce 4 distinct Ps lifetimes in the dehydrated collagen-mineral nanocomposite), we would expect to fit a single average Ps lifetime with no distribution. The premise is that every Ps atom samples the same average environment in a network and hence has the same average lifetime/void size. The observed distribution in Figure 5 is inconsistent with this premise. To resolve this inconsistency, we conclude that there must be some natural variation in average network plate spacing due to a variation in mineral plate size, mineral/collagen ratio, and/or porosity on a size scale that is larger than that probed by a single Ps atom (hence the ensemble of Ps atoms presents a distribution of lifetimes). A Ps atom can only probe the sample environment within approximately one diffusion length. We know from the depth-profiling that Ps is able to diffuse at least 1–2 μm as discussed in the Results. A better estimate of a lower limit can be made, assuming Ps thermalizes in the sample and then diffuses unimpeded for a lifetime of ~100 ns with an MFP ~ 10 nm. This Ps thermal diffusion length is estimated to be ~5 μm (see SI). This diffusion length is long enough to be consistent with virtually all Ps escaping into vacuum when implanted only 1–2 μm deep with the positron beam. Concomitantly, the Ps sampling sphere it defines with 10 μm diameter is also small enough to ensure that our positron source implants positrons into and forms Ps over a probe volume of the sample that is 105-106 times larger than the volume sampled by a single Ps atom (the source is ~2 mm in diameter with typical implantation depth of 22Na positrons of ~200 μm). This suggests that the mineral spacing must have some natural variation (heterogeneity) at a size scale that is larger than 10 μm and much smaller than the 2 mm size of the radioactive source since all of our PALS spectra of the deproteinized mineral present a broad pore size distribution.
Study Limitations and Future Directions.
A central conclusion from this study is that the PALS technique has the sensitivity to resolve a detailed hierarchy in size scale present in the collagen–water–mineral nanostructure of bone. In future work, PALS could be sensitive in detecting changes between different bone nanostructures due to such effects as aging or genotype, etc. For instance, Fratzl-Zelman et al. revealed that bone samples from patients with osteogenesis imperfecta (OI) type VI have thinner nanoscale mineral crystals, compared to the control population.61 Combining this information of nanoscale structural change induced by aging or genetic mutations with the porosity change obtained by PALS, it may be possible to understand how these types of genetic changes affect the nanostructure of bone.
The mean lifetime for Ps annihilating in the evacuated space between the mineral crystals can be measured to high and reproducible precision of ±0.2%. This precision in the Ps lifetime would result in a ±0.6% statistical precision in the deduced MFP once a pore shape model is selected. However, the systematic uncertainty (or accuracy) in the MFP deduced from different pore shape models is an order of magnitude larger and arises from the pore shape model dependence in converting an average Ps lifetime into a pore size and hence into MFP. Nevertheless, precise comparisons of mean plate spacing or pore diameter assuming the identical pore shape model are feasible at better than the 1% statistical level. To be cautious, sub 1% comparisons in pore size/mineral spacing may be difficult to realize as shown in Table 5 where different samples taken from the same (large) bovine femur present a range in deduced lamella spacing, X, that is, ±5% of the average for the first four samples and even higher when deproteinized 2 is included. Roschger et al. recently published a study examining mineral crystal sizes between modeling and remodelling bone regions by employing X-ray scattering. The study shows that depending on different locations, mineral crystals have different thickness. More specifically, mineral crystals from the modeling sites are distinctly larger.62 This mineral crystal size variation as a function of different locations could result in the mineral spacing variation in Table 5, which is larger than the 1% statistical precision of PALS. This suggests that another future study could sensitively probe 3-D position dependence of bone nanostructure at the millimeter scale by tracking the precise location of each bone sample section.
CONCLUSIONS
By directly probing the void structure, PALS complements characterization methods that image or probe electron density. It provides a completely independent view of a complicated nanocomposite system where complexity of structure leads to widely varied approximations of the physical dimensions of the mineral crystals from various characterization methods.
This study reveals the presence of five separate levels in nanocomposite phase size scales. Subnanometer voids appear within collagen regardless of the presence of mineral and/or water. Water-templated voids in dehydrated bone are found to occupy three size scales of voids: 1.1, 1.9, and 4 nm. The largest size scale is observed in deproteinized samples as a 5–6 nm mean spacing between mineral lamella. The simulated PSD from the collagen molecule and microfibril clearly delineate a corresponding series of pores. The diameter range around 0.6 nm originates from intracollagen molecular voids (inherent to the triple helix structure). The pores with mean diameter of 1.1 nm comes from intercollagen molecular spacing and 1.9 nm comes from spacing created between two ends of collagen molecules. These water-filled pores are located in regions that have been routinely observed to generate the “D-spacing” commonly observed in EM and AFM studies. The pores with mean diameter near 4 nm are most likely from the interfaces between the collagen fibrils as constrained at the upper limit by the mineral spacing. After removal of the organic matrix, the mineral phase is self-supporting which indicates that the putative lamellae are interconnected into a rigid network. The high porosity (~55.6%) empty space between the mineral lamellae is found to be completely interconnected. The distribution of Ps lifetimes in this porous mineral network indicates that there is a natural variation in average lamella spacing on a size scale that is not less than 10 μm. The overall average spacing between the mineral lamella deduced by PALS, 5–6 nm, is in quantitative agreement with independent measurements using porosity and SSA (from NMR, less so for BET). This suggests that a collagen microfibril consisting of 5 collagen molecules could fit in between two mineral lamellae. The mineral spacing (~5–6 nm) and mineral thickness (~4–8 nm based on BET and NMR) deduced here with PALS and in concert with the SSA measurements contradicts some reports in the literature25,31 of rather small crystal sizes well less than 3 nm while agreeing with other reports.30,36,37,59
In summary, hydrated bone is shown to possess an inherent nanoscale porosity associated with collagen molecules/fibrils. Upon dehydration, three additional features associated with water-filled voids are detected. All four of these nanoscale structures, as well as the mineral lamella size and spacing, are likely to play an important role in the macroscopic mechanical properties of bone.12–14
METHODS/EXPERIMENTAL SECTION
Bovine Femur and Collagen Powder.
The bovine femur from 12 to 18 month-old male was purchased from a local butcher in Ann Arbor, Michigan, USA. Collagen powder derived from bovine Achilles tendon (Sigma-Aldrich, St. Louis, Missouri, USA) was employed in the study.
Rat Tail Tendon.
Tendon was collected from two wild type male and two female rats (total 4 wild type rats) (strain: 403-SAS FISCH). The rats were 12–17 weeks old. The tails were stored frozen in PBS solution in −20 °C freezer and thawed in room temperature. The skin of each tail was manually removed, and ~1 mm tendon portion was isolated from fat and soft tissue with a surgical knife. The isolated tail tendons were stored in PBS solution until the PALS measurement.
Bone Processing for PALS.
The bovine femur was initially frozen at −20 °C. When ready for processing, the sample was placed in a plastic bag in a room temperature water tub until it reached room temperature. Once the bovine femur was fully thawed, residual fatty tissue on the surface of the bone and marrow were manually removed and rinsed with tap water. The midshaft region of the bovine femur was perpendicularly cut into ~3.5 mm thick torus-shaped pieces using a pathology saw (Model 312; Exakt Technologies, Oklahoma City, Oklahoma, USA). A torus-shaped piece was further cut into 1–3.5 mm thickness and 15 mm by 10 mm rectangular shaped pieces using a low speed rotary saw (IsoMet; Buehler, Lake Bluff, Illinois, USA) to fit onto the PALS source and sample holder. The final cut pieces were rinsed with nanopure water, stored in a −20 °C freezer, and thawed as needed for experiments.
Sample Treatments.
There are four preparations of bone sample employed in this study; hydrated, dehydrated, demineralized, and deproteinized. In this study, a hydrated sample is referred to as the sample that was mechanically processed but not dehydrated or chemically treated.
Dehydration.
The sectioned bone sample was sonicated in nanopure water for 4 min to ensure an initially hydrated state. The sample was then heated overnight in a vacuum oven below 100 °C.63 The mass of hydrated bone before and after dehydration was measured to calculate the mass fraction of water loss.
Demineralization.
The hydrated bone sample was placed into a fixation buffer of 0.8% paraformaldehyde (prepared from the powder form, Acros Organics, New Jersey, USA) and 0.2% glutaraldehyde (Sigma-Aldrich, St. Louis, Missouri, USA) for 24 h.64 After the cross-linking process, an X-ray image (Faxitron microradiography system; Faxitron, Tucson, Arizona, USA) with the setting of 25 KV, 6 s of exposure, and 3X distance of the cross-linked bone was acquired to establish a baseline mineralization level. The cross-linked sample was immersed in a mixture of 20% EDTA solution (Fisher Chemical, New Jersey, USA), 0.2% paraformaldehyde and 0.05% glutaraldehyde64 on a shaker for over 30 days with solution changes every 3 days.
Full demineralization was confirmed by X-ray image. A micro-CT image (In Vivo Bruker/Skyscan 1176; Bruker, Billerica, Massachusetts, USA) with the setting of 9 μm resolution, 0.5 mm aluminum filter, 2 frame averaging, and 0.3 degree rotation step was independently taken for the demineralized sample, which was verified by the X-ray image, to ensure that the sample was indeed fully demineralized. The fully demineralized sample was dehydrated in a vacuum oven (80 °C, overnight) before PALS measurement. The mass before and after demineralization and dehydration was measured to calculate the mass fraction of mineralization loss.
Deproteinization.
Hydrated bone samples were immersed in 2.6%, 5%, and 8.25% sodium hypochlorite solution (The Clorox company, Oakland, California, USA) at 37 °C on a temperature controlled shaker32,65 for over 30 days to ensure that the full deproteinization was achieved. The solution was changed for every 3 days. For each deproteinization process, the sample was dehydrated in a vacuum oven at 80 °C overnight. The mass before and after deproteinization and dehydration was measured to calculate mass fraction of the organic matrix loss. To test the efficiency of chemical deproteinization, the bovine femur was also thermally deproteinized and the change in mass fractions were compared. The bovine femur was ashed in an oven at 600 °C for 18 h. As soon as the ashed sample was cool enough to be measured, the mass of bone before and after ashing was measured to calculate the mass fraction of the organic matrix loss.
Bone Volume Measurement.
Bone volume for the hydrated, dehydrated, and deproteinized samples (a single sample moved serially through the treatments) was measured by micro-CT as described above. Values of the bone volume from the micro-CT images from each sample treatment were analyzed by NRecon (Bruker, Billerica, Massachusetts, USA) with the setting of 3 smoothing, 16 ring artifact reduction, 30% beam hardening correction and dynamic data range from 0 to 0.05.
Nitrogen Gas Porosimetry.
Deproteinized bovine (mineral only) femur was granulated by pestle and mortar. N2 adsorption/desorption isotherms were measured at 77 K in the range 1.00 × 10⁻² ≤ P/P0 ≤ 1.00 on a NOVA 4200e instrument by Quantachrome Instruments (Boynton Beach, Florida USA), running version 11.03 of the NovaWin software package. Ultrahigh purity N2 (99.999%) was purchased from Cryogenic Gasses and used as received. BET surface area was calculated using the BET assistant and pore size distributions were calculated using the Nonlocal Density Functional Theory (NLDFT) N2 silica adsorption branch kernel at 77 K based on a cylindrical/spherical pore model as implemented in NovaWin 11.03.
PALS Experimental Schematic.
PALS experiments were performed on hydrated, dehydrated, demineralized, and deproteinized bovine femur samples after each treatment was complete. For the collagen powder, as-received, vacuum with no heating (overnight), and heating at 80 °C under vacuum conditions were employed. For the rat tail tendon, no heating under vacuum condition was utilized. For the fluorapatite single crystal, PALS was performed in air with no heat. Each PALS spectrum was acquired for at least two days to collect 107–108 annihilation events to ensure reliable spectrum fitting.
PALS Experiment.
Three different spectrometers were used to collect PALS lifetime spectra: two “bulk” PALS spectrometers using various intensities of radioactive 22Na sources to directly inject high energy beta decay positrons into the 1–3.5 mm thick bone samples; and a beam PALS spectrometer wherein a low energy focused beam of monoenergetic (1–10 keV) positrons are shallowly implanted within 1 μm of a bone sample surface.
Bulk spectrometers each have two gamma detectors: one labeled “start” to detect the 1270 keV gamma from the 22Na nucleus that is emitted simultaneously with the beta decay positron; and one labeled “stop” that detects one of the two subsequent 511 keV annihilation photons. Electronics measure the time between these two γ rays and a histogram records each detected annihilation event as a lifetime spectrum for eventual computer fitting. The exceedingly wide range in sample porosity encountered from hydrated bone (almost none) to deproteinized and dehydrated bone (~55%) with attendant positron and positronium lifetimes in a wide range from ~0.2 to 140 ns led us to use two complementary bulk spectrometers. One is designed for fast time resolution to make sure all the short lifetime events are properly resolved and fitted while the second has high gamma detection efficiency that permits better fitting of long-lived Ps lifetimes.
The high time resolution spectrometer utilizes small 5 cm diameter plastic scintillators (start scintillator is 5 cm long, stop is 2.5 cm long) coupled to 5 cm diameter fast timing photomultipliers (Amperex XP2020) to allow fitting of the full range of lifetimes encountered in this experiment. These small detectors sacrifice gamma detection efficiency for time resolution and therefore we use stronger 22Na sources in the 10–20 μCi range to achieve start–stop coincident event data rates around 100 cps. This spectrometer was used for the collagen powder, the rat tail tendon, the fluorapatite mineral crystal, the hydrated bone, the demineralized bone, and the dehydrated bone where (10–60) million events could be collected in a day to a week of acquisition. The stronger positron source results in more random background noise events in the spectrum that makes it more difficult to resolve lower intensity, long-lived events from the random background. To remedy this the high efficiency bulk spectrometer utilizes two large 15 cm cubic plastic scintillators coupled to 13 cm diameter RCA 4582 photomultipliers to achieve an order of magnitude increase in gamma detection efficiency that permits the improvement in signal to background noise by a factor of 10 while concomitantly increasing the data rate to ~700 cps using only a ~1.5 μCi source. This spectrometer was principally used to collect ~500 million events on fully deproteinized samples where excellent delineation of Ps lifetimes distributed in the 60–120 ns range is warranted. To this end a CAMAC-based LeCroy 4202 time digitizer of high accuracy and linearity is used for event timing instead of the analog (but fast) time-to-amplitude converter (Ortec 567) used in the fast timing spectrometer. Moreover, for long 10 day runs, the sample chamber is back-filled with 20 psi He buffer gas so as not to expose the sample to prolonged oil exposure from the mechanical rough pump. The small effect of Ps annihilating with He was corrected for in the fitting of the spectrum.
The beam PALS spectrometer39 incorporates a variable energy positron beam to implant positrons a controlled but shallow distance (up to ~1 μm) below the surface of a deproteinized sample held in high vacuum. It was used for one specific test to set limits on the ability of Ps to diffuse among the mineral crystals of the deproteinized sample.
PALS Sample Preparation.
For bone samples, both bulk spectrometers use radioactive positron sources deposited as 22NaCl solution onto a tungsten plate within a designated 0.3 cm × 0.3 cm target area. The solution was deposited until the desired source strength was achieved. To prevent radioactive sample contamination, a 13 μm Kapton (polyimide) film was placed between the deposited radioactive source and the bovine femur (this film stops about 8% of the positrons entering it but does not form any positronium signal). Once the bovine femur was placed onto the Kapton film directly over the source mark, a piece of aluminum foil was wrapped to fixate the sample on the tungsten substrate. The aluminum foiled complex was placed in a flat disc-shaped aluminum vacuum chamber that fits compactly between the gamma detectors of each spectrometer. The collagen powder required a special aluminum cylindrical well 1.6 cm in diameter and 1.3 cm deep. Powder was poured to half fill the well volume. The radioactive source deposited on one side of a thin 13 μm thick Kapton film was inserted, and the remaining volume above the source was filled with the collagen powder to achieve ~96% stopping of positrons in the collagen. This Al foil wrapped well was then placed in the flat vacuum chamber described above. The irregularly shaped fluorapatite mineral was placed over the tungsten backed source holder described above with a flat crystal plane face presented toward the source (to preclude source positrons from stopping in air). It was wrapped in aluminum foil and run in air in the fast timing spectrometer.
PALS Spectrum Fitting.
Each spectrum collected is a time histogram of “start”–”stop” time intervals in which positron and positronium lifetimes are fitted with exponentially decaying lifetimes with intensities fitted as the fraction of all decays that occur with that fitted lifetime. A flat background of uncorrelated events is also present and fitted for. We focus on the positronium (Ps) lifetimes since they are most directly related to the void size from which the Ps decays. We use an updated and customized version of the discrete lifetime fitting program “posfit”66 to fit for one positron component (lifetime about 0.4 ns and intensity) and any number (typically 2–4) of Ps components (Ps lifetimes in the range 1–140 ns each with corresponding intensities). Given the real possibility of a continuum distribution of Ps lifetimes, we also use a modified version of the Laplace inversion fitting program “contin”67 to fit plausible lifetime distributions. Contin has a regularization parameter that regulates the number and sharpness of peaks in the fitted distribution and this parameter was found to be optimized when it produced a stable unimodal distribution, an example of which is shown in Figure 5. We use well established models of Ps decay in simple pore shapes68 to make an analytic determination of pore size(s) from the fitted Ps lifetime(s) given an assumed pore shape, either spherical/cubical, cylindrical/channels, or slab shaped/slit pore.55
Structures for Collagen Molecule and Microfibril.
For the single collagen molecule simulations, the triple-helix structure constructed by Buehler Gautieri et al.56 based on PDB code 3HR2 was utilized. This relaxed structure included the complete atomic coordinates for all side chains including hydrogen atoms. For the microfibril simulations, the quasi-hexagonal packed structure constructed by Orgel et al.28 was utilized based on PDB code 3HQV. This rigid structure consists of the backbone Cα carbons and highlights the intertwined rope-like configuration of the microfibril.
Pore Size Distribution.
Pore size distribution was calculated using Zeo++ which is a geometrical tool based on the Voronoi decomposition of the void space.69 Each node and edge of the Voronoi network is deleted if the distance to the nearest atomic surface (defined using the van der Waals radii of each element) is less than the probe radius. The algorithm commences using an infinitely small probe where the entire void space is accessible. The algorithm then repeats this process for increasing probe radius until the void space is inaccessible. The process results in a graph of diminishing void space where the derivative represents the pore size distribution.
Supplementary Material
ACKNOWLEDGMENTS
The authors would like to thank the National Science Foundation (NSF1634680), the National Institutes of Health for the microCT shared instrumentation support (S10 OD017979), the National Institute of Arthritis and Musculoskeletal and Skin Diseases for the Michigan Integrative Musculoskeletal Health Core Center (P30 AR069620), and Monash University for support of this work. The authors appreciate help from Carol Whitinger for sample sectioning and Chris Stephan for μ-CT imaging. The authors would like to thank the anonymous reviewers for helpful comments and suggestions that have substantially improved our analysis and discussion.
Footnotes
Supporting Information
The Supporting Information is available free of charge at https://pubs.acs.org/doi/10.1021/acsnano.0c07478.
Overall experimental schematic employed in the study; illustrations showing how a randomly oriented, non-planar, and irregular shaped lamella can be found on TEM images of bone; proposed mineral plate spacing change before and after ashing at 600 °C of bovine femur; visualization of free volume for each lifetime component (α, β, and γ) from collagen microfibril and a pore shape at the terminal segments of the collagen molecules; fitted PALS data from dehydrated bovine femur, mouse tibia, chicken femur, and rabbit femur samples; summary of mass and bone volume of hydrated, dehydrated, and deproteinized bovine femur; summary of Ps lifetime components and corresponding pore sizes based on different geometries from ashed and chemically deproteinized samples; mathematical derivation to yield a lower limit on the lamella thickness; and estimation of positronium diffusion length in deproteinized bone (PDF)
Complete contact information is available at: https://pubs.acs.org/10.1021/acsnano.0c07478
The authors declare no competing financial interest.
Contributor Information
Taeyong Ahn, Macromolecular Science and Engineering, University of Michigan, Ann Arbor, Michigan 48109, USA.
David W. Gidley, Physics, University of Michigan, Ann Arbor, Michigan 48109, USA
Aaron W. Thornton, CSIRO, Future Industries, Clayton, Victoria 3800, Australia.
Antek G. Wong-Foy, Chemistry, University of Michigan, Ann Arbor, Michigan 48109, USA
Bradford G. Orr, Physics, University of Michigan, Ann Arbor, Michigan 48109, USA
Kenneth M. Kozloff, Orthopaedic Surgery and Biomedical Engineering, University of Michigan, Ann Arbor, Michigan 48109, USA
Mark M. Banaszak Holl, Chemical Engineering, Monash University, Clayton, Victoria 3800, Australia.
REFERENCES
- (1).Weiner S; Wagner HD The Material Bone: Structure-Mechanical Functions Relations. Annu. Rev. Mater. Sci 1998, 28, 271–278. [Google Scholar]
- (2).Fratzl P; Gupta HS; Paschalis EP; Roschger P Structure and Mechanical Quality of the Collagen–Mineral Nano-Composite in Bone. J. Mater. Chem 2004, 14, 2115–2123. [Google Scholar]
- (3).Rho JY; Kuhn-Spearing L; Zioupos P Mechanical Properties and the Hierarchical Structure of Bone. Med. Eng. Phys 1998, 20, 92–102. [DOI] [PubMed] [Google Scholar]
- (4).Schwarcz HP; Abueidda D; Jasiuk I The Ultrastructure of Bone and Its Relevance to Mechanical Properties. Front. Phys 2017, DOI: 10.3389/fphy.2017.00039. [DOI] [Google Scholar]
- (5).Olszta MJ; Cheng X; Jee SS; Kumar R; Kim YY; Kaufman MJ; Douglas EP; Gower LB Bone Structure and Formation: A New Perspective. Mater. Sci. Eng., R 2007, 58, 77–116. [Google Scholar]
- (6).Eastoe JE; Eastoe B The Organic Constituents of Mammalian Compact Bone. Biochem. J 1954, 57, 453–459. [DOI] [PMC free article] [PubMed] [Google Scholar]
- (7).Currey JD Role of Collagen and Other Organics in the Mechanical Properties of Bone. Osteoporosis Int. 2003, 14, 29–36. [DOI] [PubMed] [Google Scholar]
- (8).Fisher LW; Termine JD Noncollagenous Proteins Influencing the Local Mechanism of Calcification. Mineralised Tissue Research 1985, 200, 362–385. [PubMed] [Google Scholar]
- (9).Currey JD; Zioupos P; Peter D; Casinos A Mechanical Properties of Nacre and Highly Mineralized Bone. Proc. R. Soc. London, Ser. B 2001, 268, 107–111. [DOI] [PMC free article] [PubMed] [Google Scholar]
- (10).Dorozhkin SV; Epple M Biological and Medical Significance of Calcium Phosphates. Angew. Chem., Int. Ed 2002, 41, 3130–3146. [DOI] [PubMed] [Google Scholar]
- (11).Currey JD Biomechanics of Mineralized Skeletons. Skelet. Biominer. Patterns, Process. Evol. Trends 1999, 5, 11–25. [Google Scholar]
- (12).Fratzl P Bone Fracture: When the Cracks Begin to Show. Nat. Mater 2008, 7, 610–612. [DOI] [PubMed] [Google Scholar]
- (13).Tai K; Dao M; Suresh S; Palazoglu A; Ortiz C Nanoscale Heterogeneity Promotes Energy Dissipation in Bone. Nat. Mater 2007, 6, 454–462. [DOI] [PubMed] [Google Scholar]
- (14).Chen J; Ahn T; Colón-Bernal ID; Kim J; Banaszak Holl MM The Relationship of Collagen Structural and Compositional Heterogeneity to Tissue Mechanical Properties: A Chemical Perspective. ACS Nano 2017, 11, 10665–10671. [DOI] [PubMed] [Google Scholar]
- (15).Jowsey J Studies of Haversian Systems in Man and Some Animals. J. Anat 1966, 100, 857–864. [PMC free article] [PubMed] [Google Scholar]
- (16).Gauthier R; Langer M; Follet H; Olivier C; Gouttenoire PJ; Helfen L; Rongiéras F; Mitton D; Peyrin F 3D Micro Structural Analysis of Human Cortical Bone in Paired Femoral Diaphysis, Femoral Neck and Radial Diaphysis. J. Struct. Biol 2018, 204, 182–190. [DOI] [PubMed] [Google Scholar]
- (17).Bala Y; Lefèvre E; Roux JP; Baron C; Lasaygues P; Pithioux M; Kaftandjian V; Follet H Pore Network Micro-architecture Influences Human Cortical Bone Elasticity during Growth and Aging. J. Mech. Behav. Biomed. Mater 2016, 63, 164–173. [DOI] [PubMed] [Google Scholar]
- (18).Peyrin F; Dong P; Pacureanu A; Langer M Micro- and Nano-CT for the Study of Bone Ultrastructure. Curr. Osteoporos. Rep 2014, 12, 465–474. [DOI] [PubMed] [Google Scholar]
- (19).Hesse B; Varga P; Langer M; Pacureanu A; Schrof S; Männicke N; Suhonen H; Maurer P; Cloetens P; Peyrin F; Raum K Canalicular Network Morphology Is the Major Determinant of the Spatial Distribution of Mass Density in Human Bone Tissue: Evidence by Means of Synchrotron Radiation Phase-Contrast Nano-CT. J. Bone Miner. Res 2015, 30, 346–356. [DOI] [PubMed] [Google Scholar]
- (20).Varga P; Pacureanu A; Langer M; Suhonen H; Hesse B; Grimal Q; Cloetens P; Raum K; Peyrin F Investigation of the Three-Dimensional Orientation of Mineralized Collagen Fibrils in Human Lamellar Bone Using Synchrotron X-Ray Phase Nano-Tomography. Acta Biomater. 2013, 9, 8118–8127. [DOI] [PubMed] [Google Scholar]
- (21).Yu B; Pacureanu A; Olivier C; Cloetens P; Peyrin F Assessment of the Human Bone Lacuno-Canalicular Network at the Nanoscale and Impact of Spatial Resolution. Sci. Rep 2020, 10, 4567. [DOI] [PMC free article] [PubMed] [Google Scholar]
- (22).Wittig NK; Laugesen M; Birkbak ME; Bach-Gansmo FL; Pacureanu A; Bruns S; Wendelboe MH; Brüel A; Sørensen HO; Thomsen JS; Birkedal H Canalicular Junctions in the Osteocyte Lacuno-Canalicular Network of Cortical Bone. ACS Nano 2019, 13, 6421–6430. [DOI] [PubMed] [Google Scholar]
- (23).Provenzano PP; Vanderby R Collagen Fibril Morphology and Organization: Implications for Force Transmission in Ligament and Tendon. Matrix Biol. 2006, 25, 71–84. [DOI] [PubMed] [Google Scholar]
- (24).Chapman JA; Tzaphlidou M; Meek KM; Kadler KE The Collagen Fibril-A Model System for Studying the Staining and Fixation of a Protein. Electron Microsc. Rev 1990, 3, 143–182. [DOI] [PubMed] [Google Scholar]
- (25).Fratzl-Zelman N; Schmidt I; Roschger P; Glorieux FH; Klaushofer K; Fratzl P; Rauch F; Wagermaier W Mineral Particle Size in Children with Osteogenesis Imperfecta Type I Is Not Increased Independently of Specific Collagen Mutations. Bone 2014, 60, 122–128. [DOI] [PubMed] [Google Scholar]
- (26).Fang M; Goldstein EL; Turner AS; Les CM; Orr BG; Fisher GJ; Welch KB; Rothman ED; Banaszak Holl MM Type I Collagen D-Spacing in Fibril Bundles of Dermis, Tendon, and Bone: Bridging between Nano- and Micro-Level Tissue Hierarchy. ACS Nano 2012, 6, 9503–9514. [DOI] [PMC free article] [PubMed] [Google Scholar]
- (27).Petruska JA; Hodge AJ A Subunit Model for the Tropocollagen Macromolecule. Proc. Natl. Acad. Sci. U. S. A 1964, 51, 871–876. [DOI] [PMC free article] [PubMed] [Google Scholar]
- (28).Orgel JPRO; Irving TC; Miller A; Wess TJ Microfibrillar Structure of Type I Collagen in Situ. Proc. Natl. Acad. Sci. U. S. A 2006, 103, 9001–9005. [DOI] [PMC free article] [PubMed] [Google Scholar]
- (29).Landis WJ Mineral Characterization in Calcifying Tissues: Atomic, Molecular and Macromolecular Perspectives. Connect. Tissue Res 1996, 34, 239–246. [DOI] [PubMed] [Google Scholar]
- (30).Landis WJ; Hodgens KJ; Arena J; Song MJ; McEwen BF Structural Relations between Collagen and Mineral in Bone as Determined by High Voltage Electron Microscopic Tomography. Microsc. Res. Tech 1996, 33, 192–202. [DOI] [PubMed] [Google Scholar]
- (31).Eppell SJ; Tong W; Katz JL; Kuhn L; Glimcher MJ Shape and Size of Isolated Bone Mineralites Measured Using Atomic Force Microscopy. J. Orthop. Res 2001, 19, 1027–1034. [DOI] [PubMed] [Google Scholar]
- (32).Weiner S; Price PA Disaggregation of Bone into Crystals. Calcif. Tissue Int 1986, 39, 365–375. [DOI] [PubMed] [Google Scholar]
- (33).Traub W; Arad T; Weiner S Growth of Mineral Crystals in Turkey Tendon Collagen Fibers. Connect. Tissue Res 1992, 28, 99–111. [DOI] [PubMed] [Google Scholar]
- (34).Robinson RA; Watson ML Collagen-Crystal Relationships in Bone as Seen in the Electron Microscope. Anat. Rec 1952, 114, 383–409. [DOI] [PubMed] [Google Scholar]
- (35).Jackson SA; Cartwright AG; Lewis D The Morphology of Bone Mineral Crystals. Calcif. Tissue Res 1978, 25, 217–222. [DOI] [PubMed] [Google Scholar]
- (36).Grandfield K; Vuong V; Schwarcz HP Ultrastructure of Bone: Hierarchical Features from Nanometer to Micrometer Scale Revealed in Focused Ion Beam Sections in the TEM. Calcif. Tissue Int 2018, 103, 606–616. [DOI] [PubMed] [Google Scholar]
- (37).Reznikov N; Bilton M; Lari L; Stevens MM; Kröger R Fractal-Like Hierarchical Organization of Bone Begins at the Nanoscale. Science 2018, 360, No. eaao2189. [DOI] [PMC free article] [PubMed] [Google Scholar]
- (38).Burr DB; Akkus O Bone Morphology and Organization. In Basic and Applied Bone Biology, 1st ed.; Academic Press:London, UK, 2014; pp 3–25. [Google Scholar]
- (39).Gidley DW; Peng H-G; Vallery RS Positron Annihilation as a Method to Characterize Porous Materials. Annu. Rev. Mater. Res 2006, 36, 49–79. [Google Scholar]
- (40).Pethrick RA Positron Annihilation - A Probe for Nanoscale Voids and Free Volume? Prog. Polym. Sci 1997, 22, 1–47. [Google Scholar]
- (41).Siles S; Moya G; Li XH; Kansy J; Moser P Positron Annihilation Lifetime Measurements in Collagen Biopolymer. J. Radioanal. Nucl. Chem 1999, 240, 529–530. [Google Scholar]
- (42).Akiyama Y; Shibahara Y; Takeda S-I; Izumi Y; Honda Y; Tagawa S; Nishijima S Analysis of Swelling Process of Protein by Positron Annihilation Lifetime Spectroscopy and Differential Scanning Calorimetry. J. Polym. Sci., Part B: Polym. Phys 2007, 45, 2031–2037. [Google Scholar]
- (43).Jean YC; Van Horn JD; Hung WS; Lee KR Perspective of Positron Annihilation Spectroscopy in Polymers. Macromolecules 2013, 46, 7133–7145. [Google Scholar]
- (44).Posner AS; Beebe RA The Surface Chemistry of Bone Mineral and Related Calcium Phosphates. Semin. Arthritis Rheum 1975, 4, 267–291. [DOI] [PubMed] [Google Scholar]
- (45).Fels IG Hydration and Density of Collagen and Gelatin. J. Appl. Polym. Sci 1964, 8, 1813–1824. [Google Scholar]
- (46).Rootare HM; Craig RG Characterization of the Compaction and Sintering of Hydroxyapatite Powders by Mercury Porosimetry. Powder Technol. 1974, 9, 199–211. [Google Scholar]
- (47).Holmes JM; Davies DH; Meath WJ; Beebe RA Gas Adsorption and Surface Structure of Bone Mineral. Biochemistry 1964, 3, 2019–2024. [DOI] [PubMed] [Google Scholar]
- (48).Taylor AJ; Rendina E; Smith BJ; Zhou DH Analyses of Mineral Specific Surface Area and Hydroxyl Substitution for Intact Bone. Chem. Phys. Lett 2013, 588, 124–130. [DOI] [PMC free article] [PubMed] [Google Scholar]
- (49).Lastoskie C; Gubbins KE; Quirke N Pore Size Distribution Analysis of Microporous Carbons: A Density Functional Theory Approach. J. Phys. Chem 1993, 97, 4786–4796. [Google Scholar]
- (50).Driscoll CO; Dowker SEP; Anderson P; Wilson RM; Gulabivala K Effects of Sodium Hypochlorite Solution on Root Dentine Composition. J. Mater. Sci.: Mater. Med 2002, 13, 219–223. [DOI] [PubMed] [Google Scholar]
- (51).Su FY; Pang S; Ling YTT; Shyu P; Novitskaya E; Seo K; Lambert S; Zarate K; Graeve OA; Jasiuk I; McKittrick J Deproteinization of Cortical Bone: Effects of Different Treatments. Calcif. Tissue Int 2018, 103, 554–566. [DOI] [PubMed] [Google Scholar]
- (52).Nyman JS; Uppuganti S; Unal M; Leverant CJ; Adabala S; Granke M; Voziyan P; Does MD Manipulating the Amount and Structure of the Organic Matrix Affects the Water Compartments of Human Cortical Bone. JBMR Plus 2019, 3, e10135. [DOI] [PMC free article] [PubMed] [Google Scholar]
- (53).Pang S; Su FY; McKittrick J; Jasiuk I Deproteinized Young Bone Reveals a Continuous Mineral Phase and Its Contribution to Mechanical Properties with Age. J. Mater. Res. Technol 2020, 9, 15421–15432. [Google Scholar]
- (54).Provencher SW A Constrained Regularization Method for Inverting Data Represented by Linear Algebraic or Integral Equations. Comput. Phys. Commun 1982, 27, 213–227. [Google Scholar]
- (55).Dull TL; Frieze WE; Gidley DW; Sun JN; Yee AF Determination of Pore Size in Mesoporous Thin Films from the Annihilation Lifetime of Positronium. J. Phys. Chem. B 2001, 105, 4657–4662. [Google Scholar]
- (56).Gautieri A; Vesentini S; Redaelli A; Buehler MJ Hierarchical Structure and Nanomechanics of Collagen Microfibrils from the Atomistic Scale Up. Nano Lett. 2011, 11, 757–766. [DOI] [PubMed] [Google Scholar]
- (57).Weiner S; Traub W; Wagner HD Lamellar Bone: Structure–Function Relations. J. Struct. Biol 1999, 126, 241–255. [DOI] [PubMed] [Google Scholar]
- (58).Giraud-Guille MM Twisted Plywood Architecture of Collagen Fibrils in Human Compact Bone Osteons. Calcif. Tissue Int 1988, 42, 167–180. [DOI] [PubMed] [Google Scholar]
- (59).Rubin MA; Jasiuk I; Taylor J; Rubin J; Ganey T; Apkarian RP TEM Analysis of the Nanostructure of Normal and Osteoporotic Human Trabecular Bone. Bone 2003, 33, 270–282. [DOI] [PubMed] [Google Scholar]
- (60).Mitchell HH; Hamilton TS; Steggerda FR; Bean HW The Chemical Composition of the Adult Human Body and its Bearing on the Biochemistry of Growth. J. Biol. Chem 1945, 158, 625–637. [Google Scholar]
- (61).Fratzl-zelman N; Schmidt I; Roschger P; Roschger A; Glorieux FH; Klaushofer K; Wagermaier W; Rauch F; Fratzl P Unique Micro- and Nano-Scale Mineralization Pattern of Human Osteogenesis Imperfecta Type VI Bone. Bone 2015, 73, 233–241. [DOI] [PubMed] [Google Scholar]
- (62).Roschger A; Wagermaier W; Gamsjaeger S; Berzlanovich A; Gruber GM; Weinkamer R; Roschger P; Paschalis EP; Klaushofer K; Fratzl P; et al. Newly Formed and Remodeled Human Bone Exhibits Differences in the Mineralization Process. Acta Biomater. 2020, 104, 221–230. [DOI] [PubMed] [Google Scholar]
- (63).Smith L; Bigelow EMR; Jepsen KJ Systematic Evaluation of Skeletal Mechanical Function. Curr. Protoc. Mouse Biol 2013, 3, 39–67. [DOI] [PMC free article] [PubMed] [Google Scholar]
- (64).Quan BD; Sone ED Cryo-TEM Analysis of Collagen Fibrillar Structure. In Methods in Enzymology, 1st ed.; Academic Press: London, UK: 2013; Vol. 532, pp 189–205. [DOI] [PubMed] [Google Scholar]
- (65).Chen PY; Toroian D; Price PA; McKittrick J Minerals Form a Continuum Phase in Mature Cancellous Bone. Calcif. Tissue Int 2011, 88, 351–361. [DOI] [PMC free article] [PubMed] [Google Scholar]
- (66).Kirkegaard P; Eldrup M Positronfit Extended: A New Version of a Program for Analyzing Positron Lifetime Spectra. Comput. Phys. Commun 1974, 7, 401–409. [Google Scholar]
- (67).Gregory RB; Zhu Y Analysis of Positron Annihilation Lifetime Data by Numerical Laplace Inversion with the Program CONTIN. Nucl. Instrum. Methods Phys. Res., Sect. A 1990, 290, 172–182. [Google Scholar]
- (68).Gidley DW; Frieze WE; Dull TL; Sun J; Yee AF; Nguyen CV; Yoon DY Determination of Pore-Size Distribution in Low-Dielectric Thin Films. Appl. Phys. Lett 2000, 76, 1282–1284. [Google Scholar]
- (69).Willems TF; Rycroft CH; Kazi M; Meza JC; Haranczyk M Algorithms and Tools for High-Throughput Geometry-Based Analysis of Crystalline Porous Materials. Microporous Mesoporous Mater. 2012, 149, 134–141. [Google Scholar]
Associated Data
This section collects any data citations, data availability statements, or supplementary materials included in this article.