

Abstract
Cerebral stroke is one of the most frequent causes of permanent disability or death in the western world and a major burden in healthcare system. The major portion is caused by acute ischemia due to cerebral artery occlusion by a clot. The minority of strokes is related to intracerebral hemorrhage or other sources. To limit the permanent disability in ischemic stroke patients resulting from irreversible infarction of ischemic brain tissue, major efforts were made in the last decade. To extend the time window for thrombolysis, which is the only approved therapy, several imaging parameters in computed tomography and magnetic resonance imaging (MRI) have been investigated. However, the current guidelines neglect the fact that the portion of potentially salvageable ischemic tissue (penumbra) is not dependent on the time window but the individual collateral blood flow. Within the last years, the differentiation of infarct core and penumbra with MRI using diffusion-weighted images (DWI) and perfusion imaging (PI) with parameter maps was established. Current trials transform these technical advances to a redefined patient selection based on physiological parameters determined by MRI. This review article presents the current status of MRI for acute stroke imaging. A special focus is the ischemic stroke. In dependence on the pathophysiology of cerebral ischemia, the basic principle and diagnostic value of different MRI sequences are illustrated. MRI techniques for imaging of the main differential diagnoses of ischemic stroke are mentioned. Moreover, perspectives of MRI for imaging-based acute stroke treatment as well as monitoring of restorative stroke therapy from recent trials are discussed.
Keywords: Magnetic resonance imaging, Stroke, Cerebral, Ischemia, Diffusion, Perfusion
Introduction
Cerebral stroke is one of the most frequent causes of permanent disability or death in the western world [1]. Direct and indirect costs related to stroke result in a marked economic burden and are estimated to increase even more within the next decades [2]. The most common symptom of a stroke is sudden weakness or numbness of the face, arm, or leg, most often on one side of the body. Other symptoms include difficulty of speaking or understanding speech, visual disorders, dizziness, impaired consciousness, and severe headache. Typically, a stroke is caused by reduction of the blood supply to the brain, usually caused by a clot occluding a blood vessel. This so-called ischemic stroke accounts for about 80% of strokes, and its origin is divided into cardiogenic, arterosclerotic, lacunar, hemodynamic, or cryptogenic source [3]. Another 15% of strokes are related to disruption of a cerebral artery resulting in intracerebral hemorrhage (ICH). For this hemorrhagic stroke, arterial hypertension is the main source. Other rare causes of stroke-like symptoms include cerebral venous sinus thrombosis, chronic subdural hematoma, subarachnoid hemorrhage, inflammatory disease, migraine, seizure, and hypoglycemia.
In ischemic stroke, the interruption of the cerebral perfusion cuts off the supply of oxygen and nutrients, causing damage to the brain tissue. Ischemic strokes have a characteristic appearance on magnetic resonance imaging (MRI) that varies with infarct age and type of stroke [4]. Temporal evolution of ischemic stroke is typically categorized into hyperacute (0–6 h), acute (6–24 h), subacute (24 h to approximately 2 weeks), and chronic stroke (>2 weeks old) [5].
This review article presents the current status of MRI for acute stroke imaging. A special focus is the ischemic stroke. In dependence on the pathophysiology of cerebral ischemia, the basic principle and diagnostic value of different MRI sequences are illustrated. MRI techniques for imaging of the main differential diagnoses in stroke are mentioned. Moreover, perspectives of MRI for imaging-based acute stroke treatment as well as stroke rehabilitation from recent trials are discussed.
Penumbra concept
In the presence of acute occlusion of a cerebral artery, focal cerebral ischemia occurs. Brain parenchyma can compensate a hypoperfusion with a cerebral blood flow threshold of approximately 20 mL/100 g tissue/min by increased oxygen extraction; the cellular membrane remains intact at this phase. If the cerebral blood flow falls below this threshold, the neuronal cell remains viable down to a minimum cerebral blood flow of approximately 12 mL/100 g tissue/min; however, at this phase, the neuronal function is impaired. After normalization of the cerebral blood flow, however, this neuronal cell will recover without defect. If the cerebral blood flow falls below 12 mL/100 g tissue/min, shortage of metabolites occurs, causing a Na+/K+ channel failure in every ischemic cell. This membrane channel failure causes subsequent uncontrolled net shift of extracellular water in the intracellular space. The consequence is a cytotoxic edema and irreversible damage to the neuronal cells [6]. Depending on the extent of cerebral blood flow reduction and cell integrity status, a central area of irreversibly damaged brain parenchyma, the infarct core, and a surrounding area of acute ischemic but potentially salvageable tissue, the penumbra, can be differentiated. The extent of these two portions of ischemic tissue is highly dependent on preexisting cerebral arterial collaterals [7].
Stroke magnetic resonance imaging protocol
Demands on stroke magnetic resonance imaging
The demands of imaging in suspected acute stroke rely on the therapeutic options and possible differential diagnoses in a given time window. The advent of new MRI techniques such as diffusion-weighted imaging (DWI) and perfusion MRI (PI) in the early 1990s added a new dimension to diagnostic imaging in stroke. In the late 1990s, improved gradient hardware that was needed for echo planar imaging was implemented in clinical MRI scanners. In consequence, MRI became the ideal technique for imaging patients with suspected acute stroke as it reliably detects both infarction [8, 9] and other differential diagnoses like ICH or subdural hematoma with high sensitivity and specificity [10, 11]. Moreover, a differentiation of already infarcted brain tissue and the potentially salvageable portion in acute cerebral ischemia is possible. MRI of suspected acute stroke targets toward assessment of four main aspects: parenchyma, pipes, perfusion, and penumbra [12] (Table 1).
Table 1.
Goals of acute stroke imaging.
| Parenchyma | Assess early signs of acute stroke and extent of irreversibly damaged tissue, rule out hemorrhage |
| Pipe | Assess extracranial circulation (carotid and vertebral arteries of the neck) and intracranial circulation for evidence of intravascular thrombus or other pathology |
| Perfusion | Assess cerebral blood volume, cerebral blood flow, and mean transit time |
| Penumbra | Assess tissue at risk of dying if ischemia continues without recanalization of occluded artery |
Adapted from [12]
A combination of conventional MRI, magnetic resonance angiography (MRA), and diffusion-weighted and perfusion imaging techniques is used in the thorough evaluation of acute stroke [13] (Table 2). Such an MRI protocol can be performed in less than 12 min to achieve reliable information about the site of vessel occlusion, the extent of potentially salvageable brain tissue, and to exclude differential diagnoses of ischemic stroke.
Table 2.
Stroke magnetic resonance imaging protocol.
| Sequences | Goals |
|---|---|
| Transverse DWI sequence | Assess for cerebral infarction |
| Transverse T2-weighted/FLAIR sequence | Assess for extent of infarcted tissue, small vessel disease, and prior territorial infarction |
| Rule out subarachnoid hemorrhage | |
| Transverse T2*-weighted sequence | Assess for cerebral microbleeds |
| Rule out intracerebral hemorrhage | |
| Intracranial 3D-TOF-MRA | Assess for intracranial vessel occlusion |
| Transverse perfusion MRI | Assess for cerebral ischemia and extent of penumbra (PI/DWI mismatch) |
| Optional sequences | |
| Transverse SWI sequence | Improved assessment of cerebral hemorrhage and hemorrhagic transformation within infarction |
| Transverse fat-saturated T1-weighted sequence of the cervical soft tissue | Assess for vessel wall hematoma in suspected dissection of the extracranial arteries |
| Extracranial contrast-enhanced MRA | Assess extracranial arteries for stenosis or occlusion |
| Transverse T1-weighted sequence after contrast agent | Rule out inflammatory disease and cerebral tumor |
DWI diffusion-weighted imaging, FLAIR fluid-attenuated inversion recovery, 3D three-dimensional, TOF time-of-flight, MRA magnetic resonance angiography, MRI magnetic resonance imaging, PI perfusion imaging, SWI susceptibility-weighted imaging
T2-weighted and fluid-attenuated inversion recovery (FLAIR) imaging
On T2-weighted and fluid-attenuated inversion recovery (FLAIR) images, ischemic infarction appears as a hyperintense lesion seen at the earliest 3 to 6 h after stroke onset. It is known that conventional MRI sequences like T2-weighted and FLAIR images do not have higher sensitivity for depiction of early infarction compared with computed tomography (CT). T2-weighted and FLAIR images are also used to assess for older cerebral infarction and the extent of small vessel disease. Moreover, FLAIR images are highly sensitive to subarachnoid hemorrhage [14] as well as acute cerebral venous sinus thrombosis. In the presence of blood products in the subarachnoid space, saturation of the blood-containing cerebrospinal fluid cannot be achieved with inversion pulse. In consequence, the subarachnoid space appears bright on FLAIR. However, this finding is not pathognomonic for subarachnoid hemorrhage, and other differential diagnoses have to be considered as well. Likewise, fresh thrombus in a cortical vein or a cerebral sinus as found in cerebral venous sinus thrombosis results in increased signal on FLAIR images and obviated flow void signal. In combination of FLAIR images, DWI, and T2*-weighted images, cerebral venous sinus thrombosis can be detected with high sensitivity and specificity [15, 16].
Two-dimensional gradient recalled echo (T2*)-weighted imaging
Hyperacute stroke imaging demands the differentiation between ischemic stroke and intracranial hemorrhage, which is impossible by clinical means only. CT is the standard method for the diagnosis of intracranial hemorrhage. The need to perform both CT for exclusion of intracranial hemorrhage and stroke MRI to guide therapeutic efforts is time-consuming and medico-economically questionable. The appearance of intracranial hemorrhage at MRI depends primarily on the age of the hematoma, the localization (subdural, epidural, subarachnoid, and intracerebral), and the type of magnetic resonance contrast [17]. The key substrate for early MRI visualization of hemorrhage is deoxyhemoglobin, a blood degradation product with paramagnetic properties due to unpaired electrons. The typical appearance of ICH on MR images is a heterogeneous focal lesion. With increasing susceptibility weight, the central area of hypointensity becomes more pronounced (Fig. 1). On T2*-weighted images, few if any areas of hyperintensity are visible in the lesion core, which is surrounded by a hypointense rim. There is a surrounding hyperintensity on T2-weighted and T2*-weighted images (hypointense on T1-weighted images) that represents perifocal vasogenic edema. One randomized, blinded prospective multicenter study investigated the role of stroke MRI in ICH. Fiebach et al. reported that hyperacute intracranial hemorrhage is detectable with excellent accuracy even if the raters have only limited experience [10]. In a multicenter study conducted by Kidwell et al. [11], in particular, small hemosiderin deposits (microbleeds) were detected by T2*-weighted images only. CT does not provide any information about these chronic lesions, which are associated with an increased risk of spontaneous ICH.
Fig. 1.
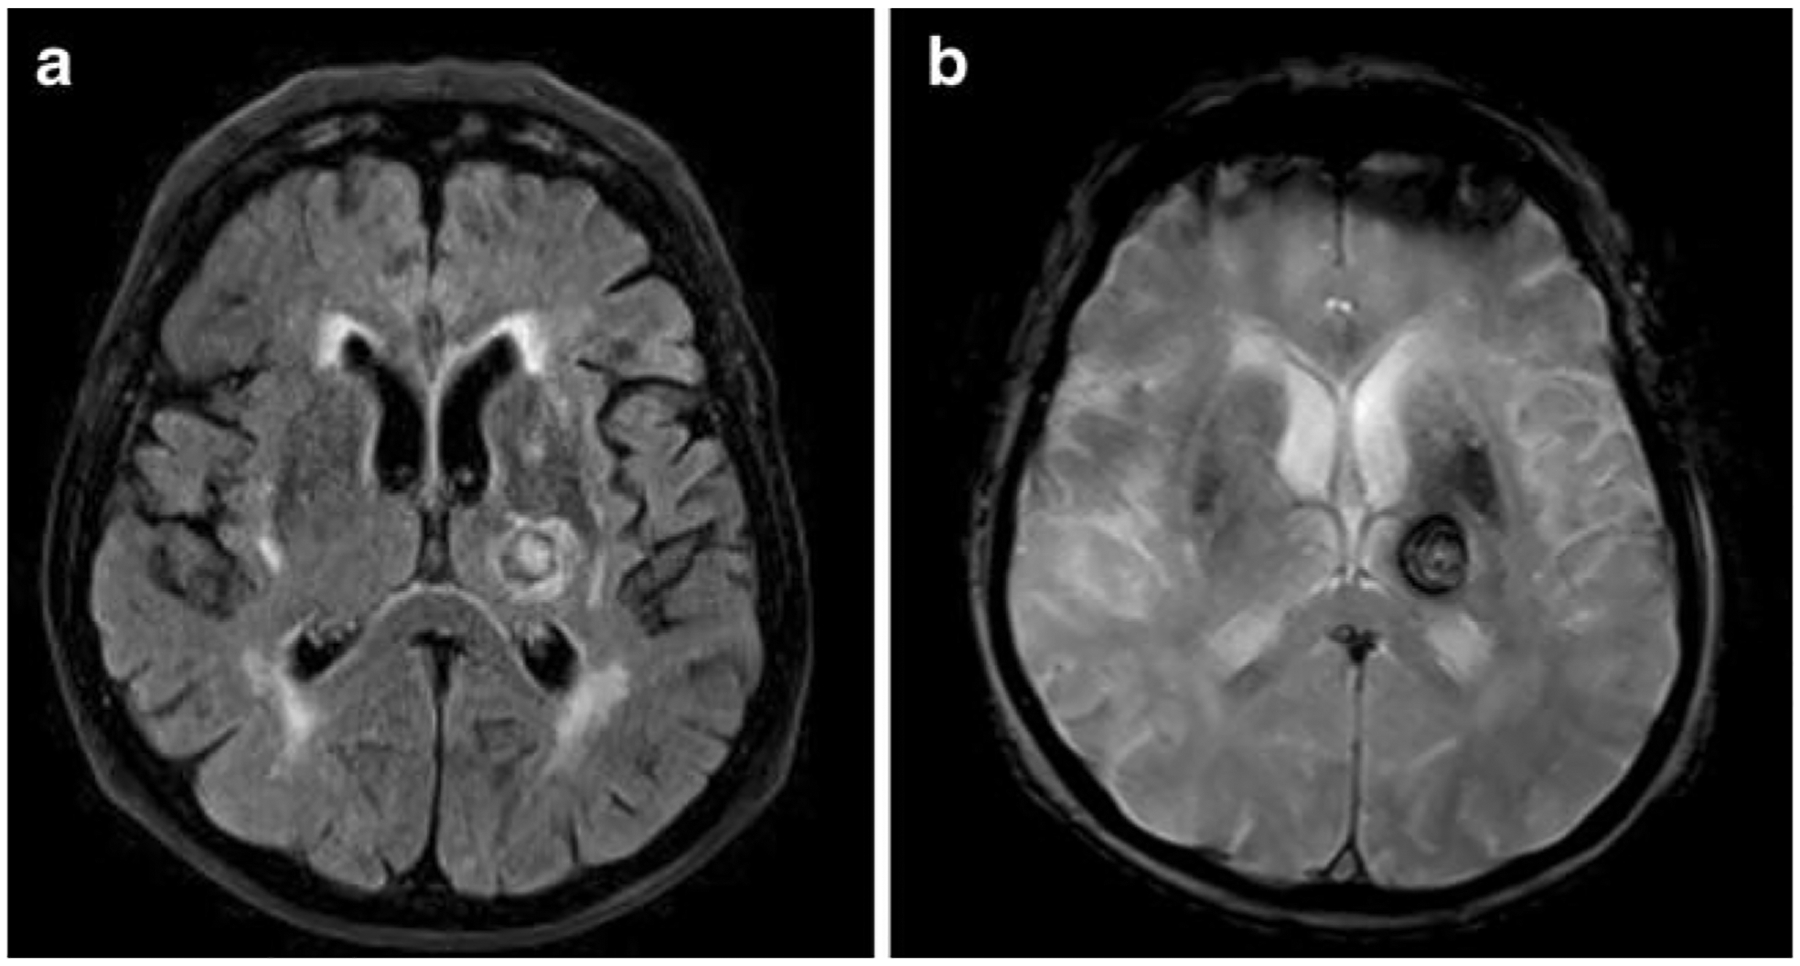
Fluid-attenuated inversion recovery (FLAIR; a) image and gradient recalled echo (T2*; b)-weighted image of an intracerebral hemorrhage in the left thalamus. The typical hypointense appearance of the hemorrhage on the T2*-weighted image is caused by the susceptibility effect of the paramagnetic deoxyhemoglobin
Diffusion-weighted imaging (DWI) and apparent diffusion coefficient (ADC)
The normal motion of water molecules within living tissues is random (Brownian motion). In acute ischemic stroke, a shortage of metabolites occurs, causing a Na+/K+ channel failure in every ischemic cell. This membrane channel failure causes alteration of the homeostasis of intracellular and extracellular water, which is normally maintained steady state. In consequence, excessive intracellular water accumulation leads to a narrowing of the extracellular matrix and thus to a reduction of Brownian molecular motion in the extracellular space (cytotoxic edema). This phenomenon can be measured with DWI [13]. It was first described in 1965 [18], and it can be measured quantitatively with the apparent diffusion coefficient (ADC).
DWI demonstrates ischemic tissue changes within minutes after vessel occlusion with a reduction of the ADC [19] (Fig. 2). A net shift of extracellular water in the intracellular compartment (cytotoxic edema) with a consecutive reduction of free water diffusion is the main underlying mechanism for the ADC decrease. DWI leads to a significantly improved detection of early infarction compared to CT and is the most sensitive method to date for the depiction of infarction at the very early phase [20, 21]. However, it should not be disregarded that DWI lesions can be at least partially reversible in the early phase of ischemia and do not reflect necessarily irreversibly damaged tissue only.
Fig. 2.
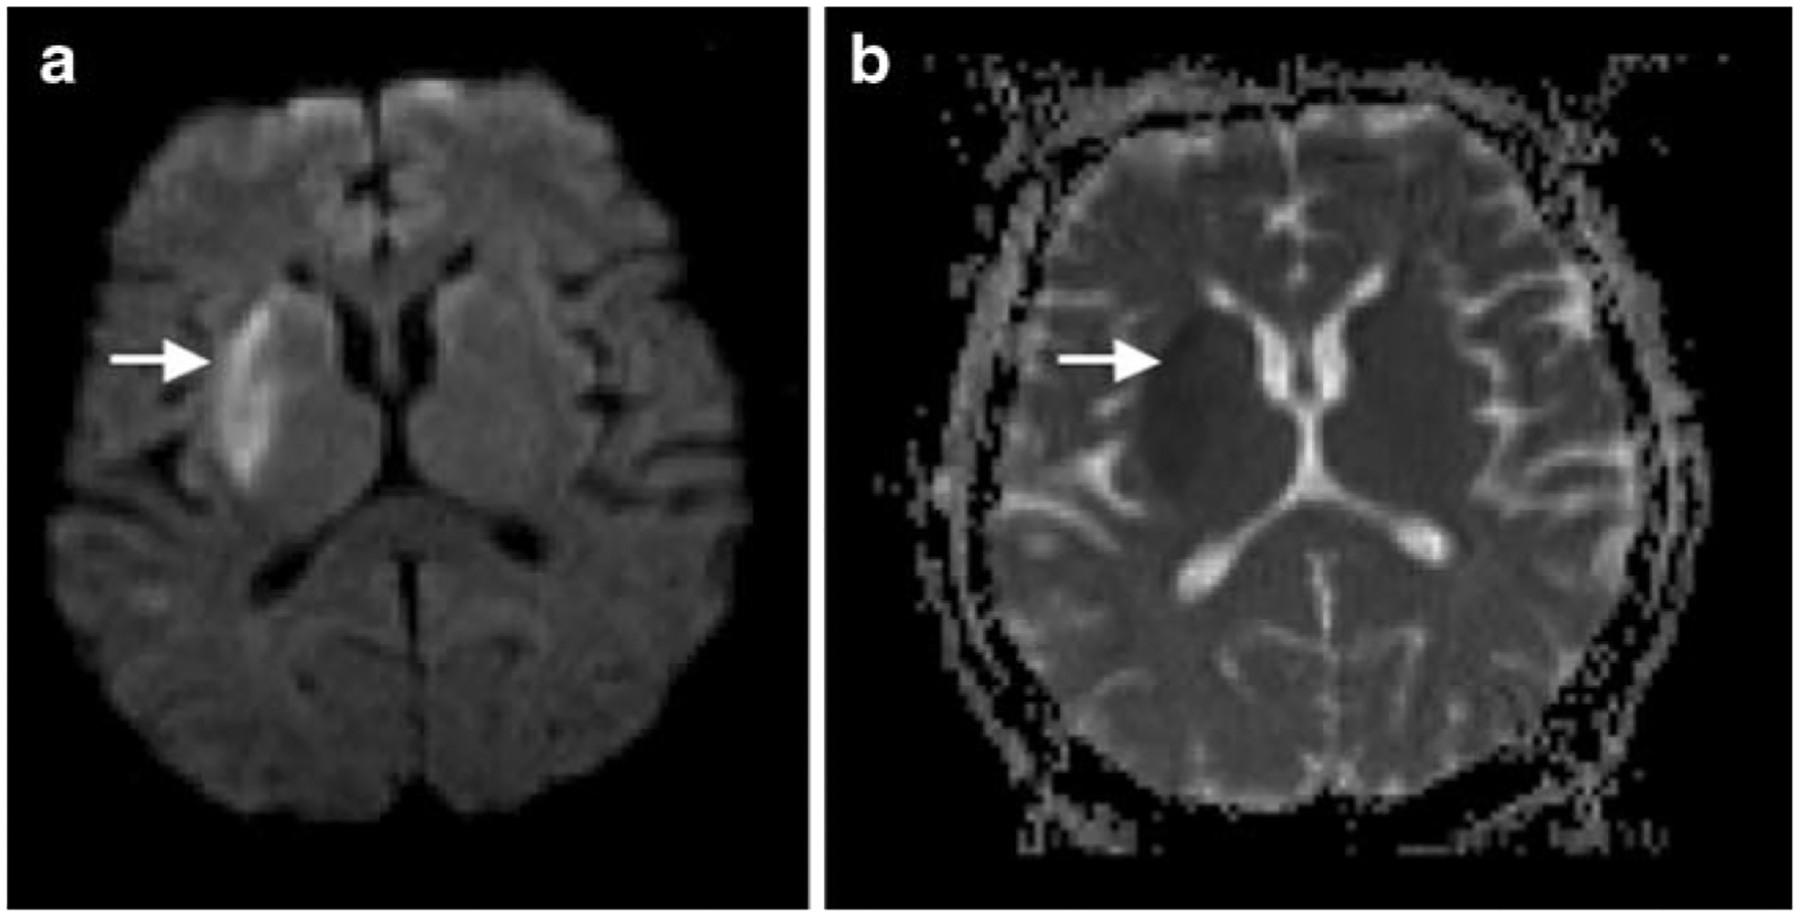
Diffusion-weighted image (DWI; a) in a patient with right basal ganglia infarction. The reduction of Brownian molecular motion in the extracellular space of the infarcted tissue due to cytotoxic edema is displayed as hyperintense signal (arrow). The apparent diffusion coefficient (ADC; b) image shows a hypointense signal (arrow) of the infarcted tissue due to a consecutive reduction of free water diffusion
Fiehler et al. analyzed the frequency of ADC normalization in 68 acute stroke patients [22]. Of their cohort, 19.7% had ADC normalization in more than 5 ml brain tissue. In those patients imaged within 3 h after symptom onset, ADC normalization was seen in 35.5%, while in patients imaged between 3 and 6 h, it was 7.5%. ADC normalization was predominantly seen in the basal ganglia and white matter in patients with distally located vessel occlusions, and it was associated with a trend toward a better clinical outcome. Thus, patients presenting with a PI/DWI match within 3 h after symptom onset may have salvageable tissue at risk and might have benefit from fibrinolysis. However, it is still not known whether the absent of hyperintensities on follow-up T2-weighted images indicates neuronal integrity in humans. DeLaPaz et al. and Li et al. observed neuronal damage in histological examinations of tissue showing ADC normalization after reperfusion in a rat stroke model [23–25].
Perfusion magnetic resonance imaging (PI)
PI allows the measurement of capillary perfusion of the brain. The bolus passage of an intravascular MRI contrast agent through the cerebral capillaries causes a nonlinear signal loss because of the susceptibility effect (T2* effect) of the contrast agent [26]. The dynamic contrast-enhanced (CE) PI technique tracks the tissue signal changes caused by the T2* effect to create a hemodynamic time to signal intensity curve [27]. Parameter maps of the cerebral blood flow, the cerebral blood volume, and the mean transit time can be generated by using software based on deconvolution technique [28] (Fig. 3).
Fig. 3.
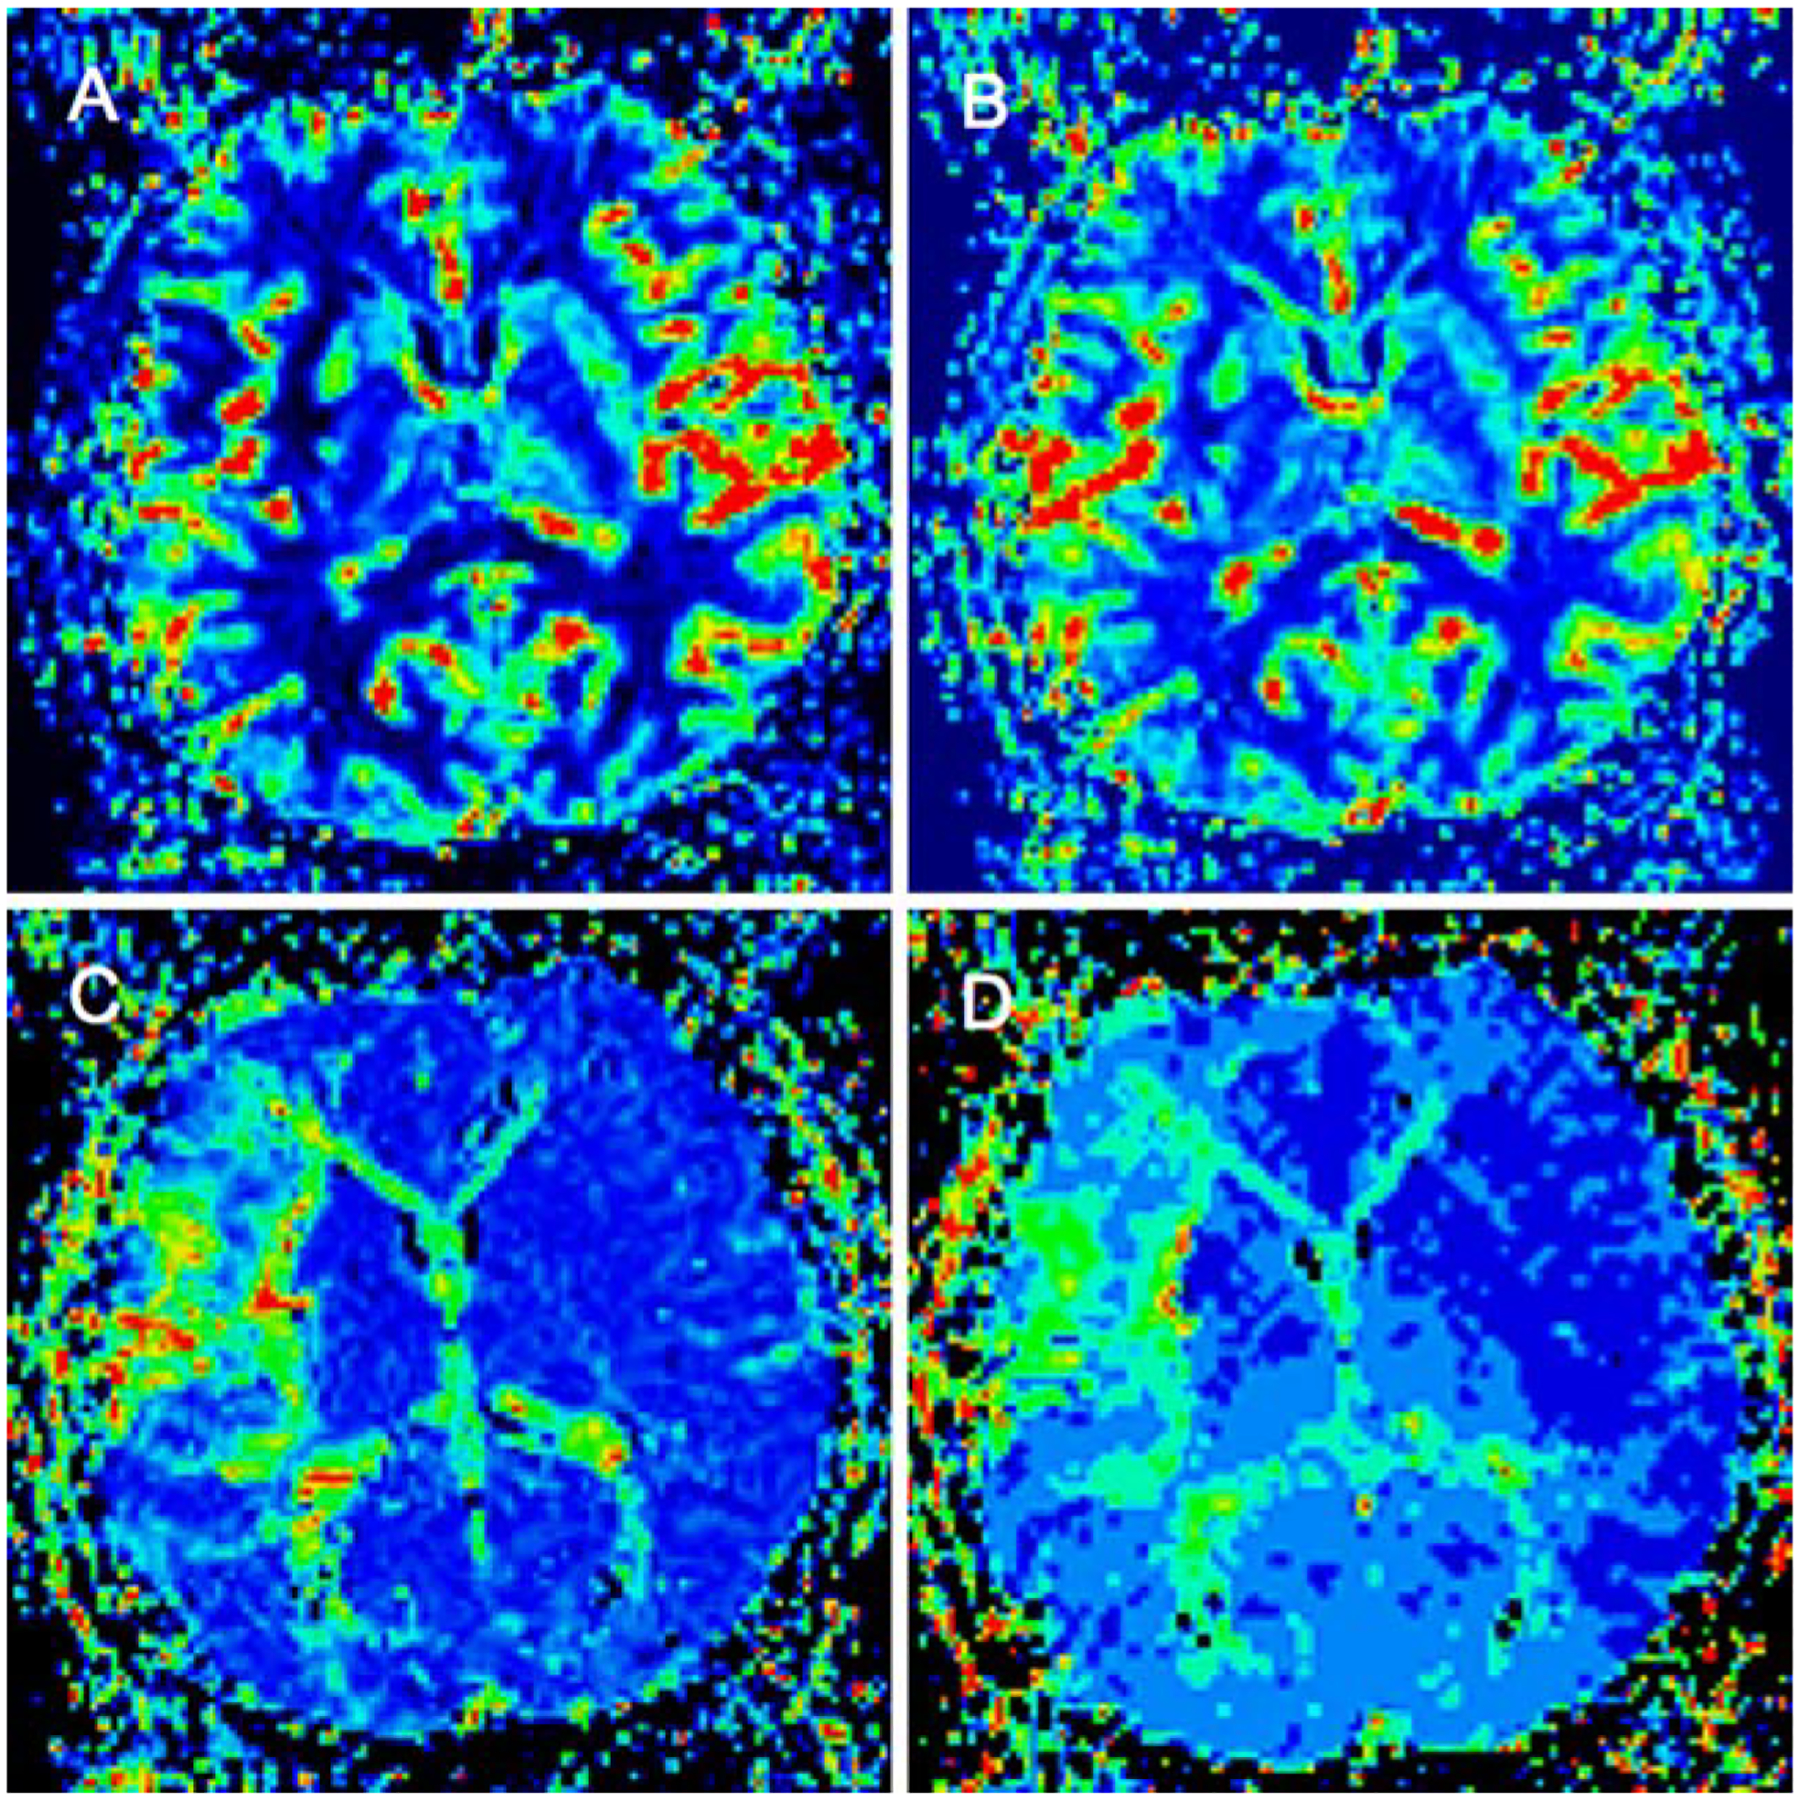
Perfusion imaging (PI) in the same patient of Fig. 2 with right middle cerebral artery infarction. Color-coded parameter images of the cerebral blood flow (CBF; a), cerebral blood volume (CBV; b), mean transit time (MTT; c), and time to peak (TTP; d)
In contrast, the arterial spin labeling (ASL) technique does not require the use of contrast agent. This technique exploits the spins of endogenous water protons to measure perfusion. The spin polarity of arterial protons flowing into the imaging plane is inverted by applying radiofrequency pulses upstream from the imaging section. The perfusion parameters are calculated by subtraction of two imaging sets with flow-sensitive and flow-insensitive measurements [13]. First, observation in stroke patients demonstrated a high sensitivity to any kind of delayed perfusion [29]; thus, different severity of perfusion disturbances are not differentiated, which remains ASL experimental at the current stage.
In CE PI, it is not yet clear which parameter gives the optimum approximation to critical hypoperfusion and allows differentiation of infarcted tissue from penumbra and penumbra from oligemia [30]. Most authors, however, agree that in clinical condition, mean transit time gives the best results. Calculation of the quantitative cerebral blood flow requires knowledge of the arterial input function (AIF), which in clinical practice is estimated from a major artery such as the middle cerebral artery. Thijs et al. evaluated the impact of the AIF measured at four different locations in 13 ischemic stroke patients [31]. The curves of AIF were measured near both middle cerebral arteries, in branches adjacent to the largest DWI abnormality, and in the contralateral tissue to the DWI lesion. The largest PI lesion was measured based on the AIF of the unaffected middle cerebral artery. The other three AIFs led to an underestimation of the infarct size on follow-up images.
PI/DWI mismatch concept
The attempt to differentiate infarct core from penumbra by imaging technique was made by introducing DWI and PI into the clinical setting. Using a simplified approach, it has been hypothesized that DWI more or less reflects the irreversibly damaged infarct and PI the complete area of hypoperfusion [8]. The volume difference between these two (termed the PI/DWI mismatch) would therefore be the stroke MRI equivalent of the ischemic penumbra (Fig. 4). On the other hand, if there is no difference in PI and DWI volumes or even a negative difference (PI<DWI), this is termed a PI/DWI match and, according to the model, equivalent to a patient who does not have penumbral tissue because of normalization of prior hypoperfusion or completion of infraction and total loss of penumbra [32, 33]. One criticism is that this model does not take into account that the PI lesion also assesses areas of oligemia, which are not in danger and that DWI abnormalities do not necessarily turn into infarction [34].
Fig. 4.
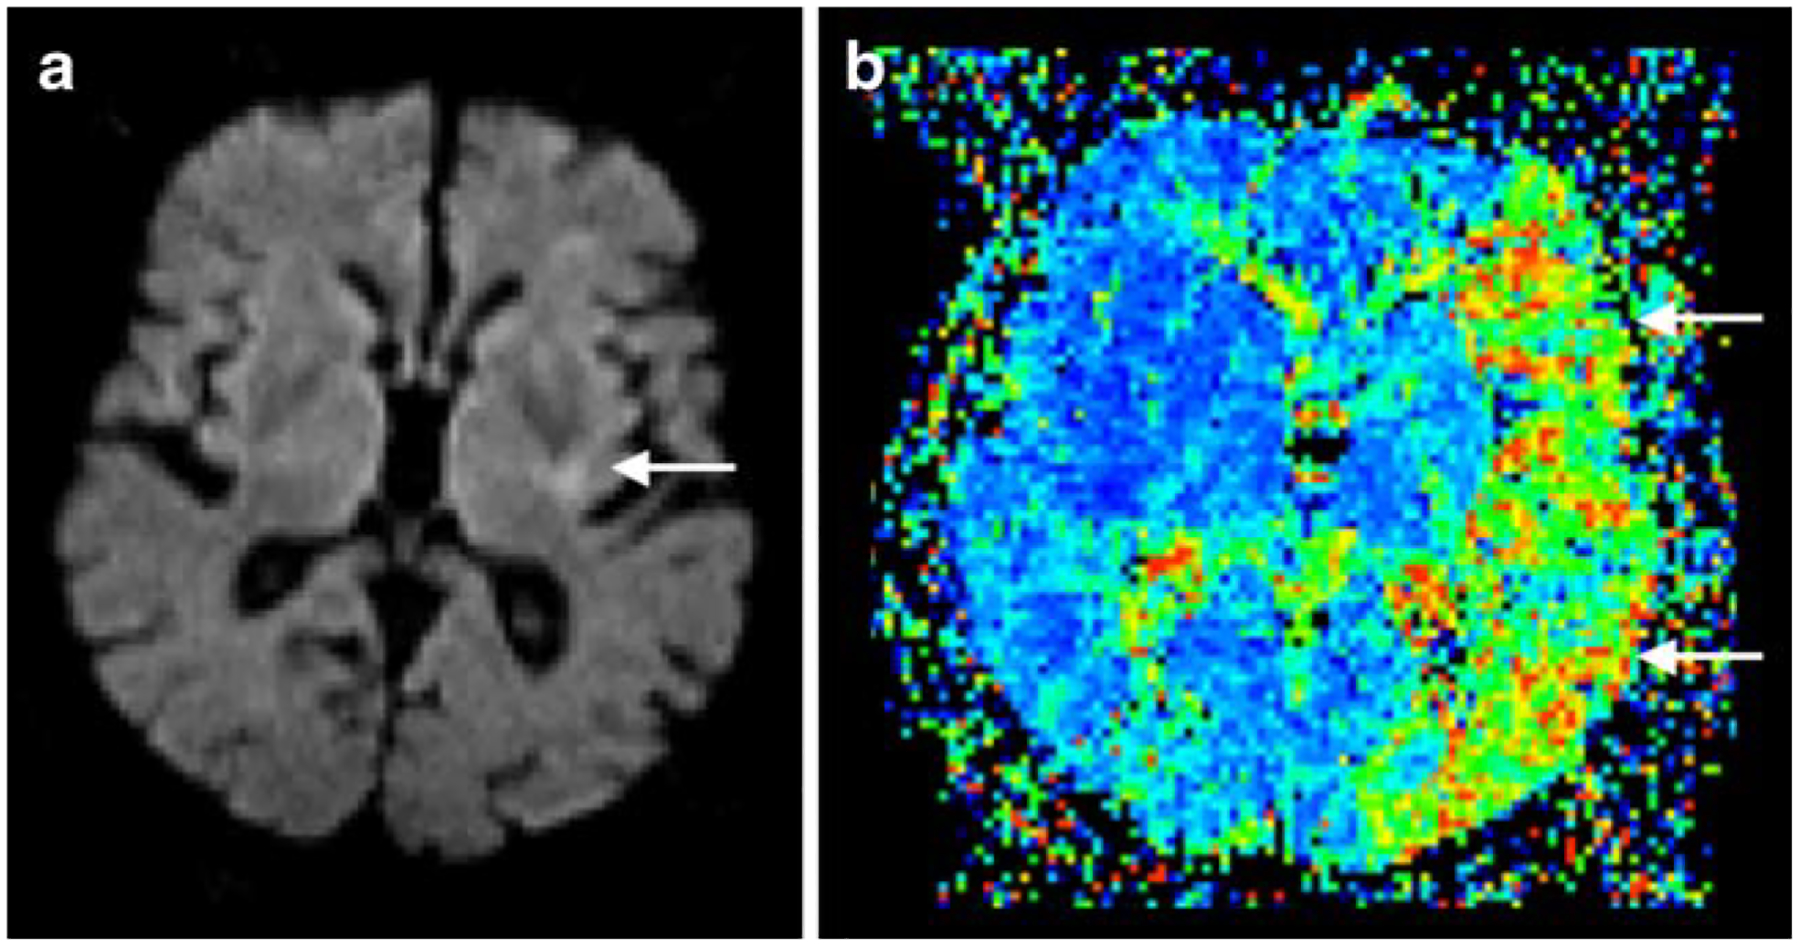
Perfusion/diffusion mismatch in a patient with left middle cerebral artery occlusion. Note the small area of infarct core (arrow) in the diffusion-weighted image (DWI; a) in comparison with the large area of perfusion abnormality (arrows) in mean transit time (MTT; b) resulting in positive mismatch with a large penumbra
Non-contrast magnetic resonance angiography (MRA)
The most commonly used non-contrast MRA technique has been time-of-flight (TOF) imaging, developed in the late 1980s. TOF-MRA relies on the differences in exposure to radiofrequency excitation between in-plane or in-slab stationary protons and the blood protons flowing into the section or slab. Stationary protons in the imaging section become relatively saturated with repeated excitation pulses and produce low signal intensity. Inflowing blood protons in arteries and veins have not experienced the excitation pulses, are not saturated, and therefore generate high signal intensity. For selective imaging of arteries, saturation bands are applied on the venous side of imaging sections to null signal from the venous flow [35]. Acquisitions can be performed by using two-dimensional or three-dimensional (3D) methods depending on the spatial resolution and the extent of the vascular territory to be imaged. For the examination of intracranial vessels, 3D-TOF-MRA is the preferred method today, using recent technical improvements like parallel imaging and higher magnetic fields to achieve high spatial isotropic resolution, fast acquisition times, and reduced artifacts [5]. MRA is useful for detecting intravascular occlusion due to thrombus (Fig. 5) and for evaluating the vessels for stenosis in patients with acute stroke [4].
Fig. 5.
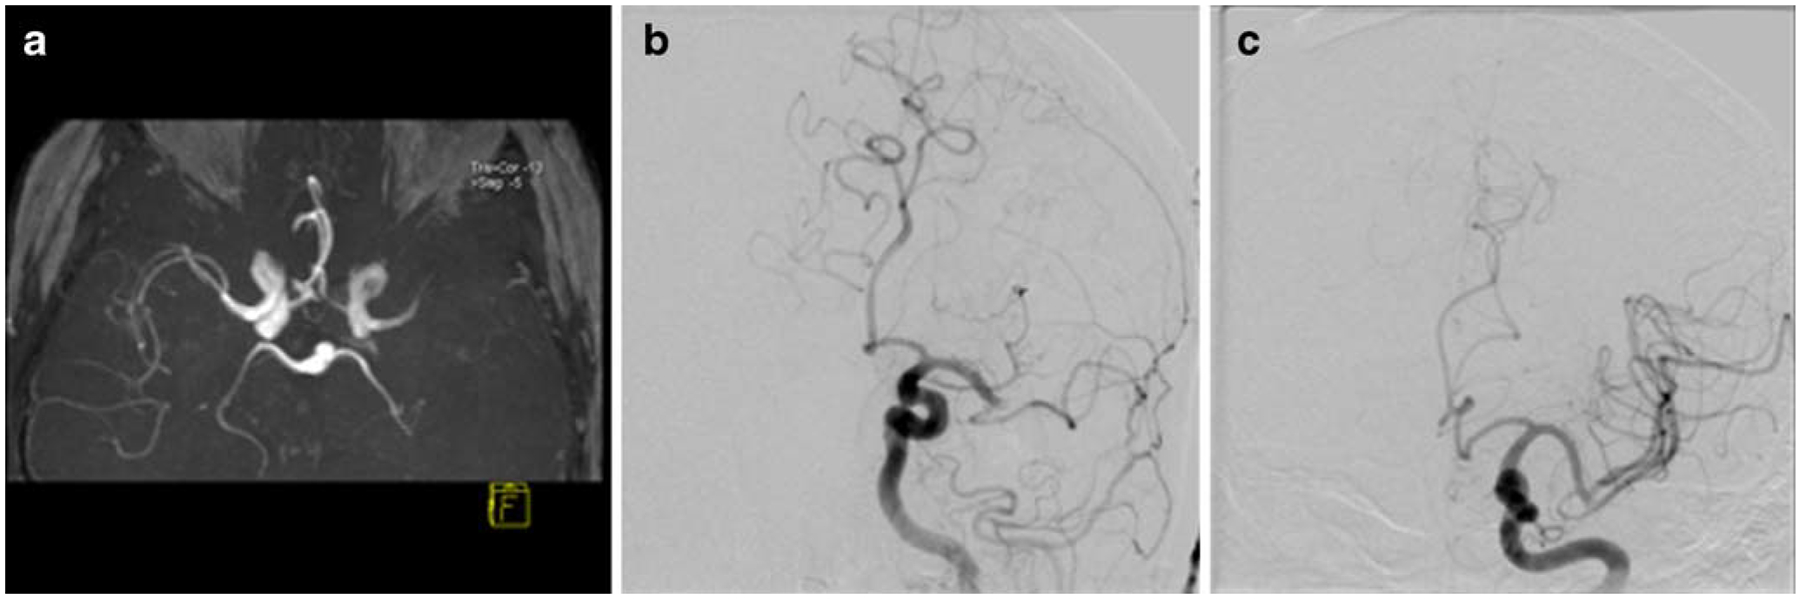
Magnetic resonance angiography (MRA; a) in the same patient of Fig. 4 with left distal middle cerebral artery occlusion. Digital subtraction angiography (DSA; b) revealed the identical site of occlusion. After intra-arterial thrombolysis, complete recanalization of the middle cerebral artery was achieved (c)
Optional sequences for selected conditions
Susceptibility-weighted imaging (SWI)
Susceptibility-weighted imaging (SWI) is a relatively new neuroimaging technique, which uses tissue magnetic susceptibility differences to generate a unique contrast, different from that of spin density, T1, T2, and T2* [36]. The use of SWI in clinical practice is to visualize venous structures and iron in the brain and to study diverse pathologic conditions [37]. In suspected acute stroke, SWI can serve as a complementary sequence to detect a hemorrhagic component within the region of infarction, to demonstrate areas of hypoperfusion, and detect acute intravascular embolus. Studies have shown that SWI is more sensitive in detecting hemorrhage than CT and T2*-weighted imaging.
For the differential diagnosis of cerebral venous sinus thrombosis, SWI has become a useful method by demonstrating venous stasis and collateral slow flow (Fig. 6). Dural sinus thrombosis causes an increase of deoxyhemoglobin concentration in the involved veins. This appears as prominent hypointense signal intensity on SWI [38].
Fig. 6.
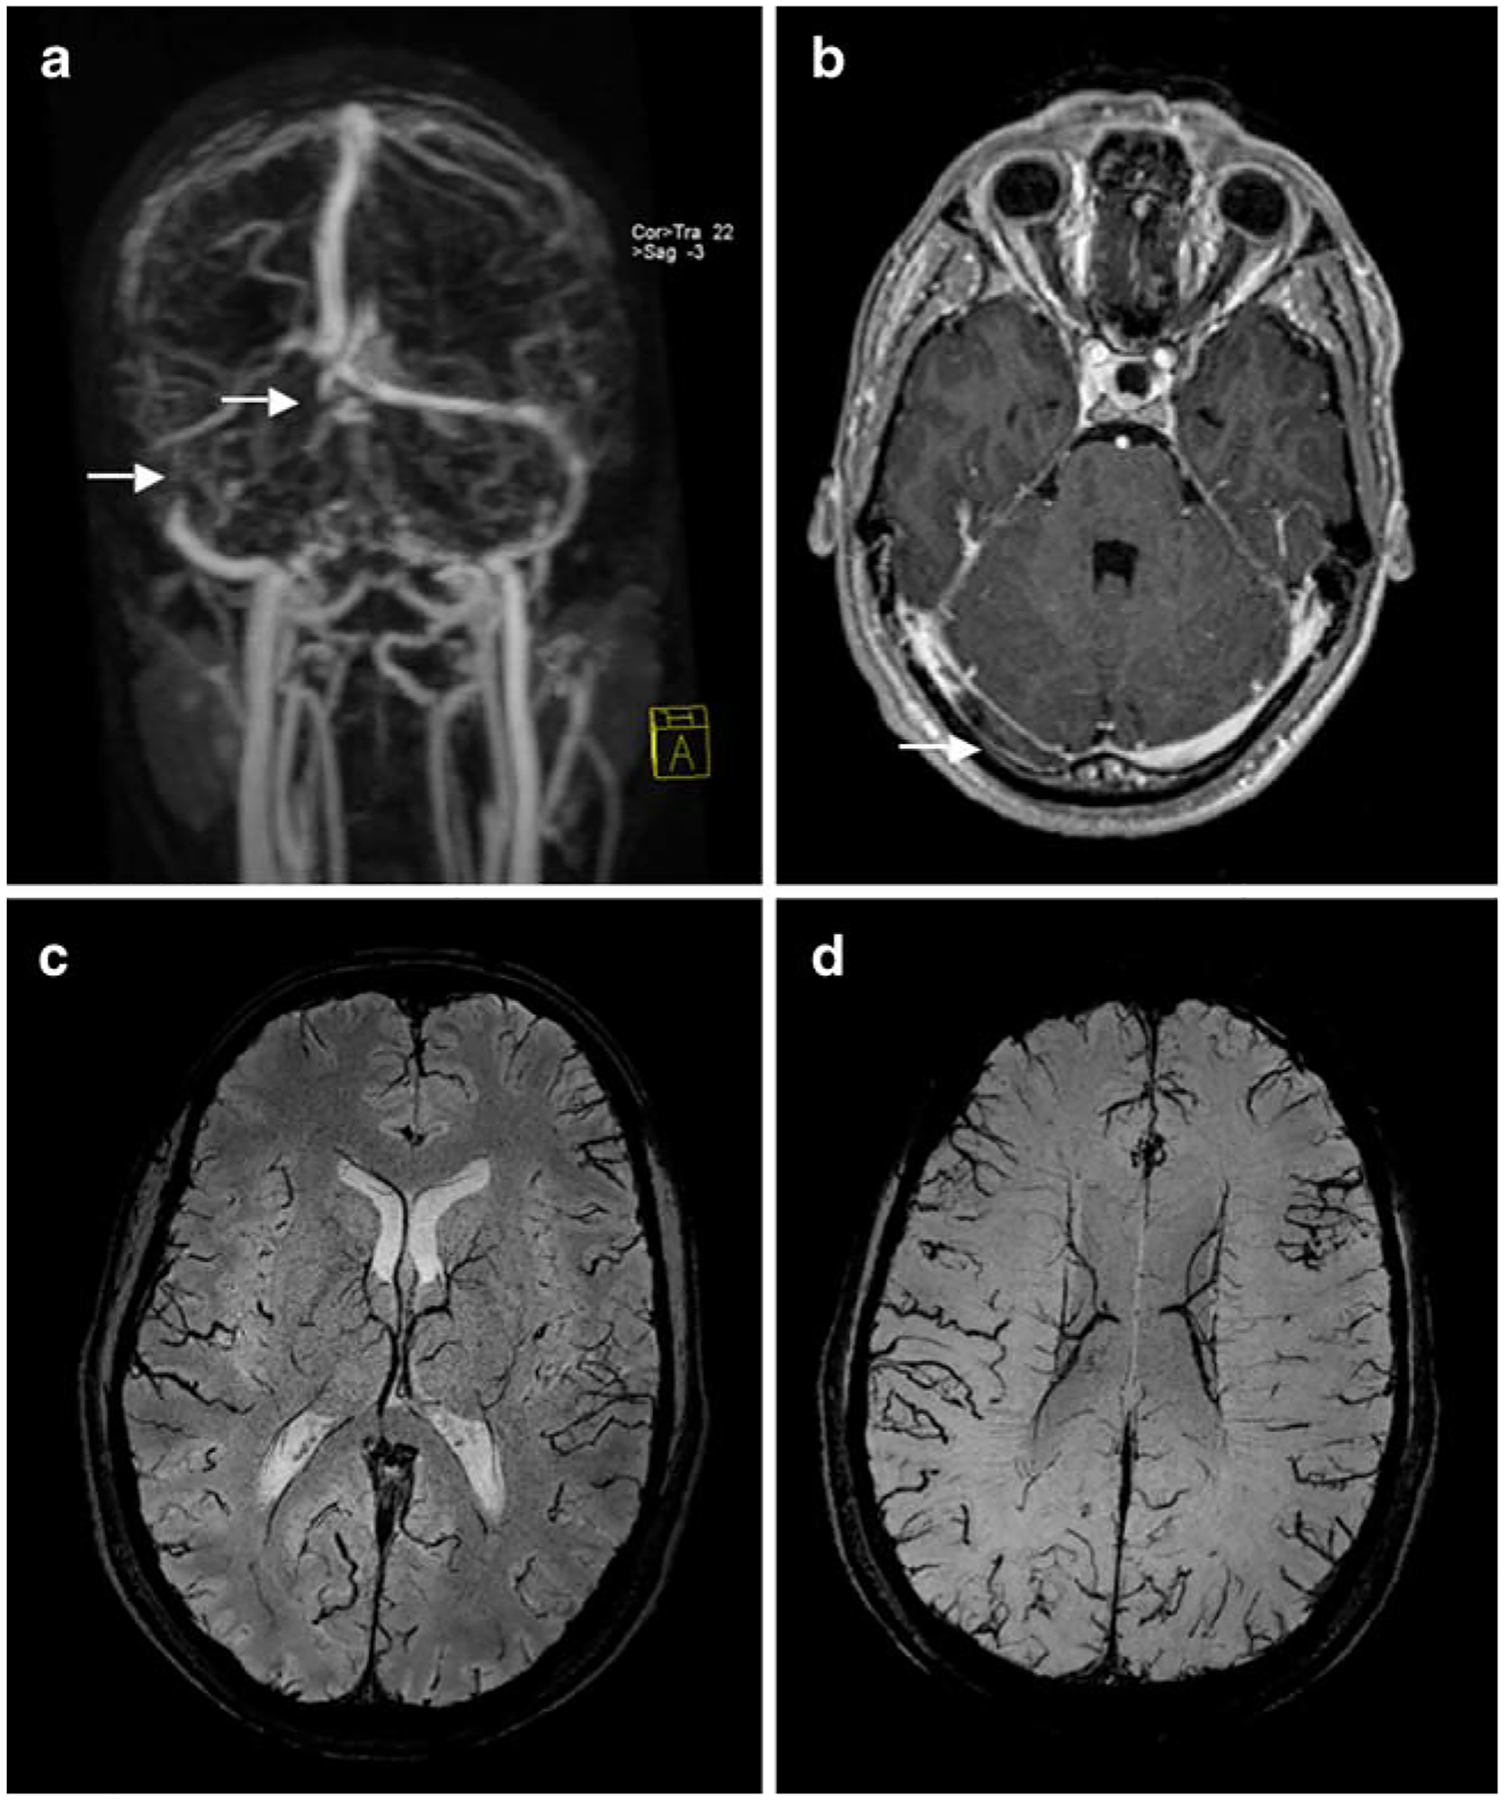
Cerebral venous sinus thrombosis of the right transverse sinus and confluens of sinus on venous contrast-enhanced magnetic resonance angiography (CE-MRA; a; arrows) and contrast-enhanced T1-weighted image (b; arrow). Susceptibility-weighted images demonstrate the consecutive venous collaterals with enlarged cortical veins (c, d)
Fat-saturated T1 (T1-FS)-weighted imaging
Vascular dissection is an important etiology of acute infarction, causing up to 20% of cerebral infarctions in young patients. Dissection occurs when blood extends into the wall of a vessel through an intimal tear. This may occur in the extra- or intracranial portion of the cervical arteries and may be of spontaneous or post-traumatic etiology [7]. Dissection occurs most frequent in the distal extracranial portion of the internal carotid artery and the vertebral artery. Dissections cause ischemic stroke primarily through embolization rather than hemodynamic flow limitation [39]. Depending on the blood degradation, the intramural blood appears hyperintense on T1-FS-weighted images, when methemoglobin develops (Fig. 7). This signal appearance is typically seen 2 to 3 days after dissection with high sensitivity [40]. T1-FS-weighted images should be considered if cervical artery dissection is suspected, in particular, in young stroke patients. However, dedicated evaluation of a probably dissected vessel must be postponed after the initiation of thrombolysis if a patient can be treated within the narrow treatment time window.
Fig. 7.
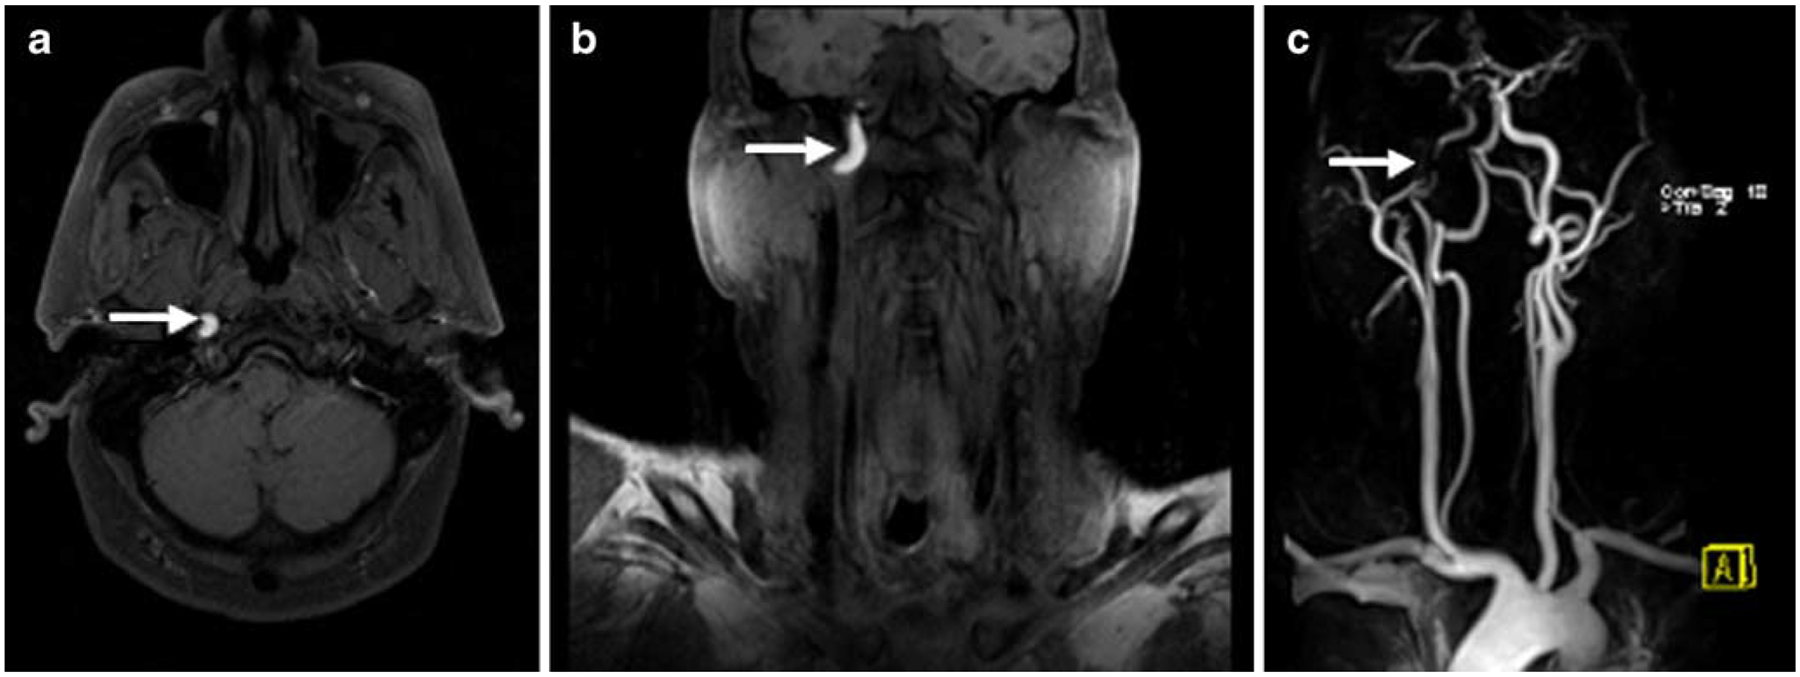
Patient with right internal carotid artery dissection of the transcranial portion. The fat saturated T1 (T1-FS)-weighted images in transverse (a) and coronal (b) orientation show the hyperintense signal of the intramural methemoglobin (arrow). The contrast-enhanced magnetic resonance angiography (CE-MRA; c) shows marked narrowing of the intravascular lumen (arrow) at the site of dissection
Contrast-enhanced magnetic resonance angiography (CE-MRA) of the cervical arteries
CE-MRA is the technique of choice for extracranial artery imaging [13]. It relies on injection of a paramagnetic agent such as gadolinium to reduce the T1 relaxation time of tissue and to generate contrast between the intravascular lumen and surrounding tissues [41]. Unlike TOF-MRA, vascular contrast is therefore relatively independent of flow dynamics, and artifacts associated with saturation effects are substantially reduced. Vessels from the aortic arch to the circle of Willis can be obtained in less than 1 min. The multi-segmental vascular coverage enables potential assessment of stenosis or vessel occlusion [42]. CE-MRA is also used to demonstrate luminal narrowing in acute dissection [43] (Fig. 7). Occasionally, a flap can appear as a linear low signal defect on MRA. Chronically, the vessel can occlude, recanalize, or show pseudoaneurysm after dissection. Depending on the scan delay, the arterial or the venous phase can be imaged with CE-MRA for evaluation of different cerebrovascular pathologies.
Contrast-enhanced T1 (CE-T1)-weighted imaging
CE-T1-weighted images show arterial enhancement in 50% of hyperacute ischemic strokes. This arterial enhancement is thought to be secondary to slow flow, collateral flow, or hyperperfusion following early recanalization [44]. It may be detected as early as 2 h after stroke onset and can persist for up to 7 days. Parenchymal gyriform enhancement of the infarcted brain tissue may be visible at 2 to 3 days after stroke onset but is consistently present at 6 days and persists for 4 to 6 weeks [45]. CE-T1-weighted images in the initial imaging of suspected acute stroke are also used to exclude the differential diagnoses of inflammatory disease or malignancy.
MRI-based stroke treatment
The central premise of ischemic stroke treatment in the early phase is to rescue the potentially salvageable ischemic brain tissue [46]. When a cerebral artery is occluded, a core of brain tissue dies rapidly. Surrounding this infarcted core is an area of brain that is hypoperfused but does not die immediately, due to collateral blood flow. This area is called the ischemic penumbra [6]. The fate of the penumbra depends upon reperfusion of the ischemic brain. In case of persistent arterial occlusion, the infarct will grow and progressively replace the penumbra. In the case of early recanalization, either spontaneous or resulting from thrombolysis, the penumbra will be salvaged from infarction (Fig. 8). With the approval of intravenously administered recombinant tissue plasminogen activator (rt-PA) for thrombolysis of acute ischemic stroke by the US Food and Drug Administration in 1995 [47] and 1 year later in Europe [48], direct treatment of the cerebral artery occlusion became possible. While initially limited to 3 h after symptoms onset, a recent randomized trial confirmed a save extension of the time window for intravenous thrombolysis to 4.5 h [49]. In stroke centers with the interventional neuroradiology facility 24/7, intra-arterial thrombolysis is a proven option for the time window up to 6 h after stroke onset for selected patients [46]. The reperfusion rates of endovascular treatment are excellent; however, due to the huge logistic efforts needed the delay until effective reperfusion compared to intravenous treatment limits the clinical response. Recently, progress was made in the neurointerventional field with the introduction of mechanical intravascular thrombectomy devices. This therapy option has no need of a rigorous time window, but the therapy decision is made individually based on the portion of potentially salvageable ischemic tissue. The initial experience with several devices is promising and has the potential to improve patient outcome with this treatment option [50, 51]. However, randomized placebo controlled trials are yet to come.
Fig. 8.
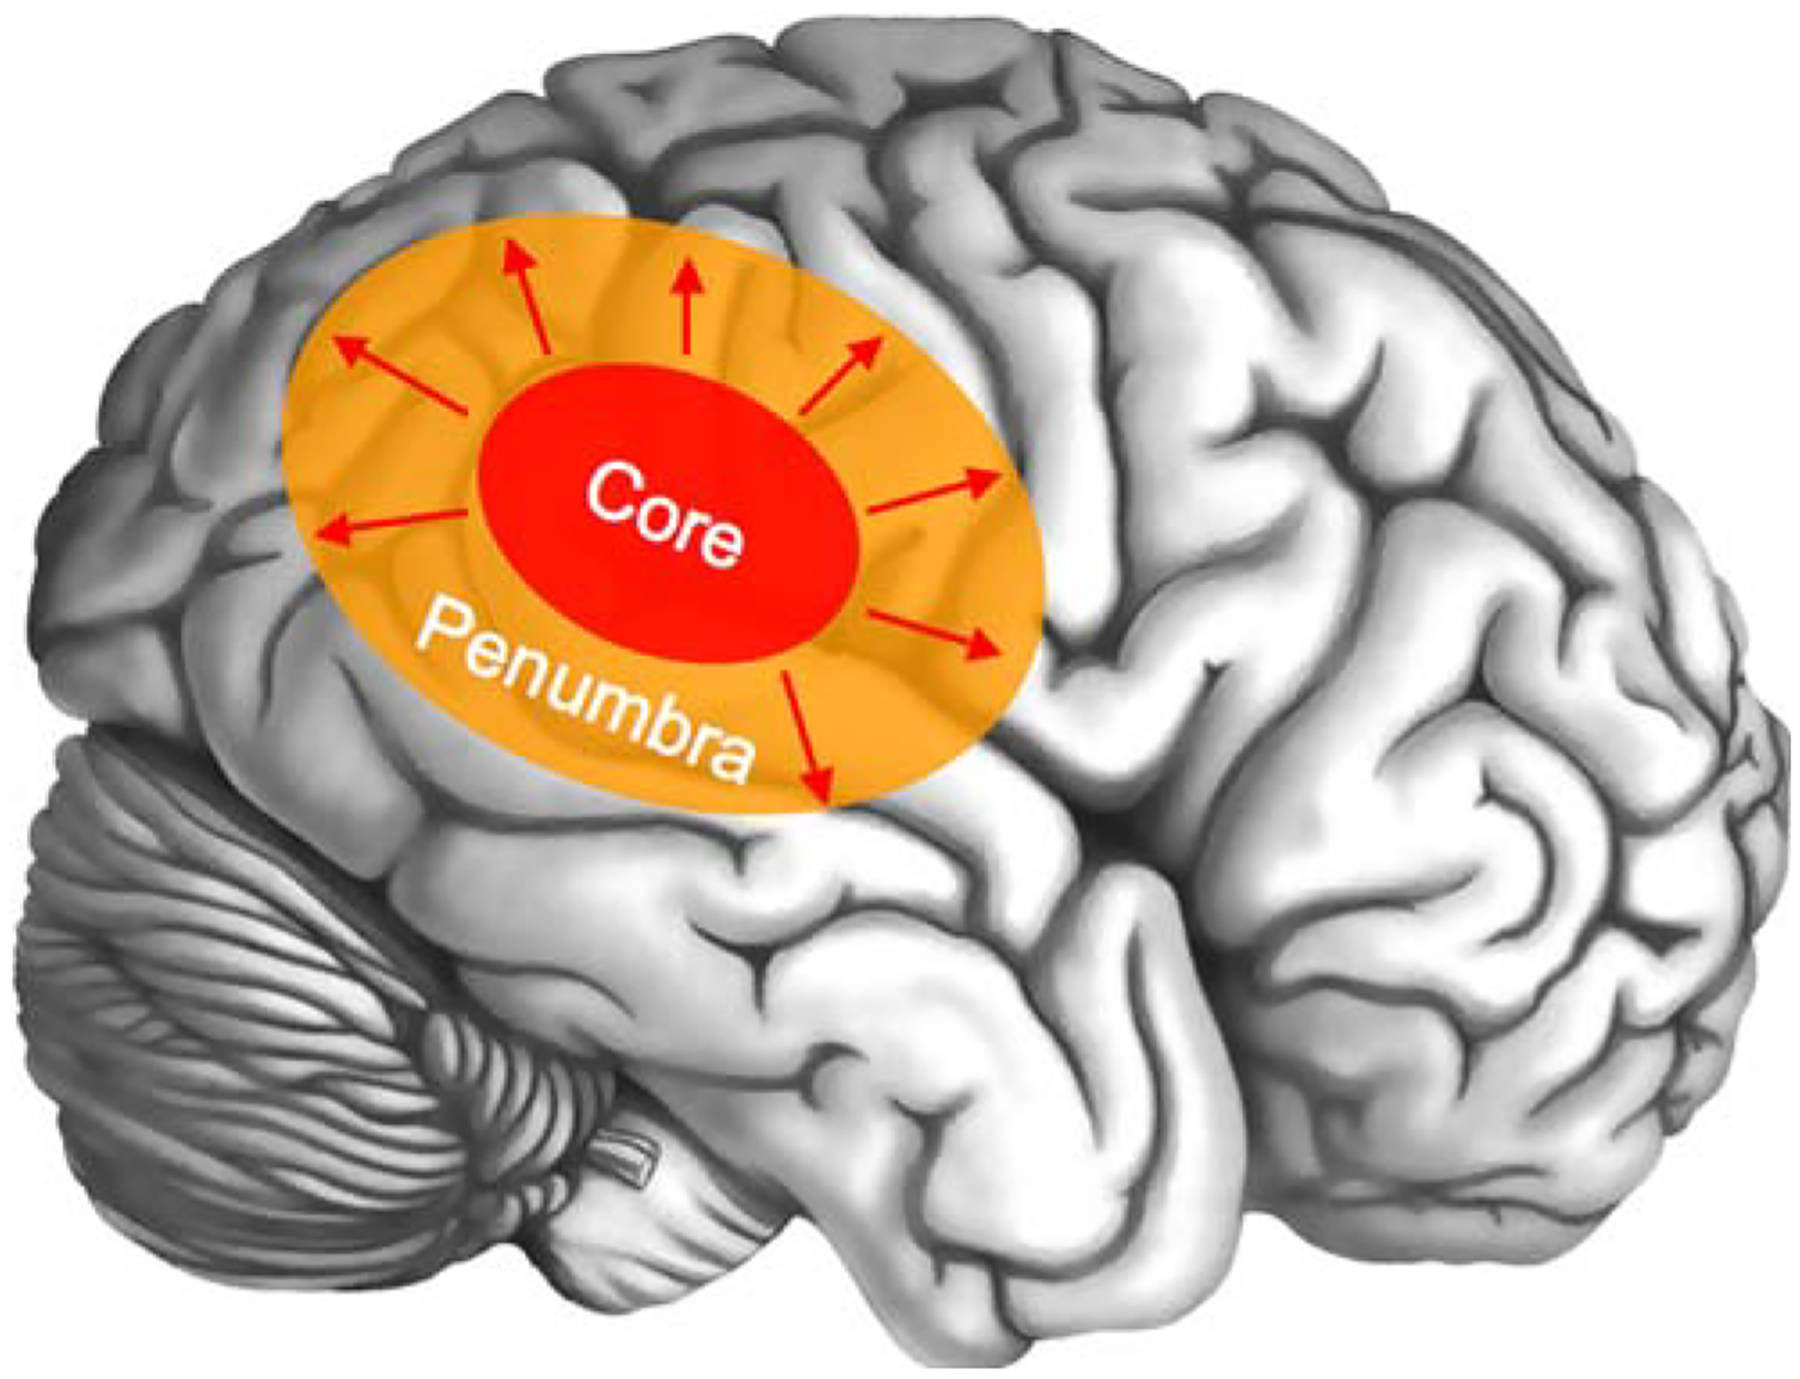
Scheme of brain involvement in acute stroke. A core of irreversibly infarcted tissue (red zone) is surrounded from a peripheral region of ischemic but potentially salvageable tissue in the early phase of acute ischemic stroke, referred to as penumbra (orange zone). Without early recanalization, the infarct core gradually expands to include the penumbra (red arrows)
Magnetic resonance imaging for extended thrombolysis
Brain imaging for intravenous thrombolysis requires nonenhanced CT only to exclude ICH or other contraindications [52]. However, this approach neglects that the presence and extent of ischemic penumbra and therefore the portion of potentially salvageable tissue is not only dependent on time. Indeed, from patient to patient survival of the penumbra can vary from less than 3 h to well beyond 48 h. Interestingly, persistence of penumbra tissue even more than 9 h after stroke onset is common [53]. The relatively negative results to date of CT-based thrombolysis trials beyond the established time window [54, 55], in spite of the high percentage of patients with penumbra within this time window, relates to the lack of any method of penumbral imaging to select patients for therapy in these trials, despite penumbra being the target for treatment. Thus, a paradigm change from “time is brain” to “physiology is brain” [56], where both the extents of infarct core and penumbra based on the PI/DWI mismatch concept are determined, would seem an ideal guide to patient selection for thrombolysis [33, 57, 58].
Several large observational studies using stroke MRI with PI/DWI mismatch imaging in an extended time window in clinical practice [59–61] as well as two randomized phase II trials [62, 63]—Desmoteplase in Acute Ischemic Stroke (DIAS) and Dose Escalation of Desmoteplase in Acute Ischemic Stroke (DEDAS)—have been published, all showing a better safety and efficacy profile of MRI-based thrombolysis, despite of later time windows. Only in the small phase II trials DIAS and DEDAS, a randomized placebo controlled study design was used. The other series were larger but open and used contemporary or historical controls. Further efforts were undertaken to assess the validity of the PI/DWI mismatch concept with two multicenter studies, Diffusion-weighted Imaging Evaluation for Understanding Stroke Evolution (DEFUSE) [64] and Echoplanar Imaging Thrombolysis Evaluation Trial (EPITHET) [65]. DEFUSE, simply stated, shows that mismatch patients benefit from thrombolysis, whereas those without mismatch or large DWI lesions do not. Although EPITHET missed the primary outcome of infarct volume reduction, trends and significant results were seen for secondary outcomes such as late reperfusion as well as functional outcome. A pooled analysis of DEFUSE and EPITHET is underway. It must be stated that neither DEFUSE nor EPITHET used PI/DWI mismatch for patient selection. Patients were selected by non-contrast CT and then received MRI after treatment was initiated.
The first PI/DWI mismatch-based thrombolysis phase III trial—DIAS-2 [66]—has not reached the primary endpoint. The study found that patients with proven vessel occlusion on MRA or with PI/DWI mismatch volume of >75 mL had a 19% absolute difference in clinical response between placebo and the investigated thrombolytic agent. Currently, another MRI-based stroke treatment phase II trial is currently recruiting patients, AX-200 for the Treatment of Ischemic Stroke (AXIS 2; ClinicalTrials.gov Identifier: NCT00927836), using granulocyte colony stimulating factor for neuroprotection) [67].
A limitation of the current PI/DWI mismatch imaging is that dynamic susceptibility contrast-enhanced PI is unable to generate absolute cerebral blood flow values, and no consensus has been established regarding the optimal perfusion algorithm and mismatch volume threshold. Moreover, a diversity of postprocessing software is used to generate perfusion maps with resulting discrepancy [68]. Therefore, a harmonized postprocessing software and consensus about the definition of PI/DWI mismatch is needed to make it comparable within all centers and to further improve stroke MRI [69].
Magnetic resonance imaging for predicting hemorrhagic transformation
While T2*-weighted imaging has demonstrated to be more sensitive to small areas of hemorrhage transformation in infarct tissue compared to CT in the past [70], SWI is a relatively new neuroimaging technique, which uses tissue magnetic susceptibility differences to generate a unique contrast. Initial studies have shown that SWI is more sensitive in detecting hemorrhage than T2*-weighted imaging. SWI is so sensitive to such a small amount of hemorrhage that even conventional long-TE GE images can fail to show the remnant hemorrhage after stroke [71].
It is known that thrombolysis in acute stroke increases the risk of cerebral hemorrhage with subsequent clinical deterioration and potential fatal outcome, but also spontaneous cerebral hemorrhage occurs secondary to acute ischemic stroke. Currently, the major interest in this field is directed to the preexisting integrity of the blood–brain barrier. MR permeability imaging is based on dynamic CE imaging and subsequent kinetic modeling of microvascular permeability and allows quantification of defects in the blood–brain barrier [72]. The identification of patients with a loss of integrity of the blood–brain barrier, which is thought to be related to an increased risk of hemorrhagic transformation with thrombolysis, may help reduce morbidity and mortality. In recent investigations of the role of MR permeability imaging in acute ischemic stroke, it was reported that defects in the blood–brain barrier predispose for both spontaneous and thrombolysis-associated hemorrhagic transformation in ischemic stroke [73, 74]. These results may support the hypothesis that blood–brain barrier integrity is closely related to the risk of hemorrhagic transformation. Moreover, a study demonstrated that rt-PA treatment itself increases the risk of blood–brain barrier disruption in acute stroke [75]. There is no final conclusion whether or not this will be a criterion in MRI-based treatment decision in acute stroke in the future, but further trials are required in this field to verify these observations.
Magnetic resonance imaging for prediction of thrombolysis outcome
The selection of patients who are likely to benefit from thrombolysis is the foremost aim of acute stroke MRI. On the other hand, identification of patients who are less likely to benefit from thrombolysis is important as well. It is known that large ischemic lesions on DWI are predictive for poor outcome whether or not thrombolysis is performed [76]. If the DWI lesion is limited, an existing PI/DWI mismatch increases the chance of good outcome as demonstrated in the DEFUSE trial [64]. However, even in the presence of a large PI/DWI mismatch, no benefit can be expected if early recanalization of the occluded vessel fails [77]. A recent study found that a susceptibility sign of the M1 segment of the middle cerebral artery in T2*-weighted imaging is a strong predictor for no early recanalization after intravenous thrombolysis in acute stroke patients with internal carotid artery or proximal middle cerebral artery occlusion [78]. The observation raises several questions: does the length of a thrombus sign affect the recanalization rate and is there a link to collateral status? Further investigation is needed in this field. Future therapy guidelines based on MRI might favor patients with imaging characteristics related to a low likelihood of recanalization with intravenous thrombolysis for intra-arterial intervention instead.
Magnetic resonance imaging for monitoring of restorative stroke therapy
Although covering this topic in detail is beyond the scope of this review article, however, some recent developments in this field should be mentioned briefly. Restorative therapy has the aims to improve outcome by promoting repair and restoration rather than by salvaging acutely ischemic tissue and would take place in the subacute or chronic phase [79]. Restorative interventions include growth factors, cells, small molecules, intensive and activity-based therapy, robotics, neuroprosthetics, electromagnetic brain stimulation, and cognitive strategies such as motor imagery [80]. This field of stroke therapy is relatively new, and several ongoing trials are under study. While prior attempts to measure the extent of brain damage were simply focused on anatomical methods such as infarct volume, restoration in stroke demands insight in tissue function. Technical development with high-field MRI enabling high resolution MRI can detect changes in cortical thickness for treatment monitoring. Diffusion tensor imaging (DTI) is used to visualize injury to neuronal tracts due to stroke and assist the therapeutic decision. DTI measures the tendency of water movement to be directional. In brain injury such as stroke, the linearity of water movement within a directional tract such as the corticospinal is reduced [81]. Measurement of tissue function can also be useful to monitor restorative therapy. Functional MRI measures the volume of regional activation, such as the volume of Broca’s area activated during a speech output task [82].
Restorative stroke therapy is just emerging, but most likely, it will become an important part of extended stroke therapy. MRI has the potential to assess the extent of anatomical and functional injury to the brain and to direct and monitor the individually adapted restorative therapy [83].
Conflict of interest statement
J.B.F. is a consultant to Paion, Forest, Lundbeck, and Perceptive and has received honoraria. M. W. received funding from the National Institutes of Health (NIH) National Center for Research Resources, Grant KL2 RR024130, GE Healthcare, and Philips Healthcare.
Contributor Information
Stephan P. Kloska, Department of Neuroradiology, University of Erlangen-Nürnberg, Schwabachanlage 6, 91054 Erlangen, Germany; Department of Clinical Radiology, University of Münster, Albert-Schweitzer-Str. 33, 48149 Münster, Germany
Max Wintermark, Department of Radiology, Neuroradiology Division, University of Virginia, 1215 Lee Street-New Hospital, Charlottesville, VA 22908-0170, USA.
Tobias Engelhorn, Department of Neuroradiology, University of Erlangen-Nürnberg, Schwabachanlage 6, 91054 Erlangen, Germany.
Jochen B. Fiebach, Center for Stroke Research Berlin (CSB), Department of Neurology, Charité, Universitätsmedizin Berlin, Campus Benjamin Franklin, Hindenburgdamm 30, 12200 Berlin, Germany
References
- 1.Lloyd-Jones D, Adams R, Carnethon M, De Simone G, Ferguson TB, Flegal K, Ford E, Furie K, Go A, Greenlund K, Haase N, Hailpern S, Ho M, Howard V, Kissela B, Kittner S, Lackland D, Lisabeth L, Marelli A, McDermott M, Meigs J, Mozaffarian D, Nichol G, O’Donnell C, Roger V, Rosamond W, Sacco R, Sorlie P, Stafford R, Steinberger J, Thom T, Wasserthiel-Smoller S, Wong N, Wylie-Rosett J, Hong Y (2009) Heart disease and stroke statistics—2009 update: a report from the American Heart Association Statistics Committee and Stroke Statistics Subcommittee. Circulation 119:e21–e181 [DOI] [PubMed] [Google Scholar]
- 2.Kolominsky-Rabas PL, Heuschmann PU, Marschall D, Emmert M, Baltzer N, Neundörfer B, Schöffski O, Krobot KJ (2006) Lifetime cost of ischemic stroke in Germany: results and national projections from a population-based stroke registry: the Erlangen Stroke Project. Stroke 37:1179–1183 [DOI] [PubMed] [Google Scholar]
- 3.Adams HP, Bendixen BH, Kappelle LJ, Biller J, Love BB, Gordon DL, Marsh EE (1993) Classification of subtype of acute ischemic stroke. Definitions for use in a multicenter clinical trial. TOAST. Trial of Org 10172 in Acute Stroke Treatment. Stroke 24:35–41 [DOI] [PubMed] [Google Scholar]
- 4.Mezzapesa DM, Petruzzellis M, Lucivero V, Prontera M, Tinelli A, Sancilio M, Carella A, Federico F (2006) Multimodal MR examination in acute ischemic stroke. Neuroradiology 48:238–246 [DOI] [PubMed] [Google Scholar]
- 5.Gonzalez RG, Schaefer PW (2006) Conventional MRI and MR angiography of stroke. In: Gonzalez RG, Hirsch JA, Koroshetz WJ, Lev MH, Schaefer P (eds) Acute ischemic stroke: imaging and intervention. Springer, Berlin, pp 115–137 [Google Scholar]
- 6.Astrup J, Siesjo BK, Symon L (1981) Thresholds in cerebral ischemia—the ischemic penumbra. Stroke 12:723–725 [DOI] [PubMed] [Google Scholar]
- 7.Koroshetz WJ, Gonzalez RG (2006) Causes of ischemic stroke. In: Gonzalez RG, Hirsch JA, Koroshetz WJ, Lev MH, Schaefer P (eds) Acute ischemic stroke: imaging and intervention. Springer, Berlin, pp 27–40 [Google Scholar]
- 8.Jansen O, Schellinger P, Fiebach J, Hacke W, Sartor K (1999) Early recanalisation in acute ischaemic stroke saves tissue at risk defined by MRI. Lancet 353:2036–2037 [DOI] [PubMed] [Google Scholar]
- 9.Warach S, Gaa J, Siewert B, Wielopolski P, Edelman RR (1995) Acute human stroke studied by whole brain echo planar diffusion-weighted magnetic resonance imaging. Ann Neurol 37:231–241 [DOI] [PubMed] [Google Scholar]
- 10.Fiebach JB, Schellinger PD, Gass A, Kucinski T, Siebler M, Villringer A, Olkers P, Hirsch JG, Heiland S, Wilde P, Jansen O, Röther J, Hacke W, Sartor K (2004) Stroke magnetic resonance imaging is accurate in hyperacute intracerebral hemorrhage: a multicenter study on the validity of stroke imaging. Stroke 35:502–506 [DOI] [PubMed] [Google Scholar]
- 11.Kidwell CS, Chalela JA, Saver JL, Starkman S, Hill MD, Demchuk AM, Butman JA, Patronas N, Alger JR, Latour LL, Luby ML, Baird AE, Leary MC, Tremwel M, Ovbiagele B, Fredieu A, Suzuki S, Villablanca JP, Davis S, Dunn B, Todd JW, Ezzeddine MA, Haymore J, Lynch JK, Davis L, Warach S (2004) Comparison of MRI and CT for detection of acute intracerebral hemorrhage. JAMA 292:1823–1830 [DOI] [PubMed] [Google Scholar]
- 12.Rowley HA (2001) The four Ps of acute stroke imaging: parenchyma, pipes, perfusion, and penumbra. AJNR 22:599–601 [PMC free article] [PubMed] [Google Scholar]
- 13.Srinivasan A, Goyal M, Al Azri F, Lum C (2006) State-of-the-art imaging of acute stroke. Radiographics 26(Suppl 1):S75–S95 [DOI] [PubMed] [Google Scholar]
- 14.Fiebach JB, Schellinger PD, Geletneky K, Wilde P, Meyer M, Hacke W, Sartor K (2004) MRI in acute subarachnoid haemorrhage: findings with a standardised stroke protocol. Neuroradiology 46:44–48 [DOI] [PubMed] [Google Scholar]
- 15.Boukobza M, Crassard I, Bousser MG, Chabriat H (2009) MR imaging features of isolated cortical vein thrombosis: diagnosis and follow-up. AJNR Am J Neuroradiol 30:344–348 [DOI] [PMC free article] [PubMed] [Google Scholar]
- 16.Lovblad KO, Bassetti C, Schneider J, Guzman R, El-Koussy M, Remonda L, Schroth G (2001) Diffusion-weighted MR in cerebral venous thrombosis. Cerebrovasc Dis 11:169–176 [DOI] [PubMed] [Google Scholar]
- 17.Wintermark M, Fiebach J (2009) Imaging of brain parenchyma in stroke. In: Aminoff MJ, Boller F, Swaab DF (eds) Handbook of clinical neurology. Elsevier, Philadelphia, pp 1011–1019 [DOI] [PubMed] [Google Scholar]
- 18.Stejskal E, Tanner J (1965) Spin diffusion measurements: spin echoes in the presence of a time-dependent field gradient. J Chem Phys 42:288–292 [Google Scholar]
- 19.Mohr JP, Biller J, Hilal SK, Yuh WT, Tatemichi TK, Hedges S, Tali E, Nguyen H, Mun I, Adams HP Jr et al. (1995) Magnetic resonance versus computed tomographic imaging in acute stroke. Stroke 26:807–812 [DOI] [PubMed] [Google Scholar]
- 20.Fiebach JB, Schellinger PD, Jansen O, Meyer M, Wilde P, Bender J, Schramm P, Juttler E, Oehler J, Hartmann M, Hahnel S, Knauth M, Hacke W, Sartor K (2002) CT and diffusion-weighted MR imaging in randomized order: diffusion-weighted imaging results in higher accuracy and lower interrater variability in the diagnosis of hyperacute ischemic stroke. Stroke 33:2206–2210 [DOI] [PubMed] [Google Scholar]
- 21.Saur D, Kucinski T, Grzyska U, Eckert B, Eggers C, Niesen W, Schoder V, Zeumer H, Weiller C, Rother J (2003) Sensitivity and interrater agreement of CT and diffusion-weighted MR imaging in hyperacute stroke. AJNR Am J Neuroradiol 24:878–885 [PMC free article] [PubMed] [Google Scholar]
- 22.Fiehler J, Knudsen K, Kucinski T, Kidwell CS, Alger JR, Thomalla G, Eckert B, Wittkugel O, Weiller C, Zeumer H, Rother J (2004) Predictors of apparent diffusion coefficient normalization in stroke patients. Stroke 35:514–519 [DOI] [PubMed] [Google Scholar]
- 23.DeLaPaz RL, Shibata D, Steinberg GK, Zarnegar R, George C (1991) Acute cerebral ischemia in rabbits: correlation between MR and histopathology. AJNR 12:89–95 [PMC free article] [PubMed] [Google Scholar]
- 24.Li F, Liu KF, Silva MD, Omae T, Sotak CH, Fenstermacher JD, Fisher M, Hsu CY, Lin W (2000) Transient and permanent resolution of ischemic lesions on diffusion-weighted imaging after brief periods of focal ischemia in rats: correlation with histopathology. Stroke 31:946–954 [DOI] [PubMed] [Google Scholar]
- 25.Li F, Omae T, Fisher M (1999) Spontaneous hyperthermia and its mechanism in the intraluminal suture middle cerebral artery occlusion model of rats. Stroke 30:2464–2470; discussion 2470–2461 [DOI] [PubMed] [Google Scholar]
- 26.Grandin CB (2003) Assessment of brain perfusion with MRI: methodology and application to acute stroke. Neuroradiology 45:755–766 [DOI] [PubMed] [Google Scholar]
- 27.Rosen BR, Belliveau JW, Vevea JM, Brady TJ (1990) Perfusion imaging with NMR contrast agents. Magn Reson Med 14:249–265 [DOI] [PubMed] [Google Scholar]
- 28.Wintermark M, Albers GW, Alexandrov AV, Alger JR, Bammer R, Baron J-C, Davis S, Demaerschalk BM, Derdeyn CP, Donnan GA, Eastwood JD, Fiebach JB, Fisher M, Furie KL, Goldmakher GV, Hacke W, Kidwell CS, Kloska SP, Köhrmann M, Koroshetz W, Lee T-Y, Lees KR, Lev MH, Liebeskind DS, Ostergaard L, Powers WJ, Provenzale J, Schellinger P, Silbergleit R, Sorensen AG, Wardlaw J, Wu O, Warach S (2008) Acute stroke imaging research roadmap. Stroke 39:1621–1628 [DOI] [PubMed] [Google Scholar]
- 29.Chalela JA, Alsop DC, Gonzalez-Atavales JB, Maldjian JA, Kasner SE, Detre JA (2000) Magnetic resonance perfusion imaging in acute ischemic stroke using continuous arterial spin labeling. Stroke 31:680–687 [DOI] [PubMed] [Google Scholar]
- 30.Nuutinen J, Liu Y, Laakso MP, Karonen JO, Vanninen EJ, Kuikka JT, Aronen HJ, Vanninen RL (2009) Perfusion differences on SPECT and PWI in patients with acute ischemic stroke. Neuroradiology 51:687–695 [DOI] [PubMed] [Google Scholar]
- 31.Thijs VN, Somford DM, Bammer R, Robberecht W, Moseley ME, Albers GW (2004) Influence of arterial input function on hypoperfusion volumes measured with perfusion-weighted imaging. Stroke 35:94–98 [DOI] [PubMed] [Google Scholar]
- 32.Parsons MW, Barber PA, Chalk J, Darby DG, Rose S, Desmond PM, Gerraty RP, Tress BM, Wright PM, Donnan GA, Davis SM (2002) Diffusion- and perfusion-weighted MRI response to thrombolysis in stroke. Ann Neurol 51:28–37 [DOI] [PubMed] [Google Scholar]
- 33.Schellinger PD, Fiebach JB, Hacke W (2003) Imaging-based decision making in thrombolytic therapy for ischemic stroke: present status. Stroke 34:575–583 [PubMed] [Google Scholar]
- 34.Kidwell CS, Alger JR, Saver JL (2003) Beyond mismatch: evolving paradigms in imaging the ischemic penumbra with multimodal magnetic resonance imaging. Stroke 34:2729–2735 [DOI] [PubMed] [Google Scholar]
- 35.Miyazaki M, Lee VS (2008) Nonenhanced MR angiography. Radiology 248:20–43 [DOI] [PubMed] [Google Scholar]
- 36.Haacke EM, Mittal S, Wu Z, Neelavalli J, Cheng Y-CN (2008) Susceptibility-weighted imaging: technical aspects and clinical applications, part 1. AJNR 30:19–30 [DOI] [PMC free article] [PubMed] [Google Scholar]
- 37.Mittal S, Wu Z, Neelavalli J, Haacke EM (2008) Susceptibility-weighted imaging: technical aspects and clinical applications, part2. AJNR 30:232–252 [DOI] [PMC free article] [PubMed] [Google Scholar]
- 38.Idbaih A, Boukobza M, Crassard I, Porcher R, Bousser MG, Chabriat H (2006) MRI of clot in cerebral venous thrombosis: high diagnostic value of susceptibility-weighted images. Stroke 37:991–995 [DOI] [PubMed] [Google Scholar]
- 39.Vu D, Gonzalez RG, Schaefer PW (2006) Conventional MRI and MR angiography of stroke. In: Gonzalez RG, Hirsch JA, Koroshetz WJ, Lev MH, Schaefer P (eds) Acute ischemic stroke: imaging and intervention. Springer, Berlin, pp 115–137 [Google Scholar]
- 40.Ozdoba C, Sturzenegger M, Schroth G (1996) Internal carotid artery dissection: MR imaging features and clinical-radiographic correlation. Radiology 199:191–198 [DOI] [PubMed] [Google Scholar]
- 41.Leclerc X, Gauvrit JY, Nicol L, Pruvo JP (1999) Contrast-enhanced MR angiography of the craniocervical vessels: a review. Neuroradiology 41:867–874 [DOI] [PubMed] [Google Scholar]
- 42.Bowen BC (2007) MR angiography versus CT angiography in the evaluation of neurovascular disease. Radiology 245:357–361 [DOI] [PubMed] [Google Scholar]
- 43.Leclerc X, Lucas C, Godefroy O, Nicol L, Moretti A, Leys D, Pruvo JP (1999) Preliminary experience using contrast-enhanced MR angiography to assess vertebral artery structure for the follow-up of suspected dissection. AJNR Am J Neuroradiol 20:1482–1490 [PMC free article] [PubMed] [Google Scholar]
- 44.Yuh WT, Crain MR, Loes DJ, Greene GM, Ryals TJ, Sato Y (1991) MR imaging of cerebral ischemia: findings in the first 24 hours. AJNR Am J Neuroradiol 12:621–629 [PMC free article] [PubMed] [Google Scholar]
- 45.Crain MR, Yuh WT, Greene GM, Loes DJ, Ryals TJ, Sato Y, Hart MN (1991) Cerebral ischemia: evaluation with contrast-enhanced MR imaging. AJNR Am J Neuroradiol 12:631–639 [PMC free article] [PubMed] [Google Scholar]
- 46.Adams HP, del Zoppo G, Alberts MJ, Bhatt DL, Brass L, Furlan A, Grubb RL, Higashida RT, Jauch EC, Kidwell C, Lyden PD, Morgenstern LB, Qureshi AI, Rosenwasser RH, Scott PA, Wijdicks EFM (2007) Guidelines for the early management of adults with ischemic stroke: a guideline from the American Heart Association/American Stroke Association Stroke Council, Clinical Cardiology Council, Cardiovascular Radiology and Intervention Council, and the Atherosclerotic Peripheral Vascular Disease and Quality of Care Outcomes in Research Interdisciplinary Working Groups: the American Academy of Neurology affirms the value of this guideline as an educational tool for neurologists. Stroke 38:1655–1711 [DOI] [PubMed] [Google Scholar]
- 47.The National Institute of Neurological Disorders and Stroke rt-PA Stroke Study Group (1995) Tissue plasminogen activator for acute ischemic stroke. N Engl J Med 333:1581–1587 [DOI] [PubMed] [Google Scholar]
- 48.Steiner T, Bluhmki E, Kaste M, Toni D, Trouillas P, von Kummer R, Hacke W (1998) The ECASS 3-hour cohort. Secondary analysis of ECASS data by time stratification. ECASS Study Group. European Cooperative Acute Stroke Study. Cerebrovasc Dis 8:198–203 [DOI] [PubMed] [Google Scholar]
- 49.Hacke W, Kaste M, Bluhmki E, Brozman M, Dávalos A, Guidetti D, Larrue V, Lees KR, Medeghri Z, Machnig T, Schneider D, von Kummer R, Wahlgren N, Toni D (2008) Thrombolysis with alteplase 3 to 4.5 hours after acute ischemic stroke. N Engl J Med 359:1317–1329 [DOI] [PubMed] [Google Scholar]
- 50.Natarajan SK, Snyder KV, Siddiqui AH, Ionita CC, Hopkins LN, Levy EI (2009) Safety and effectiveness of endovascular therapy after 8 hours of acute ischemic stroke onset and wake-up strokes. Stroke 40:3269–3274 [DOI] [PubMed] [Google Scholar]
- 51.Struffert T, Kohrmann M, Engelhorn T, Nowe T, Richter G, Schellinger PD, Schwab S, Doerfler A (2009) Penumbra Stroke System as an “add-on” for the treatment of large vessel occlusive disease following thrombolysis: first results. Eur Radiol 19:2286–2293 [DOI] [PubMed] [Google Scholar]
- 52.Latchaw R, Alberts M, Lev M, Connors J, Harbaugh R, Higashida R, Hobson R, Kidwell C, Koroshetz W, Mathews V, Villablanca P, Warach S, Walters B (2009) Recommendations for imaging of acute ischemic stroke. A scientific statement from the American Heart Association. Stroke 40(11):3646–3678 [DOI] [PubMed] [Google Scholar]
- 53.Copen WA, Rezai Gharai L, Barak ER, Schwamm LH, Wu O, Kamalian S, Gonzalez RG, Schaefer PW (2009) Existence of the diffusion-perfusion mismatch within 24 hours after onset of acute stroke: dependence on proximal arterial occlusion. Radiology 250:878–886 [DOI] [PubMed] [Google Scholar]
- 54.Clark WM, Wissman S, Albers GW, Jhamandas JH, Madden KP, Hamilton S (1999) Recombinant tissue-type plasminogen activator (Alteplase) for ischemic stroke 3 to 5 hours after symptom onset. The ATLANTIS study: a randomized controlled trial. Alteplase thrombolysis for acute noninterventional therapy in ischemic stroke. JAMA 282:2019–2026 [DOI] [PubMed] [Google Scholar]
- 55.Hacke W, Kaste M, Fieschi C, von Kummer R, Davalos A, Meier D, Larrue V, Bluhmki E, Davis S, Donnan G, Schneider D, Diez-Tejedor E, Trouillas P (1998) Randomised double-blind placebo-controlled trial of thrombolytic therapy with intravenous alteplase in acute ischaemic stroke (ECASS II). Second European-Australasian Acute Stroke Study Investigators. Lancet 352:1245–1251 [DOI] [PubMed] [Google Scholar]
- 56.Gonzalez RG (2006) Imaging-guided acute ischemic stroke therapy: from “time is brain” to “physiology is brain”. AJNR 27:728–735 [PMC free article] [PubMed] [Google Scholar]
- 57.Fiebach JB, Schellinger PD (2009) MR mismatch is useful for patient selection for thrombolysis: yes. Stroke 40:2906–2907 [DOI] [PubMed] [Google Scholar]
- 58.Köhrmann M, Schellinger PD (2009) Acute stroke triage to intravenous thrombolysis and other therapies with advanced CT or MR imaging: pro MR imaging. Radiology 251:627–633 [DOI] [PubMed] [Google Scholar]
- 59.Köhrmann M, Jüttler E, Fiebach JB, Huttner HB, Siebert S, Schwark C, Ringleb PA, Schellinger PD, Hacke W (2006) MRI versus CT-based thrombolysis treatment within and beyond the 3 h time window after stroke onset: a cohort study. Lancet Neurol 5:661–667 [DOI] [PubMed] [Google Scholar]
- 60.Schellinger PD, Thomalla G, Fiehler J, Köhrmann M, Molina CA, Neumann-Haefelin T, Ribo M, Singer OC, Zaro-Weber O, Sobesky J (2007) MRI-based and CT-based thrombolytic therapy in acute stroke within and beyond established time windows: an analysis of 1210 patients. Stroke 38:2640–2645 [DOI] [PubMed] [Google Scholar]
- 61.Thomalla G, Schwark C, Sobesky J, Bluhmki E, Fiebach JB, Fiehler J, Zaro Weber O, Kucinski T, Juettler E, Ringleb PA, Zeumer H, Weiller C, Hacke W, Schellinger PD, Röther J (2006) Outcome and symptomatic bleeding complications of intravenous thrombolysis within 6 hours in MRI-selected stroke patients: comparison of a German multicenter study with the pooled data of ATLANTIS, ECASS, and NINDS tPA trials. Stroke 37:852–858 [DOI] [PubMed] [Google Scholar]
- 62.Furlan AJ, Eyding D, Albers GW, Al-Rawi Y, Lees KR, Rowley HA, Sachara C, Soehngen M, Warach S, Hacke W (2006) Dose Escalation of Desmoteplase for Acute Ischemic Stroke (DEDAS): evidence of safety and efficacy 3 to 9 hours after stroke onset. Stroke 37:1227–1231 [DOI] [PubMed] [Google Scholar]
- 63.Hacke W, Albers G, Al-Rawi Y, Bogousslavsky J, Davalos A, Eliasziw M, Fischer M, Furlan A, Kaste M, Lees KR, Soehngen M, Warach S (2005) The Desmoteplase in Acute Ischemic Stroke Trial (DIAS): a phase II MRI-based 9-hour window acute stroke thrombolysis trial with intravenous desmoteplase. Stroke 36:66–73 [DOI] [PubMed] [Google Scholar]
- 64.Albers GW, Thijs VN, Wechsler L, Kemp S, Schlaug G, Skalabrin E, Bammer R, Kakuda W, Lansberg MG, Shuaib A, Coplin W, Hamilton S, Moseley M, Marks MP (2006) Magnetic resonance imaging profiles predict clinical response to early reperfusion: the diffusion and perfusion imaging evaluation for understanding stroke evolution (DEFUSE) study. Ann Neurol 60:508–517 [DOI] [PubMed] [Google Scholar]
- 65.Davis S, Donnan G, Parsons M, Levi C, Butcher K, Peeters A, Barber P, Bladin C, De Silva D, Byrnes G, Chalk J, Fink J, Kimber T, Schultz D, Hand P, Frayne J, Hankey G, Muir K, Gerraty R, Tress B, Desmond P (2008) Effects of alteplase beyond 3 h after stroke in the Echoplanar Imaging Thrombolytic Evaluation Trial (EPITHET): a placebo-controlled randomised trial. Lancet Neurol 7:299–309 [DOI] [PubMed] [Google Scholar]
- 66.Hacke W, Furlan AJ, Al-Rawi Y, Davalos A, Fiebach JB, Gruber F, Kaste M, Lipka LJ, Pedraza S, Ringleb PA, Rowley HA, Schneider D, Schwamm LH, Leal JS, Söhngen M, Teal PA, Wilhelm-Ogunbiyi K, Wintermark M, Warach S (2009) Intravenous desmoteplase in patients with acute ischaemic stroke selected by MRI perfusion–diffusion weighted imaging or perfusion CT (DIAS-2): a prospective, randomised, double-blind, placebo-controlled study. Lancet Neurol 8:141–150 [DOI] [PMC free article] [PubMed] [Google Scholar]
- 67.Schäbitz W-R, Schneider A (2006) Developing granulocyte-colony stimulating factor for the treatment of stroke: current status of clinical trials. Stroke 37:1654. [DOI] [PubMed] [Google Scholar]
- 68.Kane I, Carpenter T, Chappell F, Rivers C, Armitage P, Sandercock P, Wardlaw J (2007) Comparison of 10 different magnetic resonance perfusion imaging processing methods in acute ischemic stroke: effect on lesion size, proportion of patients with diffusion/perfusion mismatch, clinical scores, and radiologic outcomes. Stroke 38:3158–3164 [DOI] [PubMed] [Google Scholar]
- 69.Wintermark M, Albers GW, Alexandrov AV, Alger JR, Bammer R, Baron J-C, Davis S, Demaerschalk BM, Derdeyn CP, Donnan GA, Eastwood JD, Fiebach JB, Fisher M, Furie KL, Goldmakher GV, Hacke W, Kidwell CS, Kloska SP, Köhrmann M, Koroshetz W, Lee T-Y, Lees KR, Lev MH, Liebeskind DS, Ostergaard L, Powers WJ, Provenzale J, Schellinger P, Silbergleit R, Sorensen AG, Wardlaw J, Wu O, Warach S (2008) Acute stroke imaging research roadmap. AJNR 29:e23–e30 [DOI] [PMC free article] [PubMed] [Google Scholar]
- 70.Chalela JA, Kidwell CS, Nentwich LM, Luby M, Butman JA, Demchuk AM, Hill MD, Patronas N, Latour L, Warach S (2007) Magnetic resonance imaging and computed tomography in emergency assessment of patients with suspected acute stroke: a prospective comparison. Lancet 369:293–298 [DOI] [PMC free article] [PubMed] [Google Scholar]
- 71.Tong KA, Ashwal S, Holshouser BA, Shutter LA, Herigault G, Haacke EM, Kido DK (2003) Hemorrhagic shearing lesions in children and adolescents with posttraumatic diffuse axonal injury: improved detection and initial results. Radiology 227:332–339 [DOI] [PubMed] [Google Scholar]
- 72.Jiang Q, Ewing JR, Ding GL, Zhang L, Zhang ZG, Li L, Whitton P, Lu M, Hu J, Li QJ, Knight RA, Chopp M (2005) Quantitative evaluation of BBB permeability after embolic stroke in rat using MRI. J Cereb Blood Flow Metab 25:583–592 [DOI] [PubMed] [Google Scholar]
- 73.Lee J-M, Zhai G, Liu Q, Gonzales ER, Yin K, Yan P, Hsu CY, Vo KD, Lin W (2007) Vascular permeability precedes spontaneous intracerebral hemorrhage in stroke-prone spontaneously hypertensive rats. Stroke 38:3289–3291 [DOI] [PubMed] [Google Scholar]
- 74.Bang OY, Buck BH, Saver JL, Alger JR, Yoon SR, Starkman S, Ovbiagele B, Kim D, Ali LK, Sanossian N, Jahan R, Duckwiler GR, Vinuela F, Salamon N, Villablanca JP, Liebeskind DS (2007) Prediction of hemorrhagic transformation after recanalization therapy using T2*-permeability magnetic resonance imaging. Ann Neurol 62:170–176 [DOI] [PubMed] [Google Scholar]
- 75.Kassner A, Roberts TPL, Moran B, Silver FL, Mikulis DJ (2009) Recombinant tissue plasminogen activator increases blood-brain barrier disruption in acute ischemic stroke: an MR imaging permeability study. AJNR 30:1864–1869 [DOI] [PMC free article] [PubMed] [Google Scholar]
- 76.Kimura K, Iguchi Y, Shibazaki K, Terasawa Y, Inoue T, Uemura J, Aoki J (2008) Large ischemic lesions on diffusion-weighted imaging done before intravenous tissue plasminogen activator thrombolysis predicts a poor outcome in patients with acute stroke. Stroke 39:2388–2391 [DOI] [PubMed] [Google Scholar]
- 77.Marks MP, Olivot J-M, Kemp S, Lansberg MG, Bammer R, Wechsler LR, Albers GW, Thijs V (2008) Patients with acute stroke treated with intravenous tPA 3–6 hours after stroke onset: correlations between MR angiography findings and perfusion- and diffusion-weighted imaging in the DEFUSE study. Radiology 249:614–623 [DOI] [PMC free article] [PubMed] [Google Scholar]
- 78.Kimura K, Iguchi Y, Shibazaki K, Watanabe M, Iwanaga T, Aoki J (2009) M1 susceptibility vessel sign on T2* as a strong predictor for no early recanalization after iv-t-pa in acute ischemic stroke. Stroke 40:3130–3132 [DOI] [PubMed] [Google Scholar]
- 79.Cramer SC, Seitz RJ (2009) Imaging functional recovery from stroke. In: Aminoff MJ, Boller F, Swaab DF (eds) Handbook of clinical neurology. Elsevier, Philadelphia, pp 1011–1019 [DOI] [PubMed] [Google Scholar]
- 80.Cramer SC (2009) Use of imaging in restorative stroke trials. Stroke 40:S28–S29 [DOI] [PubMed] [Google Scholar]
- 81.Stinear CM, Barber PA, Smale PR, Coxon JP, Fleming MK, Byblow WD (2007) Functional potential in chronic stroke patients depends on corticospinal tract integrity. Brain 130:170–180 [DOI] [PubMed] [Google Scholar]
- 82.Carey J, Kimberley T, Lewis S, Auerbach E, Dorsey L, Rundquist P, Ugurbil K (2002) Analysis of fMRI and finger tracking training in subjects with chronic stroke. Brain 125:773–788 [DOI] [PubMed] [Google Scholar]
- 83.Cramer SC, Parrish TB, Levy RM, Stebbins GT, Ruland SD, Lowry DW, Trouard TP, Squire SW, Weinand ME, Savage CR, Wilkinson SB, Juranek J, Leu SY, Himes DM (2007) Predicting functional gains in a stroke trial. Stroke 38:2108–2114 [DOI] [PubMed] [Google Scholar]