Abstract
Smoking is a leading cause of lung cancer, accounting for 81% of lung cancer cases. Tobacco smoke contains over 5000 compounds, of which more than 70 have been classified as human carcinogens. Of the many tobacco smoke constituents, 1,3-butadiene (BD) has a high cancer risk index due to its tumorigenic potency and its abundance in cigarette smoke. The carcinogenicity of BD has been attributed to the formation of several epoxide metabolites, of which 1,2,3,4-diepoxybutane (DEB) is the most toxic and mutagenic. DEB is formed by two oxidation reactions carried out by cytochrome P450 monooxygenases, mainly CYP2E1. Glutathione-S-transferase theta 1 (GSTT1) facilitates the conjugation of DEB to glutathione as the first step of its detoxification and subsequent elimination via the mercapturic acid pathway. Human biomonitoring studies have revealed a strong association between GSTT1 copy number and urinary concentrations of BD-mercapturic acids, suggesting that it plays an important role in the metabolism of BD. To determine the extent that GSTT1 genotype affects the susceptibility of individuals to the toxic and genotoxic properties of DEB, GSTT1 negative and GSTT1 positive HapMap lymphoblastoid cell lines were treated with DEB, and the extent of apoptosis and micronuclei (MN) formation was assessed. These toxicological endpoints were compared to the formation of DEB-GSH conjugates and 1,4-bis-(guan-7-yl)-2,3-butanediol (bis-N7G-BD) DNA-DNA crosslinks. GSTT1 negative cell lines were more sensitive to DEB-induced apoptosis as compared to GSTT1 positive cell lines. Consistent with the protective effect of GSH conjugation against DEB-derived apoptosis, GSTT1 positive cell lines formed significantly more DEB-GSH conjugate than GSTT1 negative cell lines. However, GSTT1 genotype did not affect formation of MN or bis-N7G-BD crosslinks. These results indicate that GSTT1 genotype significantly influences BD metabolism and acute toxicity.
Graphical Abstract
Introduction
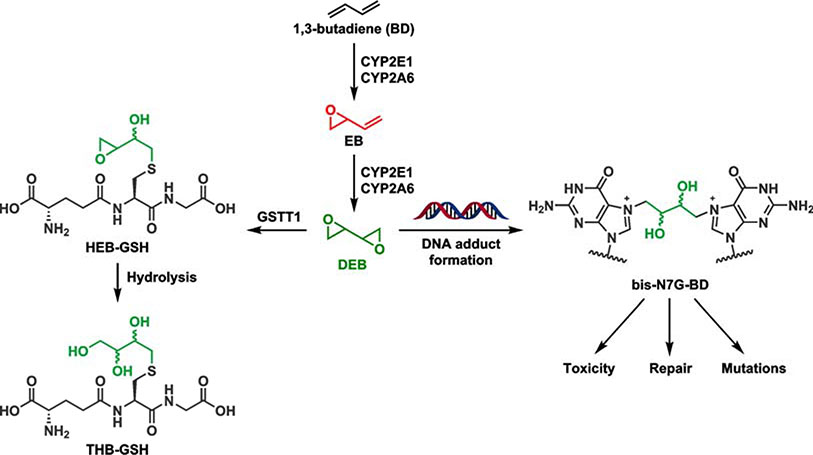
Smoking is a leading cause of lung cancer, accounting for 81% of lung cancer cases.1, 2 Tobacco smoke contains over 5000 compounds, of which more than 70 have been classified as human carcinogens.3, 4 Of the many tobacco smoke constituents, 1,3-butadiene (BD) has a high cancer risk index because of its ability to induce tumors in occupationally exposed workers and laboratory animals.5, 6 BD requires metabolic activation before it exhibits its mutagenic and carcinogenic activity. Metabolic activation of BD involves oxidation by cytochrome P450s, mainly CYP2E1 and CYP2A6, to several epoxide metabolites, 3,4-epoxy-1-butene (EB), 3,4-epoxy-1,2-butanediol (EBD), and 1,2,3,4-diepoxybutane (DEB) (Scheme 1).7–9 DEB is by far the most genotoxic metabolite of BD, leading to chromosomal rearrangements such as sister chromatid exchanges (SCE) and exhibiting up to 200-fold higher mutagenic potency as compared to BD-derived monoepoxides.10, 11 DEB is also the active form of the antitumor drug treosulfan used for the treatment of ovarian cancer in Europe.12–14
Scheme 1.
Metabolism of BD to DEB by GSTT1 and the competing formation of genotoxic bis-N7G-BD crosslinks.
BD and its metabolites, including DEB, are detoxified by conjugation to glutathione (GSH) or hydrolysis by epoxide hydrolase (EPHX1, Scheme 1). The conjugation of GSH to DEB is primarily catalyzed by glutathione S-transferase theta 1 (GSTT1), with other GST enzymes such as glutathione S-transferase mu 1 (GSTM1) having less activity.15 GSH conjugates of EB, EBD, and DEB are further processed by peptidases and acetyltransferase and are ultimately excreted as the corresponding monohydroxy-3-butenyl mercapturic acid (MHBMA), trihydroxy-3-butenyl mercapturic acid (THBMA), and 1,4-bis-(N-acetyl-l-cystein-S-yl)butane-2,3-diol (bis-BDMA), respectively.16, 17 THBMA can also be formed via hydrolysis of the epoxide intermediate that initially forms upon reaction of GSH with DEB.
In human studies, GSTT1 copy number correlates well with urinary levels of EB-mercapturic acid (MHBMA) in urine and explains a large fraction of the ethnic differences in MHBMA excretion, indicating that GSTT1-mediated conjugation with glutathione is a major factor for detoxification of BD-derived EB in humans.18 We recently employed a panel of GSTT1 positive and negative cells to establish the role of GSTT1 in protecting human cells against cytotoxic effects of EB.19 GSTT1 negative cells were more sensitive towards EB and excreted higher levels of EB-GSH conjugates, but contained similar numbers of EB-DNA adducts.19 In contrast, less is known about the role of GSTT1 in glutathione conjugation and elimination of DEB, although several in vitro studies suggested that GSTT1 negative lymphocytes were more sensitive for induction of SCE by DEB (1.5 to 6.0 μM) as compared to GSTT1 wild type.10, 20, 21 Furthermore, GSTT1 and GSTM1 genotypes influenced blood levels of butadiene-hemoglobin adducts.22
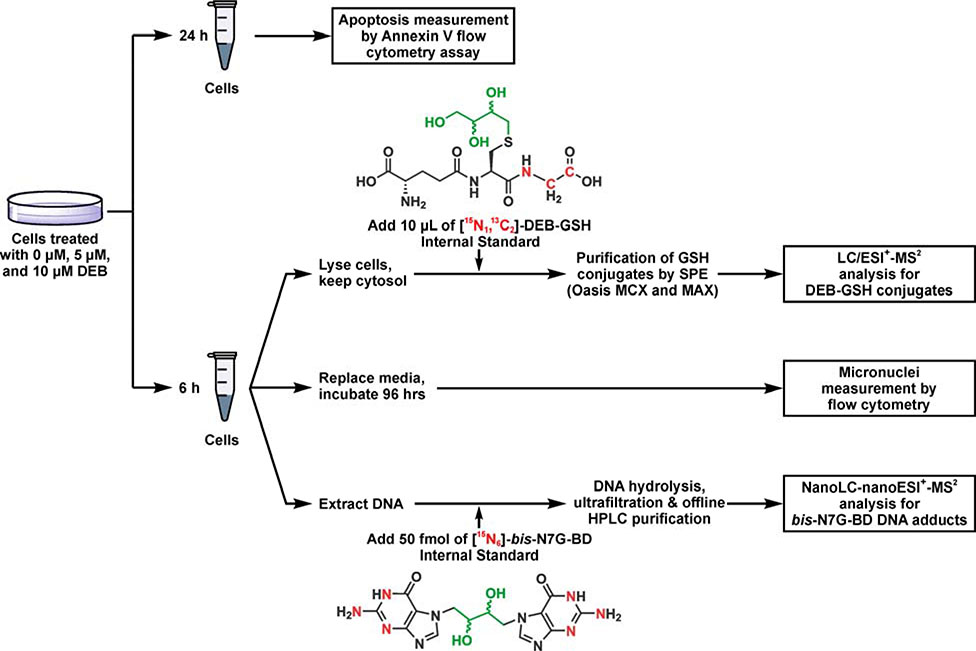
The present study was designed to elucidate the role of the GSTT1 gene in mediating cellular responses to DEB in human cells (Scheme 1). Eight GSTT1 positive cell lines and ten GSTT1 negative cell lines were selected from the human HapMap cell repository (Scheme 2).23 Human cell lines from the HapMap project were derived from various human populations and have been extensively genotyped, permitting us to model the genetic diversity of human populations.23 DEB-induced cytotoxicity and genotoxicity was assessed by measuring apoptosis and micronuclei formation based on flow cytometric methods.24, 25 We hypothesized that cells expressing GSTT1 would be less susceptible to the toxic and genotoxic effects of DEB due to increased detoxification of DEB as a result of increased conjugation to GSH. We expected that the levels of DEB-induced bis-N7G-BD adducts would also be reduced in the GSTT1 expressing cells. To test this hypothesis, a quantitative isotope dilution HPLC-ESI+-MS/MS assay was developed for DEB-GSH conjugates, while DNA adducts were quantified using published methods.26
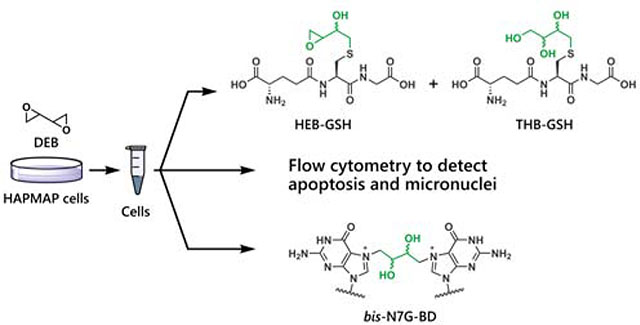
Scheme 2.
Experimental procedure for HPLC-ESI-MS/MS analysis of DEB-GSH conjugates, bis-N7G-BD adducts, and apoptosis in cells exposed to DEB.
Materials and methods
Note: DEB is a known carcinogen and must be handled with adequate safety precautions in a well-ventilated fume hood strictly following its safety data sheet.6
LC-MS grade water and acetonitrile, and HPLC grade methanol were obtained from Fisher Scientific (Pittsburg, PA). [15N13C2-glycine]GSH was obtained from Toronto Research Chemicals (North York, ON, CA). bis-N7G-BD and [15N6]bis-N7G-BD were synthesized in our laboratory as previously described.27, 28 Common chemicals and solvents were obtained from Sigma-Aldrich (St. Louis, MO).
Synthesis of DEB-GSH and DEB-[15N13C2-glycine]GSH standards
S-(1,2,3-trihydroxybutyl)-GSH (THB-GSH).
A solution of glutathione (3.07 mg, 10 μmol, Chem-Impex, Wood Dale, IL) and recombinant human GSTT1 (20 μg, Oxford Biomedical Research, Oxford, MI) in 100 mM sodium phosphate buffer, pH 7.4, (920 μL) was warmed to 37 °C in a silicone oil bath for 5 min. A solution of racemic DEB (15.5 μL, 200 μmol, Alfa Aesar, Haverhill, MA) in 80 μL 100 mM sodium phosphate buffer, pH 7.4, was added and the mixture was incubated at 37 °C without agitation or stirring for up to 2 h. The reaction mixture was then filtered through Nanosep 10K filters (Pall Life Sciences, Port Washington, NY) at 5000 g for 10 min to remove the protein. Boron trifluoride etherate (5 μL, 40.5 μmol) was added to the resulting filtrate and the mixture was gently agitated for 15 min at room temperature in order to fully hydrolyze the epoxide species to THB-GSH. The crude product was concentrated to dryness and reconstituted in 600 μL pure water in preparation for HPLC purification.
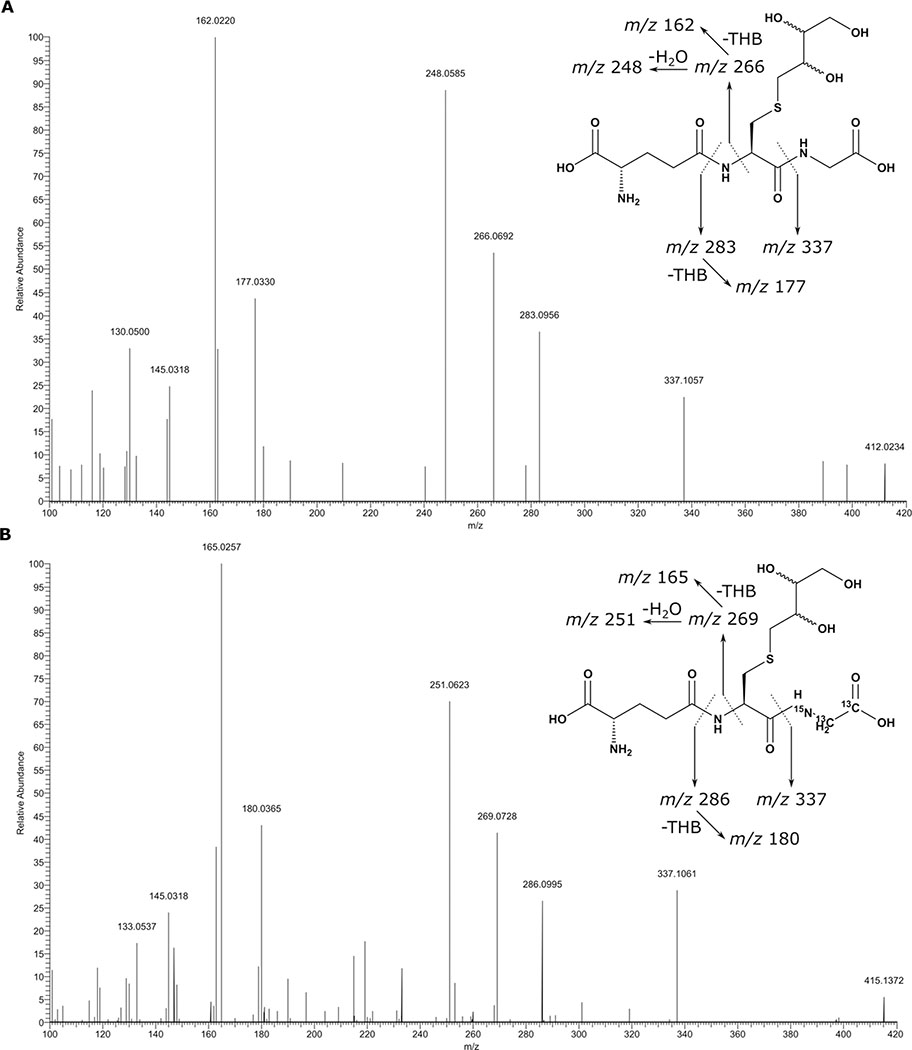
THB-GSH was purified by HPLC using an Agilent 1100 series HPLC system with a UV-Vis variable wavelength detector, monitoring at 215 nm. Solutions of crude product (100 μL injections) were separated on a Hypercarb graphitic carbon column (150 × 4.6 mm, Thermo Fisher Scientific, Waltham, MA) that was eluted with a 5 mM aqueous ammonium formate (solvent A) and acetonitrile (solvent B) gradient at a flow rate of 1.00 mL/min. The gradient started at 1% B, increasing to 10% B over 18 min, followed by a 1 min gradient to 80% B. After 4 min at 80% B, solvent B was returned to 1% B over 5 min. The expected product eluted as a sharp peak at 18.0 min. Fractions containing THB-GSH were combined and concentrated to dryness (0.17 mg, 4%). Synthetic standards were characterized using high resolution mass spectrometry on a Thermo Scientific QExactive Orbitrap instrument. Precursor ions were fragmented with higher order collision-induced dissociation (HCD) at 30.0% energy. ESI+-HRMS/MS THB-GSH: m/z 412.0234 [M + H]+ → 337.1057 [M – Gly]+, 283.0956 [M – Glu + H]+, 266.0692 [M – Gln]+, 248.0585 [M – Gln – OH]+, 177.0330 [M – Glu – THB]+, 162.0220 [M – Gln – THB]+, and 130.0500 [N-acetic acid β-lactam + H] +. The detailed fragmentation scheme is displayed in Figure S1.
THB-GSH was quantified by 1H NMR in 150 μL D2O using a Bruker 600 MHz Avance NEO spectrometer at ambient temperature. A known amount of methanol (0.094 mg, 2.93 μmol) was added to each sample, and the integrated peak area corresponding to the cysteine α H signal was compared to the signal from the methanol CH3. This analysis indicated that the sample contained 0.061 μmol or 25 μg of the conjugate, representing 0.6% isolated yield. High-field 1H and 1H-13C HSQC NMR spectra of THB-GSH were obtained on the same instrument. The spectra are displayed in Figures S2 and S3. THB-GSH: 1H NMR (D2O, 600 MHz): δ 4.48 (t, J = 5.8 Hz, 1H, Cys α), 3.85 (s, 2H, Gly CH2), 3.71 (m, 1H, CH2CHOH), 3.70 (t, J = 6.2 Hz, 1H, Glu α H), 3.64 (dt, J = 7.0, 4.1 Hz, 1H, CHOHCH2OH), 3.61 (dd, J = 11.5, 4.3 Hz, 1H, CH2OH), 3.54 (dd, J = 11.5, 7.0 Hz, 1H, CH2OH), 3.01 (dd, J = 14.1, 5.5 Hz, 1H, Cys CH2), 2.87 (dd, J = 14.0, 8.6 Hz, 1H, Cys CH2), 2.75 (dd, J = 12.5, 4.7 Hz, 1H, SCH2CHOH), 2.67 (dd, J = 12.3, 8.3 Hz, 1H, SCH2CHOH), 2.50 (m, 2H, Glu γ H), and 2.09 (m, 2H, Glu β H) ppm. 13C from HSQC (D2O, 600 MHz): δ 75.9 (CHOHCH2OH), 73.1 (CH2CHOH), 65.7 (CH2OH), 57.0 (Glu α C), 56.4 (Cys α C), 45.1 (Gly CH2), 38.1 (SCH2CHOH), 36.0 (Cys CH2), 34.3 (Glu γ C), and 28.8 (Glu β C) ppm.
S-(2-hydroxy-3,4-epoxybutyl)-GSH (HEB-GSH) and [15N,13C2-glycine]DEB-GSH
The epoxide ring-closed HEB-GSH conjugate was synthesized by base-catalyzed nucleophilic epoxide ring opening as described previously.15 [15N,13C2-glycine]DEB-GSH conjugates for use as internal standards were analogously synthesized starting with [15N,13C2-glycine]GSH (Cambridge Isotope Laboratories, Inc, Tewksbury, MA). [15N,13C2-glycine]DEB-GSH conjugate internal standards were purified by HPLC, and their identity confirmed by LC-MS. DEB-GSH was quantified by LC-MS/MS using HEB-GSH as a reference. A stock solution of [15N13C2-glycine]DEB-GSH was stored at −20 °C and used as an internal standard for all HPLC-ESI+-MS/MS analyses of DEB-GSH. ESI+-HRMS/MS [15N,13C2-glycine]THB-GSH: m/z 415.1372 [M + H]+ → 337.1061 [M – 15N,13C2-Gly]+, 286.0995 [M – Glu + H]+, 269.0728 [M – Gln]+, 251.0623 [M – Gln – OH]+, 180.0365 [M – Glu – THB]+, 165.0257 [M – Gln – THB]+, 133.0537 [N-acetic acid β-lactam + H] +. ESI+-HRMS/MS [15N,13C2-glycine]HEB-GSH: m/z 397.1678 [M + H]+, 148.0645 [M – S-HEB – Glu]+. The detailed fragmentation scheme is displayed in Figure S4.
Cell lines
Human-derived B-lymphoblastoid cells from the HapMap project were obtained from the NIGMS Human Genetic Cell Repository at the Coriell Institute for Medical Research (Camden, NJ). Based on previously reported GSTT1 genotype,29 18 human HapMap cell lines were selected; ten cell lines had a GSTT1 negative genotype (GSTT1−/−: GM10851, GM10861, GM18517, GM18508, GM18872, GM12874, GM18912, GM19139, GM18870, and GM19128), and eight had a GSTT1 positive genotype (GSTT1+/−: GM19211, GM12812, GM12145, GM18516, and GM10860; GSTT1+/+: GM12155, GM19200, and GM19130) (Table S1). Cells were cultured in Gibco RPMI 1640 Medium (Thermo Fisher Scientific, Waltham, MA) supplemented with 15% heat inactivated fetal bovine serum (GIBCO, Thermo Fisher Scientific, Waltham, MA) at 37 °C in 5% CO2 humidified atmosphere. All experiments were performed with cells at low passage number (<10).
Confirmation of GSTT1 mRNA expression in HapMap cell lines
The expression of GSTT1 in HapMap cell lines was established at the transcript level by quantitative real time (RT) PCR. A RNeasy plus kit (Qiagen, Hilden, Germany) was used to isolate RNA from the cell lines using the manufacturer’s protocol. One μg RNA was used to synthesize cDNA employing a RevertAid First Strand cDNA Synthesis Kit (Thermo Fisher Scientific, Waltham, MA) according to the manufacturer’s protocol. Real time PCR reaction was carried out for GSTT1 and housekeeping control GAPDH using a Prime PCR assay (Bio-Rad Laboratories, Hercules, CA) with 250 ng of cDNA as the template. GSTT1 expression was expressed as fold change relative to GAPDH.
Confirmation of GSTT1 protein expression in HapMap cell lines
GSTT1 protein expression was confirmed by immunoblot analysis as described previously.19 Ten million cells were lysed in 500 μL RIPA buffer (Thermo Fisher Scientific, Waltham, MA) and centrifuged at 13000 x g for 15 min at 4 °C to remove cell debris. The protein concentration of the supernatants was determined with a BCA protein assay kit (Thermo Fisher Scientific, Waltham, MA). Equal amounts of protein (100 μg) were separated on 10% SDS-polyacrylamide gels and transferred to polyvinylidene fluoride (PVDF) membranes (MilliporeSigma, Burlington, MA). GSTT1 was visualized using an anti-GSTT1 antibody (ABS1653, Sigma-Aldrich, St Louis MO) and the signal intensity was normalized to vinculin, which was visualized with an anti-vinculin antibody (SAB 1404522, Sigma-Aldrich St Louis MO). A representative immunoblot is displayed in Figure S5.
Apoptosis
Ten GSTT1 negative and 8 GSTT1 positive lymphocyte cell lines (0.5 million cells) were seeded in 4 mL media in 6 well plates. After 24 h, the cells were treated with 0, 5 or 10 μM DEB in triplicate for 24 h. Each experimental condition was performed in triplicate. The cell pellets were then collected by centrifugation and stained with allophycocyanin (APC) labeled annexin-V and propidium iodide (PI) per the manufacturer’s guidelines (eBiosciences, San Diego, CA). Annexin-V binds specifically to phosphatidylserine that is translocated to the extracellular membrane only upon initiation of apoptosis. The cell population was then analyzed for percentage of cells in healthy and apoptotic phase on a LSR II 4760 flow cytometer (Becton Dickinson, Franklin Lakes, NJ) using FACSDiva and Flowjo software (Becton Dickinson, Franklin Lakes, NJ). Representative flow cytometry plots are shown in Figure S 10.
Micronuclei (MN) Formation
Ten GSTT1 negative and 8 GSTT1 positive lymphocyte cell lines were seeded with 0.5 million cells in 4 ml media. After 24 h, the cells were treated with 0, 5, or 10 μM DEB in triplicate for 6 h, after which the cells were collected by centrifugation and resuspended in fresh media. After 96 h, the cells were collected by centrifugation for MN analysis using the Litron Microflow micronucleus analysis kit (Litron, Rochester, New York) per the manufacturer’s guidelines. The cell population was then analyzed for MN formation on a LSR II 4760 flow cytometer (Becton Dickinson, Franklin Lakes, NJ) using FACSDiva and Flowjo software (Becton Dickinson, Franklin Lakes, NJ). Representative flow cytometry plots are shown in Figure S7.
GSH conjugates and DNA adduct formation
Ten GSTT1 negative and eight GSTT1 positive lymphocyte cell lines (5 million cells) were seeded in 9 mL media in T25 flasks. After 24 h, they were treated with 0 or 5 μM DEB in triplicate for 6 h and the media was removed. Cells were washed twice with PBS and stored at −80 °C until quantitation of intracellular DEB-GSH and bis-N7G-BD as described below.
Quantitation of intracellular DEB-GSH by capillary HPLC-ESI+-MS/MS
DEB-GSH was quantified in cell pellets using isotope dilution HPLC-ESI-MS/MS. To extract the DEB-GSH conjugates, cell pellets (approximately 50 μL) were thawed and diluted with ice-cold 50% methanol/0.2% formic acid (FA) to a final volume of 300 μL. An aliquot (10 μl) was removed to determine protein concentration based on UV absorbance at 280 nm by nanodrop (ThermoFisher). The [15N13C2-glycine]DEB-GSH internal standard (6270 fmol/sample) was added, and the cellular debris and DNA were precipitated by adding 1050 μl ice-cold acetonitrile/0.2% FA. After 30 min at 4 °C, the samples were centrifuged at 13,000 g for 10 min at 4 °C. The supernatants (1 ml) were transferred to clean 2 mL tubes and used for quantitation of DEB-GSH. The remaining pellet was stored at −20°C for DNA isolation.
When analyzing large numbers of samples, we found that sample cleanup by SPE was necessary in order to preserve HPLC column integrity. Therefore, all samples were further purified by sequential MCX and MAX SPE as described previously.19 During the MCX and MAX SPE steps, HEB-GSH undergoes spontaneous hydrolysis to THB-GSH (Scheme 1). Therefore, THB-GSH detected in the SPE purified samples represents the sum of HEB-GSH and THB-GSH present in the cells and will hereafter be referred to as DEB-GSH.
The samples were reconstituted in 150 μl water for HPLC-ESI+-MS/MS analyses using a Dionex LC system interfaced with a TSQ Quantiva instrument (Thermo Fisher Scientific, Waltham, MA, USA). The mixtures (1 μL) were separated on a Hypercarb capillary LC column (0.5 × 100 mm, Thermo Fisher Scientific, Waltham, MA, USA) eluting with 5 mM ammonium formate (pH 5) in LCMS grade water (solvent A) and LCMS grade acetonitrile (solvent B) with a flow rate of 20 μL/min. The column temperature was maintained at 60 °C. Initial conditions were 99% A, 1%B. The percentage of B was increased to 10% over 18 min and then to 80% B in 1 min. The solvent composition was held at 20%A, 80% B for 4 min before the column was re-equilibrated for 4 min at 99% A,1% B. The column effluent was diverted to waste for the first 2 min of the gradient. The retention times for the two resolved HEB-GSH isomers were between 7.4 to 8.2 min, and the mixture of the THB-GSH isomers eluted between 15 and 15.5 min. The TSQ Quantiva triple quadrupole mass spectrometer was operated in the positive ion mode using Ar as a collision gas (1.5 mTorr). The MS parameters were optimized upon infusion of authentic DEB-GSH solution to achieve maximum sensitivity. The spray voltage was 2.9 kV, capillary temperature was of 400 °C, and collision energy was 10.25 V for all transitions. The peak width for Q1 and Q3 was 0.7 amu. Quantitative analyses were conducted using selected reaction monitoring (SRM) mode, monitoring the MS/MS transitions of m/z 394.2 → m/z 145.1 and m/z 274.1 for HEB-GSH and m/z 412.2 → m/z 162.2 and m/z 283.1 for THB-GSH. The corresponding transitions for the 15N1,13C2 isotopically labeled internal standard were m/z 397.2 → m/z 148.1 and m/z 277.1 and m/z 415.2 → m/z 165.0 and m/z 286.1 for [15N13C2-glycine]HEB-GSH and [15N13C2-glycine]THB-GSH, respectively. The first transition was used for quantitation, and the second transition was employed for verification. The formation of HEB-GSH and THB-GSH was determined based on the peak area of the analyte over the peak area of the internal standard multiplied by the amount of internal standard added and expressed as fmol/per mg protein.30 DEB-GSH refers to the sum of HEB-GSH and THB-GSH detected in the sample.
Quantitation of bisN7G-BD by nanoLC-nanoESI+-MS/MS
Genomic DNA was isolated from the cellular pellets (see above) using a Gentra Puregene kit (Qiagen, Germantown, MD) according to the manufacturer’s instructions. To quantify bis-N7G-BD crosslinks, DNA samples (40 μg) were spiked with [15N6]bis-N7G-BD internal standard (25 fmol). Samples were incubated at 70 °C for 1 h to release the free base conjugate bis-N7G-BD from the DNA backbone. DNA was removed with ultrafiltration. bis-N7G-BD and [15N6]bis-N7G-BD were purified by offline HPLC as previously described.22 HPLC fractions containing bis-N7G-BD and [15N6]bis-N7G-BD were dried under vacuum, reconstituted in 12 μL of water and analyzed by nanoLC-ESI+-MS/MS as previously described.31 Quantitative analysis was performed in selected reaction monitoring (SRM) mode by following the MS/MS transitions for bis-N7G-BD of m/z 389.1 [M + H]+ → m/z 238.0 [M + H−Gua]+ and m/z 389.1 [M + H]+ → m/z 152.1 [Gua + H]+. The MS/MS transitions for [15N6]bis-7NG-BD were m/z 395.1 [15N6-M + H]+ → m/z 241.0 [M + H−[15N3-Gua]+ and m/z 395.1 [15N6-M + H]+ → m/z 155.1 [15N3-Gua + H]+. The first transition was used for quantitation, and the second transition was employed for verification. Quantitation of bis-N7G-BD was conducted using nanoLC-ESI+-MS/MS peak areas from the extracted ion chromatograms corresponding to the analyte (m/z 389.1 → m/z 238.0) and internal standard (m/z 395.1 → m/z 241.0) and using calibration curves prepared with authentic bis-N7G-BD and [15N6]bis-N7G-BD standards as previously described.31 Adduct levels were normalized to the dG concentrations in the DNA hydrolysates as determined by HPLC-UV analysis.32
Statistical Analysis
Correlation between the amounts of DEB-GSH conjugates and bis-N7G-BD control subtracted values versus apoptosis or MN at 5 μM dose was computed using Pearson’s product moment correlation coefficient.33 Statistics were computed in Excel or R (v3.5.3) using Welch’s t-tests to compute individual tests of significance and the anova function for analysis of variance (ANOVA).34 Assumptions of normality and homogeneity of variances were calculated using the Shapiro-Wilkes test and the Bartlett tests, respectively.35, 36
Results
Confirmation of GSTT1 expression in HapMap cells at the transcript and protein level
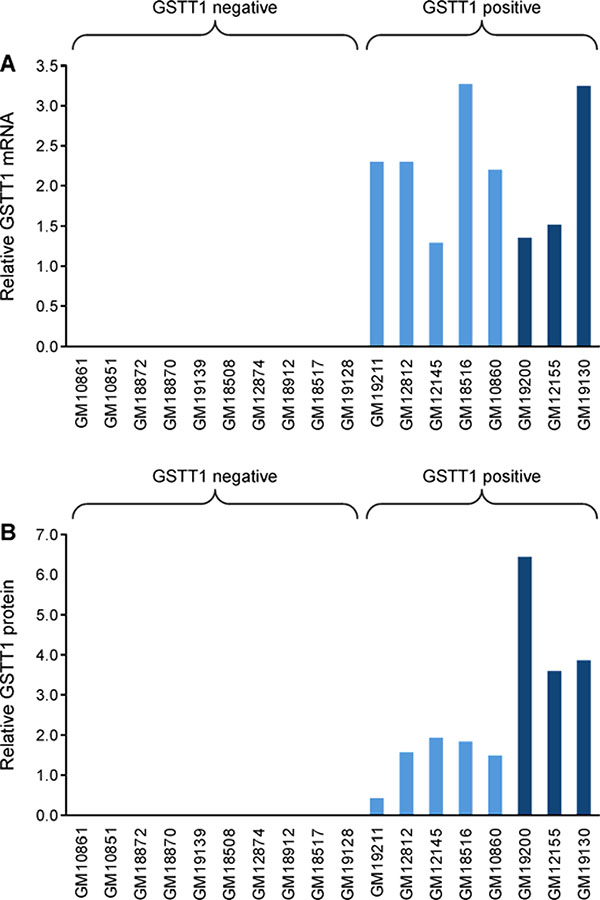
GSTT1 expression levels in 18 HapMap lymphoblastoid cell lines were confirmed by RT-PCR analysis, and GSTT1 protein expression was confirmed by immunoblot analysis. GSTT1 expression at the transcript and protein level was as expected for all 18 cell lines, with GSTT1 mRNA and GSTT1 protein being only detected in GSTT1 positive cells and not in GSTT1 negative cell lines (Figure 1).29
Figure 1.
GSTT1 gene expression in HapMap cells. A: Expression of GSTT1 transcript in selected HapMap cell lines, confirmed by qualitative RT PCR. B: Expression of GSTT1 protein in selected HapMap cell lines, confirmed by immunoblot. Signal intensity normalized to vinculin signal. A representative immunoblot of GSTT1 protein is displayed in Figure S5. Cell lines are color coded based on GSTT1 genotype, null, heterozygote (light blue) and homozygote (dark blue), and organized based on DEB-induced apoptosis after 10 μM treatment (Figure 2).
Effect of DEB treatment on cell viability, apoptosis and MN formation in HapMap cell lines.
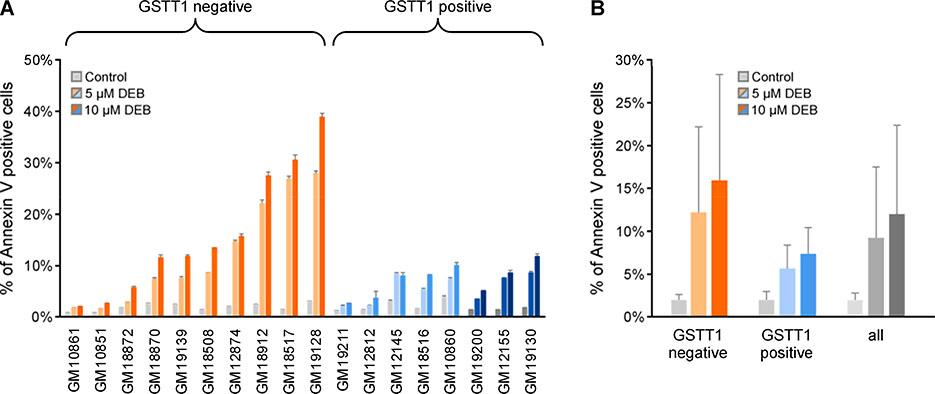
Preliminary studies using CellTiter Glo were performed to develop dose response curves for DEB-induced cytotoxicity. Cell Titer Glo measures cellular ATP levels and DEB-induced cytotoxicity. IC50 values varied between 2 to 6 μM, with no apparent impact of GSTT1 genotype on this toxic endpoint (Figure S8). In addition, DEB exposure triggered an increase in the percentage of Annexin V-labeled cells (Anova, p < 0.001), with GSTT1 negative cell lines displaying increased sensitivity to DEB-induced apoptosis as compared to GSTT1 positive cell lines (Figure 2, Tables S2–S4). This difference was borderline significant when analyzed using Welch’s t-test (p = 0.060). However, ANOVA analysis determined that GSTT1 genotype significantly influenced DEB-induced apoptosis (p = 0.008) (Table S5). There was no significant effect of GSTM1 genotype on the apoptosis endpoint (Table S5).
Figure 2.
Apoptosis measurement in HapMap cell lines upon DEB treatment: Eighteen lymphoblastoid cell lines were treated with 0, 5 or 10 μM DEB for 24 h. The percent of apoptotic cells were determined based on Annexin V marker expression on the cell surface. Representative flow cytometry plots are displayed in Figure S6 and the percent of cells in early versus late apoptosis are displayed in Tables S2–4. A. Percentage of Annexin V positive cells in 18 HapMap cell lines after 24 h of 5 and 10 μM DEB treatment. B. Comparison of the extent of apoptosis in GSTT1 negative and positive cell lines (mean ± SD). In each cell line, DEB treatment significantly increased the apoptotic index (Welch’s t-test p<0.001). The influence of GSTT1 genotype on the apoptotic index was borderline significant when analyzed using Welch’s t-test (p = 0.060) and significant by ANOVA analysis (p = 0.008). Cell lines are color coded based on GSTT1 genotype, null (orange), heterozygote (light blue) and homozygote (dark blue), and sorted based on DEB-induced apoptosis after 10 μM treatment. Gray bars indicate control cell lines and light and dark shades of orange or blue indicate 5 or 10 μM DEB treatment, respectively.
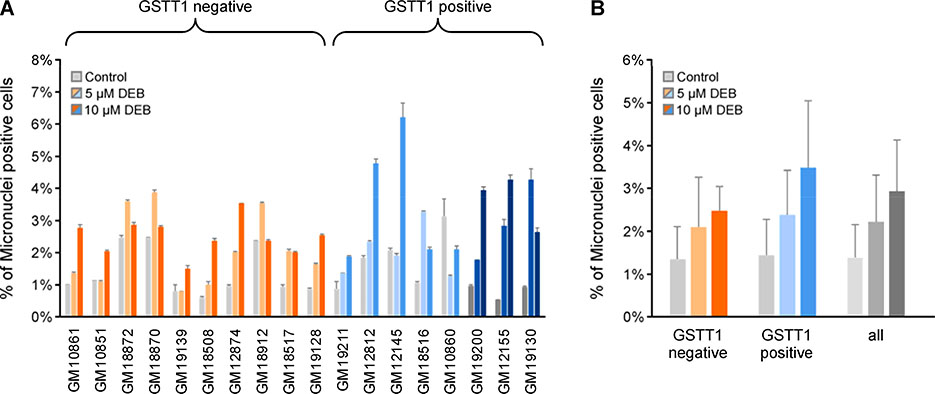
We chose MN formation as a biomarker for DEB-induced genotoxicity. Generally, there was a variety of different responses to DEB, depending on the cell line (Figure 3A). In all cases, there was a significant increase in MN formation at one or both concentrations of DEB. When the response was averaged over all the cell lines, the mean percent of MN positive cells significantly increased by 1.8 and 2.4-fold after treatment with 5 and 10 μM DEB, respectively (Welch’s t-test, p = 0.013 and p = 8.5 × 10⁻⁵), confirming DEB’s known genotoxicity.11, 37 While GSTT1 positive cell lines were slightly more susceptible to the genotoxic effects of DEB (GSTT1 positive: 3.4 ± 1.5%; GSTT negative: 2.5% ± 0.6%; Figure 3B), this difference was not statistically significant (Welch’s t-test p = 0.595 and p = 0.119 at 5 or 10 μM DEB, respectively, Table S5). GSTM1 genotype had no effect on the increase in MN formation caused by DEB treatment (Table S5).
Figure 3.
Micronuclei measurement in HapMap cell lines upon DEB treatment: Eighteen lymphoblastoid cells were exposed to 0, 5 and 10 μM DEB for 6 h in triplicate. The cells were collected by centrifugation and then incubated in fresh media for an additional 96 h. The number of MN were determined with a Litron Microflow micronucleus analysis kit coupled with flow cytometry. Representative flow cytometry plots are displayed in Figure S7. A. Percentage of MN in 18 HapMap cell lines after DEB treatment. B. Comparison of MN formation in GSTT1 negative and positive cell lines (mean ± SD). DEB significantly increased the number of MN (p < 0.05 by Welch’s t-test and p < 0.001 by Anova analysis). GSTT1 genotype had no effect on the number of DEB-induced MN. Cell lines are color coded based on GSTT1 genotype, null (orange), heterozygote (light blue) and homozygote (dark blue), and organized based on DEB-induced apoptosis after 10 μM treatment (Figure 2). Gray bars indicate control cell lines and light and dark shades of orange or blue indicate 5 or 10 μM DEB treatment, respectively.
Structural Characterization of DEB-GSH conjugates
The DEB-GSH conjugate standards synthesized in our laboratory were characterized by high resolution ESI+ mass spectrometry, with HEB-GSH yielding a molecular ion at m/z 394.1283 (predicted m/z 394.1279, M+H) and THB-GSH generating a molecular ion at m/z 412.1324 (predicted m/z 412.1384, M+H). The MS/MS spectrum for THB-GSH produced fragment ions consistent with the proposed structure (Figure 4A, Figure S1). [15N,13C2-glycine]THB-GSH showed an identical fragmentation pattern and MS/MS fragments retaining the [15N,13C2-glycine] group had the expected +2.9956 mass shift indicating the presence of the 15N,13C2 isotope labels (Figure 4B, Figure S1). Based on this data, the MS/MS transition of m/z 412.2 to m/z 162.2 for THB-GSH and m/z 415.2 to m/z 165.2 for [15N,13C2-glycine]THB-GSH were used to quantify THB-GSH. This transition results from the loss of amino pyroglutamate followed by loss of the THB moiety (Figure S1). Additional SRM transitions m/z 412.2 to m/z 283.1 for THB-GSH and m/z 415.2 to m/z 286.1 for [15N,13C2-glycine]THB-GSH were used to verify the structure. This characteristic neutral loss of m/z 129 is the loss of pyroglutamate. The ion transition of m/z 394.2 to m/z 145.1 for HEB-GSH and m/z 397.2 to m/z 148.1 [15N,13C2-glycine]HEB-GSH were used to quantify HEB-GSH. This transition results from the loss of 3,4-epoxybutane-1-thiol and pyroglutamate (Figure S5). HEB-GSH was verified using additional reporter ions m/z 394.2 to m/z 274.1 for HEB-GSH and m/z 397.2 to m/z 277.1 for [15N,13C2-glycine]HEB-GSH. This transition is the loss of 3,4-epoxybutane-1-thiol.
Figure 4.
High resolution MS/MS spectra of (A) THB-GSH and (B) [15N13C2-glycine]THB-GSH internal standard. Spectra were collected in positive ion mode using a Thermo Scientific QExactive Orbitrap instrument. Precursor ions were fragmented with Higher order Collision-induced Dissociation (HCD) at 30.0% energy.
High-field 1H and 1H-13C HSQC NMR experiments were performed to confirm the structures of the synthesized DEB-GSH conjugates (Figures S2 and S3). Peaks characteristic of glutathione in each spectrum indicate the presence of the cysteinyl, glutamyl, and glycinyl moieties in the conjugates. Additional signals corresponding to the 2,3,4-trihydroxybut-1-yl (THB) adduct moiety were also observed, confirming the structure of THB-GSH. NMR spectra of HEB-GSH conformed with previously reported spectra.15
The addition of the THB moiety to GSH adds four additional sets of multiplets, which are assigned by analysis of the 1H-13C HSQC spectrum. Sets of doublets of doublets (dd) in the range of 3.05 – 2.60 ppm in the 1H spectrum correlate with carbons resonating at 38.1 and 36.0 ppm corresponding to methylene groups on either side of the cysteinyl sulfur atom. The pair of dd between 2.77 – 2.62 ppm is assigned to the methylene hydrogens on the THB moiety (SCH2CHOH). The multiplet centered at 3.71 ppm has cross-peaks with the 13C signals at 73.1 and 57.0 ppm, indicating that there is a 1H signal occluded by the glutamic acid α hydrogen, which is assigned to the proximal 2-position methine of THB. Similarly, the distal 3-position THB methine 1H signal at 3.64 ppm has cross-peaks with 75.9 ppm. Carbons bearing hydroxyl groups commonly resonate in the range of 50–70 ppm, with polyol carbons being even further downfield due to the electron-withdrawing effect of neighboring hydroxyl groups. The distal methine is reported as a doublet of triplets (dt) with J = 7.0 and 4.1 Hz, where the triplet splitting pattern likely results from J coupling value degeneracy between methine hydrogens and one of the diastereomeric hydrogens on the neighboring methylene. The terminal methylene of the THB moiety is reported as a pair of dd (J = 11.5, 7.0 Hz and J = 11.5, 4.3 Hz, resulting from THB-GSH diastereomers) between 3.62 – 3.52 ppm, with cross-peaks at 65.7 ppm. Characteristic carbon shifts along with J value analysis between non-overlapping THB signals all provide evidence for the expected structure of THB-GSH.
Development of HPLC-ESI-MS/MS method for detection of DEB-GSH
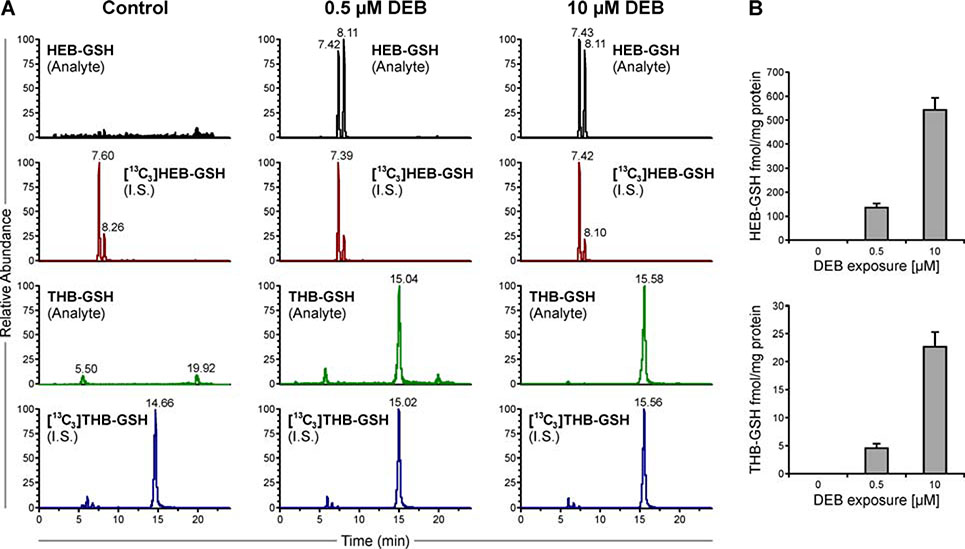
In order to determine the amount of DEB that undergoes conjugation with GSH in GSTT1 positive and GSTT1 negative human cells, a quantitative stable isotope dilution HPLC-ESI-MS/MS method for HEB-GSH and THB-GSH was developed. While reverse phase HPLC stationary phases were found to be unsuitable to retain DEB-GSH conjugates, HyperCarb porous graphitic carbon columns showed excellent retention and elution characteristics for both analytes (Figure 5A). In our initial experiments, a simple cell lysis and protein crash method was employed for sample preparation.38 The amounts of HEB-GSH and THB-GSH in DEB-treated cells increased in a concentration dependent manner (Figure 5B). Preliminary experiments with HapMap cell line (GM18912) revealed that the HEB-GSH to THB-GSH ratio was 27:1, suggesting that in cells, the majority of DEB-GSH conjugates retained the epoxide group (Figure 5B).
Figure 5.
A. Representative ion chromatograms for HEB-GSH, [13C3]HEB-GSH, THB-GSH and [13C3]THB-GSH in cell pellets from cells treated with 0, 0.5, or 5.0 μM DEB for 6 h. B. The levels of HEB-GSH (top) and THB-GSH (bottom) observed in one cell line (n=3) (mean ± SD).
In order to improve method robustness and reproducibility, an additional SPE cleanup step was added for the subsequent experiments with 18 HapMap cell lines. The SPE procedure is similar to our previously published method for EB-GSH.19 As GSH is positively charged under acidic conditions and is negatively charged at high pH, a two-step SPE method was devised. Cell extracts were first acidified and subjected to mixed-mode strong cation exchange SPE to remove salts, neutrals, and negatively charged compounds. The resulting eluent was concentrated to dryness, reconstituted in a basic solution, and subjected to mixed-mode strong anion exchange SPE in order to remove any contaminants that cannot hold a negative charge. The resulting samples were clean enough for direct quantitation by capillary HPLC-ESI-MS/MS. During the SPE steps, HEB-GSH was hydrolytically converted to THB-GSH, which was quantified and therefore represents the sum of both DEB-GSH conjugates.
Formation of DEB-GSH in HapMap cells
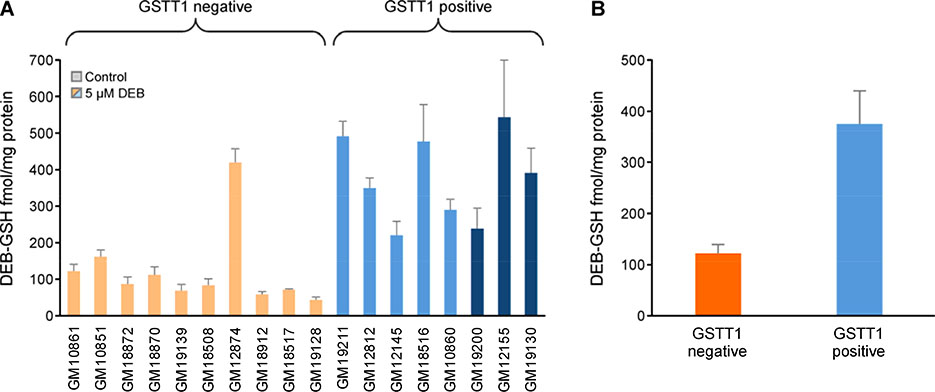
The new isotope dilution HPLC-ESI-MS/MS method was used to quantify DEB-GSH conjugates in GSTT1 negative HapMap cell lines (N = 10) and GSTT1 positive HapMap cell lines (N = 8) that had been treated with 5 μM DEB for 6 h (Figure 6). The amounts of DEB-GSH in DEB-treated cells varied 12-fold (44 to 543 fmol/ mg protein). No DEB-GSH was observed in the control cells (data not shown). Overall, the mean levels of DEB-GSH were significantly higher in GSTT1 positive cell lines as compared to GSTT1 negative cell lines (Figure 6B, GSTT1 positive cells: 375.1 ± 64.6 fmol/mg protein and GSTT1 negative cells: 122.0 ±17.5 fmol/mg protein, Welch’s t-test p < 0.0004), suggesting that GSTT1 activity is important in detoxification of DEB via GSH conjugation as the first step of the mercapturic acid pathway. Since the DEB-GSH were lower in the GSTM1 positive cells as compared to the GSTM1 negative cell lines (GSTM1 positive cells: 171.39 ± 33.9 fmol/mg protein and GSTM1 negative 297.6 ±42.9 fmol/mg protein, Welch’s t-test p =0.037), the formation of DEB-GSH is not catalyzed by this protein; the observed difference is likely driven by GSTT1 genotype since GSTM1 negative cell lines with elevated DEB-GSH values are GSTT1 positive.
Figure 6.
A. Levels of DEB-GSH conjugates in GSTT1 negative and GSTT1 positive cell lines. B. Comparison of DEB-GSH conjugates in GSTT1 negative and positive cell lines (mean ± SD). Eighteen lymphoblastoid cell lines (5 million cells) were treated with 5 μM DEB for 6 h in triplicate. Cellular DEB-GSH (HEB-GSH plus THB-GSH) conjugates levels were quantified by capillary HPLC-ESI-MS/MS. * GSTT1 positive cells form significantly greater amounts of DEB-GSH than the GSTT positive cells (Welch’s t-test, p <0.001). Cell lines are color coded based on GSTT1 genotype, null (orange), heterozygote (light blue) and homozygote (dark blue), and organized based on DEB-induced apoptosis after 10 μM treatment (Figure 2). Control cell lines grown in DEB-free media did not show any DEB-conjugate and are not shown.
Quantification of bis-N7G-BD
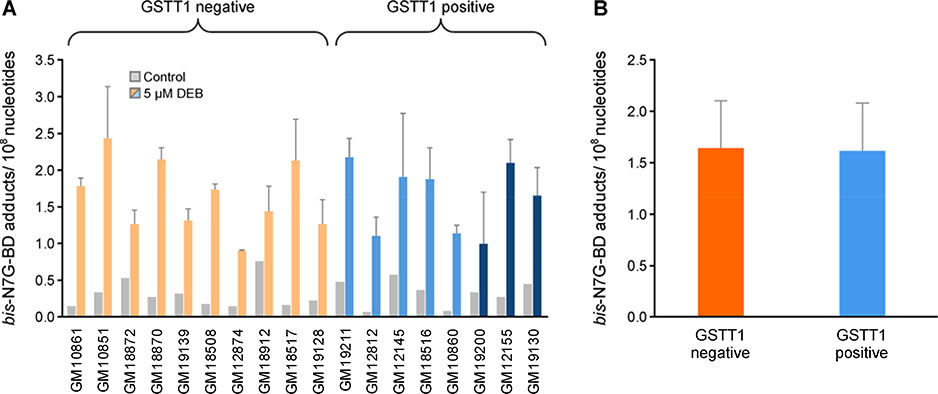
To examine the effects of GSTT1 genotype on formation of DEB-DNA adducts in HAPMAP cells, bis-N7G-BD levels were quantified in genomic DNA of GSTT1 positive and negative cells after a 6 h treatment with 5 μM DEB. Bis-N7G-BD was selected for these analyses because it is considered the major genotoxic DNA lesion derived from DEB;9, 39 it crosslinks the opposite strands of DNA in the 5’-GNC-3’ sequence context40 and the resulting interstrand crosslinks block DNA replication and transcription.41 Quantitative analyses were conducted by isotope dilution nanoLC-ESI+-MS/MS using previously reported methodologies.31 Treatment with 5 μM DEB significantly increased bis-N7G-BD crosslink concentrations in all cell lines (Welch’s test p<0.001). Depending on cell line, DNA adduct levels after DEB treatment varied between 0.9 and 2.43 adducts per 108 nucleotides (Figure 7A). Control cells and DEB treated cells had mean levels of 0.32 ± 0.19 and 1.63 ± 0.47 bis-N7G BD adducts per 108 nucleotides, respectively (Figure 7A). The genotype did not influence the formation of bis-N7G BD crosslinks (Welch’s t-test p = 0.807 and 0.836 for control and treated cells, respectively) (Figure 7B). There was no significant effect of GSTM1 genotype on the formation of this adduct (Table S5).
Figure 7.
A. Levels of bis-N7G-BD adducts in GSTT1 negative and GSTT1 positive cell lines. B. Comparison of bis-N7G-BD adduct levels in GSTT1 negative and positive cell lines treated with DEB (mean ± SD). Eighteen lymphoblastoid cell lines (3 million cells) were treated with 0 or 5 μM DEB for 6 h in triplicate. DNA was extracted and bis-N7G-BD adduct levels were quantified by nanoLC-MS/MS. Cell lines are color coded based on GSTT1 genotype, null (orange), heterozygote (light blue) and homozygote (dark blue), and organized based on DEB-induced apoptosis after 10 μM treatment (Figure 2). Gray bars indicate contro cell lines and light and dark shades of orange or blue indicate 5 or 10 μM DEB treatment, respectively.
Discussion
BD toxicity and carcinogenicity is mediated by several epoxide metabolites. Of the BD derived epoxides, DEB is the most toxic and mutagenic, with typical IC50 values in mammalian cell lines between 10–50 μM.9, 42–48 For example, a recent study by Walker and colleagues showed a linear dose-response for DEB-induced cytotoxicity in HL-60, a human pre-myeloid leukemia cell line.10, 11 BD-derived epoxides, including DEB, are detoxified by hydrolysis to corresponding diols and conjugation with glutathione, which is catalyzed by GSTT1 and, to a lesser extent, by GSTM1. In several independent studies, the mean frequency of SCE in whole-blood lymphocyte cultures treated with DEB were about twice as high among the GSTT1 negative donors as compared with the GSTT1 positive donors.10, 20, 21, 49–51 Molecular epidemiology studies of BD-mercapturic acids in urine, discussed above, also identified GSTT1 as the main enzyme responsible for conjugation of BD epoxides to glutathione that could explain a large fraction of inter-individual variability in response to BD.52–54
We set out to specifically investigate the role of GSTT1 genotype on the detoxification of DEB, on the cellular level. HapMap cells with GSTT1 positive genotype were expected to be more efficient in conjugating DEB to GSH, leading to decreased cytotoxicity and genotoxicity upon DEB treatment. To test this hypothesis, a panel of 18 human EBV-transformed lymphoblastoid cell lines were selected from the HAPMAP biorepository.23 Effects of DEB were assessed on apoptosis as a biomarker for acute toxicity and MN as a genotoxic endpoint. Biological and toxicological endpoints were compared to mechanistic endpoints, DEB-GSH conjugates and DEB-induced DNA cross-links (bis-N7G-BD). DEB-GSH conjugates were utilized as biomarker for detoxification of DEB and bis-N7G-BD as biomarker for genotoxicity.
The apoptotic responses of the 18 HAPMAP cell lines to DEB treatment suggested a protective effect of GSTT1 genotype, with GSTT1 positive cell lines being more resistant towards DEB-induced apoptosis (Figure 2). Our results are in agreement with previous reports using whole-blood lymphocytes emphasizing the protective effects or GSTT1 genotype.10, 20, 21, 49–51 The wide variation in sensitivity of the GSTT1 negative cell lines to the apoptotic effects of DEB indicates that other factors are also contributing to the sensitivity of these cell lines to DEB-induced toxicity. Further, our study provides evidence that DEB-induced cytotoxicity is, in part, triggered by the induction of apoptosis. The protective effect of GSTT1 genotype was evident in both GSTT1 heterozygote and homozygote cell lines, with no significant effect of copy number (Table S4).
Furthermore, GSTT1 genotype was strongly associated with an increased formation of DEB-GSH conjugates (Figure 6), suggesting that the protective effect of GSTT1 against DEB-induced apoptosis is mediated by GSTT1-catalyzed conjugation of DEB to GSH, the first step of elimination of DEB via the mercapturic acid pathway. GSTM1 genotype did not affect the levels of these conjugates. This data are in line with our previous studies on GSTT1 genotype and its protective effect against EB induced apoptosis in the same Hap Map cell line model19 and our epidemiological studies in smokers that revealed a key role of GSTT1.18 Taken together, these results suggest that GSTT1 protects against acute toxicity of EB and DEB by initiating their detoxification and elimination in the form of mercapturic acid conjugates.
Since BD is a potent human carcinogen,6 we also investigated the potential effect of the GSTT1 genotype on the induction of MN, a common biomarker of genotoxicity, and the formation of pro-mutagenic bis-N7G-BD cross-link.55 In our study, DEB significantly increased MN counts (Figure 3), which is in agreement with previous reports.56 However, this biological endpoint was not influenced by GSTT1 or GSTM1 genotype. While GSTT1 has been reported to protect against DEB-induced SCE in lymphocytes,21, 57–59 it is less effective in protecting against the formation of chromosomal aberrations such as MN.59,60 Because the mechanisms responsible for MN formation and SCE are different,60 it is not surprising that the influence of GSTT1 on these two genotoxic outcomes is not the same. The levels of the genotoxic DNA adducts, bis-N7G-BD, were also not affected by GSTT1 genotype (Figure 6), providing a consistent link between their formation and the expected toxicological outcome and suggesting that factors other than GSTT1 genotype play a role in response of human cells to DEB-induced tumorigenicity.
The most likely explanation of a differential effect of GSTT1 on the two toxicological endpoints is that apoptosis is likely an immediate response to DEB-induced cellular stress, whereas MN is the product of DEB-induced genetic instability. Our mechanistic biomarkers mirrors these findings, with GSTT1 genotype being important for formation of DEB-GSH thereby reducing DEB and preventing apoptosis, but insufficient to affect the initial insult on DNA leading to similar induction of MN and formation of bis-N7G-BD in GSTT1 in negative and positive cell lines. It should also be noted that in addition to bis-N7G-BD, DEB induces a number of other toxic and mutagenic adducts including trihydroxybutyl monoadducts,61 exocyclic dA adducts,62 and guanine-adenine cross-links,63, 64 which were not measured in the present work.
In summary, we demonstrate the importance of GSTT1 genotype in metabolism of DEB as a first step of elimination via the mercapturic acid pathway and that GSTT1 positive genotype seem to protect against DEB-induced apoptosis. In contrast, in our model, GSTT1 genotype did not affect induction of MN or formation of bis-N7G-BD.
Supplementary Material
Acknowledgements
We thank Todd Rappe for his help with NMR analyses and interpretation, and Bob Carlson for his help with the figures for this manuscript.
Funding Sources
This study was supported by U.S. National Cancer Institute grants P01 CA-138338 (LP, NT) and R01 CA-100670 (NT). The Flow Cytometry Resource at the University of Minnesota is funded in part by P30 CA077598.
Footnotes
Supporting information
Supplementary information includes proposed MS/MS fragmentation patterns, 1H and 1H-13C HSQC NMR spectra of THB-GSH, a representative immunoblot of GSTT1 protein, representative flow cytometry plots using annexin V, allophycocyanin (APC) and propidium iodide (PI) staining for apoptosis measurement, representative flow cytometry plots for micronuclei formation measurement, cytotoxicity curves, GSTT1 and GSTM1 genotype for each cell line, apoptosis measurements in DEB-treated HapMap cell lines, average extent of apoptosis in cell lines based on GSTT1 genotype, and univariate responses for apoptosis, MN, or DEB-GSH formation between GSTT positive and GSTT negative cell lines, GSTM1 genotypes or between DEB treatment levels.
References
- (1).Siegel RL, Miller KD, and Jemal A (2019) Cancer statistics, 2019. CA Cancer J Clin 69, 7–34. [DOI] [PubMed] [Google Scholar]
- (2).American Cancer Society. American Cancer Society Facts & Figures 2019, https://www.cancer.org/research/cancer-facts-statistics/all-cancer-facts-figures/cancer-facts-figures-2019.html# (accessed August 10th, 2020).
- (3).Rodgman A, and Perfetti TA (2016) The Chemical Components of Tobacco and Tobacco Smoke. 2nd Edition ed., pp. CRC press, Boca Raton. [Google Scholar]
- (4).United States Surgeon General. (2010) How Tobacco Smoke Causes Disease: The Biology and Behavorial Basis for Smoking-Atributable Disease. pp. United States Department of Health and Human Services, Rockville, MD. [Google Scholar]
- (5).Kirman CR, Albertini RA, and Gargas ML (2010) 1,3-Butadiene: III. Assessing carcinogenic modes of action. Crit Rev Toxicol 40 Suppl 1, 74–92. [DOI] [PubMed] [Google Scholar]
- (6).International Agency for Research on Cancer. (2008) 1,3-Butadiene, Ethylene Oxide and Vinyl Halides (Vinyl Fluoride, Vinyl Chloride and Vinyl Bromide), In IARC Monographs on the Evaluation of Carcinogenic Risks to Humans. Vol 97. pp 3–471, IARC, Lyon, FR. [PMC free article] [PubMed] [Google Scholar]
- (7).Duescher RJ, and Elfarra AA (1994) Human liver microsomes are efficient catalysts of 1,3-butadiene oxidation: evidence for major roles by cytochromes P450 2A6 and 2E1. Arch. Biochem. Biophys 311, 342–349. [DOI] [PubMed] [Google Scholar]
- (8).Csanady GA, Guengerich FP, and Bond JA (1992) Comparison of the biotransformation of 1,3-butadiene and its metabolite, butadiene monoepoxide, by hepatic and pulmonary tissues from humans, rats and mice. Carcinogenesis 13, 1143–1153. [DOI] [PubMed] [Google Scholar]
- (9).Cochrane JE, and Skopek TR (1994) Mutagenicity of butadiene and its epoxide metabolites: I. Mutagenic potential of 1,2-epoxybutene, 1,2,3,4-diepoxybutane and 3,4-epoxy-1,2-butanediol in cultured human lymphoblasts. Carcinogenesis 15, 713–717. [DOI] [PubMed] [Google Scholar]
- (10).Kelsey KT, Wiencke JK, Ward J, Bechtold W, and Fajen J (1995) Sister-chromatid exchanges, glutathione S-transferase theta deletion and cytogenetic sensitivity to diepoxybutane in lymphocytes from butadiene monomer production workers. Mutat. Res. 335, 267–273. [DOI] [PubMed] [Google Scholar]
- (11).Walker VE, Degner A, Carter EW, Nicklas JA, Walker DM, Tretyakova N, and Albertini RJ (2019) 1,3-Butadiene metabolite 1,2,3,4 diepoxybutane induces DNA adducts and micronuclei but not t(9;22) translocations in human cells. Chem Biol Interact 312, 108797. [DOI] [PubMed] [Google Scholar]
- (12).Galaup A, and Paci A (2013) Pharmacology of dimethanesulfonate alkylating agents: busulfan and treosulfan. Expert Opin Drug Metab Toxicol 9, 333–347. [DOI] [PubMed] [Google Scholar]
- (13).Sehouli J, Tome O, Dimitrova D, Camara O, Runnebaum IB, Tessen HW, Rautenberg B, Chekerov R, Muallem MZ, et al. (2017) A phase III, open label, randomized multicenter controlled trial of oral versus intravenous treosulfan in heavily pretreated recurrent ovarian cancer: a study of the North-Eastern German Society of Gynecological Oncology (NOGGO). J Cancer Res Clin Oncol 143, 541–550. [DOI] [PMC free article] [PubMed] [Google Scholar]
- (14).Boysen G, Shimoni A, Danylesko I, Varda-Bloom N, and Nagler A (2019) A simplified method for detection of N-terminal valine adducts in patients receiving treosulfan. Rapid Commun Mass Spectrom 33, 1635–1642. [DOI] [PMC free article] [PubMed] [Google Scholar]
- (15).Cho SH, and Guengerich FP (2012) Conjugation of butadiene diepoxide with glutathione yields DNA adducts in vitro and in vivo. Chem Res Toxicol 25, 706–712. [DOI] [PMC free article] [PubMed] [Google Scholar]
- (16).Kotapati S, Matter BA, Grant AL, and Tretyakova NY (2011) Quantitative analysis of trihydroxybutyl mercapturic acid, a urinary metabolite of 1,3-butadiene, in humans. Chem. Res. Toxicol. 24, 1516–1526. [DOI] [PMC free article] [PubMed] [Google Scholar]
- (17).Kotapati S, Sangaraju D, Esades A, Hallberg L, Walker VE, Swenberg JA, and Tretyakova NY (2014) Bis-butanediol-mercapturic acid (bis-BDMA) as a urinary biomarker of metabolic activation of butadiene to its ultimate carcinogenic species. Carcinogenesis 35, 1371–1378. [DOI] [PMC free article] [PubMed] [Google Scholar]
- (18).Boldry EJ, Patel YM, Kotapati S, Esades A, Park SL, Tiirikainen M, Stram DO, Le Marchand L, and Tretyakova N (2017) Genetic determinants of 1,3-butadiene metabolism and detoxification in three populations of smokers with different risks of lung cancer. Cancer Epidemiol. Biomarkers. Prev. 26, 1034–1042. [DOI] [PMC free article] [PubMed] [Google Scholar]
- (19).Degner A, Arora R, Erber L, Chao C, Peterson LA, and Tretyakova NY (2020) Interindividual differences in DNA adduct formation and detoxification of 1,3-butadiene-derived epoxide in human HapMap cell lines. Chem Res Toxicol 33, 1698–1708. [DOI] [PMC free article] [PubMed] [Google Scholar]
- (20).Wiencke JK, Pemble S, Ketterer B, and Kelsey KT (1995) Gene deletion of glutathione S-transferase theta: correlation with induced genetic damage and potential role in endogenous mutagenesis. Cancer Epidemiol. Biomarkers. Prev. 4, 253–259. [PubMed] [Google Scholar]
- (21).Norppa H, Hirvonen A, Jarventaus H, Uuskula M, Tasa G, Ojajarvi A, and Sorsa M (1995) Role of GSTT1 and GSTM1 genotypes in determining individual sensitivity to sister chromatid exchange induction by diepoxybutane in cultured human lymphocytes. Carcinogenesis 16, 1261–1264. [DOI] [PubMed] [Google Scholar]
- (22).Fustinoni S, Soleo L, Warholm M, Begemann P, Rannug A, Neumann HG, Swenberg JA, Vimercati L, and Colombi A (2002) Influence of metabolic genotypes on biomarkers of exposure to 1,3-butadiene in humans. Cancer Epidemiol. Biomarkers. Prev. 11, 1082–1090. [PubMed] [Google Scholar]
- (23).Consortium, I. H. (2005) A haplotype map of the human genome. Nature 437, 1299–1320. [DOI] [PMC free article] [PubMed] [Google Scholar]
- (24).Vermes I, Haanen C, Steffens-Nakken H, and Reutelingsperger C (1995) A novel assay for apoptosis. Flow cytometric detection of phosphatidylserine expression on early apoptotic cells using fluorescein labelled Annexin V. J Immunol Methods 184, 39–51. [DOI] [PubMed] [Google Scholar]
- (25).Bryce SM, Bemis JC, Avlasevich SL, and Dertinger SD (2007) In vitro micronucleus assay scored by flow cytometry provides a comprehensive evaluation of cytogenetic damage and cytotoxicity. Mutat. Res. 630, 78–91. [DOI] [PMC free article] [PubMed] [Google Scholar]
- (26).Sangaraju D, Boldry EJ, Patel YM, Walker V, Stepanov I, Stram D, Hatsukami D, and Tretyakova N (2017) Isotope Dilution nanoLC/ESI(+)-HRMS(3) Quantitation of Urinary N7-(1-Hydroxy-3-buten-2-yl) Guanine Adducts in Humans and Their Use as Biomarkers of Exposure to 1,3-Butadiene. Chem Res Toxicol 30, 678–688. [DOI] [PMC free article] [PubMed] [Google Scholar]
- (27).Park S, and Tretyakova N (2004) Structural characterization of the major DNA-DNA cross-link of 1,2,3,4-diepoxybutane. Chem. Res. Toxicol 17, 129–136. [DOI] [PubMed] [Google Scholar]
- (28).Park S, Anderson C, Loeber R, Seetharaman M, Jones R, and Tretyakova N (2005) Interstrand and intrastrand DNA-DNA cross-linking by 1,2,3,4-diepoxybutane: role of stereochemistry. J. Am. Chem Soc 127, 14355–14365. [DOI] [PubMed] [Google Scholar]
- (29).McCarroll SA, Hadnott TN, Perry GH, Sabeti PC, Zody MC, Barrett JC, Dallaire S, Gabriel SB, Lee C, et al. (2006) Common deletion polymorphisms in the human genome. Nat. Genet. 38, 86–92. [DOI] [PubMed] [Google Scholar]
- (30).Gates LA, Phillips MB, Matter BA, and Peterson LA (2014) Comparative metabolism of furan in rodent and human cryopreserved hepatocytes. Drug Metab Dispos 42, 1132–1136. [DOI] [PMC free article] [PubMed] [Google Scholar]
- (31).Sangaraju D, Goggin M, Walker V, Swenberg J, and Tretyakova N (2012) NanoHPLC-nanoESI(+)-MS/MS quantitation of bis-N7-guanine DNA-DNA cross-links in tissues of B6C3F1 mice exposed to subppm levels of 1,3-butadiene. Anal. Chem 84, 1732–1739. [DOI] [PMC free article] [PubMed] [Google Scholar]
- (32).Michaelson-Richie ED, Ming X, Codreanu SG, Loeber RL, Liebler DC, Campbell C, and Tretyakova NY (2011) Mechlorethamine-induced DNA-protein cross-linking in human fibrosarcoma (HT1080) cells. J Proteome Res 10, 2785–2796. [DOI] [PMC free article] [PubMed] [Google Scholar]
- (33).Twomey PJ, and Kroll MH (2008) How to use linear regression and correlation in quantitative method comparison studies. Int J Clin Pract 62, 529–538. [DOI] [PubMed] [Google Scholar]
- (34).Welch BL (1947) The generalisation of student’s problems when several different population variances are involved. Biometrika 34, 28–35. [DOI] [PubMed] [Google Scholar]
- (35).Bartlett MS (1937) Properties of sufficiency and statistical tests. Proc R Soc Lon Ser-A 160, 268–282. [Google Scholar]
- (36).Shapiro SS, and Wilk MB (1965) An analysis of variance test for normality (complete samples). Biometrika 52, 591–611. [Google Scholar]
- (37).Dong J, Wang Z, Zou P, Zhang G, Dong X, Ling X, Zhang X, Liu J, Ye D, et al. (2015) Induction of DNA damage and G2 cell cycle arrest by diepoxybutane through the activation of the Chk1-dependent pathway in mouse germ cells. Chem. Res. Toxicol. 28, 518–531. [DOI] [PubMed] [Google Scholar]
- (38).Sappington DR, Siegel ER, Hiatt G, Desai A, Penney RB, Jamshidi-Parsian A, Griffin RJ, and Boysen G (2016) Glutamine drives glutathione synthesis and contributes to radiation sensitivity of A549 and H460 lung cancer cell lines. Biochim Biophys Acta 1860, 836–843. [DOI] [PMC free article] [PubMed] [Google Scholar]
- (39).Goggin M, Swenberg JA, Walker VE, and Tretyakova N (2009) Molecular dosimetry of 1,2,3,4-diepoxybutane-induced DNA-DNA cross-links in B6C3F1 mice and F344 rats exposed to 1,3-butadiene by inhalation. Cancer Res 69, 2479–2486. [DOI] [PMC free article] [PubMed] [Google Scholar]
- (40).Millard JT, Hanly TC, Murphy K, and Tretyakova N (2006) The 5’-GNC site for DNA interstrand cross-linking is conserved for diepoxybutane stereoisomers. Chem Res Toxicol 19, 16–19. [DOI] [PMC free article] [PubMed] [Google Scholar]
- (41).Guainazzi A, Scharer OD (2010) Using synthetic DNA interstrand crosslinks to elucidate repair pathways and identify new therapeutic targets for cancer chemotherapy. Cell. Mol. Life Sci. 67, 3683–3697. [DOI] [PMC free article] [PubMed] [Google Scholar]
- (42).Bernardini S, Pelin K, Peltonen K, Jarventaus H, Hirvonen A, Neagu C, Sorsa M, and Norppa H (1996) Induction of sister chromatid exchange by 3,4-expoxybutane-1,2-diol in cultured human lymphocytes of different GSTT1 and GSTM1 genotypes. Mutat. Res. 361, 121–127. [DOI] [PubMed] [Google Scholar]
- (43).Kligerman AD, Doerr CL, Milholland VS, and Tennant AH (1996) Cytogenetic effects of butadiene metabolites in rat and mouse splenocytes following in vitro exposures. Toxicology 113, 336–340. [DOI] [PubMed] [Google Scholar]
- (44).Perry P, and Evans HJ (1975) Cytological detection of mutagen-carcinogen exposure by sister chromatid exchange. Nature 258, 121–125. [DOI] [PubMed] [Google Scholar]
- (45).Sasiadek M, Jarventaus H, and Sorsa M (1991) Sister-chromatid exchanges induced by 1.3-butadiene and its epoxides in CHO cells. Mutat. Res. 263, 47–50. [DOI] [PubMed] [Google Scholar]
- (46).Sasiadek M, Norppa H, and Sorsa M (1991) 1,3-Butadiene and its epoxides induce sister-chromatid exchanges in human lymphocytes in vitro. Mutat. Res. 261, 117–121. [DOI] [PubMed] [Google Scholar]
- (47).Meng Q, Redetzke DL, Hackfeld LC, Hodge RP, Walker DM, and Walker VE (2007) Mutagenicity of stereochemical configurations of 1,2-epoxybutene and 1,2:3,4-diepoxybutane in human lymphblastoid cells. Chem Biol Interact 166, 207–218. [DOI] [PubMed] [Google Scholar]
- (48).Yadavilli S, and Muganda PM (2004) Diepoxybutane induces caspase and p53-mediated apoptosis in human lymphoblasts. Toxicol Appl Pharmacol 195, 154–165. [DOI] [PubMed] [Google Scholar]
- (49).Pelin K, Hirvonen A, and Norppa H (1996) Influence of erythrocyte glutathione S-transferase T1 on sister chromatid exchanges induced by diepoxybutane in cultured human lymphocytes. Mutagenesis 11, 213–215. [DOI] [PubMed] [Google Scholar]
- (50).Vlachodimitropoulos D, Norppa H, Autio K, Catalan J, Hirvonen A, Tasa G, Uuskula M, Demopoulos NA, and Sorsa M (1997) GSTT1-dependent induction of centromere-negative and -positive micronuclei by 1,2:3,4-diepoxybutane in cultured human lymphocytes. Mutagenesis 12, 397–403. [DOI] [PubMed] [Google Scholar]
- (51).Kligerman AD, DeMarini DM, Doerr CL, Hanley NM, Milholland VS, and Tennant AH (1999) Comparison of cytogenetic effects of 3,4-epoxy-1-butene and 1,2:3, 4-diepoxybutane in mouse, rat and human lymphocytes following in vitro G0 exposures. Mutat. Res. 439, 13–23. [DOI] [PubMed] [Google Scholar]
- (52).Kasparkova J, Novakova O, Vrana O, Intini F, Natile G, and Brabec V (2006) Molecular aspects of antitumor effects of a new platinum (IV) drug. Mol Pharmacol 70, 1708–1719. [DOI] [PubMed] [Google Scholar]
- (53).Dolan ME, Roy SK, Fasanmade AA, Paras PR, Schilsky RL, and Ratain MJ (1998) O6-Benzylguanine in humans: metabolic, pharmacokinetic, and pharmacodynamic findings. J Clin Oncol 16, 1803–1810. [DOI] [PubMed] [Google Scholar]
- (54).Hoes I, Van Dongen W, Lemiere F, Esmans EL, Van Bockstaele D, and Berneman ZN (2000) Comparison between capillary and nano liquid chromatography-electrospray mass spectrometry for the analysis of minor DNA-melphalan adducts. J Chromatogr B Biomed Sci Appl 748, 197–212. [DOI] [PubMed] [Google Scholar]
- (55).Albertini RJ, Carson ML, Kirman CR, and Gargas ML (2010) 1,3-Butadiene: II. Genotoxicity profile. Crit Rev Toxicol 40 Suppl 1, 12–73. [DOI] [PubMed] [Google Scholar]
- (56).Xi L, Zhang L, Wang Y, and Smith MT (1997) Induction of chromosome-specific aneuploidy and micronuclei in human lymphocytes by metabolites of 1,3-butadiene. Carcinogenesis 18, 1687–1693. [DOI] [PubMed] [Google Scholar]
- (57).Schlade-Bartusiak K, Sasiadek M, and Kozlowska J (2000) The influence of GSTM1 and GSTT1 genotypes on the induction of sister chromatid exchanges and chromosome aberrations by 1,2:3,4-diepoxybutane. Mutat. Res. 465, 69–75. [DOI] [PubMed] [Google Scholar]
- (58).Landi S, Ponzanelli I, Hirvonen A, Norppa H, and Barale R (1996) Repeated analysis of sister chromatid exchange induction by diepoxybutane in cultured human lymphocytes: effect of glutathione S-transferase T1 and M1 genotype. Mutat. Res. 351, 79–85. [DOI] [PubMed] [Google Scholar]
- (59).Landi S, Norppa H, Frenzilli G, Cipollini G, Ponzanelli I, Barale R, and Hirvonen A (1998) Individual sensitivity to cytogenetic effects of 1,2:3,4-diepoxybutane in cultured human lymphocytes: influence of glutathione S-transferase M1, P1 and T1 genotypes. Pharmacogenetics 8, 461–471. [PubMed] [Google Scholar]
- (60).Mateuca RA, Decordier I, and Kirsch-Volders M (2012) Cytogenetic methods in human biomonitoring: principles and uses. Methods Mol Biol 817, 305–334. [DOI] [PubMed] [Google Scholar]
- (61).Tretyakova N, Sangaiah R, Yen TY, and Swenberg JA (1997) Synthesis, characterization, and in vitro quantitation of N-7-guanine adducts of diepoxybutane. Chem. Res. Toxicol. 10, 779–785. [DOI] [PubMed] [Google Scholar]
- (62).Seneviratne U, Antsypovich S, Goggin M, Dorr DQ, Guza R, Moser A, Thompson C, York DM, and Tretyakova N (2010) Exocyclic deoxyadenosine adducts of 1,2,3,4-diepoxybutane: synthesis, structural elucidation, and mechanistic studies. Chem. Res. Toxicol. 23, 118–133. [DOI] [PMC free article] [PubMed] [Google Scholar]
- (63).Park S, Hodge J, Anderson C, and Tretyakova N (2004) Guanine-adenine DNA cross-linking by 1,2,3,4-diepoxybutane: potential basis for biological activity. Chem. Res. Toxicol 17, 1638–1651. [DOI] [PubMed] [Google Scholar]
- (64).Tretyakova N, Livshits A, Park S, Bisht B, and Goggin M (2007) Structural elucidation of a novel DNA-DNA cross-link of 1,2,3,4-diepoxybutane. Chem. Res. Toxicol 20, 284–289. [DOI] [PubMed] [Google Scholar]
Associated Data
This section collects any data citations, data availability statements, or supplementary materials included in this article.


