Abstract
Smoking-induced lung cancer is a major cause of cancer mortality in the US and worldwide. While 11–24 % of smokers will develop lung cancer, risk varies among individuals and ethnic/racial groups. Specifically, African American and Native Hawaiian cigarette smokers are more likely to get lung cancer as compared to Caucasians, Japanese Americans, and Latinos. It is important to identify smokers who are at the greatest risk of developing lung cancer as they should be candidates for smoking cessation and chemopreventive intervention programs. Among 60+ tobacco smoke carcinogens, 1,3- butadiene (BD) is one of the most potent and abundant (20–75 µg per cigarette in mainstream smoke and 205–361 µg per cigarette in side stream smoke). BD is metabolically activated to 3,4-epoxy-1-butene (EB), which can be detoxified by glutathione S-transferase theta 1 (GSTT1)-mediated conjugation with glutathione, or can react with DNA to form 7-(1-hydroxy-3-buten-2-yl)guanine (EB-GII) adducts. In the present study, we employed EBV-transformed human lymphoblastoid cell lines (HapMap cells) with known GSTT1 genotypes to examine the influence of GSTT1 gene on inter-individual variability in butadiene metabolism, DNA adduct formation/repair, and biological outcomes (apoptosis). We found that GSTT1− HapMap cells treated with EB in culture produced lower levels of glutathione conjugates and were more susceptible to apoptosis, but had similar numbers of EB-GII adducts as GSTT1+ cells. Our results suggest that GSTT1 can influence an individual’s susceptibility to butadiene-derived epoxides.
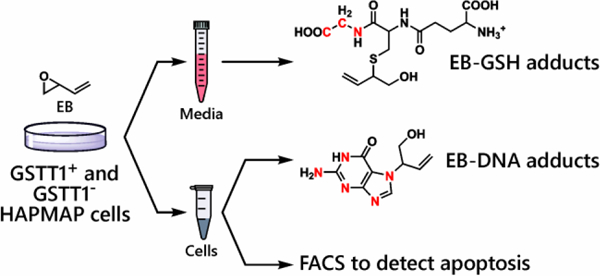
Graphical Abstract
Introduction
Cigarette smoking is a leading cause of cancer worldwide, accounting for 81% of lung cancer incidence.1, 2 On average, people who smoke cigarettes are 15 to 30 times more likely to get lung cancer or die from lung cancer than people who do not smoke, however, the risk varies widely between individuals and ethnic groups.3 After adjusting for smoking history, African American and Native Hawaiian smokers are at the highest risk of developing lung cancer, while Japanese American and Latino smokers have much lower risks, and Caucasian smokers have intermediate risk.3, 4 While the source of these ethnic differences is not known, frequencies of genetic polymorphisms in metabolic enzymes differ between ethnic groups, potentially influencing the ability of smokers to metabolize tobacco carcinogens. This, in turn, could lead to increased carcinogen bioactivation and/or decreased detoxification, elevated levels of DNA-reactive metabolites, greater DNA adduct load, and a higher chance for cancer causing mutations in affected individuals.
1,3-Butadiene (BD) is a known human carcinogen5 and is among the most abundant carcinogens in cigarette smoke.6–8 BD has a high cancer risk index per cigarette per day as compared to other cigarette smoke components.9 In inhalation studies in laboratory mice and rats, BD exposure led to the development of tumors in multiple organs including lymphomas, hemangiosarcomas of the heart, and lung tumors.10, 11 Epidemiological studies in workers occupationally exposed to BD showed an increased risk of developing leukemia and lymphoma.12, 13
The genotoxic effects of BD are attributed to its epoxide metabolites 3,4-epoxy-1-butene (EB), 3,4-epoxy-1,2-butanediol (EBD), and 1,2,3,4-diepoxybutane (DEB), which are formed via metabolic activation by cytochrome P450 monooxygenases, namely CYP 2E1 and CYP 2A6 (Scheme 1).14–16 EB and other BD-derived epoxides are direct genotoxic agents that induce mutations in cells and animals.16 BD-derived epoxides are detoxified through enzyme catalyzed hydrolysis by epoxide hydrolases (EPHX1) or through glutathione (GSH) conjugation by glutathione S-transferase theta 1 (GSTT1). Glutathione conjugates metabolized through the mercapturic acid pathway, resulting in N-acetylcysteine conjugates (mercapturic acids) which are excreted in urine (Scheme 1). For EB, the major routes of detoxification are hydrolysis by EPHX1 to 1-butene-3,4-diol (EB-diol) and GSH conjugation to form EB-GSH, which is further metabolized through the mercapturic acid pathway to (2-(N-acetyl-L-cystein-S-yl)-1-hydroxybut-3-ene and 1-(N-acetyl-L-cystein-S-yl)-1-hydroxybut-3-ene) (MHBMA) (Scheme 1).
Scheme 1.
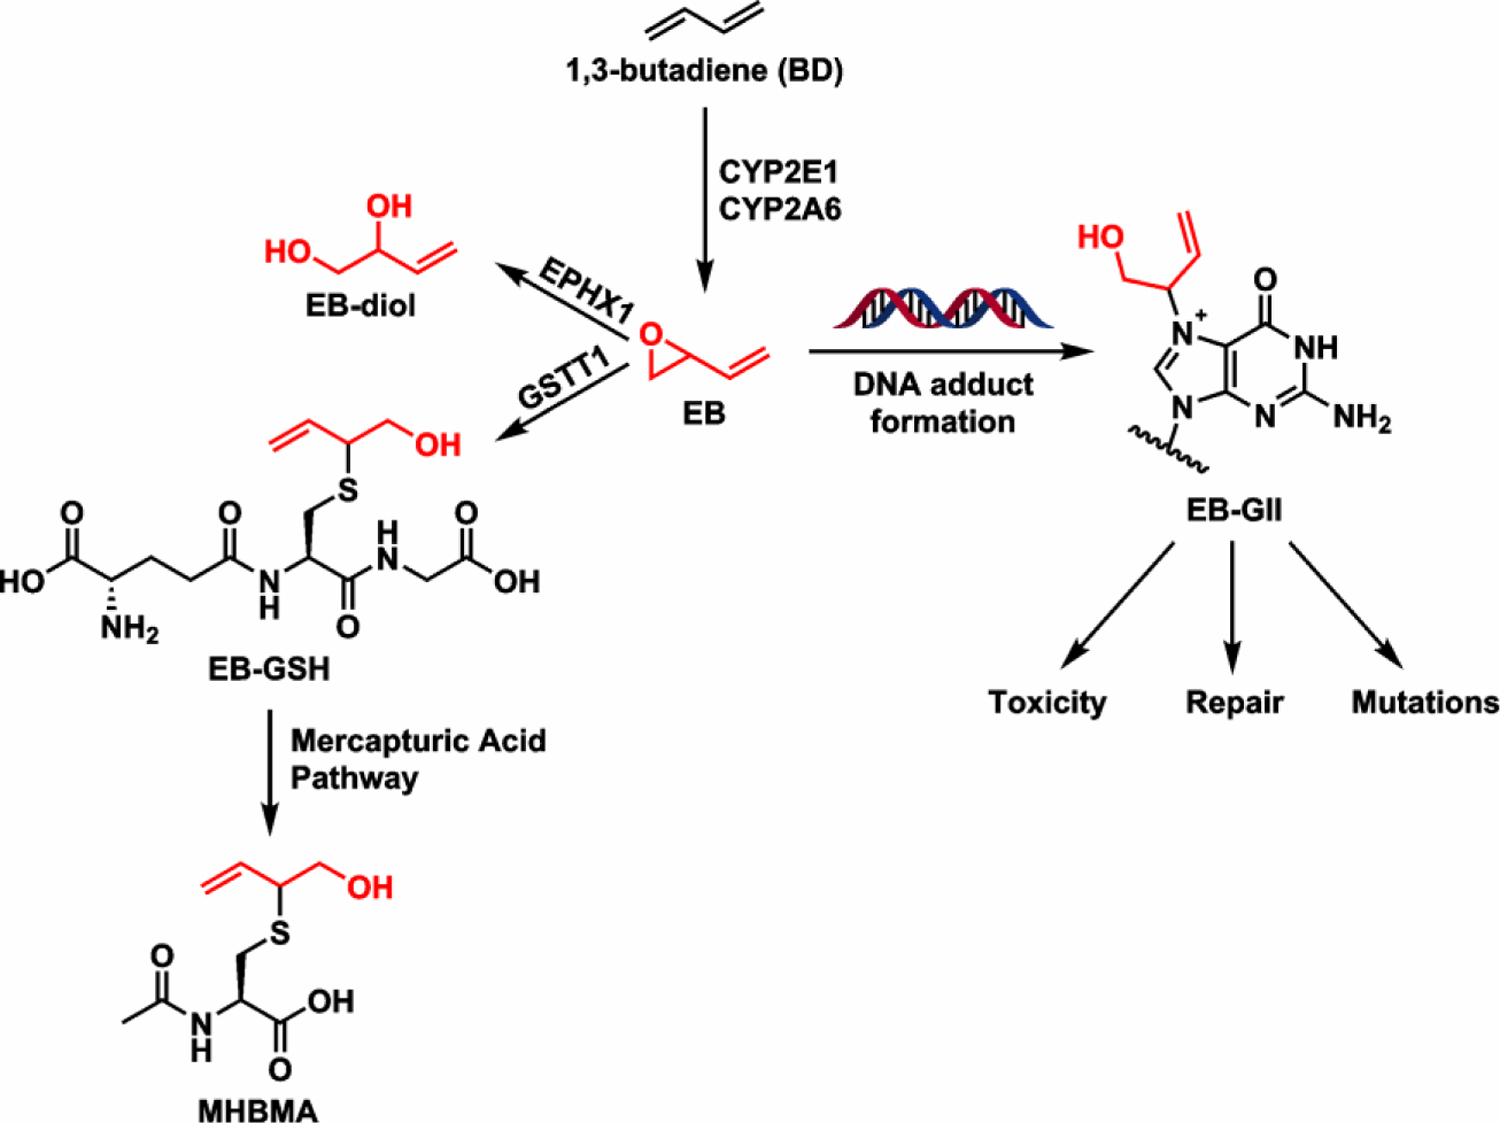
Bioactivation/detoxification pathways of BD and the formation of EB-DNA adducts.
EB forms covalent adducts with DNA including N6-(2-hydroxy-3-buten-1-yl)-2′-deoxyadenosine, 1-(1-hydroxy-3-buten-2-yl)-adenine, 1-(2-hydroxy-3-buten-1-yl)-adenine, N3-(1-hydroxy-3-buten-2-yl)-adenine, 3-(2-hydroxy-3-buten-1-yl)-adenine, 7-(2-hydroxy-3-buten-1-yl)-adenine (EB-GI), and 7-(1-hydroxy-3-buten-2-yl)guanine (EB-GII).17–19 These adducts can cause DNA polymerase stalling and misreading during DNA replication, leading to toxicity and mutations.17, 20 If present in a tumor suppressor gene or a proto-oncogene, such mutations can lead to unrestricted cell growth and the development of cancer.21, 22
BD-derived metabolites and DNA adducts are established biomarkers of BD exposure and cancer risk.23, 24 Urinary levels of MHBMA (2-(N-acetyl-L-cystein-S-yl)-1-hydroxybut-3-ene and 1-(N-acetyl-L-cystein-S-yl)-1-hydroxybut-3-ene), a mercapturic acid ultimately resulting from BD detoxification (Scheme 1), are associated with cigarette smoking.25, 26 MHBMA levels were measured in urine samples of Caucasian, Japanese American, and African American smokers, where they differed significantly based on ethnicity (p = 4.0 × 10⁻²⁵).27 African Americans excreted the highest levels of MHBMA, followed by Caucasians and Japanese Americans.27 A genome-wide association study revealed a significant association between urinary MHBMA levels and GSTT1 copy number, with GSTT1+ individuals excreting significantly higher levels of MHBMA (p < 0.0001).27 In contrast, urinary BD-DNA adducts (EB-GII) were more abundant in Caucasian smokers as compared to African American smokers (0.048 ± 0.09 vs 0.12 ± 0.02 pg/mg of creatinine, p = 3.1 × 10⁻⁷),28 and their levels did not correlate with GSTT1 copy number. However, urinary EB-GII adduct levels measured in large human studies can be affected by many other factors such as diet, disease, and polymorphisms in DNA repair genes. Therefore, although GSTT1 gene appears to play a key role in BD metabolism,29, 30 it is less clear whether GSTT1 polymorphisms influence BD-DNA adduct load, genotoxicity, and susceptibility towards the development of cancer.
In the present study, we employed human B-lymphocytes from the International HapMap project31–33 to examine the differences in individual response to BD-derived epoxide, 3,4-epoxy-1-butene (EB), due to variations in GSTT1 expression/activity. The HapMap project aims to make a haplotype map of the human genome to observe common patterns of human genetic variation.34 A subset of HapMap cells was selected based on the presence or the absence of the GSTT1 gene in their genome. Following treatment of GSTT1+ and GSTT1− cells with EB, we quantified the levels of EB-GSH conjugates in the media, genomic EB-DNA adduct levels, and biological response (apoptosis) in order to characterize the influence of GSTT1 gene on interindividual response to BD.
Materials and methods
Note: EB is a known carcinogen35 and must be handled with adequate safety precautions in a well-ventilated fume hood strictly following its material safety data sheet.
LC-MS grade water and acetonitrile and HPLC grade methanol were obtained from Fisher Scientific (Pittsburg, PA). 15N1,13C2-glutathione was procured from Toronto Research Chemicals (North York, ON, Canada). EB-GII and 15N5-EB-GII were synthesized in our laboratory as previously described.36, 37 All other chemicals and solvents were obtained from Sigma Aldrich (St. Louis, MO).
Synthesis of EB-GSH and 15N1,13C2-EB-GSH standards
EB-GSH (Scheme 1) was prepared using a variation of the previously published methodology.38 Glutathione (3.07 mg, 10 µmol, 1 eq, Chem-Impex, Wood Dale, IL) was dissolved in 900 µL of 100 mM sodium phosphate buffer (pH 7.4) in a suitable Eppendorf tube. Recombinant human GSTT1 enzyme (20 µg, Sigma-Aldrich, St. Louis, MO) was added to the mixture, which was then warmed to 37 °C in an oil bath. Racemic EB (16.1 µL, 200 µmol, 20 eq, Alfa Aesar, Ward Hill, MA) diluted in 80 µL of 100 mM sodium phosphate buffer (pH 7.4) was added and this mixture was incubated at 37 °C without stirring for 2 h (total reaction volume: 980 µL). The reaction was quenched with one-half volume (500 µL) of 15% (v/v) dichloroacetic acid solution. GSTT1 protein was removed by ultrafiltration through Nanosep 10K filters (5000 g for 10 min, Pall Life Sciences, Ann Arbor, MI).
This filtered reaction mixture was subjected to SPE through Oasis MCX cartridges (Waters Corporation, Milford, MA) (30 mg/mL) before HPLC purification. Cartridges were first conditioned with 4% (v/v) formic acid in water (1 mL) followed by a rinse of water (1 mL). After conditioning, 500 µL portions of the filtered reaction mixture diluted by an equal volume of additional 4% (v/v) formic acid in water were then loaded onto each cartridge. Cartridges were washed once with 1 mL of water followed by two 1 mL washes of HPLC-grade methanol. Finally, the conjugate was eluted using a mixture of (30:70) methanol:4% aq. NH4OH (1 mL). The SPE eluates were combined and dried in vacuo to yield a crude foam (1.2 mg) that was reconstituted in 1.8 mL of 0.01% acetic acid in water.
EB-GSH was purified by HPLC using an Agilent 1100 series HPLC system (Santa Clara, CA) with a UV-Vis variable wavelength detector. The reconstituted solution of the crude product was loaded (in 100 µL injections) on a Luna C18(2) column (250 × 4.6 mm, 5 µm, Phenomenex, Torrance, CA) and eluted with 0.01% acetic acid in water (solvent A) and 0.01% acetic acid in (95:5) acetonitrile:water (solvent B) at a flow rate of 1.00 mL/min. Solvent composition started at 2% B and was increased to 10% B over 5 min. The gradient was further changed to 30% B over 5 min and held for 5 min before reducing back to 2% B over 10 min, followed by re-equilibration of the column at 2% B for an additional 5 min. The UV absorbance at 215 nm was monitored. EB-GSH eluted over two minutes starting at 11.5 min. Fractions containing EB-GSH were combined, concentrated, and dried in vacuo. EB-GSH was quantified via 1H NMR in 150 µL D2O and adding a known amount of methanol (0.55 mg, 17 µmol). The sample was determined to contain 0.70 µmol or 0.26 mg of the conjugate, representing 7% yield of pure compound.
EB-GSH: 1H NMR (D2O, 600 MHz): δ 5.91 (ddd, J = 17.2, 10.5, 6.2 Hz, 1H, CH=CH2), 5.32 (d, J = 17.2 Hz, 1H, trans CH=CH2), 5.23 (d, J = 10.5 Hz, 1H, cis CH=CH2), 4.59 (dd, J = 8.9, 4.8 Hz, 1H, Cys α H), 4.32 (q, J = 6.2 Hz, 1H, CHOH), 4.04 (m, 1H, Glu α H), 3.78 (s, 2H, Gly CH2), 3.13 (dd, J = 14.2, 4.9 Hz, 1H, Cys CH2), 2.92 (dd, J = 14.0, 8.9 Hz, 1H, Cys CH2), 2.83 (dd, J = 13.6, 5.0 Hz, 1H, CH2CHOH), 2.73 (dd, J = 13.6, 7.3 Hz, 1H, CH2CHOH), 2.55 (m, 2H, Glu γ H), 2.16 (q, J = 7.44 Hz, 2H, Glu β H) ppm.
15N1,13C2-EB-GSH (internal standard for mass spectrometry) was prepared analogously starting with 1.6 µmol of 15N1,13C2-GSH (Toronto Research Chemicals, North York, ON, Canada), and the amounts of GSTT1 enzyme, GSH, EB, and total reaction volume were scaled down accordingly to accommodate the smaller amounts of starting material. 15N1,13C2-EB-GSH amounts were determined from HPLC-ESI-MS/MS peak areas after spiking with known amounts of EB-GSH.
Cell culture experiments
Human-derived B-lymphocyte cells from the HapMap project were obtained from the NIGMS Human Genetic Cell Repository at the Coriell Institute for Medical Research (Camden, NJ). Based on previous reports on GSTT1 polymorphisms in HapMap cell lines,39 eleven human HapMap cell lines were selected: six with GSTT1 null genotype (GM12874, GM18508, GM18912, GM19128, GM19139, and GM18517) and five with at least one copy of the GSTT1 gene present (GM19130, GM12145, GM12717, GM19200, and GM12155).39 Cells were cultured in Gibco RPMI 1640 Medium (Thermo Fisher Scientific, Waltham, MA) supplemented with 15% heat inactivated fetal bovine serum (GIBCO, Thermo Fisher Scientific, Waltham, MA) at 37 °C in 5% CO2 humidified atmosphere. All experiments were performed using cells at passage number below 10.
Cells were counted using the Countess automated cell counter (Thermo Fisher Scientific, Waltham, MA), seeded in T-25 flasks, and grown at 37 °C for 24 h before EB exposure. In our preliminary experiments, HapMap cell lines (~5 million cells) were treated 2 mM EB for 0, 2, 4, 8, or 24 h to determine the ideal EB treatment length. Based on these results, 6 and 24 h time points were selected for apoptosis measurements.
In order to compare cellular response to EB in GSTT1+ and GSTT1− lymphoblasts, six GSTT1−/− cell lines (GM12874, GM18508, GM18912, GM19128, GM19139, and GM18517), one GSTT1+/− line (GM12145), and four GSTT1+/+ cell lines (GM19130, GM12717, GM19200 and GM12155) (~3 million cells, in triplicate) were treated with 2 mM EB for 6 h before being harvested. The cells were then centrifuged at 300 x g for 5 min, and the supernatants were saved for EB-GSH measurement. The pellet was resuspended in fresh media and the cells were divided for DNA adduct measurement (2.5 million) and apoptosis measurement (0.5 million).
In a separate experiment, three GSTT1−/− cell lines (GM12874, GM18912, GM19128), one GST+/− (GM12145) and two GSTT1+/+ cell lines (GM19130 and GM19200) were treated with 10 µM EB using the same procedure described above. Cells were centrifuged at 300 x g for 5 min. Cell media was saved for EB-GSH measurements, while the cell pellet was used for DNA adduct measurements as described below.
Confirmation of GSTT1 transcript expression in HapMap cell lines
GSTT1 expression levels in HapMap cell lines were confirmed at the transcript level by quantitative RT PCR. RNA was isolated from the cell lines using RNeasy plus kit (Qiagen, Hilden, Germany) as per manufacturer’s protocol. cDNA was synthesized from 1 µg RNA using RevertAid First Strand cDNA Synthesis Kit (Thermo Fisher Scientific, Waltham, MA) as per manufacturer’s protocol. Real time PCR reaction was carried out using Prime PCR assay (Bio-Rad Laboratories, Hercules, CA) for GSTT1 and housekeeping control GAPDH on 250 ng cDNA as template as per manufacturer’s protocol in ABI step one plus real time PCR system (Applied Biosystems, Foster City, CA). Relative expression was thus noted using standard fold change method using GAPDH as housekeeping control and cell line GM12717 as expression control.
Confirmation of GSTT1 protein expression in HapMap cell lines by western blotting
Total cellular protein was extracted from 10 million untreated cells. Cells were pelleted at 300 x g for 5 min and washed twice with PBS. Cell pellets were re-suspended in 500 µL RIPA buffer (Thermo Fisher Scientific, Waltham, MA) and incubated on ice for 45 minutes, followed by 5 cycles of sonication of 2 min each on ice. The lysed cells were centrifuged at 13000 x g for 15 min at 4 °C and the supernatant, containing total cellular protein, was collected. Protein concentrations were measured using the Pierce BCA protein assay kit (Thermo Fisher Scientific, Waltham, MA).
Equal amount of proteins (100 μg) were boiled in Laemmli buffer (Bio-Rad Laboratories, Hercules, CA), separated on 10% SDS- polyacrylamide gels, and transferred onto polyvinylidene fluoride (PVDF) membrane (MilliporeSigma, Burlington, MA). Bovine Serum Albumin (BSA), 5%, was used to block the PVDF membrane. Blocking was followed by incubation with primary antibody (Sigma ABS1653 for GSTT1 and Sigma SAB 1404522 for Vinculin) for 3 h and horseradish peroxidase (HRP) conjugated secondary antibody for 45 min at room temperature. The membrane was then washed 3 times with 0.05 % tween-20 in PBS (v/v) at room temperature for 15 min each. Immunoreactive bands were probed with the enhanced chemiluminescence (ECL) western blot detection system (Bio-Rad Laboratories, Hercules, CA) and viewed in Image studio. The signal intensity of GSTT1 was noted relative to housekeeping control (Vinculin).
Measurement of apoptosis following exposure to EB
For apoptosis assessment, EB-treated cell pellets were transferred to fresh media and subjected to 24 h staining with allophycocyanin (APC) labeled annexin-V and PI as per the manufacturer’s guidelines (eBiosciences, San Diego, CA). The cell population was then analyzed for percentage of cells in healthy and apoptotic phase on a LSR II 4760 flow cytometer (Becton Dickinson, Franklin Lakes, NJ) using FACSDiva and Flowjo software (Becton Dickinson, Franklin Lakes, NJ). The increase in the % of Annexin V positive cells caused by EB was determined by subtracting the % of Annexin V positive cells in the EB-treated cells from that observed in the control cells for each cell line.
HPLC-ESI+-MS/MS analysis of EB-GSH
EB-GSH was quantified in cell media using isotope dilution HPLC-ESI+-MS/MS. Cell media from EB-treated and control cells (1 mL) was spiked with 15N1,13C2-EB-GSH internal standard (126 pmol). Samples were purified by a two-stage solid phase extraction (SPE) method incorporating Oasis MCX cartridges (30 mg/mL) and Oasis MAX cartridges (30 mg/mL). MCX cartridges were conditioned with 1 mL of 2% formic acid in water, followed by 1 mL of water. Samples were acidified by adding 20 µL of formic acid before being loaded onto the prepared cartridges and washed with 1 mL of water, followed by 2 mL of MeOH. EB-GSH and its internal standard were eluted with 0.5 mL of 30% MeOH in 2% NH4OH, dried under vacuum, and reconstituted in 100 µL of 2% NH4OH in preparation for the next SPE cartridge. MAX cartridges were conditioned with 1 mL of 2% NH4OH followed by 1 mL water. Samples were then loaded onto the prepared cartridges and washed with 1 mL water followed by 2 mL MeOH. EB-GSH and its internal standard were eluted with 0.5 mL of 2% formic acid in water and dried under vacuum. Samples were reconstituted in 20 µL of 5 mM ammonium formate (pH 5) in water in preparation for mass spectrometry analysis.
HPLC-ESI+-MS/MS analyses of EB-GSH were conducted using a Dionex LC system interfaced with a TSQ Quantiva instrument (Thermo Fisher Scientific, Waltham, MA, USA). Solvent A was 5 mM ammonium formate (pH 5) in LCMS grade water, and solvent B was LCMS grade acetonitrile. Samples (1 µL) were injected onto an Acquity UPLC HSS T3 column (1 × 100 mm, 1.8 µm, Waters Corp., Milford, MA, USA) and eluted at 20 µL/min. A valve switch was set up after the column to direct the eluent to waste for the first 3 min, before switching to the MS. Solvent gradient started at 2% B, increased to 10% B in 10 min and further up to 70% B in 1 min. Solvent composition was held at 70% B for 4 min, and the column was then re-equilibrated for 4 min at 2% B. EB-GSH and its internal standard eluted as a sharp peak at ~5.6 min.
A TSQ Quantiva triple quadrupole mass spectrometer (Thermo Scientific, Waltham, MA) was operated in the positive ion mode using Ar as a collision gas (1.5 mTorr). The MS parameters were optimized upon infusion of authentic EB-GSH solution to achieve maximum sensitivity. Quantitative analyses were conducted using selected reaction monitoring (SRM) mode, following the MS/MS transitions corresponding to the loss of glutamate from the analyte (m/z 378.1 [M + H]+ → m/z 249.1 [M + H – Glu]+) and the loss of both glutamate and water (m/z 378.1 [M + H]+ → m/z 231.1 [M + H – Glu – H2O]+). Typical instrument settings included a spray voltage of 2.9 kV, capillary temperature of 400 °C, and collision energy of 10.25 V for both transitions. The corresponding transitions for the 15N1,13C2 isotopically labeled internal standard were m/z 381.1 [15N1,13C2-M + H]+ → m/z 252.1 [15N1,13C2-M + H – Glu]+ and m/z 381.11 [15N1,13C2-M + H]+ → m/z 234.1 [15N1,13C2-M + H – Glu – H2O]+. The peak width for both Q1 and Q3 was 0.7 amu. HPLC-ESI+-MS/MS quantitation was based on the areas of the peak for the first transition in the extracted ion chromatograms corresponding to the analyte and the internal standard. Solvent blanks were injected every 4–6 samples to monitor for potential analyte carryover.
NanoLC-NSI+-MS/MS analysis of EB-GII adducts
DNA was extracted from control and EB treated cells using Qiagen Puregene DNA extraction solution set (Qiagen, Hilden, Germany). Briefly, 1 mL of cell lysis buffer and 3.4 µL of proteinase K solution were added to ~3 million cells. Following overnight incubation at room temperature with slow inversion mixing, RNA was degraded by incubation with RNAse A (5 µL) at room temperature for 3 h. Proteins were precipitated out by adding 0.5 mL of Qiagen Puregene DNA protein precipitation solution, vortexing samples for ~20 sec, and centrifuging at 2000g for 15 min. DNA was precipitated by adding 34 µL of 5 M NH4OAc and 1.5 mL of ice-cold isopropyl alcohol (IPA) and storing overnight in a −20 °C freezer. Extracted DNA was subsequently washed twice with 1 mL of 70% EtOH in water and sheered using 19 and 22 gauge needles.
DNA concentrations were estimated using a nanodrop UV spectrophotometer (Thermo Scientific, Waltham, MA) based on UV absorbance at 260 nm. DNA purity was assessed from A260/A280 absorbance ratios, which were between 1.8 and 1.9. Accurate DNA amounts were confirmed by HPLC-UV quantitation of dG after enzymatic hydrolysis as described previously.40
EB-GII adducts were quantified by isotope dilution HPLC-ESI-MS/MS as described previously.28, 41 Briefly, DNA samples (10–25 µg) were spiked with 50 fmol 15N5-EB-GII internal standard and heated at 70 °C for 1 h to release EB-GII adducts from the DNA backbone. The DNA backbone was then removed by ultrafiltration with Nanosep 10K filters (Pall Life Sciences, Ann Arbor, MI, USA) at 5000 x g for 10 min. The filtrate was subjected to SPE using Strata-X polymeric reverse phase cartridges (30 mg/mL). Cartridges were conditioned with 2 mL of HPLC grade methanol, followed by 2 mL of water. After conditioning, samples were loaded. Cartridges were washed with 1 mL of water followed by 1 mL of 10% methanol in water. Finally, EB-GII and its internal standard were eluted in 1 mL of 60% methanol in water. Samples were dried under vacuum, reconstituted in 200 µL of water, and filtered using Nanosep 10K filters at 5000g for 10 min in order to remove any SPE particles. Filtered samples were then dried under vacuum and reconstituted in 15 µL of 0.01% acetic acid in water in preparation for nanoLC-nanoESI+-MS/MS analysis.
The method used for nanoLC-nanoESI+-MS/MS analysis of EB-GII adducts was based on our previously published method,41 which was adapted for a TSQ Quantiva triple quadrupole MS. NanoLC-nanoESI+-MS/MS analysis was conducted using a Dionex LC system with a 5 µL loop interfaced with a TSQ Quantiva instrument (Thermo Fisher Scientific, Waltham, MA, USA). Solvent A was 0.01% acetic acid in LCMS grade water and solvent B was 0.02% acetic acid in LCMS grade acetonitrile. Samples (1 µL) were injected onto a nano-LC column with a fused-silica tipped emitter (75 µm ID, from New Objective, Woburn, MA) that was manually packed with Synergi Hydro-RP, 80Å, 4 µm chromatographic packing (Phenomenex, Torrance, CA). The solvent composition started at 2% B at 800 nL/min, which was held for 7.5 min to allow the sample to reach the nano-LC column. The flow rate was reduced to 300 nL/min and maintained at 2% B for 0.5 min. The gradient was then increased linearly to 25% B in 9 min and then up to 50% B in 10 min. The column was re-equilibrated at 800 nL/min at 2% B for 7 min. EB-GII and its internal standard eluted as a sharp peak at ~16.5 min.
A TSQ Quantiva triple quadrupole mass spectrometer was operated in the positive ESI mode using argon as a collision gas (1.5 mTorr). The mass spectrometer parameters were optimized upon infusion of authentic EB-GII solution to achieve maximum sensitivity. Quantitative analyses were conducted using the selected reaction monitoring (SRM) mode by fragmenting the [M + H]+ ions of EB-GII (m/z 222.2) to [Gua + H]+ ions (m/z 151.8) via collision induced dissociation (CID) in Q2 using a collision energy of 13.8 V. Typical instrument settings included a spray voltage of 2.5 kV, capillary temperature of 375 °C, RF lens of 64 V, and a dwell time of 100 ms. The peak width for both Q1 was 0.4 amu and Q3 was 0.7 amu. EB-GII was quantified using the extracted ion chromatogram for m/z 222.2 [M + H]+ → m/z 151.8 [Gua + H]+. The corresponding transitions for the 15N5 isotopically labeled internal standard were m/z 227.1 [15N5-M + H]+ → m/z 156.8 [15N5-Gua + H]+. NanoLC-nanoESI+-MS/MS quantitation was done by comparing the areas of the peaks for the analyte and the internal standard. Solvent blanks were injected every 4–6 samples to monitor for potential analyte carryover.
Results
Experimental Approach
The present study was designed to elucidate the effects of GSTT1 genotype on cellular responses to active metabolite of BD, EB (Scheme 1). Our ultimate goal was to investigate the role of GSTT1 gene in cellular protection against EB toxicity and carcinogenesis. For this reason, we compared the extent of GSH conjugation, DNA adduct formation, and apoptosis following exposure to EB in a range of human HapMap cells with different GSTT1 genotypes (Scheme 2). As discussed above, cell lines from the HapMap project were derived from human populations from all over the world and have been extensively genotyped, allowing for cell culture studies that mimic the genetic diversity of real human populations.34
Scheme 2.
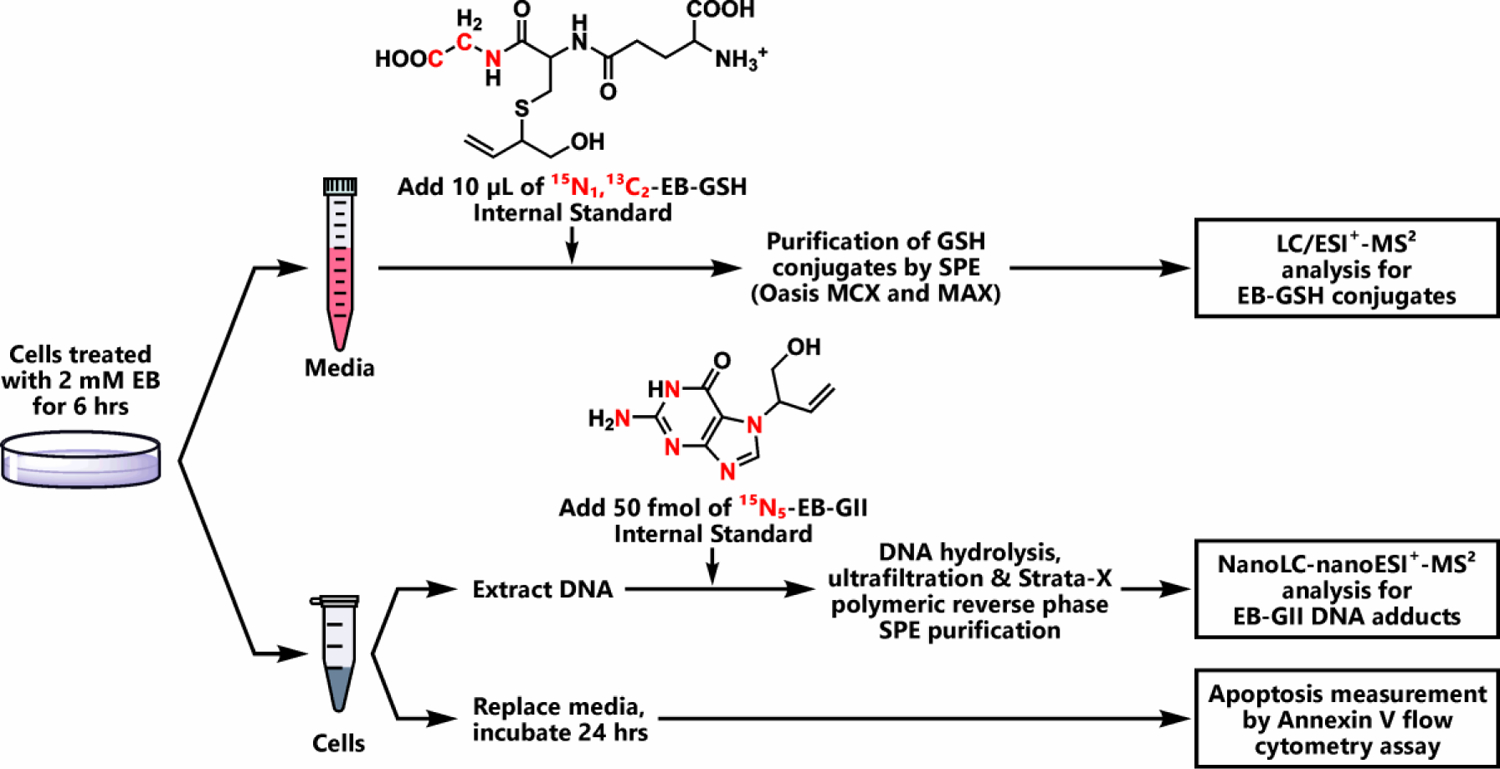
Experimental procedure for HPLC-ESI-MS/MS analysis of EB-GSH conjugates, EB-GII adducts, and apoptosis in cells exposed to EB.
For our study, we selected cell lines from the HapMap project with GSTT1− and GSTT1+ genotype, and their phenotypes were confirmed by RT PCR and western blotting (Figure 1). Following treatment with EB, a flow cytometry assay utilizing the Annexin V marker was used to detect EB-induced apoptosis.42 The levels of EB-GSH conjugates in the media were quantified to examine the role of GSTT1 in detoxification of EB. EB-GII (Scheme 1) was chosen as a representative EB-DNA adduct. EB-GII, along with its structural isomer EB-GI, is the most prevalent DNA adduct resulting from exposure to EB.43
Figure 1.
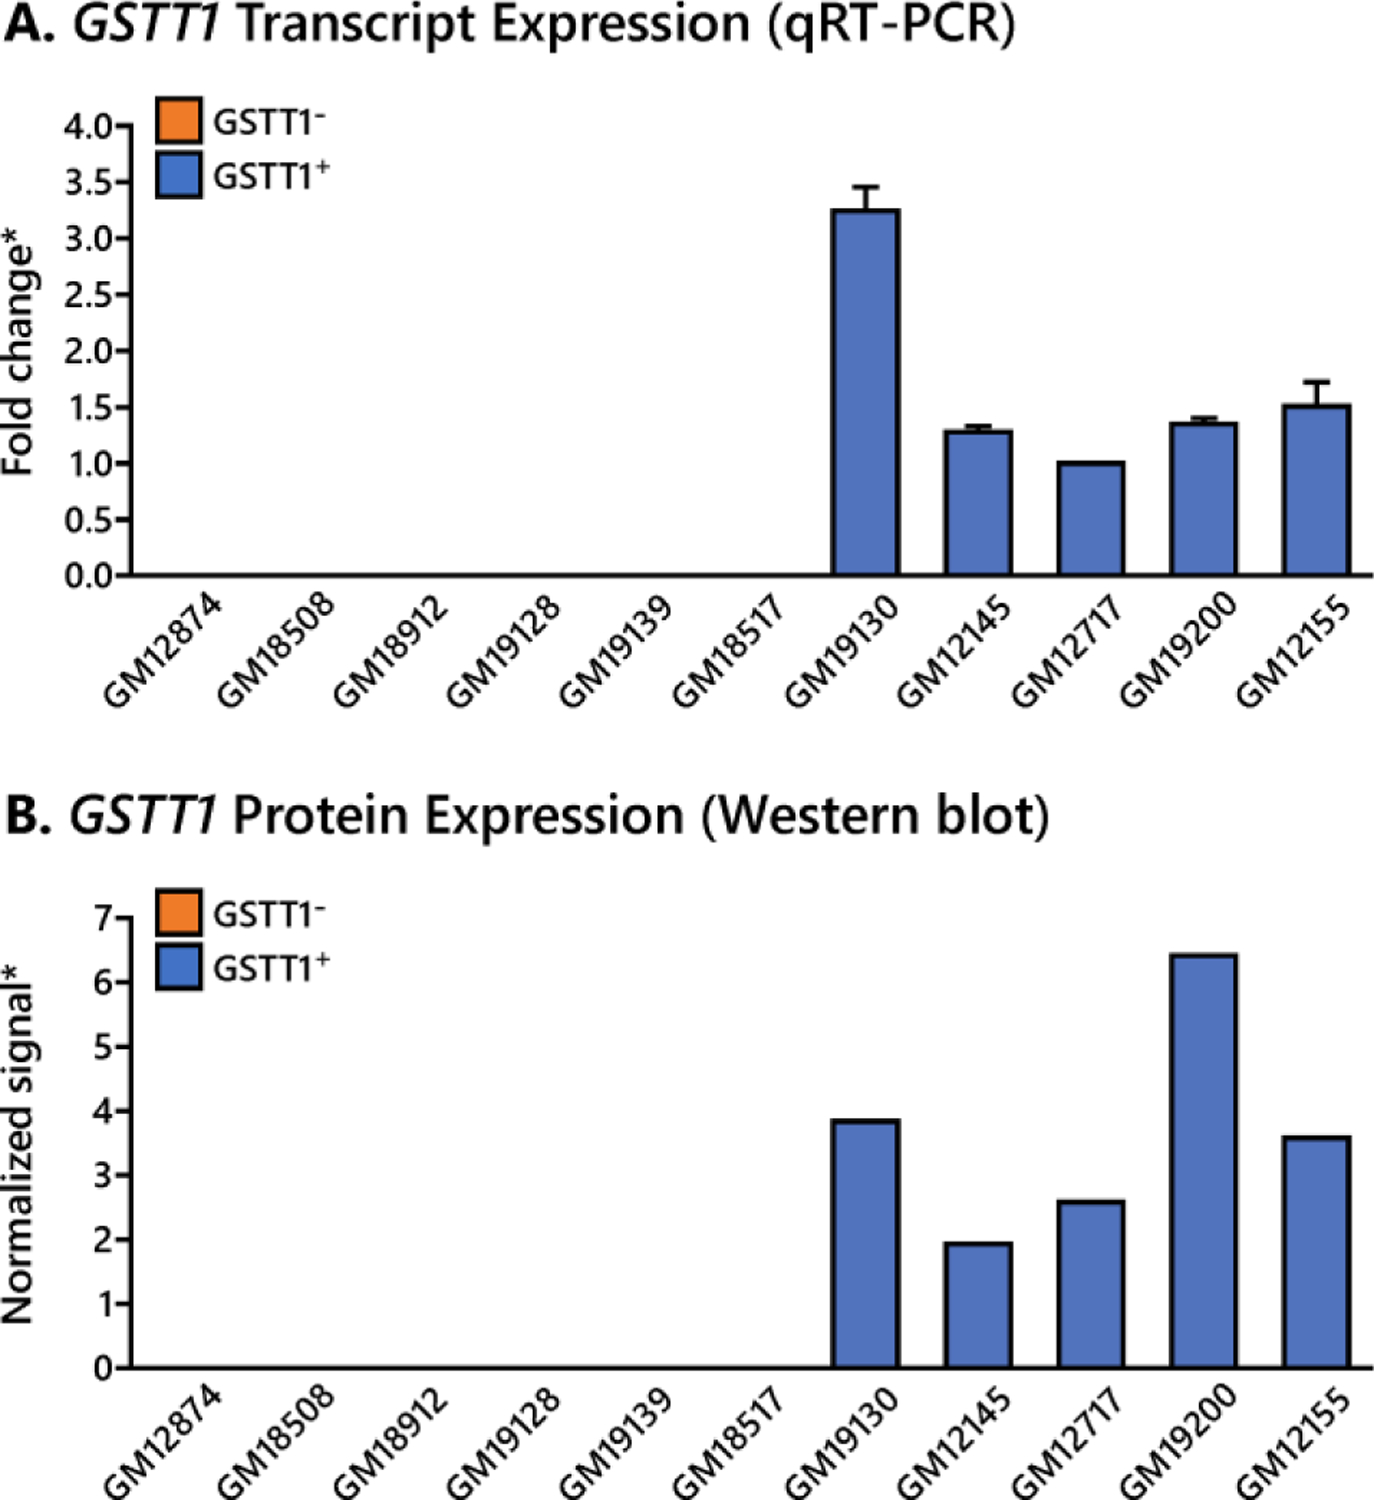
GSTT1 expression levels in HapMap cells. A. Expression of GSTT1 transcript in selected HapMap cell lines, confirmed by qualitative RT PCR. *Fold change noted with respect to cell line GM12717. B. Expression of GSTT1 protein in selected HapMap cell lines, confirmed by western blot. *Signal intensity normalized to vinculin signal. Values given represent average ± standard deviation.
Confirmation of GSTT1 expression at transcript and protein levels
GSTT1 gene expression levels in 11 HapMap cell lines were confirmed by RT-PCR, and GSTT1 protein levels were determined by western blot. GSTT1 expression levels correlated with the published genotype39 at both transcript and protein levels in all 11 cell lines selected for this study. Cell lines with GSTT1 deletion contained no GSTT1 transcripts or the corresponding protein, whereas the cell lines with at least one copy of the gene had detectable levels of transcript and protein (Figure 1).
Apoptosis in cells treated with EB
The ability of EB to induce apoptosis in HapMap cells was determined using a commercially available annexin V flow assay. Preliminary studies established that there was no change in the % apoptotic cells below 1 mM EB (data not shown). As shown in Figure 2, HapMap cell lines lacking GSTT1 were more sensitive to the toxic effects of EB. The average increase in the % of Annexin V positive cells in EB treated GSTT1− cell lines (9.4% ± 0.3%) was higher than in cell lines containing at least one copy of GSTT1 (4.1% ± 0.3%; p < 0.001).
Figure 2. EB causes an increase in the number of apoptotic cells.
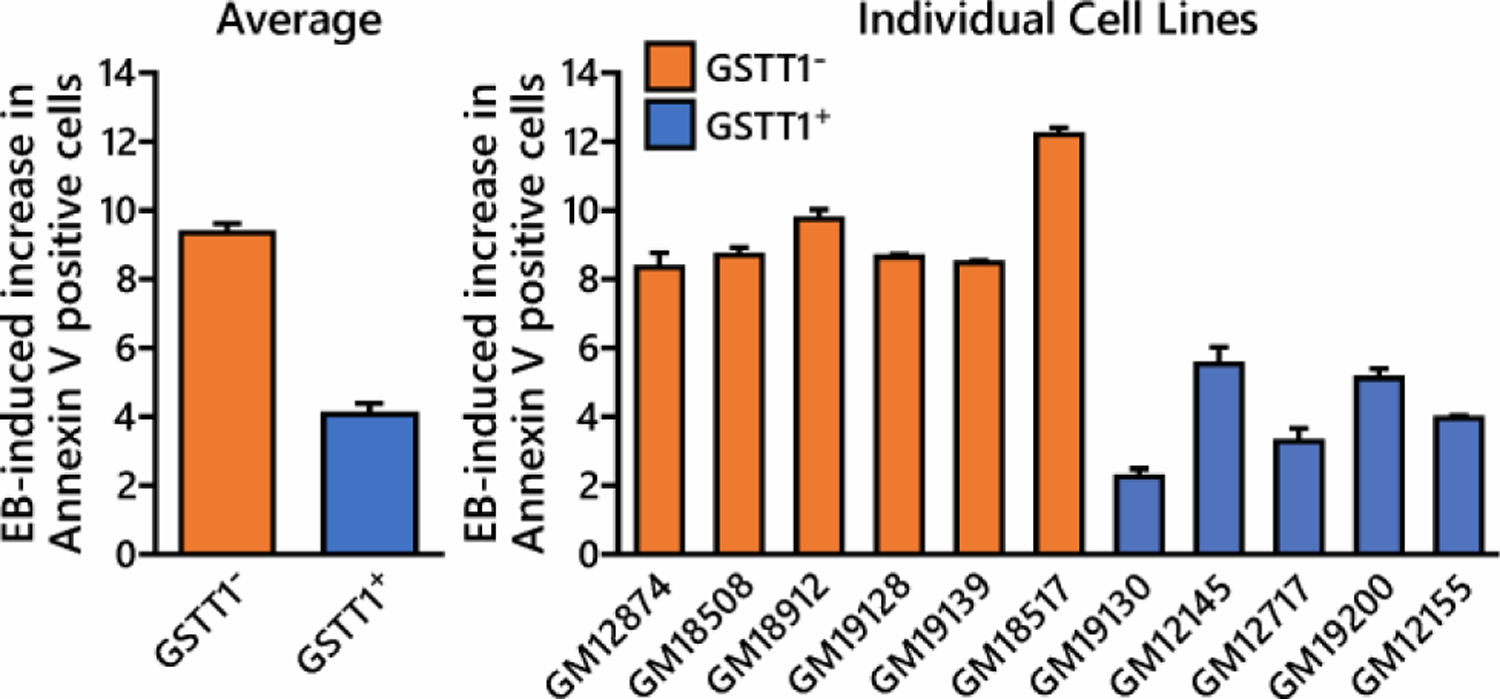
HapMap human lymphoblastoid cells (in triplicate) were exposed to 2 mM EB for 6 h. The cells were then incubated in fresh media for an additional 24 h prior to measuring apoptosis using Annexin V marker expression on the cell surface. The average increase in the % of Annexin V positive cells induced by EB in GSTT1− cells is significantly higher than that observed in GSTT+ cells, p < 0.001. Values represent average ± standard deviation.
HPLC-ESI+-MS/MS method development for EB-GSH in cellular media
In order to compare the amounts of EB that undergoes conjugation with GSH in GSTT1+ and GSTT1− human cells, a quantitative HPLC-ESI-MS/MS method for EB-GSH was developed (Scheme 1). Authentic standards of EB-GSH and 15N1, 13C2-EB-GSH were prepared in our laboratory and fully characterized by NMR (Figures S1–S3) and HR MS/MS (Figure 3). In animals and humans that have been exposed to EB, EB-GSH is further metabolized through the mercapturic acid pathway to form N-acetylcysteine conjugate (MHBMA), which was quantified in our previous studies.27, 44, 45 However, the enzymes responsible for further metabolism of GSH conjugates to mercapturic acids are mostly found in the liver and kidney tissues, and not in B-lymphocytes like the HapMap cell lines.46 Thus, EB-GSH is less likely to be further metabolized in this cell line model.
Figure 3.
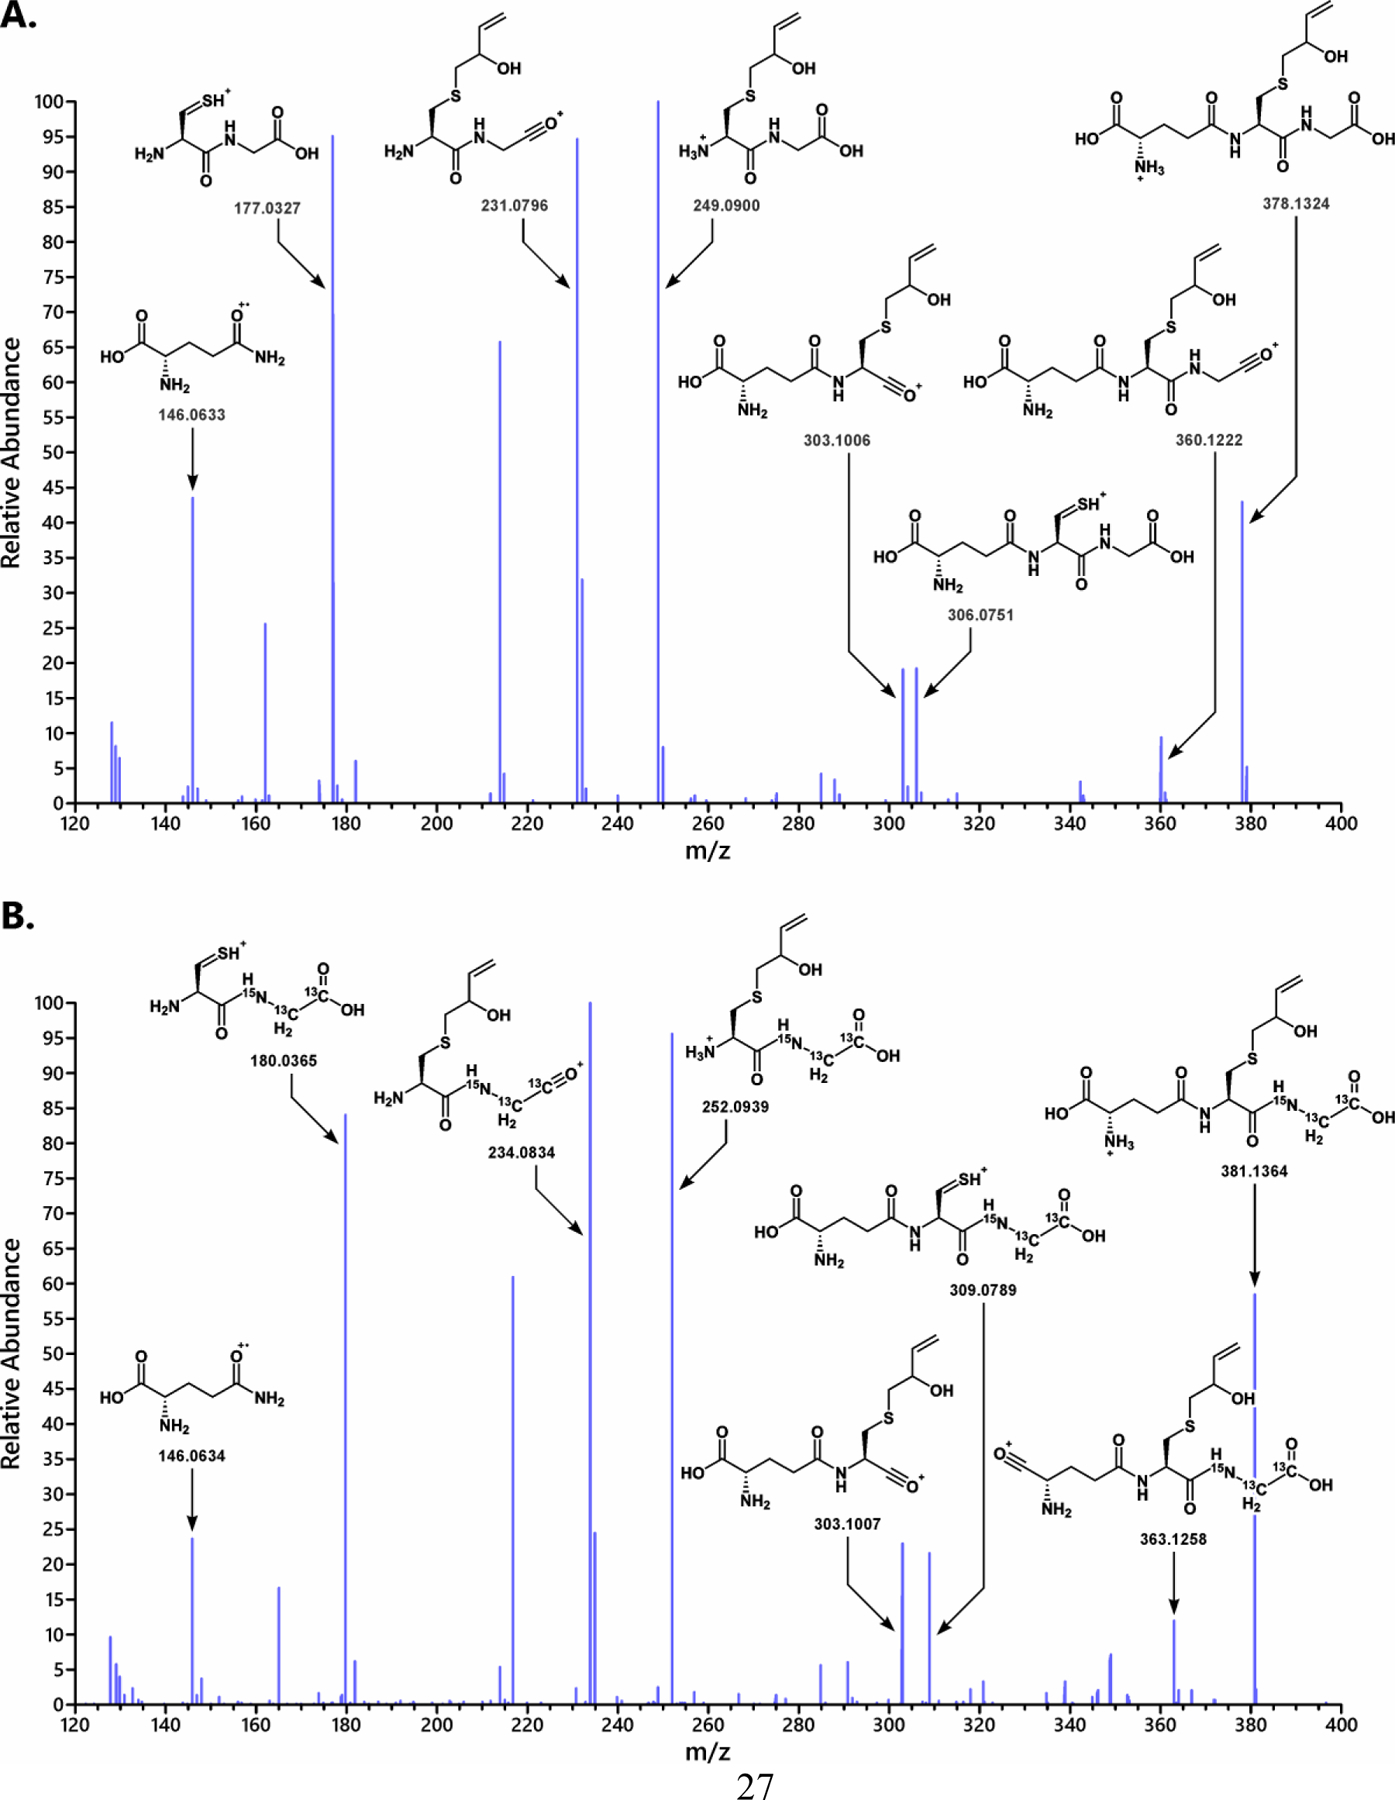
HR MS/MS spectra of EB-GSH (A) and 15N1,13C2-EB-GSH (B) obtained on an Orbitrap Q Exactive mass spectrometer.
EB-GSH and 15N1,13C2-EB-GSH were prepared by incubating GSH and 15N1,13C2- GSH with excess EB in the presence of recombinant GSTT1 protein. Both standards were isolated by HPLC. EB-GSH was quantified by proton NMR in D2O using methanol as an internal standard (Figures S1–S3), and 15N1,13C2-EB-GSH was quantified by mass spectrometry by spiking with known amounts of EB-GSH. These authentic standards were used for quantitative HPLC-ESI-MS/MS method development.
Early experiments revealed that EB-GSH was rapidly excreted from cells into the media. A two-step SPE method was devised to purify the conjugate. Samples were first acidified and subjected to mixed-mode strong cation exchange SPE (Oasis MCX cartridges, 30 mg/mL, Waters Corporation, Milford, MA) to remove salts, neutrals, and negatively charged compounds. The resulting eluent was dried down, reconstituted in a basic solution, and subjected to mixed-mode strong anion exchange SPE (Oasis MAX cartridges, 30 mg/mL, Waters Corporation, Milford, MA), to remove any contaminants that cannot hold a negative charge. The resulting eluent containing EB-GSH and its internal standard was subjected to capillary HPLC-ESI-MS/MS analysis. A valve switch was added to the beginning of the LC-MS run, to divert the first 2 min of the gradient would be sent to waste instead of the MS, as an added precaution to keep the MS system clean.
EB-GSH is a very polar molecule and has poor retention on most reverse phase HPLC columns. An Acquity UPLC HSS T3 (Waters Corporation, Milford, MA) column was chosen as it retained EB-GSH longer than 3 min. Next, several different mobile phases and gradients were tested. A gradient of 5 mM ammonium formate in water (pH 5) and acetonitrile afforded the best chromatography and ionization efficiency. The optimized chromatography conditions use a gradient of 5 mM ammonium formate in water (pH 5) and acetonitrile, where EB-GSH elutes at ~6.4 min (Figure 4).
Figure 4.
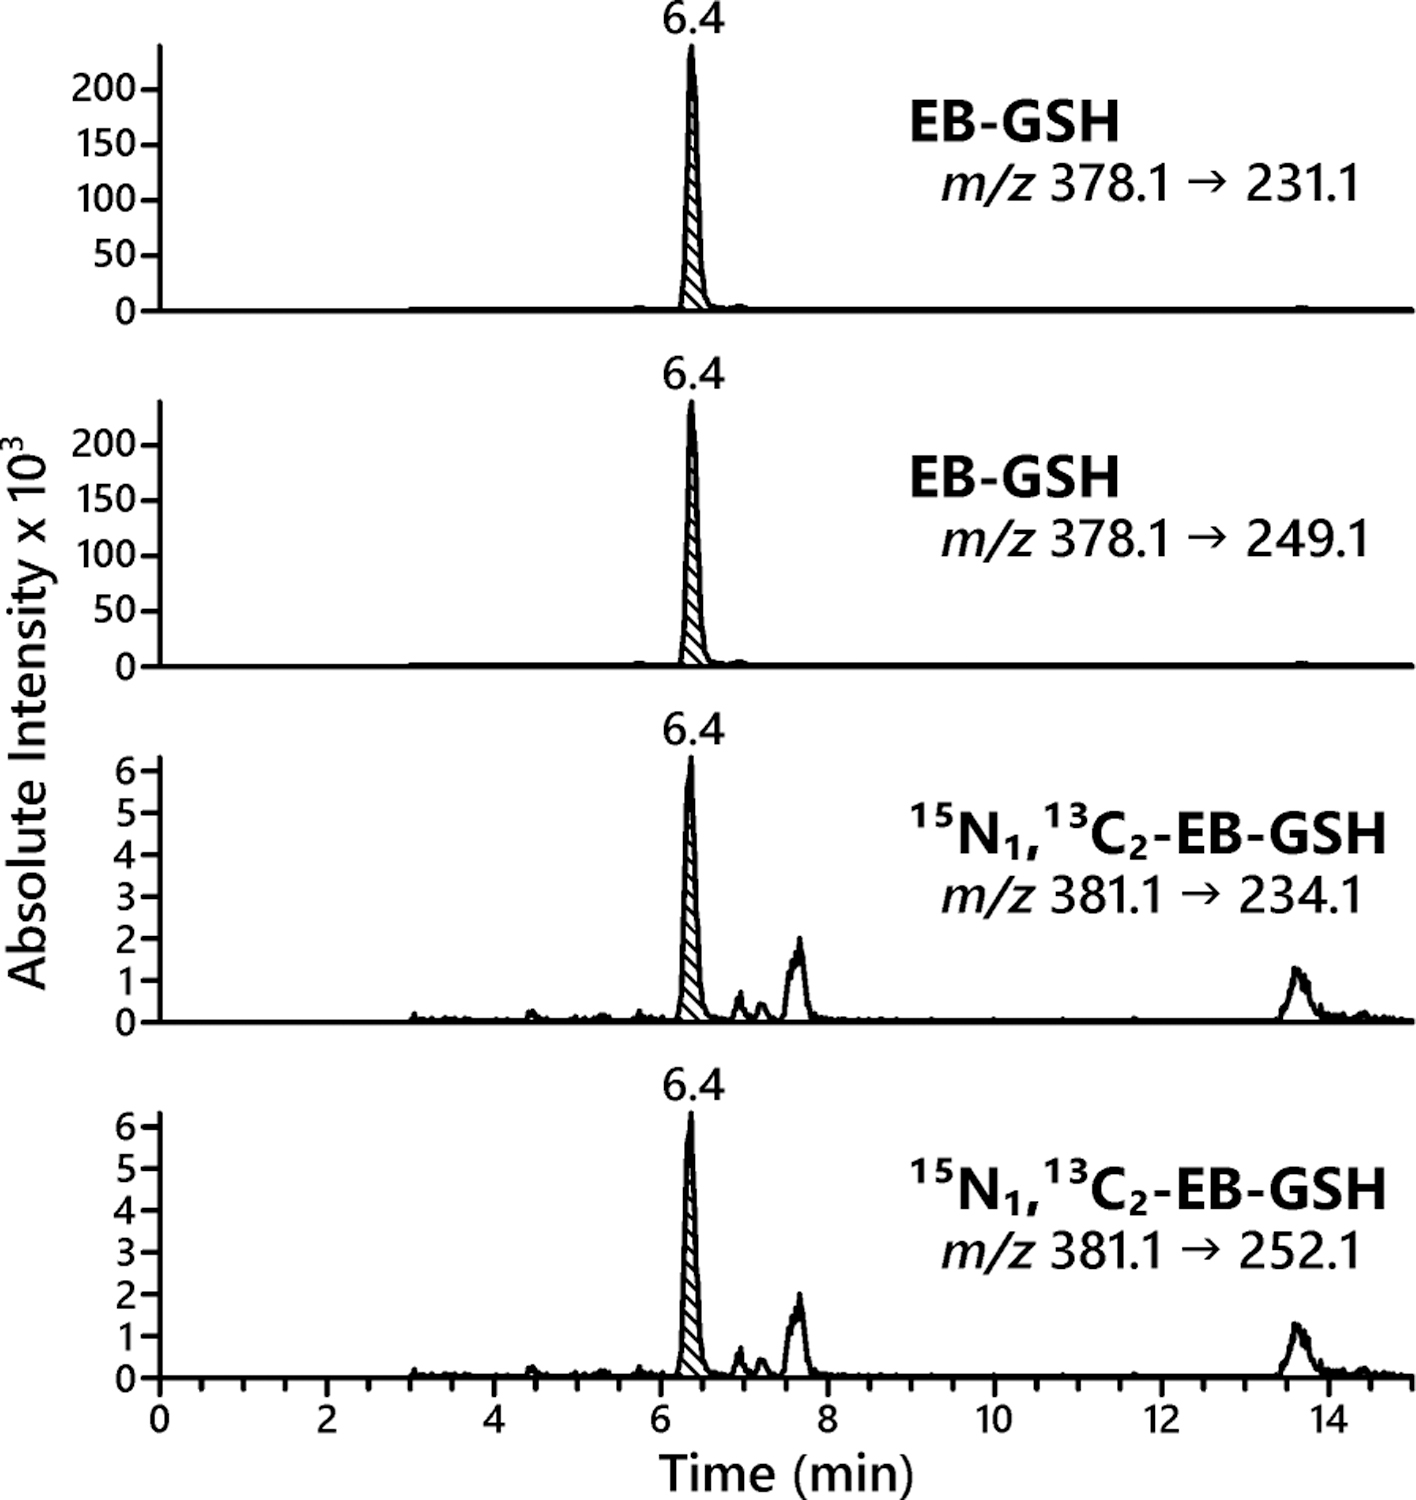
Isotope dilution HPLC-ESI+-MS/MS quantification of EB-GSH in cellular media from GM12874 cell line treated with 2 mM EB for 6 h.
Two SRM transitions for HPLC-ESI-MS/MS analysis of EB-GSH were selected corresponding to the loss of glutamate from the analyte (m/z 378.1 → 249.1), and a loss of both glutamate and water from the analyte (m/z 378.1 → 231.1). The first transition showed better reproducibility and sensitivity and this was selected for quantitative analyses, while the second transition was used for confirmation purposes. Similar MS/MS transitions (m/z 381.1 → 252.1 and m/z 378.1 → 234.1) were used for 15N1,13C2-EB-GSH (internal standard for quantification) (Figure 4).
Quantification of EB-GSH in cellular media of HapMap cells treated with 2 mM EB
To examine the effects of GSTT1 genotype on EB-GSH conjugate formation after EB exposure, 6 GSTT1−/− HapMap cell lines (GM12874, GM18508, GM18912, GM19128, GM19139, and GM18517), one GSTT1+/− line (GM12145), and four GSTT1+/+ cell lines (GM19130, GM12717, GM19200 and GM12155) were exposed to EB (2 mM) for 6 h. EB concentration was selected in order to match the treatment levels that resulted in detectable apoptosis (see above). Culture media (1 mL) from each cell line was removed and spiked with the 15N1,13C2-EB-GSH internal standard. The resulting samples were processed by two step SPE and analyzed by LC-ESI+-MS/MS methods as described above. EB-GSH amounts in treated cells varied between 1.0 and 5.9 nmol EB-GSH per mL media. No EB-GSH was observed in media from control cells. While inter-individual differences in EB-GSH levels between cell lines were seen, these differences did not correlate with GSTT1 expression (Figure 5A), probably due to non-enzymatic GSH conjugation reactions predominating at these high EB exposure levels. Indeed, when the treatment was repeated using physiologically relevant concentrations of EB (10 µM), EB-GSH conjugate formation was significantly higher in GSTT1+ cells (8.5 ± 4.8 vs 22.9 ± 10.7 pmol EB-GSH per mL media, p < 0.001, Figure 5B). Our results support a potentially important role of GSTT1 enzyme in detoxification of BD derived epoxides under physiological exposure levels.
Figure 5.
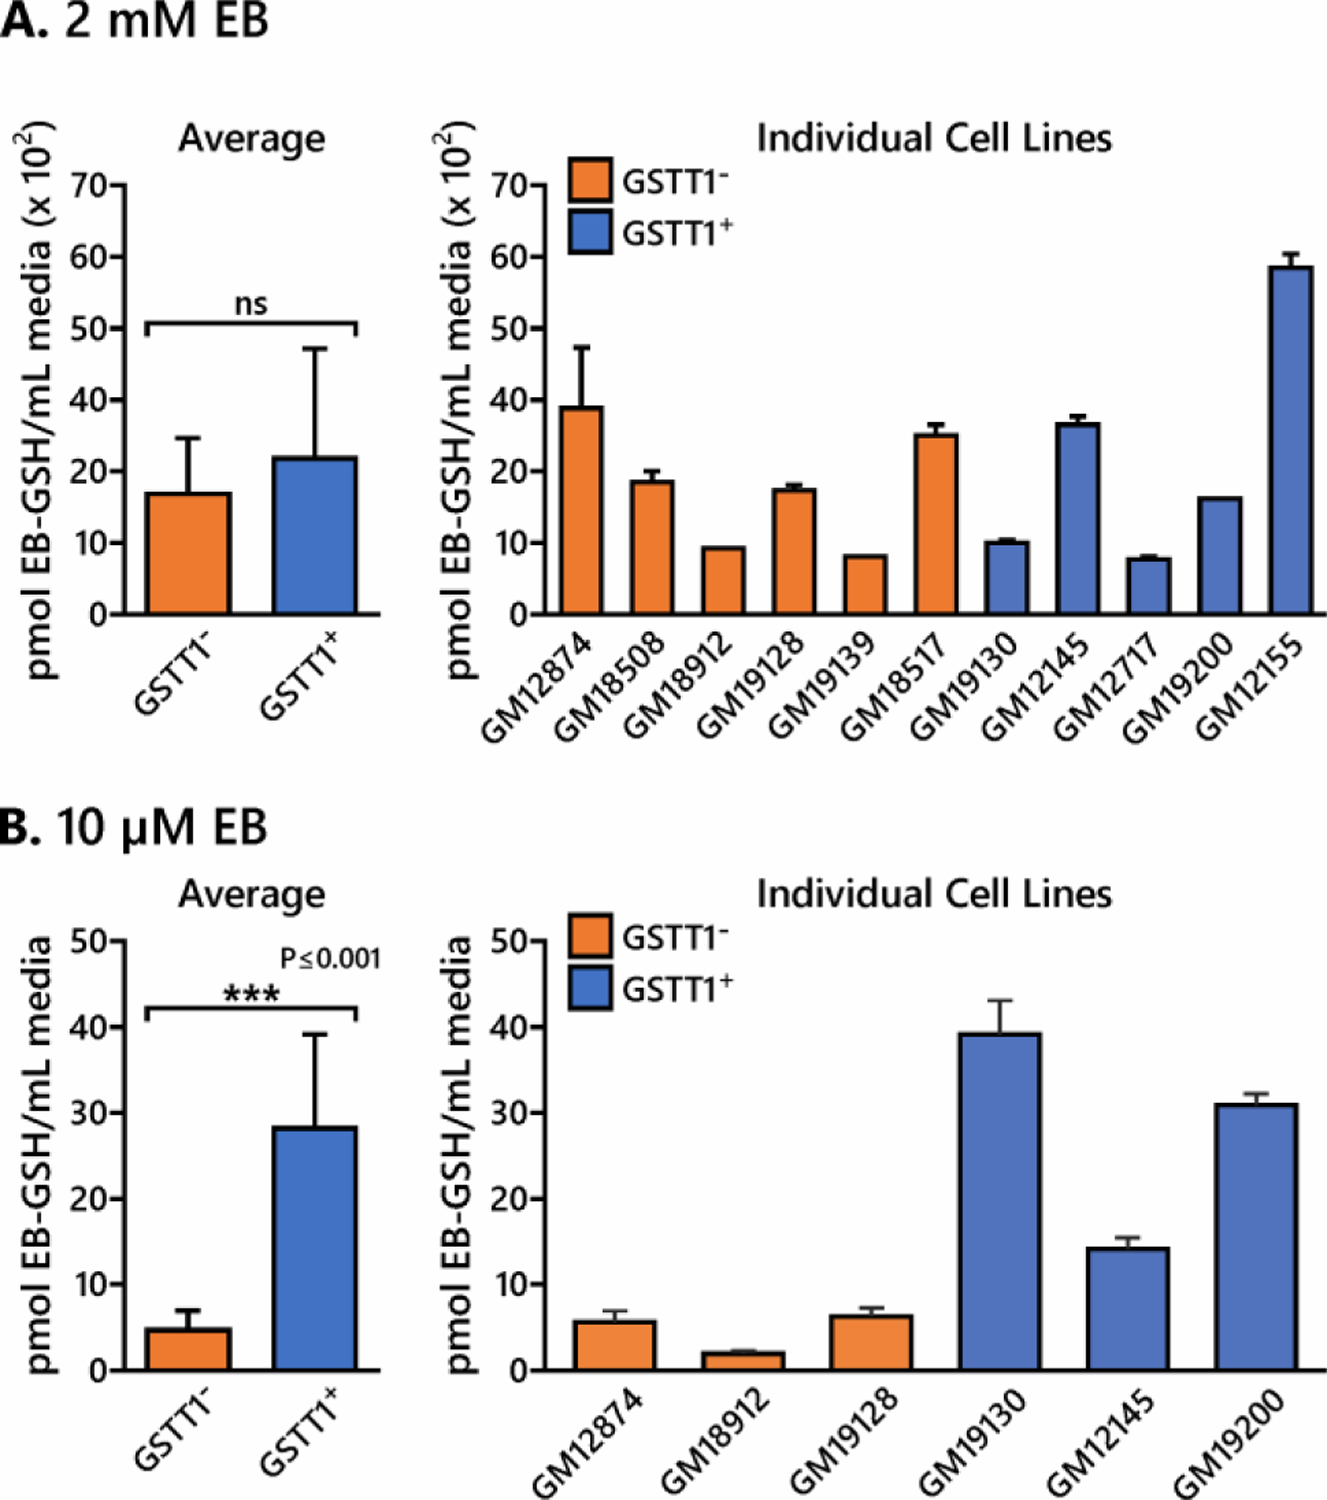
HPLC-ESI-MS/MS quantitation of EB-GSH conjugates in HapMap cell lines treated with 2 mM (A) or 10 µM EB (B) for 6 h in triplicate. Values represent averages ± standard deviation.
Quantification of EB-GII in genomic DNA of HapMap cells treated with EB
To examine the effects of GSTT1 genotype on DNA adduct formation after exposure to EB, 6 GSTT1− and 5 GSTT1+ HapMap cell lines were exposed to 2 mM EB for 6 h. Genomic DNA was extracted and analyzed by nanoLC-ESI+-MS/MS methods as described above. No EB-GII adducts were observed in genomic DNA isolated from control cells (data not shown). DNA adduct numbers in treated cells varied between 35.0 and 70.9 adducts per 107 nucleotides depending on the cell line. However, differences in EB-GII adduct formation in GSTT1−/− cell lines (48.3 ± 7.6 adducts per 107 nucleotides) and GSTT1+/+ cell lines (52.7 ± 8.6 adducts per 107 nucleotides) were not statistically significant (Figure 6A, p = 0.096).
Figure 6.
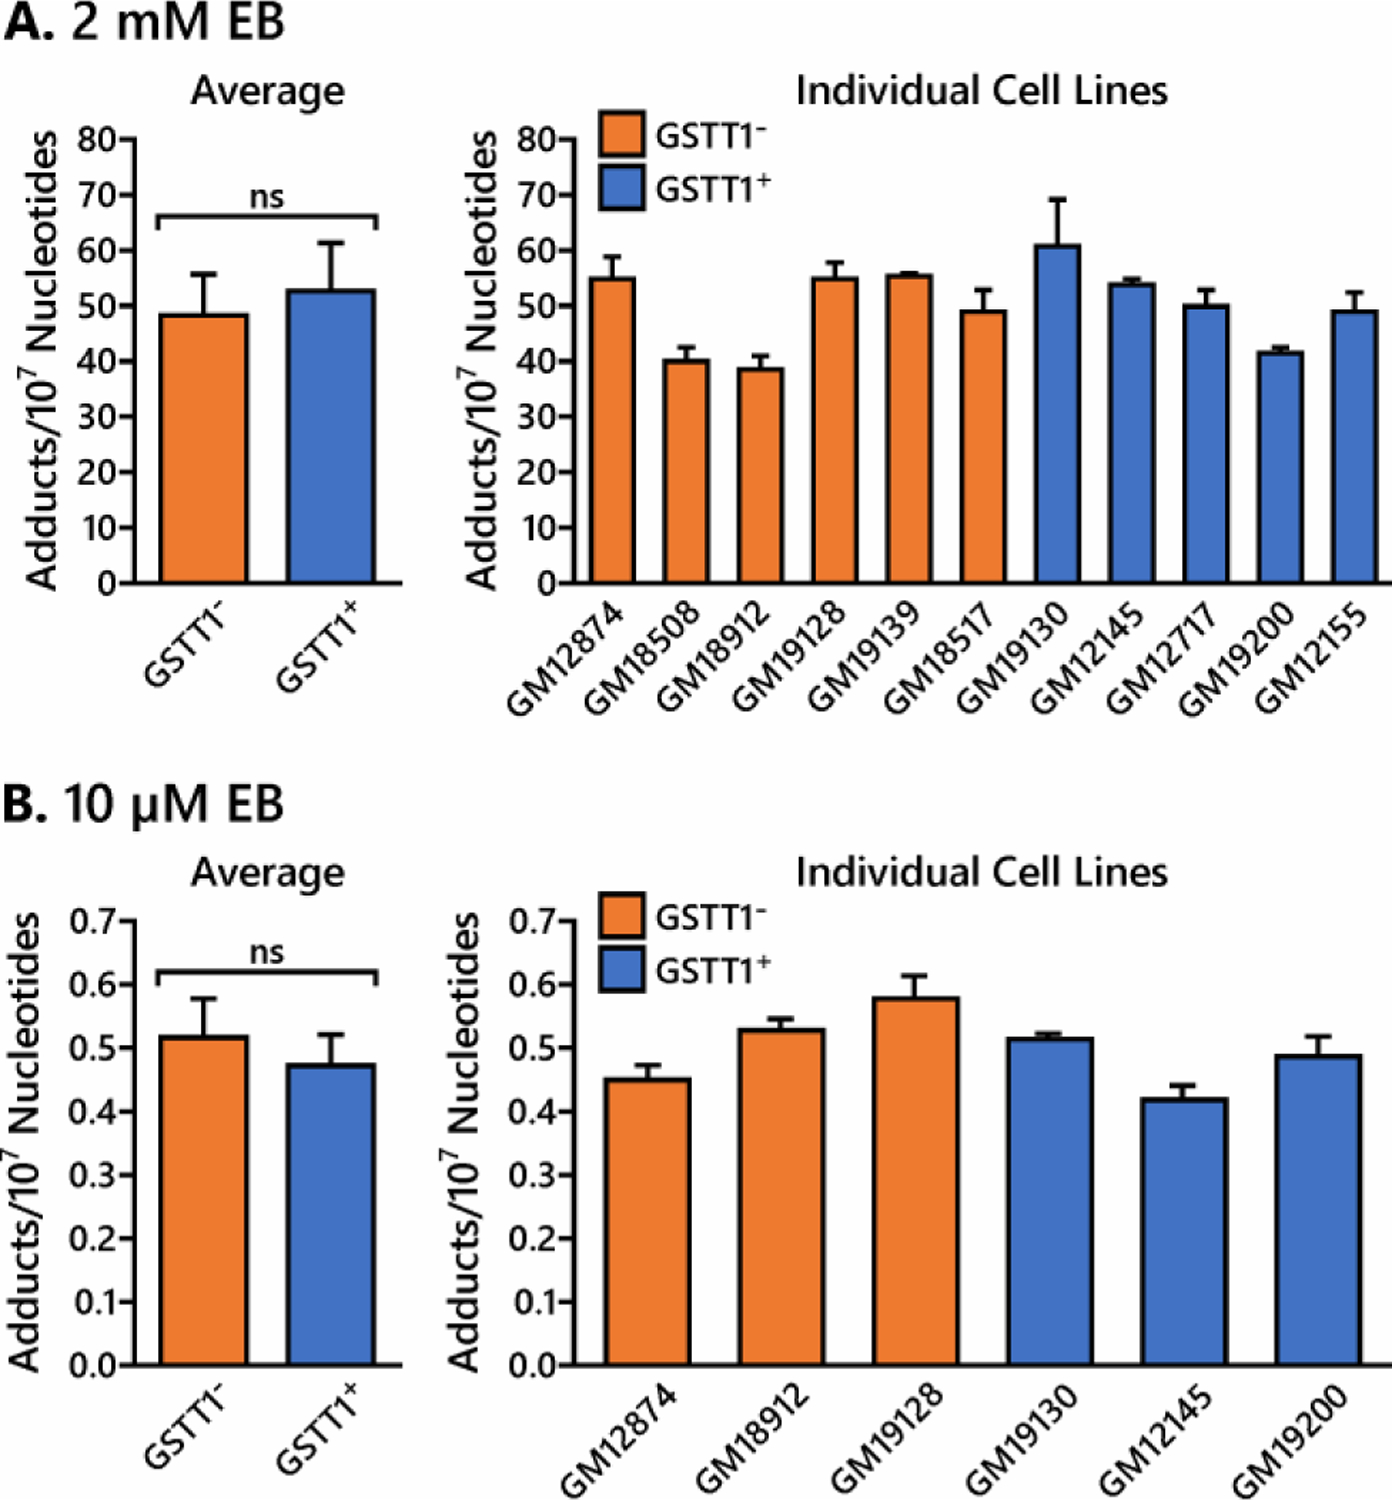
Quantitation of EB-GII adducts in GSTT1− and GSTT1+ cell lines. HapMap cells (3 million) were treated with 2 mM EB (A) and 10 µM EB (B) for 6 h in triplicate. DNA was extracted and EB-GII adduct levels were quantified by isotope dilution HPLC-ESI-MS/MS. Values represent averages ± standard deviation.
Similar results were observed in a subset of 6 cell lines (3 GSTT1−, 3 GSTT1+) treated with 10 µM EB for 6 h. EB-GII adduct levels in cells treated with 10 µM EB were approximately 100-fold lower than those in cells treated with 2 mM EB (0.05 ± 0.01 vs 50.5 ± 8.3 adducts per 107 nucleotides) (Figure 6). The difference in EB-GII amounts in genomic DNA of GSTT1− (5.2 ± 0.6 adducts per 108 nucleotides) and GSTT1+ cell lines (4.7 ± 0.5 adducts per 108 nucleotides) were not statistically significant (Figure 6B, p = 0.102).
Discussion
GSTT1 is a key enzyme in detoxification pathway of BD-derived epoxides. It catalyzes the conjugation of these electrophilic species with glutathione, leading to their detoxification and excretion in urine following further processing by the mercapturic acid pathway.47–49 Previous studies have shown that urinary levels of MHBMA, the ultimate product of EB-GSH conjugation excreted in urine, was associated with cigarette smoking and GSTT1 copy number.25, 26 Specifically, smokers carrying one copy of GSTT1 gene excreted more MHBMA than GSTT1 null individuals, and subject with two copies of the gene exhibited proportionally higher levels of the conjugate.25, 26 Genome-wide association analyses of the data indicated that GSTT1 copy number largely accounted for ethnic differences in MHBMA levels between Caucasian, Japanese American, and African American smokers.27
In the present study, we investigated the effects of GSTT1 gene on BD metabolism, EB-DNA adduct formation, and apoptotic cell death in human HapMap cells after exposure to EB. Reduced GSTT1 activity was anticipated to impair metabolic detoxification of EB via glutathione conjugation, potentially increasing their concentrations in cells and leading to higher levels of DNA adducts and increased toxicity. Human EBV-transformed lymphoblastoid cell lines were selected from the HapMap project designed to describe the common patterns of human DNA sequence variation and to represent the genetic diversity of human populations.34 Six GSTT1−/− cell lines and five cell lines containing at least one copy of GSTT1 gene were chosen for this investigation.
GSTT1− cells exhibited a higher sensitivity towards EB-induced apoptosis as determined by Annexin V flow cytometry assay (Figure 2) and produced higher levels of EB-GSH conjugates when treated with 10 µM EB (Figure 5B). These results support the hypothesis that GSTT1 has a protective effect against EB toxicity. However, GSTT1 expression had no effect on EB-GSH conjugate levels in lymphoblasts treated with high concentrations of EB (2 mM) (Figure 5A). This can be explained by non-enzymatic conjugation of GSH with EB and/or contributions of other GST isoforms under these conditions. While previous studies found that GSTT1 has the highest activity in detoxification of BD derived epoxides, GST mu 1 (GSTM1) and GST theta 2 (GSTT2) could also be involved.27, 50, 51 However, when EB-GSH levels in EB treated cells were stratified by GSTM1 status, no significant difference in adduct formation was observed (Figure S4).
Although HapMap cells are a valuable biological resource for characterizing human variability in response to environmental chemicals,52 these cells have relatively low enzymatic activity in regard to xenobiotic metabolism. In humans, liver hepatocytes are the primary source of GSH conjugation.46 While the expression of GSTT1 was confirmed in all five GSTT1+ cell lines (Figure 1), expression levels in HapMap cells were low as compared to its amounts in hepatocytes (data not shown). This inherently low levels of GSTT1 activity in lymphoblastoid cell lines may results in saturation of enzymatic detoxification pathways when cells are exposed to mM concentrations of EB, with non-enzymatic GSH conjugation contributing to the majority of EB-GSH formation.
Another gene critically important for detoxification of BD-derived epoxides is microsomal epoxide hydrolase (mEH coded by the EPHX gene). mEH enzyme catalyzes epoxide hydrolysis to the corresponding diols, which are typically unreactive towards DNA and therefore show reduced genotoxicity. Wickliffe et al. have shown that the frequency of DEB-induced SCE in human lymphocytes was dependent on EPHX1 polymorphisms.53 Several polymorphic sites within the 5’-flanking region of the EPXH gene have been identified, which are likely to lead to altered levels of gene expression.54 The frequency of low mEH activity in WH, AA, and JA individuals is 28, 21, and 44 %, respectively.55, 56 These genetic variations are likely to affect an individual’s sensitivity to butadiene-induced mutagenesis and carcinogenesis.57 Unfortunately, our western blotting and RT PCR experiments revealed that EPHX1 expression levels in HapMap cells were below the limit of detection. Therefore, studies in a different set of cell lines are needed to elucidate the role of EPHX1 in detoxification of butadiene epoxides.
The differences in EB-Gua DNA adduct levels in EB treated HapMap cells were not statistically different between GSTT1+ and GSTT1− cells (Figure 6), despite significant variation in formation of GSH conjugates (Figure 5B). Our earlier studies revealed that the excretion of urinary EB-Gua adducts by current smokers was influenced by smoking status and ethnicity, but did not correlate with urinary levels of BD-mercapturic acids.28, 58 It is possible that other factors such as polymorphisms in DNA repair genes have a greater effect on BD-DNA adduct levels in treated cells.
In summary, our results indicate that GSTT1 protects HapMap cells against EB-mediated apoptosis and plays an important role in metabolic detoxification of EB under physiological exposure concentrations. In addition, our findings suggest that another GST enzyme may catalyze the same conjugation reaction in the absence of GSTT1. Future studies in human cells are needed to elucidate the role of other metabolic enzymes such as GSTT2, EPHX1, and DNA repair genes in defining human sensitivity to butadiene.
Supplementary Material
Acknowledgements
We thank Todd Rappe for his help with NMR analyses, Karin Vevang for technical assistance and data analysis, Gunnar Boysen for extensive manuscript edits, and Bob Carlson for his help with the figures for this manuscript.
Funding Sources
This study was supported by a Program Project grant from the National Cancer Institute (5P01CA138338). NMR experiments were supported by Grant 1S10OD021536 (G. Veglia) from National Institute of General Medical Sciences.
Footnotes
The authors declare no competing financial interest.
Final version of this manuscript is available online at https://pubs.acs.org/doi/10.1021/acs.chemrestox.9b00517
References
- 1.Siegel RL, Miller KD, and Jemal A (2019) Cancer statistics, 2019. CA Cancer J Clin 69, 7–34. [DOI] [PubMed] [Google Scholar]
- 2.American Cancer Society. (2019) Cancer Facts & Figures 2019. ACS, Atlanta, GA. [Google Scholar]
- 3.Stram DO, Park SL, Haiman CA, Murphy SE, Patel Y, Hecht SS, and Le Marchand L (2019) Racial/ethnic differences in lung cancer incidence in the multiethnic cohort study: An update. J Natl Cancer Inst 10.1093/jnci/djy206. [Epub ahead of print]. [DOI] [PMC free article] [PubMed]
- 4.Haiman CA, Stram DO, Wilkens LR, Pike MC, Kolonel LN, Henderson BE, and Le Marchand L (2006) Ethnic and racial differences in the smoking-related risk of lung cancer. N Engl J Med 354, 333–342. [DOI] [PubMed] [Google Scholar]
- 5.International Agency for Research on Cancer. (2012) IARC Monographs on the Evaluation of Carcinogenic Risk to Humans, Vol. 100F. Chemical Agents and Related Occupations. IARC, Lyon, France. [PMC free article] [PubMed] [Google Scholar]
- 6.White WC (2007) Butadiene production process overview. Chem Biol Interact 166, 10–14. [DOI] [PubMed] [Google Scholar]
- 7.Kagawa J (2002) Health effects of diesel exhaust emissions--a mixture of air pollutants of worldwide concern. Toxicology 181–182, 349–353. [DOI] [PubMed] [Google Scholar]
- 8.Brunnemann KD, Kagan MR, Cox JE, and Hoffmann D (1990) Analysis of 1,3-butadiene and other selected gas-phase components in cigarette mainstream and sidestream smoke by gas chromatography-mass selective detection. Carcinogenesis 11, 1863–1868. [DOI] [PubMed] [Google Scholar]
- 9.Fowles J, and Dybing E (2003) Application of toxicological risk assessment principles to the chemical constituents of cigarette smoke. Tob Control 12, 424–430. [DOI] [PMC free article] [PubMed] [Google Scholar]
- 10.Melnick RL, Huff J, Chou BJ, and Miller RA (1990) Carcinogenicity of 1,3-butadiene in C57BL/6 x C3H F1 mice at low exposure concentrations. Cancer Res 50, 6592–6599. [PubMed] [Google Scholar]
- 11.Owen PE, Glaister JR, Gaunt IF, and Pullinger DH (1987) Inhalation toxicity studies with 1,3-butadiene. 3. Two year toxicity/carcinogenicity study in rats. Am Ind Hyg Assoc J 48, 407–413. [DOI] [PubMed] [Google Scholar]
- 12.Delzell E, Sathiakumar N, Hovinga M, Macaluso M, Julian J, Larson R, et al. (1996) A follow-up study of synthetic rubber workers. Toxicology 113, 182–189. [DOI] [PubMed] [Google Scholar]
- 13.Sathiakumar N, Graff J, Macaluso M, Maldonado G, Matthews R, and Delzell E (2005) An updated study of mortality among North American synthetic rubber industry workers. Occup Environ Med 62, 822–829. [DOI] [PMC free article] [PubMed] [Google Scholar]
- 14.Duescher RJ, and Elfarra AA (1994) Human liver microsomes are efficient catalysts of 1,3-butadiene oxidation: evidence for major roles by cytochromes P450 2A6 and 2E1. Arch Biochem Biophys 311, 342–349. [DOI] [PubMed] [Google Scholar]
- 15.Csanady GA, Guengerich FP, and Bond JA (1992) Comparison of the biotransformation of 1,3-butadiene and its metabolite, butadiene monoepoxide, by hepatic and pulmonary tissues from humans, rats and mice. Carcinogenesis 13, 1143–1153. [DOI] [PubMed] [Google Scholar]
- 16.Cochrane JE, and Skopek TR (1994) Mutagenicity of butadiene and its epoxide metabolites: I. Mutagenic potential of 1,2-epoxybutene, 1,2,3,4-diepoxybutane and 3,4-epoxy-1,2-butanediol in cultured human lymphoblasts. Carcinogenesis 15, 713–717. [DOI] [PubMed] [Google Scholar]
- 17.Kotapati S, Wickramaratne S, Esades A, Boldry EJ, Quirk Dorr D, Pence MG, et al. (2015) Polymerase bypass of N6-deoxyadenosine adducts derived from epoxide metabolites of 1,3-butadiene. Chem Res Toxicol 28, 1496–1507. [DOI] [PMC free article] [PubMed] [Google Scholar]
- 18.Kowal EA, Wickramaratne S, Kotapati S, Turo M, Tretyakova N, and Stone MP (2014) Major groove orientation of the (2S)-N6-(2-hydroxy-3-buten-1-yl)-2’-deoxyadenosine DNA adduct induced by 1,2-epoxy-3-butene. Chem Res Toxicol 27, 1675–1686. [DOI] [PMC free article] [PubMed] [Google Scholar]
- 19.Wickramaratne S, Banda DM, Ji S, Manlove AH, Malayappan B, Nunez NN, et al. (2016) Base excision repair of N6-deoxyadenosine adducts of 1,3-butadiene. Biochemistry 55, 6070–6081. [DOI] [PMC free article] [PubMed] [Google Scholar]
- 20.Minca EC, and Kowalski D (2011) Replication fork stalling by bulky DNA damage: localization at active origins and checkpoint modulation. Nucleic Acids Res 39, 2610–2623. [DOI] [PMC free article] [PubMed] [Google Scholar]
- 21.Hemminki K (1993) DNA adducts, mutations and cancer. Carcinogenesis 14, 2007–2012. [DOI] [PubMed] [Google Scholar]
- 22.Basu AK (2018) DNA damage, mutagenesis and cancer. Int J Mol Sci 19. [DOI] [PMC free article] [PubMed] [Google Scholar]
- 23.Swenberg JA, Boysen G, Georgieva N, Bird MG, and Lewis RJ (2007) Future directions in butadiene risk assessment and the role of cross-species internal dosimetry. Chem Biol Interact 166, 78–83. [DOI] [PubMed] [Google Scholar]
- 24.Swenberg JA, Koc H, Upton PB, Georguieva N, Ranasinghe A, Walker VE, and Henderson R (2001) Using DNA and hemoglobin adducts to improve the risk assessment of butadiene. Chem Biol Interact 135–136, 387–403. [DOI] [PubMed] [Google Scholar]
- 25.Roethig HJ, Munjal S, Feng S, Liang Q, Sarkar M, Walk RA, and Mendes PE (2009) Population estimates for biomarkers of exposure to cigarette smoke in adult U.S. cigarette smokers. Nicotine Tob Res 11, 1216–1225. [DOI] [PubMed] [Google Scholar]
- 26.Carmella SG, Chen M, Han S, Briggs A, Jensen J, Hatsukami DK, and Hecht SS (2009) Effects of smoking cessation on eight urinary tobacco carcinogen and toxicant biomarkers. Chem Res Toxicol 22, 734–741. [DOI] [PMC free article] [PubMed] [Google Scholar]
- 27.Boldry EJ, Patel YM, Kotapati S, Esades A, Park SL, Tiirikainen M, et al. (2017) Genetic determinants of 1,3-butadiene metabolism and detoxification in three populations of smokers with different risks of lung cancer. Cancer Epidemiol Biomarkers Prev 26, 1034–1042. [DOI] [PMC free article] [PubMed] [Google Scholar]
- 28.Sangaraju D, Boldry EJ, Patel YM, Walker V, Stepanov I, Stram D, et al. (2017) Isotope dilution nanoLC/ESI+-HRMS3 quantitation of urinary N7-(1-hydroxy-3-buten-2-yl) guanine adducts in humans and their use as biomarkers of exposure to 1,3-butadiene. Chem Res Toxicol 30, 678–688. [DOI] [PMC free article] [PubMed] [Google Scholar]
- 29.Norppa H (2004) Cytogenetic biomarkers and genetic polymorphisms. Toxicol Lett 149, 309–334. [DOI] [PubMed] [Google Scholar]
- 30.Norppa H (2003) Genetic susceptibility, biomarker respones, and cancer. Mutat Res 544, 339–348. [DOI] [PubMed] [Google Scholar]
- 31.de Vries PS, Sabater-Lleal M, Chasman DI, Trompet S, Ahluwalia TS, Teumer A, et al. (2017) Comparison of HapMap and 1000 genomes reference panels in a large-scale genome-wide association study. PLoS One 12, e0167742. [DOI] [PMC free article] [PubMed] [Google Scholar]
- 32.International HapMap Consortium. (2003) The International HapMap Project. Nature 426, 789–796. [DOI] [PubMed] [Google Scholar]
- 33.Yamamura T, Hikita J, Bleakley M, Hirosawa T, Sato-Otsubo A, Torikai H, et al. (2012) HapMap SNP Scanner: an online program to mine SNPs responsible for cell phenotype. Tissue Antigens 80, 119–125. [DOI] [PMC free article] [PubMed] [Google Scholar]
- 34.Consortium IH (2005) A haplotype map of the human genome. Nature 437, 1299–1320. [DOI] [PMC free article] [PubMed] [Google Scholar]
- 35.International Agency for Research on Cancer. (2008) 1,3-butadiene, ethylene oxide, and vinyl halides (vinyl flouride, vinyl chloride and vinyl bromide), In IARC Monographs on the Evaluation of Carcinogenic Risks to Humans, Vol. 97, Lyon, France. [PMC free article] [PubMed] [Google Scholar]
- 36.Tretyakova N, Lin Y, Sangaiah R, Upton PB, and Swenberg JA (1997) Identification and quantitation of DNA adducts from calf thymus DNA exposed to 3,4-epoxy-1-butene. Carcinogenesis 18, 137–147. [DOI] [PubMed] [Google Scholar]
- 37.Citti L, Gervasi PG, Turchi G, Bellucci G, and Bianchini R (1984) The reaction of 3,4-epoxy-1-butene with deoxyguanosine and DNA in vitro: synthesis and characterization of the main adducts. Carcinogenesis 5, 47–52. [DOI] [PubMed] [Google Scholar]
- 38.Cho SH, Loecken EM, and Guengerich FP (2010) Mutagenicity of a glutathione conjugate of butadiene diepoxide. Chem Res Toxicol 23, 1544–1546. [DOI] [PMC free article] [PubMed] [Google Scholar]
- 39.McCarroll SA, Hadnott TN, Perry GH, Sabeti PC, Zody MC, Barrett JC, et al. (2006) Common deletion polymorphisms in the human genome. Nat Genet 38, 86–92. [DOI] [PubMed] [Google Scholar]
- 40.Michaelson-Richie ED, Ming X, Codreanu SG, Loeber RL, Liebler DC, Campbell C, and Tretyakova NY (2011) Mechlorethamine-induced DNA-protein cross-linking in human fibrosarcoma (HT1080) cells. J Proteome Res 10, 2785–2796. [DOI] [PMC free article] [PubMed] [Google Scholar]
- 41.Sangaraju D, Villalta PW, Wickramaratne S, Swenberg J, and Tretyakova N (2014) NanoLC/ESI+ HRMS3 quantitation of DNA adducts induced by 1,3-butadiene. J Am Soc Mass Spectrom 25, 1124–1135. [DOI] [PMC free article] [PubMed] [Google Scholar]
- 42.Vermes I, Haanen C, Steffens-Nakken H, and Reutelingsperger C (1995) A novel assay for apoptosis. Flow cytometric detection of phosphatidylserine expression on early apoptotic cells using fluorescein labelled Annexin V. J Immunol Methods 184, 39–51. [DOI] [PubMed] [Google Scholar]
- 43.Tretyakova N, Chiang SY, Walker VE, and Swenberg JA (1998) Quantitative analysis of 1,3-butadiene-induced DNA adducts in vivo and in vitro using liquid chromatography electrospray ionization tandem mass spectrometry. J Mass Spectrom 33, 363–376. [DOI] [PubMed] [Google Scholar]
- 44.Park SL, Kotapati S, Wilkens LR, Tiirikainen M, Murphy SE, Tretyakova N, and Le Marchand L (2014) 1,3-Butadiene exposure and metabolism among Japanese American, Native Hawaiian, and White smokers. Cancer Epidemiol Biomarkers Prev 23, 2240–2249. [DOI] [PMC free article] [PubMed] [Google Scholar]
- 45.Kotapati S, Esades A, Matter B, Le C, and Tretyakova N (2015) High throughput HPLC-ESI−-MS/MS methodology for mercapturic acid metabolites of 1,3-butadiene: Biomarkers of exposure and bioactivation. Chem Biol Interact 241, 23–31. [DOI] [PMC free article] [PubMed] [Google Scholar]
- 46.Hinchman CA, and Ballatori N (1994) Glutathione conjugation and conversion to mercapturic acids can occur as an intrahepatic process. J Toxicol Environ Health 41, 387–409. [DOI] [PubMed] [Google Scholar]
- 47.Kasparkova J, Novakova O, Vrana O, Intini F, Natile G, and Brabec V (2006) Molecular aspects of antitumor effects of a new platinum (IV) drug. Mol Pharmacol 70, 1708–1719. [DOI] [PubMed] [Google Scholar]
- 48.Dolan ME, Roy SK, Fasanmade AA, Paras PR, Schilsky RL, and Ratain MJ (1998) O6-Benzylguanine in humans: metabolic, pharmacokinetic, and pharmacodynamic findings. J Clin Oncol 16, 1803–1810. [DOI] [PubMed] [Google Scholar]
- 49.Hoes I, Van Dongen W, Lemiere F, Esmans EL, Van Bockstaele D, and Berneman ZN (2000) Comparison between capillary and nano liquid chromatography-electrospray mass spectrometry for the analysis of minor DNA-melphalan adducts. J Chromatogr B Biomed Sci Appl 748, 197–212. [DOI] [PubMed] [Google Scholar]
- 50.Wiencke JK, Pemble S, Ketterer B, and Kelsey KT (1995) Gene deletion of glutathione S-transferase theta: correlation with induced genetic damage and potential role in endogenous mutagenesis. Cancer Epidemiol Biomarkers Prev 4, 253–259. [PubMed] [Google Scholar]
- 51.Fustinoni S, Soleo L, Warholm M, Begemann P, Rannug A, Neumann HG, et al. (2002) Influence of metabolic genotypes on biomarkers of exposure to 1,3-butadiene in humans. Cancer Epidemiol Biomarkers Prev 11, 1082–1090. [PubMed] [Google Scholar]
- 52.O’Shea SH, Schwarz J, Kosyk O, Ross PK, Ha MJ, Wright FA, and Rusyn I (2011) In vitro screening for population variability in chemical toxicity. Toxicol Sci 119, 398–407. [DOI] [PMC free article] [PubMed] [Google Scholar]
- 53.Schilsky RL, Dolan ME, Bertucci D, Ewesuedo RB, Vogelzang NJ, Mani S, et al. (2000) Phase I clinical and pharmacological study of O6-benzylguanine followed by carmustine in patients with advanced cancer. Clin Cancer Res 6, 3025–3031. [PubMed] [Google Scholar]
- 54.Goldenberg GJ, Lam HY, and Begleiter A (1979) Active carrier-mediated transport of melphalan by two separate amino acid transport systems in LPC-1 plasmacytoma cells in vitro. J Biol Chem 254, 1057–1064. [PubMed] [Google Scholar]
- 55.London SJ, Smart J, and Daly AK (2000) Lung cancer risk in relation to genetic polymorphisms of microsomal epoxide hydrolase among African-Americans and Caucasians in Los Angeles County. Lung Cancer 28, 147–155. [DOI] [PubMed] [Google Scholar]
- 56.Yoshikawa M, Hiyama K, Ishioka S, Maeda H, Maeda A, and Yamakido M (2000) Microsomal epoxide hydrolase genotypes and chronic obstructive pulmonary disease in Japanese. Int J Mol Med 5, 49–53. [DOI] [PubMed] [Google Scholar]
- 57.Dunnick JK, Elwell MR, Radovsky AE, Benson JM, Hahn FF, Nikula KJ, et al. (1995) Comparative carcinogenic effects of nickel subsulfide, nickel oxide, or nickel sulfate hexahydrate chronic exposures in the lung. Cancer Res 55, 5251–5256. [PubMed] [Google Scholar]
- 58.Jokipii Krueger CC, Madugundu G, Degner A, Patel Y, Stram DO, Church TR, and Tretyakova N (2019) Urinary N7-(1-hydroxy-3-buten-2-yl) guanine adducts in humans: temporal stability and association with smoking. Mutagenesis 10.1093/mutage/gez030. [DOI] [PMC free article] [PubMed]
Associated Data
This section collects any data citations, data availability statements, or supplementary materials included in this article.


