

Abstract
Approximately 30% of all types of human cancers possess a constitutively activated the mitogen-activated protein kinase (MAPK) signaling pathway while MAP kinase 1 (MEK1) is a critical component of this pathway. It has been reported mutations could improve the activity of MEK1 to result in cell proliferation and transformation, which is a known oncogenic event in various cancer types. In this study, eight molecular dynamics simulations, Molecular Mechanics Poisson-Boltzmann Surface Area (MM-PBSA), combined with protein structure network were performed to explore the mechanism that mutations activate MEK1. Protein structure networks and hydrogen bonds analysis demonstrated that active mutations broke the interaction between activation segments (residues 216–222) and C-helix (residues 105–121) in MEK1, leading to it transform inactive form to active form. Moreover, hydrogen bond analysis and MM-PBSA calculation indicated that activating mutations decrease the binding affinity between MEK1 and inhibitor to reduce the inhibitory effect of inhibitors. In addition, some active mutations cause structural changes in the Pro-rich loop (residues 261–268) of MEK1. These changes may stabilize the interaction between the MEK1 mutants and the ligands by increasing the number of exposed hydrophobic residues in the active site of MEK1. Our results may provide useful theoretical evidences for the mechanism underlying the role of human MEK1 in human cancers.
Keywords: MAP kinase 1 (MEK1), MAPK pathway, cancer, molecular dynamics simulation, MM-PBSA, conformational change
1. Introduction
The mitogen-activated protein kinase pathway (MAPK) because its important role in response to extracellular stimuli(L. J. Jr & Mccubrey, 2002) has been implicated in tumour survival, progression and formation(Cuadrado & Nebreda, 2010; Dong, Davis, & Flavell, 2002; Kolch, 2005; Judith S Sebolt-Leopold & Herrera, 2004; J. S. Sebolt-Leopold, Herrera, & Ohren, 2007; Zebisch et al., 2007). Abnormal activities of this pathway has been proved to be associated with the occurrence of inflammation and other diseases which including Kaposi’s sarcoma-associated herpes viral infection(Ma & Quirion, 2005), chronic obstructive pulmonary disease(Rogers, 2005), influenza(Senawong et al., 2008), cardio–fascio–cutaneous syndrome(Xie, Ajibade, Ye, Kuhne, & Gao, 2008) and neuropathic pain(Hsieh & Hsu, 2007) over the past few years. In view of the key role of MAKP pathway in numerous diseases pathogenesis, substantial efforts have been devoted to finding new inhibitors of MAPK-ERK pathway(Thompson & Lyons, 2005; Wortzel & Seger, 2011) and their components, especially for MAP kinase 1 (MEK1) and MAP kinase 2 (MEK2).
MEK1 and MEK2 are nonreceptor hydrophilic proteins which widespread expressed in cell that involved in the signal transduction (RAS–RAF–MEK–ERK) cascade called as the MAPK cascade(Fischmann et al., 2009; R. R. Jr, 2010; Pylayevagupta, Grabocka, & Barsagi, 2011). For the cascade components, RAF kinases could phosphorylate and active the MEK1 and MEK2, which display their limited substrate specificity. MEK1 and MEK2 are known as dual-specificity protein kinases that mediates tyrosine and threonine phosphorylation for ERK1 and ERK2. Recently, more and more researchers put their research intersection on MEK1 and MEK2 molecules.
Human MEK1 protein is constituted by a 60 residues length N-terminal sequence, a 300 residues length protein kinase domain and a 30 residues length C-terminal sequence(Knighton et al., 1991). The N terminus contains an inhibitory segment (residues 43–59), a nuclear export sequence (residue 32–42) and a as well as a segment (residues 1–11) that aids the binding of the MEK1 protein to ERK substrates (Figure 1A and B). Similar to all protein kinases, MEK1 is divided into a large C-terminal lobe and a small N-terminal lobe, which were first defined in a PKA study(Taylor & Kornev, 2011). The small lobe is consisted by a five-stranded antiparallel β-sheet (β1–β5)(Villanueva et al., 2010) and a conserved α-helix. The conserved glycine-rich (GxGxxG) ATP-phosphate-binding loop (P-loop) is located at between its β1 and β2 sheets (Figure 1C). The active center of MEK1 is consisted of eight residues which binds to the substrate, such as ATP, or the competitive inhibitor (Figure 1D). In addition, large lobe of MEK1 has two significant regions called activation segment and Pro_rich loop respectively. An important characteristic of protein kinases is that they exist in at least two activity states (high and low) which are regulated by phosphorylation. The low and high activity states can adopt different conformations that demonstrate various interactions with ligands and inhibitors. MEK1 can be activated through the phosphorylation of Ser 218 and Ser 222(Atefi et al., 2011; Shi, Kong, Ribas, & Lo, 2011) in the activation segment(Dhomen & Marais, 2007) by Raf. The phosphorylation of both serine residues is required for MEK1 activation. Dephosphorylated MEK1 has an extremely low activity. A coupled assay revealed that MEK1 exhibits an activity change of 5000-fold after maximal phosphorylation by c-Raf while dephosphorylated MEK1 exhibited an extremely low activity. Substituting serine residues in the activation segment with negatively charged residues, such as glutamate or aspartate, partially mimics phosphorylation and results in a constitutively activated kinase(Bollag et al., 2010; Carlino et al., 2015; Shao & Aplin, 2010; Smalley et al., 2008; Xing et al., 2012).
Figure 1.
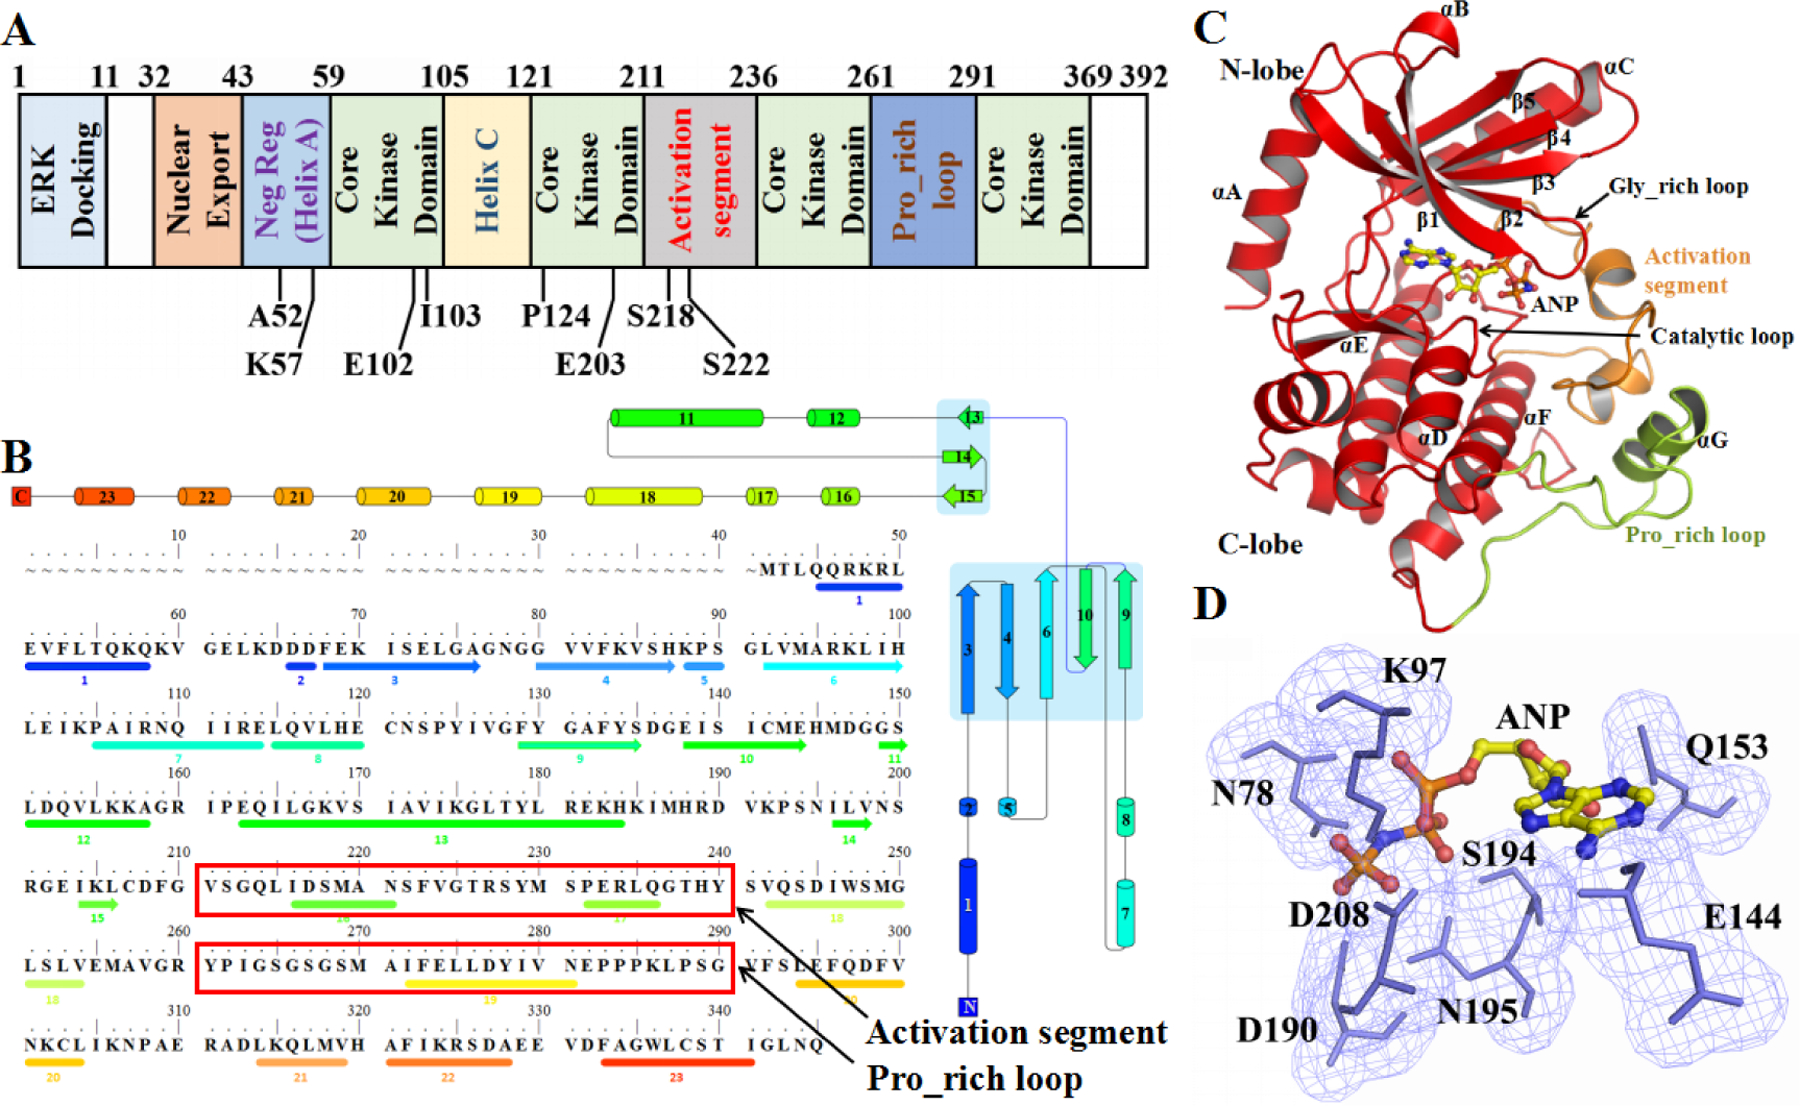
Overview of MEK1. (A) Organization of the MEK1 protein. Positions of mutations (P124S, E203K, I103N, I102_K103 del, K57N, and A52V) and phosphorylation sites (Ser218 and Ser222). (B) Topology plot and amino acid sequence and secondary structural elements of MEK1. Helices and β-strands are represented as circles and arrows, respectively. Red boxes indicate the position of the activation loop and Pro-rich loop. (C) Three-dimensional structure of MEK1 (PDB ID: 3SLS). The N-terminal lobe (N-lobe) contains five β-strands (1 through 5) and a universally conserved α-helix. The C-lobe is dominated by helices. The activation segment and Pro-rich loop are colored orange and lemon, respectively. Yellow sticks represent the ANP molecule (inhibitor). (D) Cyan meshes and sticks represent the residues surrounding ANP.
Recent researches reported that some mutations in MEK1 are activating and oncogenic. For example, the mutations of P124S(Grisham et al., 2015; MiniBoo et al., 2010; Nikolaev et al., 2012), E203K(Grisham et al., 2015; MiniBoo et al., 2010), I103N(Grisham et al., 2015), I102 to K103 delete (I102_K103 del)(Gao et al., 2017), and K57N(Gao et al., 2017)can enhance the catalytic activity of MEK1, thereby increasing the phosphorylation of ERK1/2. It can be seen that mutations can enhance the activity of MEK1 and eventually lead to cancer , such as Melanoma, Papillary thyroid cancer and Colon cancer However, the effect of mutations in different regions of MEK1 on the spatial structure of MEK1 remains unclear. Many mutations occur at different locations of MEK1, and the regularity of structural changes caused by these mutations has not been further studied.This study performed molecular dynamics (MD) simulations to elucidate the molecular mechanism of MEK1. Specifically, the activities of five activating MEK1 mutations (P124S, E203K, I103N, I102_K103 del and K57N), one nonactivating mutation (A52V), phosphorylated MEK1 (Ser 218 and Ser 222 were both phosphorylated), and the nonactive wild-type (WT) MEK1 protein were analyzed through MD simulations. Our study provided some theoretical guidance for the treatment of cancer caused by MEK1 mutation.
2. Materials and methods
2.1. Preparation of the protein structures
The crystal structure (PDB ID: 3SLS)(Meier et al., 2012) of WT MEK1 was retrieved from the Protein Data Bank (www.rcsb.org). The structures of other six specific mutations (P124S, E203K, I103N, I102_K103 del, K57N, and A52V) were constructed using the SWISS-MODEL(Biasini et al., 2014) with the WT structure as the structural template. The six structures were subjected to energy minimization through the steepest descent technique. The inhibitor ANP, which was obtained from the crystal structure of 3SLS, was used as the ligand in the eight MEK1 simulations.
2.2. Molecular dynamics simulations
The Gromos 53A6 force field(Guan et al., 2016) was applied to describe the protein and the ligand. The parameterization of the ligand was performed by the PRODRG2.5 server(Schuttelkopf & van Aalten, 2004). All complex systems were subjected to MD simulation in a periodic boundary box with the SPC water model(B Hess & Nf, 2006). To neutralize the systems, chloride and sodium ions were randomly added to the simulation box. Table S1 lists the number of chloride and sodium ions that was added to each system. Energy minimization was performed through the steepest descent method. The energy-minimized structure was allowed to reach an initial structure of equilibration. Subsequently, 100 ps NVT (Berendsen temperature(Berendsen, Postma, Gunsteren, Dinola, & Haak, 1984) coupling with constant particle number, volume, and temperature) and 100 ps NPT (Parrinello-Rahman pressure coupling with constant particle number, pressure, and temperature)(Berk Hess, Bekker, Berendsen, & Fraaije, 2008) were used to maintain the system in a stable environment (300 K, 1 bar). The coupling constants for temperature and pressure were set to 0.1 and 2.0 ps, respectively. Long-range electrostatic interactions were described using the Particle Mesh Ewald algorithm(Darden, York, & Pedersen, 1993) with an interpolation order of 4 and a grid spacing of 1.6 Å, and van der Waals interactions were calculated with a cutoff of 14 Å. All bond lengths were constrained using the LINCS algorithm(Darden et al., 1993). After all thermodynamic properties had stabilized, the molecular system was simulated for 300 ns with a time step of 2 fs, and the coordinates for all models were saved every 2 ps. The number of atoms in the eight systems is shown in Table S1.
2.3. Principal component analysis
Principal component analysis (PCA) can provide a highly detailed image of biomolecular motions. PCA extracts correlated fluctuations from MD trajectories by reducing dimensionality through the use of the covariance matrix of all conformations with respect to that of the average structure. PCA provides orthogonal eigenvectors and their corresponding eigenvalues on the basis of the diagonalization of the covariance matrix. The elements Cij in the matrix are defined as
where Δri (Δrj) is the displacement vector that corresponds to the i-th (j-th) atom of the systems, and 〈⋯〉 indicates an ensemble average. The eigenvectors of the matrix represent the directions of the concerted motions. The eigenvalues indicate the magnitude of motions along a direction. In general, the first few principal components (PCs) describe the most important slow system modes related to the functional motions of a biomolecular system(Maisuradze, Liwo, & Scheraga, 2010). In this study, PCA was performed using GROMACS 5.1.4 to investigate and compare the motion modes of the four systems.
The free-energy landscape (FEL) can provide insight on the dynamic processes that occur in a biological system. In the FEL, the free energy minima typically represent the conformational ensemble in a stable state, whereas the free-energy barriers denote transient states. The FEL was constructed on the basis of the above PCA data. FEL can be expressed as
where KB is the Boltzmann constant, T is the temperature of the simulation, and P(X) is the probability distribution along the reaction coordinate X. In our study, we calculated the FEL to identify the dominant conformational states with relatively low energies.
2.4. Binding free energy calculation
The MM-PBSA method(Kumari, Kumar, & Lynn, 2014) was used to predict and evaluate the binding free energies and relative stabilities of different biomolecular structures (Kollman et al., 2010). In our study, the binding free energies were calculated using the MM-PBSA method in the GROMACS 5.1.4 package. A total of 100 snapshots were chosen evenly from the MD trajectory. The total binding energy (ΔGbind ) was computed using the following equation:
where ΔGbind represents the binding free energy between the protein and the ligand and is calculated as the difference between the total free energy of the complex (Gcomplex) and the sum of the free energy of the protein (Gprotein) and the ligand (Gligand). The binding energy is expressed as the combination of enthalpy and entropy terms:
where TΔS refers to the entropic contribution to the free energy in a vacuum, in which T and S denote temperature and entropy, respectively. In addition, the changes in the protein and the ligand upon binding are similar among all complexes. Previous studies have shown that entropy differences are extremely small. Thus, the calculation of the solvate entropy term was omitted in the present study. The enthalpy of binding can be further decomposed into protein–ligand and solvation free-energy contributions.
where EMM is the molecular mechanics energy of the molecule expressed as the sum of the internal energy of the molecule plus electrostatic and van der Waals energies. The solvation free energy is expressed as polar and nonpolar contributions to the solvation energy:
Gnonpolar is calculated from the solvent-accessible surface area (SASA):
where γ = 0.0072 kcal/mol/Å, and b = 0 kcal/mol.
In this study, all energy components were calculated using 500 snapshots extracted from the last 5 ns MD trajectory.
2.5. Protein structure network analysis
The network analysis for the WT and mutant MEK1 were prepared by the representational structures which extracted from eights molecular dynamics simulations. In those structures, each residue was recognized as a node, which were connected by edges according to non-covalent interactions. The connection between two nodes i and j was defined as:
Where nij indicated the number of different atoms from nodes i and j. Ni and Nj represented the normalization factors for nodes i and j. A protein structure graph of the expected connection cut-off (Imin) was built by composing an Iij larger than the cut-off (Imin) edge between any two nodes. If Imin = 2.5%, any pair of nodes was recognized in the protein network structure graph.
In this study, a weighted network representation of MEK1 structure was used. The model takes into account the non-covalent connectivity of residue cross-correlation fluctuation matrix and side chains when constructing network graphs(Sethi, Eargle, Black, & Luthey-Schulten, 2009; Stetz & Verkhivker, 2016). The shortest paths between nodes which exhibited all short paths in the network between each pair of nodes was determined by Floyd–Warshall algorithm(Floyd, 1962). The residue-based betweenness was calculated to conduct the construction of the protein network structures. The total fraction of the shorted paths for the all nodes pairs which pass through node i was used the define the betweenness of residue:
Where the number of shortest geodesics paths connected j and k was recorded as gjk, while gjk(i) denoted the shortest paths number which the nodes j and k. The number of shortest paths between residues j and k crossing through the node ni . The residues who had the the shortest paths to all nodes pairs getting high occurrence to obtain high betweenness values. The the interaction networks were conducted by analyzing the hub detection. The number of the network nodes which connecting to the particular nodes was recognized as the degree of nodes. If the number of the node exceed three, it can be identified as a hub. In this study, 2D visualization, nteractive analysis and automatized generation for the residue interaction networks were analyzed by RINerator, and RINalyzer(Doncheva, Klein, Domingues, & Albrecht, 2011).
2.6. Network centrality analysis
The closeness, residue degree and betweenness of the global centrality measures were prepared for the protein structure networks analysis(Blacklock & Verkhivker, 2014). The total of the connection weights between the networks nodes (nk,nl) represented the length of a path for distant nod es (ni ,nj) ni and nj:
The shortest paths d (ni, nj) between two nodes were calculated through the Floyd–Warshall algorithm (Floyd, 1962)which can exhibited all possible paths for the each pair of residue nodes. At the first step, the distance between the connecting nodes was defined to be one, and the shortest path was determined as the path between two distant nodes connected through the smallest number of intermediate nodes.
Network structure calculations was prepared with python module network.(Hagberg, Schult, & Swart, 2008) The short paths was defined as the paths that included the intermediate nodes with correlated correlated adequately (Cij = 0.5–1.0). Based on the edge weight tolerance threshold Cij = 0.5 and Wij = −{log(−0.5)} = 0.69 of connection nodes, the spatial location of connection separation was defined and the set of sub-optimal paths was determined.
The degree of nodes in an interactive network was defined as the local connectivity for measurment. The direct relationship between nodes i and other nodes which called the degree was as followed:
Where aij represented adjacency matrix A element, the N was the total number nodes in the network. The betweenness for node i was considered as the sum of the fraction of the shorted paths between all pairs of nodes that cross through node i. The node would exhibited a higher betweenness values if it got a high occurrence in shortest paths which connecting all nodes pairs. The normalized betweenness of nodes i was calculated as follows:
where the number of the shorted paths between nodes i to k was gjk, the fraction for the shortest paths cross through nodes i was gjk(i).
3. Results and discussion
3.1. Structural flexibility: activation segment and pro-rich loop domain movements
To explore the influence of mutations on MEK1 activation, the protein stability change upon mutation of MEK1 was examined and the results were shown in Table S2. It can be seen that all the mutations could influenced the stability of the MEK1. The phosphorylation of Ser218 and Ser222 made the energy change +0.570 Kcal/mol to enhance the stability of the MEK1. While other six mutations can reduce protein stability. Then, 300 ns of the MD simulations of five activating mutations (P124S, E203K, I103N, I102_K0103 del, and K57N), one nonactivating mutation (A52V), phosphorylated MEK1 (activating), and nonactive WT MEK1 were assessed. The root-mean-square deviation (RMSD) of the Cα atoms with respect to their initial positions is an indicator of system stability. The RMSD curves of the backbone Cα atoms with respect to the eight complexes indicate acceptable equilibrium after 20 ns (Figure 2A). The relative occurrence frequencies of the RMSD (Figure 2D) of WT and mutant MEK1 were distributed between 3.6 and 4.5 Å. It can be found that the RMSD value of the mutants were slightly higher than that of the wild type MEK1.
Figure 2.

Stability analysis of WT and mutant MEK1 proteins during 300 ns of simulation. (A, D) Profiles of the RMSDs of the backbone Cα atom and the relative occurrence frequencies of RMSDs of the WT and mutant MEK1 proteins (pi-WT represents phosphorylated-MEK) as functions of time. (B, E) Profiles of the backbone Cα atom Rgs and relative occurrence frequencies of Rg of the WT and mutant MEK1 proteins as functions of time. (C, F) Profiles of the backbone Cα atom SASA and relative occurrence frequencies of SASA of the WT and mutant MEK1 proteins as functions of time.
In addition to the overall shape and size variation of the mutated proteins, the radius of gyration (Rg) of WT and mutant structures were calculated to gain insight into the overall dimensions of the proteins. This approach can help examine the rapid conformational drifts observed in mutant structures(Brennan et al., 2011). Figures 2B and 2E illustrate the mass weighted root-mean-square distance of a collection of atoms from the common center of the masses of WT and mutant proteins. The average fluctuations presented by the Rg of WT, phosphorylated MEK1, P124S, E203K, A52V, K57N, I103N, and E102_I103 del were 19.0 ,19.4,19.5, 19.8, 19.1 19.6, 20.0, and 19.4 Å, respectively. The activating mutations and phosphorylated MEK1 had higher Rg scores than the WT MEK1. A large Rg corresponds to the wide conformational distribution of an activating mutation. The Rg results suggested that the enhancement in stability does not result from higher protein compactness but from a significant conformational change. The SASA of the biomolecules surface area that is accessible to the solvent was calculated. The changes in the SASA of the WT and mutant proteins are shown in Figures 2C and 2F. The SASA values of the active mutants increased relative to those of the nonactive mutants. These results indicated that the active mutants have undergone expansion. This finding suggested that the activating mutations may experience stability loss due to small local unfolding.
To analyze the fluctuation of the MEK1 residues, the root-mean-square fluctuation (RMSF) values of the WT and mutant backbone residues were calculated (Figure 3). Figure 3E shows that in contrast to the other regions in the eight simulations, the activation segment and the Pro-rich loop displayed a fluctuation peak (i.e., maximal flexibility). This result suggested that the increase in the RMSD of MEK1 may be mainly driven by the movement of the activation segment and the Pro-rich loop. The RMSF plots of different mutations were compared with those of WT. Except for the A52V (Figure 3A) and K57N (Figure 3B) mutations, the other six mutations could increase the flexibility of the activation segment (i.e., the plot of the RMSF at the activation segment expanded). In addition, K57N and P124S (Figure 3C) mutations reduced the fluctuation of the Pro-rich loop. To summarize, the effects of mutations on the fluctuation of MEK1 during simulations are mainly concentrated in the activation segment and the Pro-rich loop.
Figure 3.

Comparison of the RMSF values of WT, A52V, K57N, P124S, I103N, E102_I103 del, and E203K systems. (D) RMSF values of the backbone atoms of eight complexes over simulation time. (A to C and E to H). Comparison of the RMSD plots of WT and mutant MEK1 proteins.
3.2. Structure-activity relationship of the WT and MEK1 mutants: protein network analysis
The structure-based network analysis was employed to describe the local hubs organization and stable interaction communities of WT and MEK1 mutants, which was regarded as a robust and simple measurement for evaluation of structural stability. The contact maps of residues cross-correlations and topology-based residue connectivity obtained from MD simulations were incorporated to construct protein structure networks. The degree distributions (Figure 4A) and stress centrality (Figure 4B) of numbers of nodes in WT and MEK1 mutants was fairly similar. The degree of the nodes in MEK1 exhibited a law of normal distribution around the value of 20. The average clustering coefficient distribution (Figure 4C) gives the average of the clustering coefficients for all residues and it can been seen that compared to WT and A52V mutants, active mutants had a wider modular organization of networks. Figure 4D and 4E showed that the mutation and phosphorylation hardly affecting the closeness and betweenness centrality of the whole MEK1 proteins.
Figure 4.

Comparison of the network interaction between WT and mutant MEK1 structures. (A) The degree distribution of number of nodes in WT and mutant MEK1 structures. (B) The stress centrality distribution of number of nodes in WT and mutant MEK1 structures. (C) The average clustering coefficient distribution of number of neighbors for WT and mutant MEK1 structures. (D) The distribution of closeness centrality in WT and mutant MEK1 structures. (E) The betweenness centrality analysis for WT and mutant MEK1 structures.
To detect pivotal mediating residues (nodes) involved in wild type and mutation MESSSK1 network graphs, frequency distributions of the betweenness value for the representative structures extracted from the MD simulations were examined as shown in Figure 5A to H, which illustrated the frequency of nodes lying on paths of other nodes in the networks graphs. The betweenness profile in active mutants and phosphorylated MEK1 displayed greater distribution in low betweenness value (0.01–0.02). Compared to WT and inactive mutant, active mutants and phosphorylated MEK1 had a longer tail and a sharper decay of the distribution. Thus, active mutations may stimulate a few crucial residues to play the part of functional bridges on the communication between other residues to improve the activity of the MEK1. To confirm this conjecture, the betweenness distribution for every intermediary residue was investigated to reveal the relationship between functional activities and centrality of key residues in the WT and mutants (Figure 5I). Compared to other residues, the residues located at the activation segment Showed a higher level betweenness centrality. Unlike WT and inactive mutation, active mutations and phosphorylation decreased the betweenness centrality of activation segment (small pictures on Figure 5A–H), which may be associated with the increased fluctuation of residues in activation segment.
Figure 5.

The network centrality analysis for the eight protein-ligands complexes according to the simulation trajectories. (A-H) The frequency distributions of the betweenness values of WT and mutant MEK1 structures. (I) The residue-based betweenness distributions point to small-world organization of the interaction networks in the WT and mutant MEK1 structures. The betweenness distributions point for activation segment in eight complexes were extracted to small pictures on A-H.
Overall, the results of RMSF and network analysis indicated that active mutations could improve the activities of MEK1 by regulating the function of residues in activation segment and Pro_rich loop which could be shielded or surrounded by neighboring residues to decrease or enhance the interaction with other residues in WT and mutations MEK1. Active mutations increased the fluctuations of residues and decreased the communication with other residues, which may be caused by structural changes, which indicated mutation may affect the activity of MEK1 by altering secondary structure.
3.3. Helix disappearance at the activation segment activates MEK1
To further confirm the above results, the define secondary structure of proteins (DSSP) analysis was preformed and the results are shown in Figure S1. The changes exhibited by the activation segments of P124S, E203K, I103N, I102_K103 del, and phosphorylated MEK1 and the Pro-rich loop regions of P124S and K57N are more significant than those exhibited by the activation segments of the WT and nonactivating MEK1 mutant. Activating mutations resulted in a helix-to-loop conformational switch of the activation segment during the simulation (Figure 6A). The helix content of the segment in the WT and nonactive mutant MEK1 exceeded 90% but decreased to less than 10% in the active mutants (Figure 6B). Comparing the activation segment conformation of the MEK1 mutants revealed that the active mutants exhibit a helix-to-loop transformation in residues 216–222 (activation segment) (Figure 6C). Figure S2 showed that the activation segment of the active mutants had higher RMSD, Rg, and SASA values than those of the WT and the nonactive mutant. This finding is consistent with the report that the activation segment is one of the most flexible parts of the MEK1 protein. In addition, the dihedral angles of Ile216 (located at the activation segment domain) in the WT and mutants changed (Figures 6D–6I). Specifically, the φ and ψ angles of Ile216 drastically rotated in the activating MEK1 mutants.
Figure 6.

Activating mutations decrease the helix content of the activation segment. (A) DSSP results of the activation loops of WT and mutant MEK1 proteins. (B) Probability of helix formation of the activation segment (Ile216 to Ser222) of WT and mutant MEK1 proteins. (C) Comparison of the conformational changes of the activation loops of WT and mutant MEK1 proteins. Pinkish blue represents the residues from Ile216 to Ser222 at 0 ns, and cyan represents the same region at 50 ns. (D-I). Time evolution of the dihedrals of Ile216 in WT and mutant MEK1 complexes during the 300 ns simulation.
MEK1 can be activated by the phosphorylation of Ser218 and Ser222, which are located in the activation segment. Our conformation analyses have revealed that activating mutations or phosphorylation can cause the α-helix in the activation segment of MEK1 to disappear. This conformational change may cause MEK1 to become activating. To confirm this hypothesis, the effect of the structural change of the activation segment on the entire surface of MEK1 was analyzed, and the results are shown in Figures 7A and 7B. The disappearance of the α-helix at the activation segment in the activating MEK1 (from Ile216 to Ser222) is accompanied by changes in the betweenness centrality (Figure 5A–5H) and dihedrals (Figure 6D–6I) of the activation segment. These changes shifted the activation segment far away from the core body of MEK1. Then, the distance from the center of mass (c.o.m.) of the activation segment to Arg201 was calculated for the eight complexes. As shown in Figures 7C–E, compared with WT (35 Å) and A52V (33 Å), the distance between the c.o.m. of the activation segment and Arg201 in the active mutants increased over time. The value of the distances were 36, 38, 39, 39, and 41 Å for phosphorylated MEK1, P124S, E203K, E102-I103 del, and I103N, respectively. These changes indicate that the activation segment has moved away from its initial position. In other words, when MEK1 is phosphorylated or harbors an activating mutation, the ɑ-helix of the activation segment (Ile216 to Ser222) disappears. The disappearance of the ɑ-helix enlarges the activating cleft of MEK1 in the activating mutants (Figure 7F). The enlargement of the activating cleft of MEK1 facilitates the entry or departure of the ligand via MEK1. This phenomenon may account for the similar effects exerted by phosphorylation or activating mutations on MEK1 activation. Whether the substrates can enter the active center of MEK1 smoothly will affect the activity of MEK1 to a great extent. Our simulation results illustrated that active mutation can change MEK1 from inactive close state to active open state to regulate substrate entry into MEK1. This may be one of the main reasons why mutation affects MEK1 activity.
Figure 7.

The disappearance of helix in activation segment caused the transition of MEK1 from inactive to active form. (A) Loop-in conformation. (B) Activation loop-out conformation. (C) Profiles of the distance between the center of mass of activation segment and Arg201. (D-E) Relative occurrence frequencies and average degree of the distance for the WT and MEK1 mutants as functions of time. (F) Schematic of the conformational switch from the inactivating form to activating form of MEK1.
3.4. Activating mutations break the protein network and change the relative conformation and between the C-helix and the activation Segment
The C-helix in the N-lobe regulates MEK1 activity by interacting with the activation segment. However, the mechanism through which the α-helix regulates the activation segment remains unknown(Hanks & Hunter, 1995; Hubbard, 2014; Zheng et al., 2010). In this study, most of mutations occur near the C-helix. Thus, these mutations may affect the conformation of the C-helix given their proximity to regulate the activation segment. To analyze the interaction between the α-helix and the activation segment, the relative conformation between the C-helix and the activation segment was investigated. As shown in Figure 8, both ends of the C-helix disappeared in the activating P124S, I103N, and E102_K103 del mutants (Figures 8B–8D), thereby loosening the α-helix and increasing the c.o.m. distance between the α-helix and the activation segment (Figures 8E and 8F). This change in relative position and distance leaded to the loss of control of the activation segment by the C-helix, which made the activation segment exit in a free state, and eventually leading to a series of secondary structure changes of A helix, which changes the conformation of MEK1.
Figure 8.

Activating mutation changes the relative conformation between the C α-helix and the activation segment. (A-D) Comparison of the relative conformation between the C α-helix and the activation segment of WT, E102_I103 del, I103N, and P124S at 50 ns. The C α-helix is shown as a blue surface, and the activation segment is shown as a yellow surface. (E-F) Time evolution of the distance between the center of mass of activation segment and the center of mass of the α-helix of WT, E102_I103 del, I103N, and P124S during 300 ns of MD simulation.
To detect the influence of mutations on the interaction between activation segment and C-helix, we gradually measured the small-world interaction networks in WT and mutants between C-helix and activation segment. The number of communities and cliques were calculated to reveal the stable module of mutations and interconnected residues in small-world interaction networks. Figure 9A illustrated that active mutants displayed a greater number of total cliques than the WT and inactive mutant. The analysis of communities suggested that the total amounts of stable communities were high in active mutants (Figure 9B), which revealed the higher cooperativity in the active mutants. The profile of local residue hubs for WT and mutants in Figure 9C–E characterized that compared to WT and inactive mutants, the wider scatter of residue hubs exhibited in the active mutant could be associated with the tighter interaction in the active mutants, which may be another crucial evidence of mutations promote the activities of MEK1. The cluster network analysis (Figure 10A–D) displayed that active mutants destroyed the network between C-helix and activation segment which promoted the transformation of MEK1 from inactive to active form (Figure 10E–F).
Figure 9.

The networks analysis for WT and mutant MEK1 structures. (A) The results of cliques in WT and mutants MEK1. (B) The results of communities in WT and mutants MEK1. (C-F) The values distribution of residue hubs in eight complexes.
Figure 10.

Small-world interaction networks analysis between C α-helix and the activation segment. (A-D) The detailed close-up of the network of cluster in WT, E102_I103 del, I103N, and P124S complexes. (E-F) General overview the network interaction between C α-helix and the activation segment in open and close form MEK1.
In order to further analyze the interaction between C-helix and the activation segment. we identified an intramolecular hydrogen bond network (H-bond network) between the C-helix and the activation segment in WT and mutants structures, as shown in Figure S3. In WT MEK1 and A52V mutants (Figure S3A–B), I105, H100 and E102 in the C α-helix interact with G213, L215 and S218 in the activation segment through hydrogen bonding. While in pi_WT (Figure S3C), P124S (Figure S3D), E203K (Figure S3E), I103N (Figure S3F) and E102_I103 del (Figure S3G), the hydrogen bond disappeared, which was accompanied by C α-helix and the activation segment far from each other. Thus, the relative positions of the C-helix and the activation segment significantly changed and enlarged the activating clefts in the activating MEK1 mutants. Based on the analysis, we developed a model to explain the relative positions of the C-helix and the activation segment in activating and inactivating MEK1 (Figure S3H). In the WT and inactivating MEK1, C -helix tend to make strong hydrogen bond with C-helix through I105, H100, E102 G213, L215 and S218 (Figure S3H, top). The activating mutation results in the loss of interactions (Figure S3H, bottom). This hydrogen bond network stabilizes the activation segment in an inactive conformation by preventing it from moving away from its initial position. This may be the main reason for breaking the interaction between C -helix and activation segment, which was consistent with the previous results and complemented the experimental data.
3.5. The Influence of Mutations on Pro-rich loop
The DSSP results indicated that the second change in activating mutations occurred in the Pro-rich loop region (Figures S1 and 11). Figure 11A shows that the K57N and P124S mutations can lead to the formation of the β-sheet in the region encompassing Tyr261 to Gly268. The β-strand content in the Pro-rich loops of K57N and P124S mutants exceeded 60% during the simulation (Figure 11B). The conformational change in the Pro-rich loop resulted in the generation of β-sheets, which do not exist in the WT MEK1, K57N or P124S (Figure 11C). Interestingly, the RMSD, Rg, and SASA of residues Tyr261 to Gly268 in the K57N and P124S mutants displayed different trends: Although the RMSD values of K57N (4.3 Å) and P124S (4.5 Å) were higher than those of the WT (3.8 Å), the Rg and SASA values of K57N and P124S were significantly lower than those of the WT. These data suggested that the generation of β-sheets is accompanied by changes in RMSD, Rg, and SASA values. These changes affect the function of the Pro-rich loop. Table 1 indicated that the hydrogen bond occupancies in residues Tyr261 to Gly268 showed an obvious rise in K57N and P124S mutants. It can be seen that the occupation for Ser265 N-Gly266 N increased to 92.37 % (K57N) and 99.50% (P124S), respectively from 48.10% (WT). In addition, Tyr261 had strong hydrogen bond interaction with Gly268 in K57N and P124S mutants , but the interaction was not found in the WT MEK1. The formation of these hydrogen bonds facilitates the generation of β-sheets in Pro-rich loops. The role of the Pro-rich loop in the activation of MEK1 remains unknown. Our simulation result showed for the first time that the Pro-rich loop is involved in regulating the activation of MEK1 in the K57N mutant.
Figure 11.

K57N and P124S mutants induce the generation of the β-sheet in the Pro-rich loop. (A) DSSP results for the Pro-rich loop (Tyr261 to Gly268) of WT and mutant MEK1 proteins. (B) Probability of β-sheet generation in the Pro-rich loop (Tyr261 to Gly268) of the WT and mutant MEK1 proteins. (C) Comparison of the conformational change in Tyr261 to Gly268 in WT and mutant MEK1 proteins. Pinkish blue represents the residues from Ile216 to Ser222 at 0 ns, and cyan represents the same region at 50 ns. (D–G) Comparison of the changes in RMSD, Rg and SASA of Tyr261 to Gly268 in WT and mutant MEK1 proteins.
Table 1.
Hydrogen bond occupancies of Pro-rich loop (residues Tyr261 to Gly268) during MD simulations (%).
| Hydrogen Bonds | WT | K57N | P124S | |
|---|---|---|---|---|
| Donor | Accepter | |||
| Ile263:N | Gly266:O | 50.64 | 83.96 | 94.61 |
| Tyr261:N | Gly268:O | 65.35 | 54.09 | |
| Ser265:N | Gly266:N | 48.10 | 92.37 | 99.50 |
| Ser265:OG | Gly266:N | 29.28 | 47.52 | 36.83 |
| Gly268:N | Tyr261:O | 89.67 | 81.14 | |
| Gly266:N | Ile263:O | 62.63 | 86.69 | 74.55 |
| Gly266:N | Ser265:N | 65.10 | 85.74 | 99.50 |
| Gly266:N | Ser265:O | 33.93 | 67.86 | 95.32 |
3.6. Dominant Domain Motions
The correlation matrix obtained through PCA can improve our understanding of protein regions that present intense relevant conformational changes and can help clarify the mutation-induced dynamic motions of MEK1. Thus, the correlation matrixes for the Cα atoms of the WT and mutant MEK1 proteins were obtained. The covariance matrix maps of the three complexes are illustrated in Figure 12, in which antiharmonic and large-scale motions are highlighted by diagonalizing the matrix. The positive regions marked in cyan indicate the strongly correlated motions of the residues. The negative regions colored in pink are associated with anticorrelated movements. The diagonal was relatively highly correlated because it represents the variance of a residue with itself. In general, the values of −0.1 and 0.1 indicate the normal range of motion. The active mutants and phosphorylated MEK1 had stronger positive correlations and negative movements than the WT and inactivating MEK1 mutant. The matrix maps of the eight systems indicated that significant motions, whether correlated or uncorrelated, mainly occurred in the regions of residues Ile216 to Ser222 (activation segment) and Tyr261 to Gly268 (Pro-rich loop). Phosphorylated-MEK1 (Figure 12C), P124S (Figure 12E), E203K (Figure 12F), I103N (Figure 12G), and E102_I103 del (Figure 12F) had higher positively correlated movements in the activation segment than the WT (Figure 10A) and A52V (Figure 12B). These results are represented by the expansion of the cyan area in the activation segment shown in the matrix maps and are consistent with the fluctuations of RMSF. The disappearance of the helix at the activation segment increases the flexibility of MEK1 and the movements of residues. The P124S and K57N (Figure 12D) mutations exhibited few positively correlated movements in the Pro-rich loop (Tyr261 to Gly268) and numerous negatively correlated movements. In phosphorylated-MEK1, residues His100–Ala106 showed strongly and negatively correlated movements in the activation segment. In the E102_I103 del mutant, residues Ile71–Gly90 exhibited strongly and negatively correlated movements in the activation segment. The cross-correlation results suggested that the internal motions of MEK1 are significantly affected by mutations. The activation segment tends to be loose in the active mutants because the activation segment moves away from the protein center. These results suggested that mutations had a significant effect on MEK1 motions, and the effects of these motions on MEK1 activity need further analysis.
Figure 12.

Cross-correlation matrix maps for WT and mutant MEK1 proteins. Positive regions are marked in cyan and indicate strongly correlated residue motions, whereas negative regions are colored in pink and are associated with anti-correlated movements. The positions of the activation segment and Pro-rich loop are highlighted by boxes in each map.
PCA and FEL were independently performed on each trajectory of the eight systems to reveal the precise structural differences between activating and nonactive MEK1 mutants. The extreme projections for PC1 and PC2 during 300 ns of MD simulation were shown in Figure 13. Activation segment and Pro-rich loop displayed a greater motions in active mutants.To detect the proportion of the lowest-energy conformation for the eight complexes in the entire simulation, the percentage of each PC in the eight simulation complexes was analyzed on the basis of their corresponding eigenvalues (Table 2). The sum percentage of PC1 and PC2 in the eight systems reached more than 40%, which ensured the reliability of the results. Then, the contribution of each residue to the first two PCs was examined, as shown in Figure S4. Intense spikes were found at the positions of the activation segment and the Pro-rich loop for eight systems, suggesting that these two regions provided the major contributions to the motions of the PC. This result is consistent with the RMSF values (Figure 3E).
Figure 13.

Analysis of the FEL and protein motions in eight complexes along first two principle components mode of WT and mutant MEK1 proteins. Blue represents the conformation of MEK1 proteins with one global minimum. High numbers of blue regions indicate that more than one local minimum has been achieved in the simulation, and the intensity of the blue color is directly proportional to the minimum energy state of the protein.
Table 2.
Principle component probability during MD simulations (%).
| Protein | Principle Component (PC) | Probability |
|---|---|---|
| WT | PC1 | 34.77 |
| PC2 | 11.65 | |
| Pi_WT | PC1 | 31.87 |
| PC2 | 15.10 | |
| A52V | PC1 | 34.65 |
| PC2 | 13.62 | |
| K57N | PC1 | 29.15 |
| PC2 | 11.51 | |
| I103N | PC1 | 32.24 |
| PC2 | 11.75 | |
| E102_I103 del | PC1 | 34.08 |
| PC2 | 10.77 | |
| P124S | PC1 | 32.71 |
| PC2 | 13.72 | |
| E203K | PC1 | 36.93 |
| PC2 | 8.70 |
3.7. Reduction in Inhibitor Combination by Activating Mutations
ANP, a competitive inhibitor of ATP, is surrounded by the residues of the active center of MEK1 (Figure 1D). To analyze whether mutations affect binding between MEK1 and its inhibitors, the hydrogen bond occupancy between ANP and MEK1 in WT MEK1-ANP and mutant MEK1-ANP complexes were examined, and the results are listed in Table 3. In active MEK1 systems, the occupancy of hydrogen bonds in Asn78(ND2)–ANP(OA1) decreased to less than 30% from more than 50%. Lys97 plays an important role in the catalysis of MEK1. Activating mutations reduced hydrogen bonding between Lys97 and ANP. The same phenomenon was observed in the interaction between Glu144 and ANP. These results showed that activating mutations reduced the binding between MEK1 and ANP.
Table 3.
Hydrogen bond occupancies between MEK1 and ANP during MD simulations (%).
| Hydrogen Bonds | WT | A52V | K57N | I103N | E102_I103 del | P124S | E203K | Pi_WT | |
|---|---|---|---|---|---|---|---|---|---|
| Donor | Accepter | ||||||||
| ASN78:N | ANP305:O2A | 35.93 | 37.54 | 20.99 | 36.85 | 33.17 | 27.21 | ||
| ASN78:ND2 | ANP305:O1A | 65.69 | 54.74 | 28.35 | 45.84 | 38.70 | 26.31 | 23.56 | |
| ASN78:N | ANP305:O2B | 71.79 | 90.78 | 69.31 | 69.79 | 56.52 | 52.90 | 58.42 | 56.78 |
| LYS97:NZ | ANP305:N3B | 35.51 | |||||||
| LYS97:NZ | ANP305:O2B | 26.01 | 22.45 | 24.21 | |||||
| ANP305:N3B | LYS56:CE | 21.57 | |||||||
| GLN144:NE2 | ANP305:C2 | 51.48 | 27.27 | 41.36 | 77.53 | 35.69 | |||
| GLN144:NE2 | ANP305:N1 | 35.71 | 27.53 | ||||||
| GLN144:NE2 | ANP305:C4 | 21.57 | 27.19 | 31.35 | |||||
| GLN144:NE2 | ANP305:N3 | 41.72 | 44.31 | 39.40 | 35.46 | ||||
| SER194:OG | ANP305:O1B | 37.23 | 37.59 |
To further confirm the above results, the binding free energies of the MEK1-ANP complexes in eight simulations were calculated through MM‒PBSA. The nonbonded van der Waals (ΔEvdW), nonbonded electrostatic (ΔEelec) interactions, and binding free energy (ΔGbin) of the MEK1–ANP complexes in the eight systems are shown in Table 4. The binding free energies were driven primarily by electrostatic interactions and polar solvation, whereas van der Waals interactions, polar solvation, and entropy remained unchanged. Some significance was found in the variations in the binding affinity between MEK1 and ANP in the different mutation systems. Furthermore, the electrostatic and polar solvation energies varied substantially among the different mutation systems. They ranged from −1193.098 KJ/mol to −373.864 KJ/mol for electrostatic energy values and from 375.208 KJ//molto 853.386 KJ//mol for polarsolvation energy values. Almost considerable difference was observed in the vdW interaction, polar solvation, and entropy values among the different mutation systems. This finding confirmed that the vdW energy, polar solvation energy, and entropy did significantly contribute to the difference in the binding free energy. The obtained values ranged from −201.640 KJ/mol to −84.968 KJ/mol for the vdW energy, from −21.772 KJ/mol to −10.349 KJ/mol for the polar solvation energy, and from −1376.294 KJ/mol to −458.832 KJ/mol for the entropy. Overall, the vdW energy, polarsolvation energy, and entropy were distributed almost equally among the different temperature systems. These findings imply that the binding affinities between MEK1 and ANP in activating and nonactivating systems significantly differ. The WT complex had the lowest binding free energy (−542.815 KJ/mol), whereas other mutations increased binding energy by different degrees. K57N MEK1 increased the binding energy between MEK1 and ANP to −93.973 KJ/mol, indicating that the K57N MEK1–ANP complex became unstable. Thus, ANP can be easily removed easily via MEK1. This phenomenon may also account for the promotion of MEK1 activity by activating mutations.
Table 4.
MM-GBSA results (KJ/mol).
| ΔEele | ΔEvdw | ΔGnp | ΔGpb | ΔEele+ΔGpb | TΔS | ΔGbind | |
|---|---|---|---|---|---|---|---|
| WT | −1193.098 | −183.196 | −19.907 | 853.386 | −1376.294 | 833.479 | −542.815 |
| Pi_WT | −760.557 | −195.019 | −21.772 | 700.021 | −955.576 | 678.249 | −277.327 |
| A52V | −652.615 | −168.271 | −20.276 | 661.429 | −820.886 | 641.153 | −179.733 |
| K57N | −373.864 | −84.968 | −10.349 | 375.208 | −458.832 | 364.859 | −93.973 |
| I103N | −783.987 | −193.381 | −19.864 | 673.909 | −977.368 | 654.045 | −323.324 |
| E102_I103 del | −911.544 | −201.640 | −20.257 | 801.090 | −1113.184 | 780.833 | −332.351 |
| P124S | −617.719 | −140.715 | −17.936 | 552.377 | −758.434 | 534.441 | −223.994 |
| E203K | −772.756 | −173.290 | −20.156 | 671.169 | −946.046 | 651.013 | −295.033 |
4. Conclusion
The mutation of residues can affect MEK1 activation, which is an oncogenic event. Therefore, this study analyzed the effects of activating mutations on MEK1 activity. The conformational changes of the activating mutations P124S, E203K, I103N, I102_K103 del and K57N, the nonactivating mutation A52V, the activating phosphorylated MEK1, and nonactivating WT MEK1 were investigated through MD simulations with protein structure networks. Results showed that mutations promote MEK1 activation through the mechanisms: Activating mutations near the C-helix breaks the protein network and hydrogen bonds between the activation segment and C-helix to induce the disappearance of the α-helix in the activation segment of MEK1. This effect loosens the activation segment and increases the distance from the activation segment to the core body of MEK1,which enlarges the cleft on the surface of MEK1 protein to finish the transformation of MEK1 from inactive to active form. The cross correlation and PCA analysis displayed that active mutations increase the motions of activation segment, which is associated with the conformational change of it. Moreover, hydrogen bond analysis and MM-PBSA calculations indicated that activating mutations can increase the binding free energy of MEK1 mutants and the inhibitor ANP to decrease the inhibitor activity to MEK1. All the results reveals the mechanisms that mutations improve the activity of MEK1 and provides useful insight into protein kinase analysis.
Supplementary Material
Acknowlegments
This work was supported by the Natural Science Foundation of Jilin Province (3B812C201465), the Graduate Innovation Fund of Jilin University (101832018C180) and the US National Institutes of Health (GM100701). Our simulations were conducted at the High Performance Computing Center of Jilin University.
Footnotes
Competing financial interests: The authors declare no competing financial interests
References
- Atefi M, Euw EV, Attar N, Ng C, Chu C, Guo D, … Cominanduix B (2011). Reversing Melanoma Cross-Resistance to BRAF and MEK Inhibitors by Co-Targeting the AKT/mTOR Pathway. Plos One, 6(12), e28973. [DOI] [PMC free article] [PubMed] [Google Scholar]
- Berendsen HJC, Postma JPM, Gunsteren WFV, Dinola A, & Haak JR (1984). Molecular dynamics with coupling to an external bath. Journal of Chemical Physics, 81(8), 3684–3690. [Google Scholar]
- Biasini M, Bienert S, Waterhouse A, Arnold K, Studer G, Schmidt T, … Schwede T (2014). SWISS-MODEL: modelling protein tertiary and quaternary structure using evolutionary information. Nucleic Acids Research, 42(Web Server issue), W252–W258. doi: 10.1093/nar/gku340 [DOI] [PMC free article] [PubMed] [Google Scholar]
- Blacklock K, & Verkhivker GM (2014). Computational modeling of allosteric regulation in the hsp90 chaperones: a statistical ensemble analysis of protein structure networks and allosteric communications. PLoS Computational Biology,10,6(2014-6-12), 10(6), e1003679. [DOI] [PMC free article] [PubMed] [Google Scholar]
- Bollag G, Hirth P, Tsai J, Zhang J, Ibrahim PN, Cho H, … Habets G (2010). Clinical efficacy of a RAF inhibitor needs broad target blockade in BRAF-mutant melanoma. Nature, 467(7315), 596–599. [DOI] [PMC free article] [PubMed] [Google Scholar]
- Brennan DF, Dar AC, Hertz NT, Chao WC, Burlingame AL, Shokat KM, & Barford D (2011). A Raf-induced allosteric transition of KSR stimulates phosphorylation of MEK. Nature, 472(7343), 366–369. [DOI] [PubMed] [Google Scholar]
- Carlino MS, Fung C, Shahheydari H, Todd JR, Boyd SC, Irvine M, … Long GV (2015). Preexisting MEK1P124 mutations diminish response to BRAF inhibitors in metastatic melanoma patients. Clinical Cancer Research An Official Journal of the American Association for Cancer Research, 21(1), 98. [DOI] [PubMed] [Google Scholar]
- Cuadrado A, & Nebreda AR (2010). Mechanisms and functions of p38 MAPK signalling. Biochemical Journal, 429(3), 403–417. [DOI] [PubMed] [Google Scholar]
- Darden T, York D, & Pedersen L (1993). Particle mesh Ewald: An N⋅log(N) method for Ewald sums in large systems. Journal of Chemical Physics, 98(12), 10089–10092. [Google Scholar]
- Dhomen N, & Marais R (2007). New insight into BRAF mutations in cancer. Current Opinion in Genetics & Devolopment, 17(1), 31–39. [DOI] [PubMed] [Google Scholar]
- Doncheva NT, Klein K, Domingues FS, & Albrecht M (2011). Analyzing and visualizing residue networks of protein structures. Trends in Biochemical Sciences, 36(4), 179–182. [DOI] [PubMed] [Google Scholar]
- Dong C, Davis RJ, & Flavell RA (2002). MAP Kinases in the Immune Response. Annual Review of Immunology, 20(1), 55–72. [DOI] [PubMed] [Google Scholar]
- Fischmann TO, Smith CK, Mayhood TW, Myers JE, Reichert P, Mannarino A, … Yang RS (2009). Crystal structures of MEK1 binary and ternary complexes with nucleotides and inhibitors. Biochemistry, 48(12), 2661–2674. [DOI] [PubMed] [Google Scholar]
- Floyd RW (1962). Algorithm 97, Shortest Path Algorithms. Communications of the Acm, 5(6). [Google Scholar]
- Gao J, Chang MT, Johnsen HC, Gao SP, Sylvester BE, Sumer SO, … Schultz N (2017). 3D clusters of somatic mutations in cancer reveal numerous rare mutations as functional targets. Genome Medicine, 9(1), 4. [DOI] [PMC free article] [PubMed] [Google Scholar]
- Grisham RN, Sylvester BE, Won H, Mcdermott G, Delair D, Ramirez R, … Bogomolniy F (2015). Extreme Outlier Analysis Identifies Occult Mitogen-Activated Protein Kinase Pathway Mutations in Patients With Low-Grade Serous Ovarian Cancer. Journal of Clinical Oncology, 33(34), 4099–4105. [DOI] [PMC free article] [PubMed] [Google Scholar]
- Guan S, Zhao L, Jin H, Shan N, Han W, Wang S, & Shan Y (2016). Binding modes of phosphotriesterase-like lactonase complexed with δ-nonanoic lactone and paraoxon using molecular dynamics simulations. Journal of Biomolecular Structure & Dynamics, 35(2), 1. [DOI] [PubMed] [Google Scholar]
- Hagberg A, Schult D, & Swart P (2008). Exploring network structure, dynamics, and function. Paper presented at the Scipy. [Google Scholar]
- Hanks SK, & Hunter T (1995). Protein kinases 6. The eukaryotic protein kinase superfamily: kinase (catalytic) domain structure and classification. Faseb Journal, 9(8), 576–596. [PubMed] [Google Scholar]
- Hess B, Bekker H, Berendsen HJC, & Fraaije JGEM (2008). LINCS: A linear constraint solver for molecular simulations - Hess - 1998 - Journal of Computational Chemistry - Wiley Online Library. Journal of Chemical Theory & Computation, 4(1), 1463–1472. [DOI] [PubMed] [Google Scholar]
- Hess B, & Nf VDV (2006). Hydration thermodynamic properties of amino acid analogues: a systematic comparison of biomolecular force fields and water models. Journal of Physical Chemistry B, 110(35), 17616–17626. [DOI] [PubMed] [Google Scholar]
- Hsieh HP, & Hsu JT (2007). Strategies of development of antiviral agents directed against influenza virus replication. Current Pharmaceutical Design, 13(34), –. [DOI] [PubMed] [Google Scholar]
- Hubbard SR (2014). Crystal structure of the activated insulin receptor tyrosine kinase in complex with peptide substrate and ATP analog. Embo Journal, 16(18), 5572–5581. [DOI] [PMC free article] [PubMed] [Google Scholar]
- L. J Jr, & Mccubrey JA (2002). Targeting the Raf kinase cascade in cancer therapy--novel molecular targets and therapeutic strategies. Expert Opinion on Therapeutic Targets, 6(6), 659. [DOI] [PubMed] [Google Scholar]
- R. R Jr (2010). RAF protein-serine/threonine kinases: Structure and regulation. Biochem Biophys Res Commun, 399(3), 313–317. [DOI] [PubMed] [Google Scholar]
- Knighton DR, Zheng JH, Eyck LT, Ashford VA, Xuong NH, Taylor SS, & Sowadski JM (1991). Crystal structure of the catalytic subunit of cyclic adenosine monophosphate-dependent protein kinase. Science, 253(5018), 407–414. [DOI] [PubMed] [Google Scholar]
- Kolch W (2005). Coordinating ERK/MAPK signalling through scaffolds and inhibitors. Nat Rev Mol Cell Biol, 6(11), 827–837. [DOI] [PubMed] [Google Scholar]
- Kollman PA, Massova I, Reyes C, Kuhn B, Huo S, Chong L, … Wang W (2010). Calculating structures and free energies of complex molecules: combining molecular mechanics and continuum models. Acc Chem Res, 32(10), no–no. [DOI] [PubMed] [Google Scholar]
- Kumari R, Kumar R, & Lynn A (2014). g_mmpbsa--a GROMACS tool for high-throughput MM-PBSA calculations. Journal of Chemical Information & Modeling, 54(7), 1951–1962. [DOI] [PubMed] [Google Scholar]
- Ma W, & Quirion R (2005). The ERK/MAPK pathway, as a target for the treatment of neuropathic pain. Expert Opinion on Therapeutic Targets, 9(4), 699–713. [DOI] [PubMed] [Google Scholar]
- Maisuradze GG, Liwo A, & Scheraga HA (2010). Relation between free energy landscapes of proteins and dynamics. Journal of Chemical Theory & Computation, 6(2), 583–595. [DOI] [PMC free article] [PubMed] [Google Scholar]
- Meier C, Brookings DC, Ceska TA, Doyle C, Gong H, Mcmillan D, … Reich S (2012). Engineering human MEK-1 for structural studies: A case study of combinatorial domain hunting. Journal of Structural Biology, 177(2), 329–334. [DOI] [PubMed] [Google Scholar]
- MiniBoo NEC, Aguilar-Arevalo AA, Anderson CE, Bazarko AO, Brice SJ, Brown BC, … Zimmerman ED (2010). First Measurement of the Muon Neutrino Charged Current Quasielastic Double Differential Cross Section. doi: 10.1103/PhysRevD.81.092005 [DOI] [Google Scholar]
- Nikolaev SI, Rimoldi D, Iseli C, Valsesia A, Robyr D, Gehrig C, … Zoete V (2012). Exome sequencing identifies recurrent somatic MAP2K1 and MAP2K2 mutations in melanoma. Nature Genetics, 44(2), 133–139. [DOI] [PubMed] [Google Scholar]
- Pylayevagupta Y, Grabocka E, & Barsagi D (2011). RAS oncogenes: weaving a tumorigenic web. Nature Reviews Cancer, 11(11), 761–774. [DOI] [PMC free article] [PubMed] [Google Scholar]
- Rogers DF (2005). The role of airway secretions in COPD: pathophysiology, epidemiology and pharmacotherapeutic options. Copd-journal of Chronic Obstructive Pulmonary Disease, 2(3), 341–353. [DOI] [PubMed] [Google Scholar]
- Schuttelkopf AW, & van Aalten DMF (2004). PRODRG: a tool for high-throughput crystallography of protein-ligand complexes. Acta Crystallographica Section D, 60(8), 1355–1363. doi: doi: 10.1107/S0907444904011679 [DOI] [PubMed] [Google Scholar]
- Sebolt-Leopold JS, & Herrera R (2004). Targeting the mitogen-activated protein kinase cascade to treat cancer. Nature Reviews Cancer, 4(12), 937–947. [DOI] [PubMed] [Google Scholar]
- Sebolt-Leopold JS, Herrera R, & Ohren JF (2007). The mitogen-activated protein kinase pathway for molecular-targeted cancer treatment. Recent Results Cancer Res, 172, 155–167. [DOI] [PubMed] [Google Scholar]
- Senawong T, Phuchareon J, Ohara O, Mccormick F, Rauen KA, & Tetsu O (2008). Germline mutations of MEK in cardio-facio-cutaneous syndrome are sensitive to MEK and RAF inhibition: implications for therapeutic options. Human Molecular Genetics, 17(3), 419. [DOI] [PubMed] [Google Scholar]
- Sethi A, Eargle J, Black AA, & Luthey-Schulten Z (2009). Dynamical networks in tRNA:protein complexes. Proc Natl Acad Sci U S A, 106(16), 6620–6625. [DOI] [PMC free article] [PubMed] [Google Scholar]
- Shao Y, & Aplin AE (2010). Akt3-mediated resistance to apoptosis in B-RAF-targeted melanoma cells. Cancer Research, 70(16), 6670. [DOI] [PMC free article] [PubMed] [Google Scholar]
- Shi H, Kong X, Ribas A, & Lo RS (2011). Combinatorial treatments that overcome PDGFRβ-driven resistance of melanoma cells to V600EB-RAF inhibition. Cancer Research, 71(15), 5067–5074. [DOI] [PMC free article] [PubMed] [Google Scholar]
- Smalley KSM, Lioni M, Palma MD, Xiao M, Desai B, Egyhazi S, … Belle PV (2008). Increased cyclin D1 expression can mediate BRAF inhibitor resistance in BRAF V600E–mutated melanomas. Molecular Cancer Therapeutics, 7(9), 2876. [DOI] [PMC free article] [PubMed] [Google Scholar]
- Stetz G, & Verkhivker GM (2016). Probing Allosteric Inhibition Mechanisms of the Hsp70 Chaperone Proteins Using Molecular Dynamics Simulations and Analysis of the Residue Interaction Networks. Journal of Chemical Information & Modeling, 56(8), 1490. [DOI] [PubMed] [Google Scholar]
- Taylor SS, & Kornev AP (2011). Protein kinases: evolution of dynamic regulatory proteins. Trends in Biochemical Sciences, 36(2), 65–77. [DOI] [PMC free article] [PubMed] [Google Scholar]
- Thompson N, & Lyons J (2005). Recent progress in targeting the Raf/MEK/ERK pathway with inhibitors in cancer drug discovery. Current Opinion in Pharmacology, 5(4), 350–356. [DOI] [PubMed] [Google Scholar]
- Villanueva J, Vultur A, Lee JT, Somasundaram R, Fukunaga-Kalabis M, Cipolla AK, … Kee D (2010). Acquired resistance to BRAF inhibitors mediated by a RAF kinase switch in melanoma can be overcome by cotargeting MEK and IGF-1R/PI3K. Cancer Cell, 18(6), 683–695. [DOI] [PMC free article] [PubMed] [Google Scholar]
- Wortzel I, & Seger R (2011). The ERK Cascade: Distinct Functions within Various Subcellular Organelles. Genes & Cancer, 2(3), 195. [DOI] [PMC free article] [PubMed] [Google Scholar]
- Xie J, Ajibade AO, Ye F, Kuhne K, & Gao SJ (2008). Reactivation of Kaposi’s sarcoma-associated herpesvirus from latency requires MEK/ERK, JNK and p38 multiple mitogen-activated protein kinase pathways. Virology, 371(1), 139–154. [DOI] [PMC free article] [PubMed] [Google Scholar]
- Xing F, Persaud Y, Pratilas CA, Taylor BS, Janakiraman M, She QB, … Hefter B (2012). Concurrent loss of the PTEN and RB1 tumor suppressors attenuates RAF dependence in melanomas harboring V600EBRAF. Oncogene, 31(4), 446. [DOI] [PMC free article] [PubMed] [Google Scholar]
- Zebisch A, Czernilofsky AP, Keri G, Smigelskaite J, Sill H, & Troppmair J (2007). Signaling through RAS-RAF-MEK-ERK: from basics to bedside. Current Medicinal Chemistry, 14(5), –. [DOI] [PubMed] [Google Scholar]
- Zheng J, Trafny EA, Knighton DR, Xuong N, Taylor SS, Ten Eyck LF, & Sowadski JM (2010). 2.2 Å refined crystal structure of the catalytic subunit of cAMP-dependent protein kinase complexed with MnATP and a peptide inhibitor. Acta Crystallographica, 49(3), 362–365. [DOI] [PubMed] [Google Scholar]
Associated Data
This section collects any data citations, data availability statements, or supplementary materials included in this article.