

Abstract
Lipids and metabolites are of interest in many clinical and research settings because it is the metabolome that is increasingly recognized as a more dynamic and sensitive molecular measure of phenotype. The enormous diversity of lipid structures and the importance of biological structure–function relationships in a wide variety of applications makes accurate identification a challenging yet crucial area of research in the lipid community. Indeed, subtle differences in the chemical structures of lipids can have important implications in cellular metabolism and many disease pathologies. The speed, sensitivity, and molecular specificity afforded by modern mass spectrometry has led to its widespread adoption in the field of lipidomics on many different instrument platforms and experimental workflows. However, unambiguous and complete structural identification of lipids by mass spectrometry remains challenging. Increasingly sophisticated tandem mass spectrometry (MS/MS) approaches are now being developed and seamlessly integrated into lipidomics workflows to meet this challenge. These approaches generally either (i) alter the type of ion that is interrogated or (ii) alter the dissociation method in order to improve the structural information obtained from the MS/MS experiment. In this Perspective, we highlight recent advances in both ion type alteration and ion dissociation methods for lipid identification by mass spectrometry. This discussion is aimed to engage investigators involved in fundamental ion chemistry and technology developments as well as practitioners of lipidomics and its many applications. The rapid rate of technology development in recent years has accelerated and strengthened the ties between these two research communities. We identify the common characteristics and practical figures of merit of these emerging approaches and discuss ways these may catalyze future directions of lipid structural elucidation research.
Graphical Abstract
Lipids are essential components of the cellular milieu and are integral to many cellular functions, including forming the membrane bilayer, providing a hydrophobic environment to enable membrane protein function and interaction, serving as reservoirs for energy storage, and acting as secondary messengers.1 The immense structural diversity of the cellular lipidome and the wide dynamic range of cellular concentrations complicates lipid detection, separation, identification, and quantification. Lipids are often subdivided into eight categories: fatty acids, (FAs), glycerolipids, glycerophospholipids, sphingolipids, sterols, prenols, saccharolipids, and polyketides.2,3 The many unique classes and subclasses of molecules within each of these individual categories leads to this immense structural diversity, as is represented by the as many as 150 000 estimated unique lipid compounds.4 For example, gylcerophospholipids (GPLs), which account for 60% of the lipid mass in eukaryotic cells, consist of a glycerol backbone, a functionalized phosphate ester group, and fatty acids esterified at the sn-1 and sn-2 positions of the glycerol backbone.1 Many variations of these structures can occur, including differences in headgroup composition, fatty acyl chain lengths, the number and positions of unsaturations, stereochemistry, and modifications such as hydroxylation or alkyl chain branching. Subtle differences in the chemical structures of lipids can reflect dramatic differences in upstream biosynthesis, biochemical functionality, and downstream metabolism.5–9 For example, differences in GPL structure can affect cell membrane permeability and thickness10 as well as interactions with cholesterol.11 Differences in lipid structures have been linked to the pathophysiology of multiple health conditions,12 including cancer,13–15 liver disease,16 diabetes,17,18 chronic kidney disease,19 and Alzheimer’s Disease.20–22 While accurate identification is clearly important in the field of lipidomics, complete structural elucidation remains challenging and is an area of intense research.
LIPID ANALYSIS BY MASS SPECTROMETRY
Mass spectrometry (MS) has emerged as the preferred analytical technique for the qualitative and quantitative analysis of lipids. Though direct infusion of liquid samples can be performed using a standalone mass spectrometer, MS is often coupled to a separation technique such as gas chromatography (GC) or liquid chromatography (LC) to improve peak capacity and aid in overall analytical performance. This coupling is performed using a mass spectrometry interface and ionization source compatible with the output of the separation technology. For example, GC is typically coupled to MS using gaseous ionization sources such as electron ionization (EI) and chemical ionization (CI),23,24 while LC is typically coupled to MS using ionization techniques more amendable to liquid samples, such as electrospray ionization (ESI), atmospheric pressure chemical ionization (APCI), and atmospheric pressure photoionization (APPI).25,26 These so-called “hyphenated” techniques, GC–MS and LC–MS, are widely used due to their high sensitivity, high specificity in mixture analyses, and speed. In situ microprobe analyses of solid samples have also gained popularity in lipid studies and are referred to collectively as imaging mass spectrometry (IMS) or mass spectrometry imaging (MSI) approaches.27–29 These methods extract material directly from the substrate surface in a regiospecific manner to then sample into the mass spectrometer.30 This is commonly performed using a liquid microextraction setup31,32 or a surface sampling ionization technique such as matrix-assisted laser desorption/ionization (MALDI),33,34 desorption electrospray ionization (DESI),35,36 or secondary ionization mass spectrometry (SIMS).37,38 The diverse array of ionization techniques listed above that can be employed to analyze lipid samples produces a wide variety of ion types, which in part determines the ability to accurately identify lipids of interest. Lipid analyses are ultimately performed in many different fashions (e.g., targeted, untargeted, quantitative, etc.), on many different platforms, and the data analyzed in many different ways. Complete details on these workflows are beyond the scope of the current discussion and readers are directed to multiple excellent resources on these topics.1,39–42 This Perspective will instead focus on emerging technologies that enable accurate lipid structural elucidation.
LIPID IDENTIFICATION
A critical step to any lipid analysis is accurate lipid identification. For example, LC–MS lipidomics experiments typically rely on some combination of chromatographic retention time, ion mobility collision cross section (CCS) values, high-resolution accurate mass (HRAM) measurements, and/or tandem mass spectrometry (MS/MS or MSn) to aid in lipid identification. Ion mobility-mass spectrometry (IM-MS) provides for the rapid gas-phase separation of isobaric and isomeric lipids and can be used to aid in identification by comparing CCS values to databases of known reference standards.43–49 IM-MS has even been used to separate lipid double bond and geometric isomers.50,51 High-resolution accurate mass can provide for m/z measurements with better than parts per million (ppm) mass accuracies, allowing for the identification of lipid elemental composition and the separation of isobaric lipids.52,53 However, chromatography, IM-MS, and HRAM do not provide direct information on the arrangement of chemical bonds within the lipid. Alternatively, tandem mass spectrometry, whereby an ion of interest is first selected, transformed in some fashion, and then the products of that transformation measured, can provide direct structural information.54 For example, a common ion transformation option is to fragment the ion of interest through energetic collisions with neutral gas molecules via collision induced dissociation (CID).55 The decomposition products of this ion transformation (i.e., dissociation) step can act as puzzle pieces that allow the original chemical structure of the lipid to be determined.56–58 The degree to which the various structural moieties of the lipid can be properly identified and arranged is determined by the extent and type of fragment ions observed.
While unambiguous structural information is desirable, it is difficult in practice to obtain identification beyond the fatty acyl/alkyl level. Indeed, many experiments report lipid identifications using only sum composition nomenclature (Figure 1). Sum composition nomenclature, also known as total carbon:double bond (TC:DB) nomenclature, describes the lipid class using an abbreviation followed by two numbers separated by a colon that indicate the total number of carbon atoms and double bonds in the fatty acids, respectively.2,3 While sum composition identification is readily obtained in most MS experiments, a single sum composition identification can represent dozens of individual lipid compounds when considering the identity and location of fatty acyl groups as well as the location, acyl chain branching, and the stereochemistry of carbon–carbon double bonds.4 The failure to adequately separate and identify these isomers from one another precludes a definitive molecular characterization that would be useful in, for example, biomarker identification and biochemical pathway analyses. Nuclear magnetic resonance (NMR) can be used for complete structural characterization but requires a relatively large amount (~milligrams) of purified sample and long analysis times (~days), resulting in very low throughput that is not practical for most lipidomics experiments. Consequently, tandem mass spectrometry is critical for achieving a high degree of molecular specificity in lipid identification.
Figure 1.

Hierarchy of lipid identification is based on the level of structural detail that can be accurately assigned to the molecule. Examples of a PC lipid identification are given at each level of classification.
STRUCTURAL CHARACTERIZATION BY TANDEM MASS SPECTROMETRY
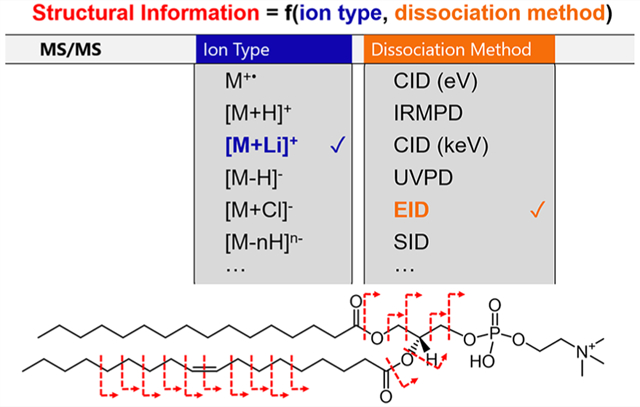
The extent of primary structural information that can be obtained from a tandem mass spectrometry experiment is largely a function of the type of ion generated from the analyte molecule and the dissociation method.59 The type of ion that is generated from the analyte molecule is highly dependent on the ionization technique employed (e.g., EI, CI, ESI, MALDI, etc., which can be performed in positive or negative ion mode), the nature of the sample (e.g., in solid or liquid form and the purity of the sample), and the chemical makeup of the analyte. As may be evident from the variety of ionization techniques and sample types mentioned above, many different types of ions can be generated (e.g., radical cations, protonated ions, sodiated ions, deprotonated ions, multiply deprotonated ions, etc.). The nature of the lipid headgroup often plays an important role in the type of ion that can be formed. For example, anionic lipids such as phosphotidylethanolanmines (PEs), phosphotidylglycerols (PGs), phosphotidylserines (PSs), phosphotidyinositols (PIs), and phosphatidic acids (PAs) are all readily observed in negative ion mode as [M − H]− in ESI and MALDI experiments, though it should be noted that ionization suppression can cause the preferential ionization of certain lipid classes over others in complex mixtures.60–62 Conversely, a phosphotidylcholine (PC) contains a fixed positive charge due to the quaternary ammonium moiety on the phosphocholine headgroup and is readily observed in positive ion mode as [M + H]+.63 The range of ion types that can be formed for an analyte of interest can be further expanded by altering the sample conditions or through chemical derivatization. In some instances, this alteration is performed to facilitate analyte ionization (e.g., adding acid to a liquid sample to promote positive ion formation in ESI), while in other instances this alteration is performed to generate an ion type that will fragment to give better or complementary structural information upon ion dissociation during tandem mass spectrometry.64 For example, lithium cationization of triacylglycerols via the addition of lithium acetate has provided for the formation of [M + Li]+ ion types that enabled the localization of double bonds upon MS3 analysis, which was not possible via CID of the typically observed [M + H]+ ion type.65 While sample doping and condensed-phase derivatization have been used to facilitate lipid structural identification for decades, there have been important recent advances in the types of chemistries employed and improved levels of integration with LC–MS and imaging mass spectrometry lipid workflows.66–70
Alternative dissociation methods have also emerged as promising options for precise lipid structural elucidation. The vast majority of lipid MS/MS analyses conducted to date have utilized CID as the ion dissociation method.1,58,60,63,65,71,72 This is in part because the energetic collisions with a neutral background gas target that are employed during CID are readily accessible on almost any commercial platform, making CID an attractive option for MS/MS interrogation. However, the increasing availability of sophisticated mass spectrometry instrumentation has allowed for a greater exploration of alternative dissociation methods. A variety of ion/neutral, ion/ion, ion/photon, and ion/electron interactions can be employed to perform ion transformation and ion dissociation.59 It should be noted that there is a distinction made here between a “dissociation method” and an “activation method.” The term “dissociation method” is a broader term used to describe any process that leads to ion fragmentation. This distinction is made because some dissociation methods involve a change in ion type prior to fragmentation. For example, in electron capture dissociation (ECD), fragmentation takes place from a different ion type (i.e., a charge reduced radical cation) than that of the original mass-selected precursor ion (i.e., an even electron cation):73–76
| (1) |
The new ion that is produced during the ECD process may be formed with sufficient vibrational and/or electronic energy to drive subsequent fragmentation. Nonetheless, fragmentation occurs from a new ion type. By contrast, the term “activation method” indicates an approach that deposits energy into an ion without altering the ion type. CID, whereby the population of vibrational states in the ion is altered through energetic collisions with a neutral gas target, is an example of an ion activation method:55,77
| (2) |
CHEMICAL DERIVATIZATION PRIOR TO IONIZATION
Historically, a variety of solution-based cationization, charge switching, and chemical derivatization strategies have been employed to improve ionization efficiency, quantification, and identification.64,78–85 Oftentimes, the type of ion that is most readily generated from the sample using the desired ionization technique does not provide comprehensive structural information upon MS/MS analysis. Recently, there have been several reports highlighting the use of novel condensed-phase derivatization methods to alter the analyte prior to ionization.86–88 This process changes the type of lipid ion that is ultimately analyzed by MS/MS. One recent example of this is the use of the classical Paternò–Büchi (PB) photochemical derivatization reaction to specifically form adducts at carbon–carbon double bonds (C=C) under ultraviolet (UV) irradiation.89–91 Several groups have developed the PB reaction into an online chemical derivatization method enabling the identification of double bond locations in lipids.10,92 This classic [2 + 2] cycloaddition photochemical reaction can be coupled with LC–MS/MS by adding a PB reagent into the mobile phase and then exposing the capillary to UV light for fast and selective modification of the C=C bonds in lipids prior to ionization (Figure 2B).93 The addition of acetone as the PB reagent to unsaturated lipids produces product ions with a mass shift of +58 Da. When the PB products undergo subsequent low-energy CID, abundant fragment ions are produced from cleavages at the original C=C locations. These diagnostic ions enable C=C location determination (Figure 2A).93 The online Paternò-Büchi reaction has been shown to localize the double bond positions in monounsaturated fatty acids such as oleic acid and cis-vaccenic acid as well as along the acyl chains in glycerophospholipids (GPLs), including PCs, PEs, and PSs.10,89,93
Figure 2.

(A) Schematic representation of PB reactions and formation of C=C diagnostic ions from lipid C=C location isomers A and B (C=C bond located at Δm and Δn positions, respectively) from MS/MS. (B) Analysis flow for the characterization and quantitation of C=C location isomers of lipid. Reproduced with permission from ref 93. Ma, X.; Chong, L.; Tian, R.; Shi, R.; Hu, T. Y.; Ouyang, Z.; Xia, Y., Identification and quantitation of lipid C=C location isomers: A shotgun lipidomics approach enabled by photochemical reaction. Proc. Natl. Acad. Sci. 2016, 113, 2573–2578. Copyright 2016 National Academy of Sciences.
Identification of lipid double bond positional isomers provides a high degree of molecular specificity that enables new insight into lipid biochemistry. For example, lipid extracts from normal and cancerous mouse breast tissues analyzed using a PB reaction workflow enabled the differentiation and identification of C=C position isomers of fatty acid 18:1 and C18:1-containing PCs.93 The relative percentage of the Δ11 isomer was found to be elevated in the cancerous tissues for several lipids, including FA 18:1, PC 18:0/18:1, and PC 18:1/18:1.93 It was also shown that the relative percentage of the PC 18:0/18:2 (Δ9, Δ12) isomer within PC 36:2 was significantly decreased in cancerous tissue. On-tissue PB derivatization has also been used in conjunction with imaging mass spectrometry in order to identify the C=C location in phospholipids and glycolipids in different regions of mouse brain tissue sections.94 On-tissue derivatization was achieved by depositing a layer of benzaldehyde onto a thin tissue section using a custom-built chilled reaction chamber. Subsequent irradiation of the sample with 254 nm UV light for 1–2 min initiated the PB reaction. PB-MALDI-2-MS/MS imaging was then used to identify multiple isomer constituents of PC 36:1 throughout the tissue. Specifically, PC 18:0_18:1 (Δ9) and PC 18:0_18:1 (Δ11) were determined to have significantly different spatial distributions in the cerebellum.94 The addition of a spatial dimension to these types of measurements provided by imaging mass spectrometry offers exciting potential for PB reaction workflows.
The analytical advantages provided by condensed-phase derivatization include relatively simple experimental setups, minimal need for instrument modifications, and inexpensive derivatizing agents that are compatible with both LC–MS/MS and imaging mass spectrometry lipid analyses. However, some condensed-phase derivatization reactions can suffer from low reaction yields and low derivatization efficiency due to incomplete reactions and can result in poor ionization and/or fragmentation efficiency. The PB reaction discussed here takes tens of seconds. While this time scale is an improvement over previous techniques, these PB reactions are not as rapid as the gas-phase reactions that will be discussed in later sections. In any case, the ability to detect and determine relative quantities of fatty acid and lipid isomers provides an unprecedented level of molecular insight into aid in understanding disease pathophysiology.
CHANGING THE ION TYPE AFTER IONIZATION
An emerging area of lipid research involves altering the ion type in the gas-phase while it is inside the mass spectrometer. This process occurs via a chemical reaction after ion generation and sampling into the instrument but prior to ion detection.95,96 Gas-phase approaches are attractive because they do not irreversibly modify the original sample as in condensed-phase doping or derivatization. Gas-phase reactions are readily controlled via the computer-controlled electronic selection and admission of the reactants, resulting in well-defined reaction conditions. The high degree of control over the reactant identities results in a much “cleaner” product.97 As most reactions in mass spectrometry are under kinetic control, it is easy to force a gas-phase reaction to completion using precisely controlled reactant number densities and reaction times.98–100 Gas-phase reactions can also be much more rapid than condensed-phase analogues. Though gas-phase reaction workflows often require instrument modifications or specialized hardware, the lack of solvent in the gas-phase can result in unique chemical reactivity not possible in typical condensed-phase reactions.101,102
Gas-Phase Ion/Molecule Reactions.
Gas-phase ion/molecule reactions are one way to change the ion type to a more structurally informative ion type in order to improve lipid identification.103–107 For example, ozone-induced dissociation (OzID) involves a gas-phase ion/molecule reaction between lipid analyte ions and gaseous ozone that results in fragment ions diagnostic of the C=C location in the precursor lipid ion.108 Hardware modifications of a mass spectrometer must be performed in order to allow the introduction of ozone vapors produced from an external supplemental ozone generator into the ion-trapping region of the instrument.109 The OzID reaction between a mass-selected lipid ion and neutral ozone inside the instrument then produces two characteristic product ions, the “Criegee ion” and an aldehyde ion 16 Da apart, formed via oxidative cleavage of the double bond.110,111 This pair of product ions is produced for each double bond and has been used to determine the positions of double bonds in both monounsaturated and polyunsaturated lipids.110 Sequential CID and OzID can produce characteristic product ions that allow for the assignment of the relative position of the acyl chains on the glycerol backbone. Additional preliminary work has shown that cis/trans double bond stereochemistry can be identified using OzID based on differences in the relative abundances of the diagnostic OzID product ions, though further experiments are required to reliably make these determinations in unknown samples.112
While OzID has also been successfully coupled with liquid chromatography in order to facilitate lipid identification,113 OzID reactions are still relatively slow compared to the time scales of LC–MS/MS experiments, resulting in a lower duty cycle and limiting the resolution and speed of the chromatography. However, improvements have been made by increasing the amount of ozone within the ion-trapping region without negatively affecting the instrument’s performance.112 Additionally, OzID has been implemented in the high pressure environment of an ion mobility separation cell, thereby increasing the number density of ozone and allowing for faster reaction times more suitable for chromatographic time scales.113 OzID has also been coupled with imaging mass spectrometry to reveal the spatial distributions of double bond and sn-positional lipid isomers in mouse brain tissue.114 For example, the relative fraction of Δ7 and Δ9 double bond positional isomers present in both PC 34:1 and PC 36:1 was determined to vary in the white and gray matter (Figure 3).114 In an imaging mass spectrometry experiment, the presence of multiple lipid isomers can result in the spatial distribution of an ion image representing not the spatial distribution of a single compound but rather representing the confluence of several compounds that have overlapping m/z values, resulting in inaccurate depictions of molecular distributions. While the isomeric resolution afforded by OzID offers exciting new information on lipid distributions in tissues, the 10 s-per-pixel reaction time of this reaction results in significantly increased imaging times and lower throughput.114 In general, ion/molecule reactions such as OzID are attractive because they can be implemented on a wide variety of lipid classes including gylcerophospholipids, fatty acids, sphingomyelins, and triacylglycerols.
Figure 3.

(a) MALDI-OzID spectrum of [PC(34:1) + Na]+ ions revealing the presence of n-9 and n-7 db isomers. (b) Corresponding full-scan FTMS image of the [PC(34:1) + Na]+ ion (m/z 782.5680) and (c) fractional distribution image of n-7 and n-9 isomers (n-7)/(n-7 + n-9)) showing an enrichment of the n-7 isomer in the gray matter. (d–f) Analogous spectra and images obtained for [PC(36:1) + Na]+, again revealing an enrichment of the n-7 isomer in the gray matter. OzID and full-scan-FTMS data were acquired from consecutive tissue sections. Graphs show the n-7 and n-9 relative isomer percentages for (g) PC(34:1) and (h) PC(36:1) within the white and gray matter. Error bars represent the coefficient of variation from each region (n = 5 each for white and gray matter regions). Reproduced with permission from Wiley ref 114. Paine, M. R. L.; Poad, B. L. J.; Eijkel, G. B.; Marshall, D. L.; Blanksby, S. J.; Heeren, R. M. A.; Ellis, S. R. Mass spectrometry imaging with isomeric resolution enabled by ozone-induced dissociation. Angew. Chem. Int. Ed. 2018, 57, 10530–10534. Copyright 2018 Wiley.
Gas-Phase Ion/Ion Reactions.
Another method to change the ion type in the gas-phase is through the use of ion/ion reactions performed by reacting lipid analyte ions generated from one ionization source with oppositely charged reagent ions generated by a secondary ionization source in an ion trap reaction vessel inside the mass spectrometer.115–119 Often-times performed in conjunction with CID, these reactions can enable the ion types to be switched on demand to then provide for structural information independent of the initial ion type.120–123 Indeed, the lipid ion can be generated from the sample in whatever form is most convenient and then transformed to a more structurally informative ion type.97,124–126 A wide variety of gas-phase ion/ion transformation reactions have been described for peptides, proteins, and more recently, lipids.95,96,99,127–129 The majority of lipid ion/ion reactions performed to date utilize lipids produced from direct infusion ESI and involve the gas-phase complexation of the reactants to produce the transfer of one or more particles (e.g., protons or metal ions).96,130 So long as at least one of the reactants is multiply charged, the product ions of the reaction may be charged and observed in the mass spectrum. For example, ion/ion reactions with magnesium tris-phenanthroline cations have been used to convert fatty acid anions into metalated cations that allow for the localization of carbon–carbon double bonds upon subsequent CID.131–134 This type of reaction is termed a charge inversion ion/ion reaction,135–137 as the polarity of the lipid analyte is switched from a negative to a positive ion type:
| (3) |
For monounsaturated and some polyunsaturated fatty acids, a series of charge remote fragmentation product ions produce a spectral intensity gap around the double bond that can be used to identify the location of the double bond(s) upon CID of the [FA − H + MgPhen]+ ion types.131–133 Ion/ion reactions using magnesium tris-phenanthroline cationic reagents have also been used for the identification of glycerophospholipids.134,138 PE, PI, PA, PG, or PS glycerophospholipids are first ionized in the negative ion mode to produce [M − H]− ion types. Subsequent CID of the [M − H]− ion produces [FA − H]− product anions via cleavage of the ester bonds at the sn-1 and sn-2 positions. The FA fragment ions are then reacted with magnesium tris-phenanthroline dications to form a [FA − H + Mg(Phen)2]+ complex ion. CID can be then be performed on this charge inverted FA product cation to determine the positions of carbon–carbon double bonds.138
Another gas-phase charge inversion ion/ion reaction that has been used for the identification of fatty acid positions in PCs involves the transformation of PC monocations into demethylated PC anions via reaction with doubly deprotonated 1,4-phenylenedipropionic acid (PDPA) reagent anions.124,125 CID of the protonated PC precursor ions largely produces the phosphocholine fragment ion, providing no information on the presence or identity of sn-positional isomers. However, CID of the demethylated [PC − CH3]− product ion results in cleavage at the sn-1 and sn-2 positions on the glycerol backbone.124 The m/z values of the fragment ions are used to determine the identities of the fatty acids, and the relative abundances are used to determine the sn-1 and sn-2 positions (under low-energy CID conditions, cleavage at the lipid sn-2 position is favored).58 However, identification of sn-position via this method should be performed with caution, as the relative abundances of fragment ions formed from cleavage at the sn-1 and sn-2 positions can also depend on other factors, such as fatty acid chain length and degree of saturation. Additionally, mixtures of multiple positional isomers are likely representative of biological samples, further complicating this interpretation.139 Nonetheless, this methodology has been particularly useful in the imaging mass spectrometry analysis of PCs in rat brain tissue (Figure 4).140 While PC anions subjected to CID readily produce fragment ions indicative of the identity and sn-position of the fatty acyl chains in the lipid,58 ionization suppression from more acidic endogenous glycerophospholipids generally prevents the detection of PC lipids directly from tissue in negative ion mode MALDI imaging mass spectrometry.141 The gas-phase charge inversion reaction with PDPA transforms the PC cation ion type most readily generated from the tissue surface to a more structurally informative demethylated ion type without perturbing the original sample. These measurements were made from different substructures within the brain, including the granular layer, cerebral cortex, hippocampus, and corpus callosum.140 The generation of a calibration curve using reference standards enabled for the relative quantification of sn-positional isomers. Up to five sn-positional isomers were found for each sum composition-identified PC and their abundances were found to vary significantly (>25%) in different regions of the brain.140 As each lipid isoform may have a unique cellular function or metabolism, these data underscore the importance of accurately separating and identifying the many isobaric and isomeric lipids that can complicate image interpretation and spectral analysis. Although ion/ion reactions have not yet been performed at every pixel during an imaging mass spectrometry experiment, our lab is actively developing reactions and hardware to enable this gas-phase chemistry to be performed with no loss of instrument throughput.
Figure 4.

(a) Ion image for m/z 786.601 in the rat brain, tentatively identified as PC36:2 by an accurate mass measurement. A PDPA charge inversion ion/ion reaction of (b) PC36:2 generated directly from the tissue surface (c) produces a PC/PDPA anionic complex and a demethylated PC anion. (d) Ion isolation of the demethylated PC anion followed by SORI CID produces fragment ions diagnostic for 16:0, 18:2, 18:1, 18;0, and 20:2 fatty acid tails in the lipid, allowing for the identification of PC20:2_16:0, PC18:0_18:2,, and PC18:1/18:1 isomers. Note that circles indicate positive ion mode analysis, squares indicate negative ion mode analysis, number signs denote fragment ions related to PDPA, asterisks denote harmonics/electronic noise, and the lightning bolt is used to denote the ion subjected to CID. All spectra are single scan measurements. Reproduced with permission from ref 140. Specker, J. T.; Orden, S. L. V.; Ridgeway, M. E.; Prentice, B. M. Identification of phosphatidylcholine isomers in imaging mass spectrometry using gas-phase charge inversion ion/ion reactions. Anal. Chem. 2020, 92, 13192–13201. Copyright 2020 American Chemical Society.
While ion/ion reactions require specialized instrument hardware to alternatively generate and simultaneously store ion populations of opposing polarities, the widespread adoption of electron transfer dissociation (ETD) by the mass spectrometry community has allowed the instrument hardware required to perform ion/ion reactions to become increasingly available on a variety of commercial platforms. A diverse array of ion/ion reactions can now be explored with relatively minor instrument modifications. The ion/ion reactions listed above are relatively simple reactions involving charge switching reactions mainly involving multiple particle transfers. However, more sophisticated gas-phase covalent derivatization chemistries have been recently developed for use with peptide and protein analytes and may also find use in lipid analyses.101,142–150 The large exothermicities of these reactions due to the Coulombic recombination energy of the cation and anion reaction partners result in very large reaction cross sections and efficient reactions.151,152 Reaction rates scale based on the square of the ion charges and ion/ion reaction times occur on the order of hundreds of milliseconds, which can be orders of magnitude faster than ion/molecule reactions.100,153 While this exothermicity can aid in driving the ion/ion reaction over any internal activation barriers, it simultaneously makes ion/ion reactions less sensitive to reaction barriers compared to ion/molecule reactions. Ion/molecule reactions instead rely on long-range ion dipole and ion/induced-dipole potentials, which fall off much more quickly than the Coulombic attractions of oppositely charged ions.95,127,151 The sensitivity of ion/molecule reactions to energetic barriers makes them particularly attractive for identifying isomers with small critical energy differences,154,155 such as the stereochemistry of lipid double bonds.
ALTERNATIVE ION DISSOCIATION METHODS
Early experiments by Gross and co-workers laid the foundation for lipid structural elucidation by tandem mass spectrometry. These analyses were largely performed on sector instruments equipped with fast atom bombardment (FAB) ionization sources and utilized high-energy CID (>1 keV) to readily identify the presence and location of carbon–carbon double bonds,156–162 largely via charge remote fragmentation (CRF) mechanisms.163,164 Despite this success, the ionization and fragmentation efficiencies of these instruments were relatively low. As multisector instruments equipped with FAB were replaced with more modern instruments such as linear ion traps (LITs) equipped with ESI, instruments that could access the high-energy CID conditions required to achieve CRF became less common. In turn, multistage tandem mass spectrometry (e.g., MS3 and MS4) experiments were developed on ion trap platforms to achieve accurate lipid identification.65,165,166 Recent instrumentation advances have made several additional ion dissociation methods much more broadly accessible to the MS community, including ultraviolet photodissociation (UVPD) and electron induced dissociation (EID).
Ultraviolet Photodissociation.
The use of ion/photon interactions for ion activation is particularly attractive because it holds the potential to provide wavelength-dependent information.167–169 CID is largely considered universal and nonspecific. While infrared multiphoton dissociation (IRMPD) at longer wavelengths (e.g., 10.6 μm) is considered a broadband, slow-heating method analogous to low-energy CID,170 ultraviolet photodissociation (UVPD) may afford a level of specificity due to the dependence of absorbance upon the wavelength of incident light. Selective ion activation can be achieved using chromophore-specific irradiation, typically in the ultraviolet range of the electromagnetic spectrum (i.e., 200–600 nm).171,172 Higher energy UVPD at shorter wavelengths has recently been used to identify carbon–carbon double bond positional isomers for a variety of fatty acids,173 sphingolipids,174 and GPLs.175 The photon energy of 193 nm light is 6.4 eV, significantly higher than most bond energies.167 Combined with the fact that the chemical compositions of many biomolecules allows them to act as universal chromophores below 200 nm, 193 nm UVPD provides for the facile cleavage of most bonds within lipids.176,177 For example, 193 nm UVPD has been used to determine double bond positions in monounsaturated fatty acid isomers as well as in conjugated and unconjugated polyunsaturated fatty acids.173 UVPD has also been used to localize double bonds in PEs, PGs, PAs, and PIs in the negative ion mode178 and in sphingolipids in the positive ion mode.174 The rapid time scale of UVPD and CID/UVPD methods have led to their successful integration with LC–MS/MS, demonstrating picomole limits of detection and enabling sn-position and double bond position assignment.175,178 This speed has also made UVPD amendable to implementation in imaging mass spectrometry workflows. Desorption electrospray ionization (DESI) imaging mass spectrometry has been coupled with UVPD in order to map the spatial distributions of double bond lipid isomers across sections of human lymph node tissue.179 Differences in the relative abundances of PC 16:0_18:1 (Δ9) and PC 16:0_18:1 (Δ11) isomers were detected in regions of the tissue that contained thyroid cancer metastasis compared to the normal tissue.179
Until recently, the cost and hardware implementation barrier of incorporating a supplemental laser prevented widespread adoption of photodissociation. However, new commercial platforms are available that come equipped with a UVPD laser.180 The efficiency and speed of UVPD methods have increased significantly in recent years.181 Efficiency increases are in part due to the improved ion/photon overlap achieved on ion traps equipped with UVPD (previous setups employed UVPD in TOF/TOF systems that required careful synchronization of only a single, short laser pulse as the ion packet traversed the instrument).167 PD may also be preferred to CID in instances where the addition of a collision gas would detrimentally affect the operation of the mass spectrometer (e.g., in a Fourier transform ion cyclotron resonance (FTICR) mass spectrometer). It should be noted that the wavelength specificity of PD approaches can be lost if electronic-to-vibrational relaxation occurs prior to dissociation.167 This rapid intramolecular relaxation can redistribute the energy from the ion activation step throughout the internal degrees of freedom of the molecule on time scales faster than dissociation and is a common competing pathway in nonergodic ion activation approaches.182 However, this behavior tends to be more prevalent with larger molecules and may not be as significant in UVPD of lipids.
Electron Induced Dissociation.
Electron-based dissociation methods provide unique dissociation pathways not found with vibrational excitation methods and can result in more informative lipid fragmentation. Electron induced dissociation (EID, also historically termed electron impact excitation of ions from organics (EIEIO))183 methods covering a range of electron energies (i.e., 5–50 eV) have been employed to identify GPL class, fatty acid chain identities, relative quantities of sn-chain positional isomers, and double bond positions on synthetic standards and lipid extracts:184–189
| (4) |
These methods have also been successfully applied to the identification of glycerolipids, sphingolipids, and fatty acids. For example, the identification of the double bond locations can be determined in lysolipids by the observed disruption of the 14 Da fragment ion spacing and a “v”-shaped intensity profile (Figure 5).184 Additionally, EID is one of the few techniques that has been demonstrated to identify the regioisomeric position (cis/trans) around the double bond.187 This is distinguishable due to characteristic differences in the fragmentation patterns of the carbon–carbon single bonds neighboring the C=C.
Figure 5.

EIEIO spectra of synthesized (LPC(18:1(9Z)) (top spectrum) and LPC(18:0) (bottom spectrum). Electron energy was 10 eV, and electron irradiation time was 20 ms in the trapping mode (accumulated for 200 s). The glycerol portions were cleaved well by EIEIO. The peak at m/z 184.072 indicated the sample molecule is a PC. m/z 226.080 (labeled as “227.091-H”) indicates that the acyl chain is attached at the sn-1 location. The solid red line for sn-2 indicates a regioisomeric diagnostic peak, and the dashed red lines indicates glycerol fragments used for validation of the sn-2 acyl group. A mass shift of 2H and the significant V shape intensity profile indicated by the dashed line appeared at the double bond location between C9 and C10 in the case of LPC(18:1(9Z)). Reproduced with permission from ref 184. Campbell, J. L.; Baba, T. Near-Complete Structural Characterization of Phosphatidylcholines Using Electron Impact Excitation of Ions from Organics. Anal. Chem. 2015, 87, 5837–5845. Copyright 2015 American Chemical Society.
EID methods have been successfully utilized for the comprehensive and quantitative analysis of complex biological samples. Historically, electron-based fragmentation could only be achieved on FTICR instruments, which leverage a magnetic field to combat the difficulty in simultaneously confining very low m/z electrons with relatively moderate m/z analyte ions.182,189,190 The mismatch in pseudopotential well depths between electrons and most ions makes their simultaneous storage nearly impossible using conventional electrodynamic fields.191 However, a number of technological developments have provided for ion/electron interactions on linear ion trap, triple quadrupole (QqQ), and quadrupole-time-of-flight (Q-TOF) instruments. These developments include improvements in miniature magnet technology,192 crossed quadrupole arrays,193 and digital ion trap waveforms,194 many of which are now commercially available. These new technologies have allowed for lipid EID analysis during direct infusion, IM-MS, and LC–MS/MS experiments. EID has also been used to identify double bond and sn-positional isomers in tissue profiling experiments.195 This enabled the relative abundances of these isomers to be compared in different regions of rat brain tissue, though low EID fragmentation efficiency prevented the acquisition of complete tissue images. The range of electron energies utilized for EID experiments varies significantly depending on the instrument platform and the analyte under study. In most cases, the signal intensities of fragment ions produced by EID appear to be relatively low. This is likely due to low efficiency and/or signal dilution into the numerous fragmentation channels. Signal averaging can combat this challenge in some cases but subsequently decreases throughput and instrument duty cycle. The extensive fragmentation produced via EID can also make spectral interpretation challenging, requiring a trained eye to identify the diagnostic peaks and patterns. However, EID remains one of a select few methods that are currently able to obtain confident information about cis/trans double bond stereochemistry.187
CONCLUSIONS AND FUTURE PERSPECTIVES
Oftentimes, ion type alteration and novel ion dissociation approaches are combined to improve lipid structural elucidation. For example, condensed-phase fatty acid cationization has been used to improve the extent of fragmentation upon UVPD173 and EID.190 More than one ion activation/dissociation method can be combined as part of a “hybrid” MSn strategy. For example, sequential CID and OzID has been used to characterize the ester positions in branched chain hydroxy fatty acids.196 Similarly, “hybrid” CID/UVPD (or UVPD/CID) MSn methods have recently been reported for improved lipid structural characterization.197,198 Multiple methods can be combined in this fashion into a single workflow, or a single method may perform both ion type alteration and dissociation (e.g., OzID). The extent and type of fragmentation that is desired is highly dependent on the experiment. A balance is often struck between extensive fragmentation that can dilute ion signal into many product ion channels and overly complicate the mass spectrum and selective fragmentation that gives only a few abundant fragment ions from select cleavages at a few specific bonds. The latter case, for example, may be more useful in sensitive quantification experiments. Some of these tools and methods will likely enjoy widespread adoption, while others will only be used in specialized circumstances or may never find a particular niche. However, there will always be a need for new and improved tools where there are unmet needs. Persistent challenges in lipid identification require that new tools constantly be developed. Fortunately, the chemical and instrumental phase space that can be explored by creative investigators for new solutions is vast (and the approaches that have been discussed in this perspective certainly do not represent an exhaustive list!). For example, a dual-purpose reactive benzophenone MALDI matrix was recently developed for use in imaging mass spectrometry experiments that simultaneously provides for analyte desorption and ionization while also serving as a Paternò–Büchi derivatization reagent.199 The laser light from the MALDI process is used to drive the PB reaction and allow for C=C double bond localization in GPLs. Other recent reports have demonstrated the use of online oxidation of C=C double bonds in DESI imaging mass spectrometry experiments to characterize unsaturated lipid isomers.200,201 Other ion dissociation methods may also ultimately find greater utility in lipid analyses. For example, metastable atom-activated dissociation (MAD)202 and surface induced dissociation (SID)203 have enjoyed success in protein and peptide sequencing and have also shown promising results for lipid structural elucidation.
In this age of molecular science, mass spectrometry-based lipidomics workflows offer enormous potential for biological discovery by both comprehensively generating and testing hypotheses. However, critical to realizing this potential is the continual development of analytical technologies and their application to important problems in health, disease, the environment, energy, etc. While lipid analysis by mass spectrometry has enjoyed widespread adoption and success, modern studies are already stressing the limits of the current analytical technologies. Continued improvements in molecular specificity are crucial in order to more accurately answer increasingly complicated research inquiries. The diverse array of emerging technologies highlighted in this perspective all seek to improve lipid structural elucidation. While these technologies vary in their approach to this challenge, they all share the ability to seamlessly couple to existing LC–MS/MS, imaging mass spectrometry, and/or other lipidomics workflows. Advances in commercially available hardware and instrumentation have greatly accelerated the development of fundamental ion chemistry approaches. Indeed, the recent emergence of the additional “hybrid” MSn strategies mentioned above is evidence for this. Once restricted to sophisticated research laboratories, these approaches are now rapidly being disseminated and adopted worldwide to study a variety of different analytes and sample types. The availability and ease of use of these technologies significantly broadens the scope of lipid experiments that can be explored by investigators and will only improve as mass spectrometry technologies continue to mature.
ACKNOWLEDGMENTS
This work was supported by the National Institutes of Health (NIH) under Award R01GM138660 (National Institute of General Medical Sciences (NIGMS)). J.R.B. was supported by a Graduate Research Fellowship from the University of Florida.
Footnotes
The authors declare no competing financial interest.
Complete contact information is available at: https://pubs.acs.org/10.1021/acs.analchem.1c00061
REFERENCES
- (1).Han X; Gross RW Mass Spectrom. Rev 2005, 24, 367–412. [DOI] [PubMed] [Google Scholar]
- (2).Fahy E; Subramaniam S; Brown HA; Glass CK; Merrill AH Jr.; Murphy RC; Raetz CR; Russell DW; Seyama Y; Shaw W; et al. J. Lipid Res 2005, 46, 839–61. [DOI] [PubMed] [Google Scholar]
- (3).Liebisch G; Vizcaíno JA; Köfeler H; Trötzmüller M; Griffiths WJ; Schmitz G; Spener F; Wakelam MJ J. Lipid Res 2013, 54, 1523–30. [DOI] [PMC free article] [PubMed] [Google Scholar]
- (4).Sud M; Fahy E; Cotter D; Brown A; Dennis EA; Glass CK; Merrill AH; Murphy RC; Raetz CRH; Russell DW; et al. Nucleic Acids Res 2007, 35, D527–D532. [DOI] [PMC free article] [PubMed] [Google Scholar]
- (5).Yamashita A; Sugiura T; Waku K J. Biochem 1997, 122, 1–16. [DOI] [PubMed] [Google Scholar]
- (6).Schaloske RH; Dennis EA Biochim. Biophys. Acta, Mol. Cell Biol. Lipids 2006, 1761, 1246–1259. [DOI] [PubMed] [Google Scholar]
- (7).Miyazaki M; Ntambi JM Fatty acid desaturation and chain elongation in mammals. In Biochemistry of Lipids, Lipoproteins and Membranes, 5th ed.; Vance DE, Vance JE, Eds.; Elsevier: San Diego, CA, 2008; Chapter 7, pp 191–211. [Google Scholar]
- (8).Sul HS; Smith S Fatty acid synthesis in eukaryotes. In Biochemistry of Lipids, Lipoproteins and Membranes, 5th ed.; Vance DE, Vance JE, Eds.; Elsevier: San Diego, CA, 2008; Chapter 6, pp 155–190. [Google Scholar]
- (9).Vance DE; Vance JE Phospholipid biosynthesis in eukaryotes. In Biochemistry of Lipids, Lipoproteins and Membranes, 5th ed.; Vance DE, Vance JE, Eds.; Elsevier: San Diego, CA, 2008; Chapter 8, pp 213–244. [Google Scholar]
- (10).Zhang W; Shang B; Ouyang Z; Xia Y Anal. Chem 2020, 92, 6719–6726. [DOI] [PubMed] [Google Scholar]
- (11).Martinez-Seara H; Róg T; Pasenkiewicz-Gierula M; Vattulainen I; Karttunen M; Reigada R Biophys. J 2008, 95, 3295–305. [DOI] [PMC free article] [PubMed] [Google Scholar]
- (12).Fadeel B; Xue D Crit. Rev. Biochem. Mol. Biol 2009, 44, 264–277. [DOI] [PMC free article] [PubMed] [Google Scholar]
- (13).Marien E; Meister M; Muley T; Fieuws S; Bordel S; Derua R; Spraggins J; Van de Plas R; Dehairs J; Wouters J; et al. Int. J. Cancer 2015, 137, 1539–1548. [DOI] [PMC free article] [PubMed] [Google Scholar]
- (14).Marien E; Meister M; Muley T; del Pulgar TG; Derua R; Spraggins JM; Van de Plas R; Vanderhoydonc F; Machiels J; Binda MM; et al. Oncotarget 2016, 7, 12582–12597. [DOI] [PMC free article] [PubMed] [Google Scholar]
- (15).Guo S; Wang Y; Zhou D; Li Z Sci. Rep 2015, 4, 5959. [DOI] [PMC free article] [PubMed] [Google Scholar]
- (16).Smit JJM; Schinkel AH; Elferink RPJO; Groen AK; Wagenaar E; van Deemter L; Mol CAAM; Ottenhoff R; van der Lugt NMT; van Roon MA; van der Valk MA; Offerhaus GJA; Berns AJM; Borst P; et al. Cell 1993, 75, 451–462. [DOI] [PubMed] [Google Scholar]
- (17).Weijers RNM Curr. Diabetes Rev 2012, 8, 390–400. [DOI] [PMC free article] [PubMed] [Google Scholar]
- (18).Prentice BM; Hart NJ; Phillips N; Haliyur R; Judd A; Armandala R; Spraggins JM; Lowe CL; Boyd KL; Stein RW; et al. Diabetologia 2019, 62, 1036–1047. [DOI] [PMC free article] [PubMed] [Google Scholar]
- (19).Noh SA; Kim SM; Park SH; Kim DJ; Lee JW; Kim YG; Moon JY; Lim SJ; Lee SH; Kim KP J. Proteome Res 2019, 18, 2803–2812. [DOI] [PubMed] [Google Scholar]
- (20).Schmitt F; Hussain G; Dupuis L; Loeffler J; Henriques A Front. Cell. Neurosci 2014, 8, 25. [DOI] [PMC free article] [PubMed] [Google Scholar]
- (21).Yadav R; Tiwari N Mol. Neurobiol 2014, 50, 168. [DOI] [PubMed] [Google Scholar]
- (22).Hong JH; Kang JW; Kim DK; Baik SH; Kim KH; Shanta SR; Jung JH; Mook-Jung I; Kim KP J. Lipid Res 2016, 57, 36–45. [DOI] [PMC free article] [PubMed] [Google Scholar]
- (23).Holmes JC; Morrell FA Appl. Spectrosc 1957, 11, 86–87. [Google Scholar]
- (24).Gohlke RS Anal. Chem 1959, 31, 535–541. [Google Scholar]
- (25).Baldwin MA; McLafferty FW Org. Mass Spectrom 1973, 7, 1111–1112. [Google Scholar]
- (26).Bruins AP; Covey TR; Henion JD Anal. Chem 1987, 59, 2642–2646. [Google Scholar]
- (27).McDonnell LA; Heeren RMA Mass Spectrom. Rev 2007, 26, 606. [DOI] [PubMed] [Google Scholar]
- (28).Norris JL; Caprioli RM Chem. Rev 2013, 113, 2309–2342. [DOI] [PMC free article] [PubMed] [Google Scholar]
- (29).Wu CP; Dill AL; Eberlin LS; Cooks RG; Ifa DR Mass Spectrom. Rev 2013, 32, 218–243. [DOI] [PMC free article] [PubMed] [Google Scholar]
- (30).Caprioli RM; Farmer TB; Gile J Anal. Chem 1997, 69, 4751–4760. [DOI] [PubMed] [Google Scholar]
- (31).Kertesz V; Van Berkel GJ Anal. Chem 2010, 82, 5917–5921. [DOI] [PubMed] [Google Scholar]
- (32).Van Berkel GJ; Kertesz V Rapid Commun. Mass Spectrom 2013, 27, 1329–1334. [DOI] [PubMed] [Google Scholar]
- (33).Spengler B; Hubert M J. Am. Soc. Mass Spectrom 2002, 13, 735–748. [DOI] [PubMed] [Google Scholar]
- (34).Schwartz SA; Reyzer ML; Caprioli RM J. Mass Spectrom 2003, 38, 699–708. [DOI] [PubMed] [Google Scholar]
- (35).Venter A; Sojka PE; Cooks RG Anal. Chem 2006, 78, 8549–8555. [DOI] [PubMed] [Google Scholar]
- (36).Lanekoff I; Burnum-Johnson K; Thomas M; Short J; Carson JP; Cha J; Dey SK; Yang P; Prieto Conaway MC; Laskin J Anal. Chem 2013, 85, 9596–9603. [DOI] [PMC free article] [PubMed] [Google Scholar]
- (37).Solon EG; Schweitzer A; Stoeckli M; Prideaux B AAPS J. 2010, 12, 11–26. [DOI] [PMC free article] [PubMed] [Google Scholar]
- (38).Anderton CR; Gamble LJ Microsc. Today 2016, 24, 24–31. [DOI] [PMC free article] [PubMed] [Google Scholar]
- (39).Blanksby SJ; Mitchell TW Annu. Rev. Anal. Chem 2010, 3, 433–465. [DOI] [PubMed] [Google Scholar]
- (40).Ekroos K Lipidomics: Technologies and Applications; Wiley: New York, 2012; pp 99–128. [Google Scholar]
- (41).Deng J; Yang Y; Luo L; Xiao Y; Luan T TrAC, Trends Anal. Chem 2020, 128, 115924. [Google Scholar]
- (42).Züllig T; Trötzmüller M; Köfeler HC Anal. Bioanal. Chem 2020, 412, 2191–2209. [DOI] [PMC free article] [PubMed] [Google Scholar]
- (43).Fenn LS; McLean JA Anal. Bioanal. Chem 2008, 391, 905–9. [DOI] [PubMed] [Google Scholar]
- (44).Ross DH; Seguin RP; Xu L Anal. Chem 2019, 91, 14498–14507. [DOI] [PMC free article] [PubMed] [Google Scholar]
- (45).Clemmer DE; Jarrold MF J. Mass Spectrom 1997, 32, 577–592. [Google Scholar]
- (46).Belov ME; Clowers BH; Prior DC; Danielson WF III; Liyu AV; Petritis BO; Smith RD Anal. Chem 2008, 80, 5873–5883. [DOI] [PMC free article] [PubMed] [Google Scholar]
- (47).Kanu AB; Dwivedi P; Tam M; Matz L; Hill HH Jr J. Mass Spectrom 2008, 43, 1–22. [DOI] [PubMed] [Google Scholar]
- (48).Krechmer J; Neeson KJ; Isaac G; Tice J; Gorenstein MV; Millar A; Balogh MP; Langridge J; Astarita G Real Time Lipidomic Profiling Using Desorption Ionization with Ion Mobility MS 2013. https://www.waters.com/webassets/cms/library/docs/720004611en.pdf.
- (49).Lapthorn C; Pullen F; Chowdhry BZ Mass Spectrom. Rev 2013, 32, 43–71. [DOI] [PubMed] [Google Scholar]
- (50).Groessl M; Graf S; Knochenmuss R Analyst 2015, 140, 6904–6911. [DOI] [PubMed] [Google Scholar]
- (51).Wu Q; Wang J-Y; Han D-Q; Yao Z-P TrAC, Trends Anal. Chem 2020, 124, 115801. [Google Scholar]
- (52).Bowman AP; Blakney GT; Hendrickson CL; Ellis SR; Heeren RMA; Smith DF Anal. Chem 2020, 92, 3133–3142. [DOI] [PMC free article] [PubMed] [Google Scholar]
- (53).Cornett DS; Frappier SL; Caprioli RM Anal. Chem 2008, 80, 5648–5653. [DOI] [PMC free article] [PubMed] [Google Scholar]
- (54).Zubarev RA; Nielsen ML; Budnik BA Eur. J. Mass Spectrom 2000, 6, 235–240. [Google Scholar]
- (55).Mcluckey SA J. Am. Soc. Mass Spectrom 1992, 3, 599–614. [DOI] [PubMed] [Google Scholar]
- (56).Biemann K Annu. Rev. Biochem 1992, 61, 977–1010. [DOI] [PubMed] [Google Scholar]
- (57).Wells JM; McLuckey SA Methods Enzymol. 2005, 402, 148–185. [DOI] [PubMed] [Google Scholar]
- (58).Murphy RC; Axelsen PH Mass Spectrom. Rev 2011, 30, 579–599. [DOI] [PMC free article] [PubMed] [Google Scholar]
- (59).McLuckey SA; Mentinova M J. Am. Soc. Mass Spectrom 2011, 22, 3–12. [DOI] [PMC free article] [PubMed] [Google Scholar]
- (60).Hsu F-F; Turk JJ Am. Soc. Mass Spectrom 2001, 12, 1036–1043. [DOI] [PubMed] [Google Scholar]
- (61).Pulfer M; Murphy RC Mass Spectrom. Rev 2003, 22, 332–364. [DOI] [PubMed] [Google Scholar]
- (62).Murphy RC; Hankin JA; Barkley RM J. Lipid Res 2009, 50, S317–S322. [DOI] [PMC free article] [PubMed] [Google Scholar]
- (63).Hsu FF; Turk JJ Am. Soc. Mass Spectrom 2003, 14, 352–363. [DOI] [PubMed] [Google Scholar]
- (64).Randolph CE; Blanksby SJ; McLuckey SA Chem. Phys. Lipids 2020, 232, 104970. [DOI] [PMC free article] [PubMed] [Google Scholar]
- (65).Hsu FF; Turk JJ Am. Soc. Mass Spectrom 1999, 10, 587–99. [DOI] [PubMed] [Google Scholar]
- (66).Han X; Yang K; Cheng H; Fikes KN; Gross RW J. Lipid Res 2005, 46, 1548–1560. [DOI] [PMC free article] [PubMed] [Google Scholar]
- (67).Han X; Yang K; Gross RW Mass Spectrom. Rev 2012, 31, 134–178. [DOI] [PMC free article] [PubMed] [Google Scholar]
- (68).Ryan E; Reid GE Acc. Chem. Res 2016, 49, 1596–1604. [DOI] [PubMed] [Google Scholar]
- (69).Wang M; Wang C; Han RH; Han X Prog. Lipid Res 2016, 61, 83–108. [DOI] [PMC free article] [PubMed] [Google Scholar]
- (70).Zhao X-E; Zhu S; Liu H J. Sep. Sci 2020, 43, 1838–1846. [DOI] [PubMed] [Google Scholar]
- (71).Hsu F; Bohrer A; Turk J Biochim. Biophys. Acta, Lipids Lipid Metab 1998, 1392, 202–216. [DOI] [PubMed] [Google Scholar]
- (72).Hsu F-F; Turk J J. Am. Soc. Mass Spectrom 2004, 15, 536–546. [DOI] [PubMed] [Google Scholar]
- (73).Oh H; Breuker K; Sze SK; Ge Y; Carpenter BK; McLafferty FW Proc. Natl. Acad. Sci. U. S. A 2002, 99, 15863–15868. [DOI] [PMC free article] [PubMed] [Google Scholar]
- (74).Zubarev R Mass Spectrom. Rev 2003, 22, 57–77. [DOI] [PubMed] [Google Scholar]
- (75).Syrstad EA; Tureccek F J. Am. Soc. Mass Spectrom 2005, 16, 208–224. [DOI] [PubMed] [Google Scholar]
- (76).Bakhtiar R; Guan Z Biotechnol. Lett 2006, 28, 1047–1059. [DOI] [PubMed] [Google Scholar]
- (77).Goeringer DE; Asano KG; McLuckey SA Int. J. Mass Spectrom 1999, 182–183, 275–288. [Google Scholar]
- (78).Svennerholm L; Fredman P Biochim. Biophys. Acta, Lipids Lipid Metab 1980, 617, 97–109. [DOI] [PubMed] [Google Scholar]
- (79).Griffiths WJ; Liu S; Alvelius G; Sjövall J Rapid Commun. Mass Spectrom 2003, 17, 924–935. [DOI] [PubMed] [Google Scholar]
- (80).Zemski Berry KA; Murphy RC Anal. Biochem 2006, 349, 118–128. [DOI] [PubMed] [Google Scholar]
- (81).Zemski Berry KA; Turner WW; VanNieuwenhze MS; Murphy RC Anal. Chem 2009, 81, 6633–6640. [DOI] [PMC free article] [PubMed] [Google Scholar]
- (82).Nabetani T; Makino A; Hullin-Matsuda F; Hirakawa T-A; Takeoka S; Okino N; Ito M; Kobayashi T; Hirabayashi Y J. Lipid Res 2011, 52, 1294–1302. [DOI] [PMC free article] [PubMed] [Google Scholar]
- (83).Wang M; Han RH; Han X Anal. Chem 2013, 85, 9312–9320. [DOI] [PMC free article] [PubMed] [Google Scholar]
- (84).Wasslen KV; Canez CR; Lee H; Manthorpe JM; Smith JC Anal. Chem 2014, 86, 9523–9532. [DOI] [PubMed] [Google Scholar]
- (85).Hu C; Duan Q; Han X Proteomics 2020, 20, 1900070. [DOI] [PMC free article] [PubMed] [Google Scholar]
- (86).Feng Y; Chen B; Yu Q; Li L Anal. Chem 2019, 91, 1791–1795. [DOI] [PMC free article] [PubMed] [Google Scholar]
- (87).Ting H-C; Chen L-T; Chen J-Y; Huang Y-L; Xin R-C; Chan J-F; Hsu Y-HH Lipids Health Dis. 2019, 18, 53. [DOI] [PMC free article] [PubMed] [Google Scholar]
- (88).Kwon Y; Lee S; Oh DC; Kim S Angew. Chem., Int. Ed 2011, 50, 8275–8. [DOI] [PubMed] [Google Scholar]
- (89).Ma X; Xia Y Angew. Chem., Int. Ed 2014, 53, 2592–2596. [DOI] [PubMed] [Google Scholar]
- (90).Murphy RC; Okuno T; Johnson CA; Barkley RM Anal. Chem 2017, 89, 8545–8553. [DOI] [PubMed] [Google Scholar]
- (91).Zhu Y; Wang W; Yang Z Anal. Chem 2020, 92, 11380–11387. [DOI] [PMC free article] [PubMed] [Google Scholar]
- (92).Xu T; Pi Z; Song F; Liu S; Liu Z Anal. Chim. Acta 2018, 1028, 32–44. [DOI] [PubMed] [Google Scholar]
- (93).Ma X; Chong L; Tian R; Shi R; Hu TY; Ouyang Z; Xia Y Proc. Natl. Acad. Sci. U. S. A 2016, 113, 2573–8. [DOI] [PMC free article] [PubMed] [Google Scholar]
- (94).Bednarik A; Bolsker S; Soltwisch J; Dreisewerd K Angew. Chem., Int. Ed 2018, 57, 12092–12096. [DOI] [PubMed] [Google Scholar]
- (95).Prentice BM; McLuckey SA Chem. Commun 2013, 49, 947–965. [DOI] [PMC free article] [PubMed] [Google Scholar]
- (96).Foreman DJ; McLuckey SA Anal. Chem 2020, 92, 252–266. [DOI] [PMC free article] [PubMed] [Google Scholar]
- (97).McLuckey SA; Huang TY Anal. Chem 2009, 81, 8669–8676. [DOI] [PMC free article] [PubMed] [Google Scholar]
- (98).McLuckey SA; Stephenson JL Jr.; Asano KG Anal. Chem 1998, 70, 1198–1202. [DOI] [PubMed] [Google Scholar]
- (99).McLuckey SA; Stephenson JL Jr. Mass Spectrom. Rev 1998, 17, 369–407. [DOI] [PubMed] [Google Scholar]
- (100).Wells JM; Chrisman PA; McLuckey SA J. Am. Chem. Soc 2003, 125, 7238–7249. [DOI] [PubMed] [Google Scholar]
- (101).McGee WM; Mentinova M; McLuckey SA J. Am. Chem. Soc 2012, 134, 11412–11414. [DOI] [PMC free article] [PubMed] [Google Scholar]
- (102).Prentice BM; McGee WM; Stutzman JR; McLuckey SA Int. J. Mass Spectrom 2013, 354, 211–218. [DOI] [PMC free article] [PubMed] [Google Scholar]
- (103).Gronert S Chem. Rev 2001, 101, 329–360. [DOI] [PubMed] [Google Scholar]
- (104).Eberlin MN J. Mass Spectrom 2006, 41, 141–56. [DOI] [PubMed] [Google Scholar]
- (105).Fu M; Duan P; Li S; Eismin RJ; Kenttämaa HI J. Am. Soc. Mass Spectrom 2009, 20, 1251–62. [DOI] [PubMed] [Google Scholar]
- (106).Eismin RJ; Fu M; Yem S; Widjaja F; Kenttämaa HI J. Am. Soc. Mass Spectrom 2012, 23, 12–22. [DOI] [PubMed] [Google Scholar]
- (107).Williams PE; Jankiewicz BJ; Yang L; Kenttämaa HI Chem. Rev 2013, 113, 6949–85. [DOI] [PMC free article] [PubMed] [Google Scholar]
- (108).Thomas MC; Mitchell TW; Harman DG; Deeley JM; Nealon JR; Blanksby SJ Anal. Chem 2008, 80, 303–311. [DOI] [PubMed] [Google Scholar]
- (109).Ellis SR; Hughes JR; Mitchell TW; Panhuis MIH; Blanksby SJ Analyst 2012, 137, 1100–1110. [DOI] [PubMed] [Google Scholar]
- (110).Brown SH; Mitchell TW; Blanksby SJ Biochim. Biophys. Acta, Mol. Cell Biol. Lipids 2011, 1811, 807–17. [DOI] [PubMed] [Google Scholar]
- (111).Pham HT; Maccarone AT; Campbell JL; Mitchell TW; Blanksby SJ J. Am. Soc. Mass Spectrom 2013, 24, 286–296. [DOI] [PubMed] [Google Scholar]
- (112).Poad BL; Pham HT; Thomas MC; Nealon JR; Campbell JL; Mitchell TW; Blanksby SJ J. Am. Soc. Mass Spectrom 2010, 21, 1989–99. [DOI] [PubMed] [Google Scholar]
- (113).Poad BLJ; Green MR; Kirk JM; Tomczyk N; Mitchell TW; Blanksby SJ Anal. Chem 2017, 89, 4223–4229. [DOI] [PubMed] [Google Scholar]
- (114).Paine MRL; Poad BLJ; Eijkel GB; Marshall DL; Blanksby SJ; Heeren RMA; Ellis SR Angew. Chem., Int. Ed 2018, 57, 10530–10534. [DOI] [PMC free article] [PubMed] [Google Scholar]
- (115).Badman ER; Chrisman PA; McLuckey SA Anal. Chem 2002, 74, 6237–6243. [DOI] [PubMed] [Google Scholar]
- (116).Wells JM; Chrisman PA; McLuckey SA J. Am. Soc. Mass Spectrom 2002, 13, 614–622. [DOI] [PubMed] [Google Scholar]
- (117).Xia Y; Wu J; McLuckey SA; Londry FA; Hager JW J. Am. Soc. Mass Spectrom 2005, 16, 71–81. [DOI] [PubMed] [Google Scholar]
- (118).Xia Y; Chrisman PA; Erickson DE; Liu J; Liang X; Londry FA; Yang MJ; McLuckey SA Anal. Chem 2006, 78, 4146–4154. [DOI] [PMC free article] [PubMed] [Google Scholar]
- (119).Xia Y; McLuckey SA J. Am. Soc. Mass Spectrom 2008, 19, 173–189. [DOI] [PMC free article] [PubMed] [Google Scholar]
- (120).Newton KA; McLuckey SA J. Am. Chem. Soc 2003, 125, 12404–12405. [DOI] [PubMed] [Google Scholar]
- (121).Newton KA; He M; Amunugama R; McLuckey SA Phys. Chem. Chem. Phys 2004, 6, 2710–2717. [Google Scholar]
- (122).Newton KA; McLuckey SA J. Am. Soc. Mass Spectrom 2004, 15, 607–615. [DOI] [PubMed] [Google Scholar]
- (123).Newton KA; Amunugama R; McLuckey SA J. Phys. Chem. A 2005, 109, 3608–3616. [DOI] [PMC free article] [PubMed] [Google Scholar]
- (124).Stutzman JR; Blanksby SJ; McLuckey SA Anal. Chem 2013, 85, 3752–3757. [DOI] [PMC free article] [PubMed] [Google Scholar]
- (125).Rojas-Betancourt S; Stutzman JR; Londry FA; Blanksby SJ; McLuckey SA Anal. Chem 2015, 87, 11255–11262. [DOI] [PMC free article] [PubMed] [Google Scholar]
- (126).Randolph CE; Foreman DJ; Blanksby SJ; McLuckey SA Anal. Chem 2019, 91, 9032. [DOI] [PMC free article] [PubMed] [Google Scholar]
- (127).Stephenson JL Jr.; McLuckey SA J. Am. Chem. Soc 1996, 118, 7390–7397. [Google Scholar]
- (128).Pitteri SJ; McLuckey SA Mass Spectrom. Rev 2005, 24, 931–958. [DOI] [PubMed] [Google Scholar]
- (129).McLuckey SA Eur. J. Mass Spectrom 2010, 16, 429–436. [DOI] [PubMed] [Google Scholar]
- (130).Randolph CE; Fabijanczuk KC; Blanksby SJ; McLuckey SA Anal. Chem 2020, 92, 10847–10855. [DOI] [PMC free article] [PubMed] [Google Scholar]
- (131).Randolph CE; Foreman DJ; Betancourt SK; Blanksby SJ; McLuckey SA Anal. Chem 2018, 90, 12861–12869. [DOI] [PMC free article] [PubMed] [Google Scholar]
- (132).Randolph CE; Foreman DJ; Blanksby SJ; McLuckey SA Anal. Chem 2019, 91, 9032–9040. [DOI] [PMC free article] [PubMed] [Google Scholar]
- (133).Randolph CE; Marshall DL; Blanksby SJ; McLuckey SA Anal. Chim. Acta 2020, 1129, 31–39. [DOI] [PMC free article] [PubMed] [Google Scholar]
- (134).Randolph CE; Shenault DSM; Blanksby SJ; McLuckey SA J. Am. Soc. Mass Spectrom 2020, 31, 1093–1103. [DOI] [PMC free article] [PubMed] [Google Scholar]
- (135).He M; Emory JF; McLuckey SA Anal. Chem 2005, 77, 3173–3182. [DOI] [PMC free article] [PubMed] [Google Scholar]
- (136).Emory JF; McLuckey SA Int. J. Mass Spectrom 2008, 276, 102–109. [Google Scholar]
- (137).Hassell K; LeBlanc Y; McLuckey S Analyst 2009, 134, 2262–2266. [DOI] [PubMed] [Google Scholar]
- (138).Randolph CE; Blanksby SJ; McLuckey SA Anal. Chem 2020, 92, 1219–1227. [DOI] [PMC free article] [PubMed] [Google Scholar]
- (139).Luginbühl M; Young RSE; Stoeth F; Weinmann W; Blanksby SJ; Gaugler S J. Anal. Toxicol 2021, 45, 76. [DOI] [PubMed] [Google Scholar]
- (140).Specker JT; Van Orden SL; Ridgeway ME; Prentice BM Anal. Chem 2020, 92, 13192–13201. [DOI] [PubMed] [Google Scholar]
- (141).Zemski Berry KA; Hankin JA; Barkley RA; Spraggins JM; Caprioli RM; Murphy RC Chem. Rev 2011, 111, 6491–6512. [DOI] [PMC free article] [PubMed] [Google Scholar]
- (142).Han H; McLuckey SA J. Am. Chem. Soc 2009, 131, 12884–12885. [DOI] [PMC free article] [PubMed] [Google Scholar]
- (143).Hassell KM; Stutzman JR; McLuckey SA Anal. Chem 2010, 82, 1594–1597. [DOI] [PMC free article] [PubMed] [Google Scholar]
- (144).Mentinova M; McLuckey SA J. Am. Chem. Soc 2010, 132, 18248–18257. [DOI] [PMC free article] [PubMed] [Google Scholar]
- (145).Mentinova M; McLuckey SA J. Am. Soc. Mass Spectrom 2011, 22, 912–921. [DOI] [PMC free article] [PubMed] [Google Scholar]
- (146).Stutzman JR; Luongo CA; McLuckey SA J. Mass Spectrom 2012, 47, 669–675. [DOI] [PMC free article] [PubMed] [Google Scholar]
- (147).Prentice BM; Gilbert JD; Stutzman JR; Forrest WP; McLuckey SA J. Am. Soc. Mass Spectrom 2013, 24, 30–37. [DOI] [PMC free article] [PubMed] [Google Scholar]
- (148).Prentice BM; Stutzman JR; McLuckey SA J. Am. Soc. Mass Spectrom 2013, 24, 1045–1052. [DOI] [PMC free article] [PubMed] [Google Scholar]
- (149).Gilbert JD; Fisher CM; Bu JX; Prentice BM; Redwine JG; McLuckey SA J. Mass Spectrom 2015, 50, 418–426. [DOI] [PMC free article] [PubMed] [Google Scholar]
- (150).Webb IK; Morrison LJ; Brown J Int. J. Mass Spectrom 2019, 444, 116177. [Google Scholar]
- (151).Bu JX; Fisher CM; Gilbert JD; Prentice BM; McLuckey SA J. Am. Soc. Mass Spectrom 2016, 27, 1089–1098. [DOI] [PubMed] [Google Scholar]
- (152).Gunawardena HP; He M; Chrisman PA; Pitteri SJ; Hogan JM; Hodges BDM; McLuckey SA J. Am. Chem. Soc 2005, 127, 12627–12639. [DOI] [PMC free article] [PubMed] [Google Scholar]
- (153).McLuckey SA; Reid GE; Wells JM Anal. Chem 2002, 74, 336–346. [DOI] [PubMed] [Google Scholar]
- (154).Jarrell T; Riedeman J; Carlsen M; Replogle R; Selby T; Kenttämaa H Anal. Chem 2014, 86, 6533–6539. [DOI] [PubMed] [Google Scholar]
- (155).Kong JY; Hilger RT; Jin C; Yerabolu R; Zimmerman JR; Replogle RW; Jarrell TM; Easterling L; Kumar R; Kenttämaa HI Anal. Chem 2019, 91, 15652–15660. [DOI] [PubMed] [Google Scholar]
- (156).Tomer KB; Crow FW; Gross ML J. Am. Chem. Soc 1983, 105, 5487–5488. [Google Scholar]
- (157).Jensen NJ; Tomer KB; Gross ML Anal. Chem 1985, 57, 2018–2021. [Google Scholar]
- (158).Jensen NJ; Tomer KB; Gross ML; Lyon PA Fast atom bombardment combined with tandem mass spectrometry for the study of collisionally induced remote charge site decompositions. In Desorption Mass Spectrometry; American Chemical Society, 1985; Vol. 291, pp 194–208. [Google Scholar]
- (159).Jensen NJ; Tomer KB; Gross ML Lipids 1986, 21, 580–8. [DOI] [PubMed] [Google Scholar]
- (160).Tomer KB; Jensen NJ; Gross ML Anal. Chem 1986, 58, 2429–2433. [Google Scholar]
- (161).Adams J; Gross ML Anal. Chem 1987, 59, 1576–1582. [Google Scholar]
- (162).Crockett JS; Gross ML; Christie WW; Holman RT J. Am. Soc. Mass Spectrom 1990, 1, 183–191. [DOI] [PubMed] [Google Scholar]
- (163).Davoli E; Gross ML J. Am. Soc. Mass Spectrom 1990, 1, 320–324. [DOI] [PubMed] [Google Scholar]
- (164).Cheng C; Gross ML Mass Spectrom. Rev 2000, 19, 398–420. [DOI] [PubMed] [Google Scholar]
- (165).Hsu FF; Turk J J. Am. Soc. Mass Spectrom 2007, 18, 2065–73. [DOI] [PMC free article] [PubMed] [Google Scholar]
- (166).Hsu FF; Lodhi IJ; Turk J; Semenkovich CF J. Am. Soc. Mass Spectrom 2014, 25, 1412–20. [DOI] [PMC free article] [PubMed] [Google Scholar]
- (167).Reilly JP Mass Spectrom. Rev 2009, 28, 425–447. [DOI] [PMC free article] [PubMed] [Google Scholar]
- (168).Brodbelt JS J. Am. Soc. Mass Spectrom 2011, 22, 197–206. [DOI] [PubMed] [Google Scholar]
- (169).Brodbelt JS Chem. Soc. Rev 2014, 43, 2757–2783. [DOI] [PMC free article] [PubMed] [Google Scholar]
- (170).McLuckey SA; Goeringer DE J. Mass Spectrom 1997, 32, 461–474. [Google Scholar]
- (171).Wilson JJ; Brodbelt JS Anal. Chem 2007, 79, 7883–7892. [DOI] [PubMed] [Google Scholar]
- (172).Pham HT; Ly T; Trevitt AJ; Mitchell TW; Blanksby SJ Anal. Chem 2012, 84, 7525–32. [DOI] [PubMed] [Google Scholar]
- (173).Fang M; Rustam Y; Palmieri M; Sieber OM; Reid GE Anal. Bioanal. Chem 2020, 412, 2339–2351. [DOI] [PubMed] [Google Scholar]
- (174).Ryan E; Nguyen CQN; Shiea C; Reid GE J. Am. Soc. Mass Spectrom 2017, 28, 1406–1419. [DOI] [PubMed] [Google Scholar]
- (175).Williams PE; Klein DR; Greer SM; Brodbelt JS J. Am. Chem. Soc 2017, 139, 15681–15690. [DOI] [PMC free article] [PubMed] [Google Scholar]
- (176).Vasicek L; Brodbelt JS Anal. Chem 2010, 82, 9441–9446. [DOI] [PubMed] [Google Scholar]
- (177).Klein DR; Brodbelt JS Anal. Chem 2017, 89, 1516–1522. [DOI] [PMC free article] [PubMed] [Google Scholar]
- (178).Klein DR; Blevins MS; Macias LA; Douglass MV; Trent MS; Brodbelt JS Anal. Chem 2020, 92, 5986–5993. [DOI] [PMC free article] [PubMed] [Google Scholar]
- (179).Klein DR; Feider CL; Garza KY; Lin JQ; Eberlin LS; Brodbelt JS Anal. Chem 2018, 90, 10100–10104. [DOI] [PMC free article] [PubMed] [Google Scholar]
- (180).Blevins MS; Klein DR; Brodbelt JS Anal. Chem 2019, 91, 6820–6828. [DOI] [PMC free article] [PubMed] [Google Scholar]
- (181).Brodbelt JS; Morrison LJ; Santos I Chem. Rev 2020, 120, 3328–3380. [DOI] [PMC free article] [PubMed] [Google Scholar]
- (182).Zubarev RA; Kelleher NL; McLafferty FW J. Am. Chem. Soc 1998, 120, 3265–3266. [Google Scholar]
- (183).Cody RB; Freiser BS Anal. Chem 1979, 51, 547–551. [Google Scholar]
- (184).Campbell JL; Baba T Anal. Chem 2015, 87, 5837–5845. [DOI] [PubMed] [Google Scholar]
- (185).Baba T; Campbell JL; Le Blanc JCY; Baker PRS J. Lipid Res 2016, 57, 2015–2027. [DOI] [PMC free article] [PubMed] [Google Scholar]
- (186).Baba T; Campbell JL; Le Blanc JCY; Baker PRS J. Lipid Res 2016, 57, 858–867. [DOI] [PMC free article] [PubMed] [Google Scholar]
- (187).Baba T; Campbell JL; Le Blanc JCY; Baker PRS Anal. Chem 2017, 89, 7307–7315. [DOI] [PubMed] [Google Scholar]
- (188).Baba T; Campbell JL; Le Blanc JCY; Baker PRS; Ikeda K J. Lipid Res 2018, 59, 910–919. [DOI] [PMC free article] [PubMed] [Google Scholar]
- (189).Jones JW; Thompson CJ; Carter CL; Kane MA J. Mass Spectrom 2015, 50, 1327–1339. [DOI] [PMC free article] [PubMed] [Google Scholar]
- (190).Yoo HJ; Hakansson K Anal. Chem 2010, 82, 6940–6946. [DOI] [PubMed] [Google Scholar]
- (191).March RE J. Mass Spectrom 1997, 32, 351–369. [Google Scholar]
- (192).Voinov VG; Beckman JS; Deinzer ML; Barofsky DF Rapid Commun. Mass Spectrom 2009, 23, 3028–3030. [DOI] [PMC free article] [PubMed] [Google Scholar]
- (193).Baba T; Campbell JL; Le Blanc JC; Hager JW; Thomson BA Anal. Chem 2015, 87, 785–92. [DOI] [PubMed] [Google Scholar]
- (194).Ding L; Brancia FL Anal. Chem 2006, 78, 1995–2000. [DOI] [PubMed] [Google Scholar]
- (195).Born M-EN; Prentice BM Int. J. Mass Spectrom 2020, 452, 116338. [DOI] [PMC free article] [PubMed] [Google Scholar]
- (196).Marshall DL; Saville JT; Maccarone AT; Ailuri R; Kelso MJ; Mitchell TW; Blanksby SJ Rapid Commun. Mass Spectrom 2016, 30, 2351–2359. [DOI] [PubMed] [Google Scholar]
- (197).Buenger EW; Reid GE Eur. J. Mass Spectrom 2020, 26, 311–323. [DOI] [PubMed] [Google Scholar]
- (198).West H; Reid GE Anal. Chim. Acta 2021, 1141, 100–109. [DOI] [PubMed] [Google Scholar]
- (199).Wäldchen F; Spengler B; Heiles S J. Am. Chem. Soc 2019, 141, 11816–11820. [DOI] [PubMed] [Google Scholar]
- (200).Unsihuay D; Su P; Hu H; Qiu J; Kuang S; Li Y; Sun X; Dey SK; Laskin J Angew. Chem., Int. Ed 2021, 60, 7559–7563. [DOI] [PMC free article] [PubMed] [Google Scholar]
- (201).Zhang J; Huo X; Guo C; Ma X; Huang H; He J; Wang X; Tang F Anal. Chem 2021, 93, 2114–2124. [DOI] [PubMed] [Google Scholar]
- (202).Deimler RE; Sander M; Jackson GP Int. J. Mass Spectrom 2015, 390, 178–186. [DOI] [PMC free article] [PubMed] [Google Scholar]
- (203).Wysocki VH; Joyce KE; Jones CM; Beardsley RL J. Am. Soc. Mass Spectrom 2008, 19, 190–208. [DOI] [PMC free article] [PubMed] [Google Scholar]