

Abstract
Objective
To evaluate potential differences and to show the risk associated with small for gestational age (SGA) at birth and discharge among infants born to mothers of various Asian/Pacific islander (PI) races.
Study design
In this retrospective cohort study, infants with weight <1500 g or 23–28 weeks gestation, born in California during 2008–2012 were included. Logistic regression models were used.
Results
Asian and PI infants in ten groups had significant differences in growth parameters, socioeconomic factors, and some morbidities. Overall incidences of SGA at birth and discharge were 21% and 50%, respectively; Indian race had the highest numbers (29%, 63%). Infants of parents with the same race were at increased risk of SGA at birth and discharge compared with mixed race parents.
Conclusion
Specific Asian race should be considered when evaluating preterm growth. Careful consideration for the appropriateness of grouping Asian/PI races together in perinatal studies is warranted.
Introduction
Recently, Asian Americans and Pacific Islanders (PI) have become the fastest growing and most heterogeneous groups in the nation, tracing their heritage to more than 50 different countries [1]. According to 2015 United States (US) Census Bureau estimates, California’s population was 14.7% Asians and 0.5% of PI (https://www.census.gov/programs-surveys/acs/data/race-aian.html). California has the highest number of Asian Americans and the 2nd highest number of PI in the US.
In terms of Asian people, the 19 largest origin groups with unique histories, cultures, languages, and other characteristics account for 94% of the total Asian population in the US [2]. No single country of origin group dominates the Asian American population, but the largest groups are of Chinese (24%), Indian (20%), and Filipino (19%) origin as of 2015. PI Americans refer to people having origins in any of the original peoples of Hawaii, Guam, Tonga, Samoa, Fiji, the Marshalls, or other Pacific Islands. Many studies including Asian and PI neonates often combine heterogeneous subpopulations to the broader single category of Asian/PI without more extensive specificity, either due to sample size limitations or lack of focus on this group, likely masking marked heterogeneity [3]. PIs may have different healthcare status and risks compared with Asians. Native Hawaiians have notably high rates of preterm delivery [4]. Rates of macrosomia are higher among infants of PI women [3].
Prenatal and postnatal growth among very low birth weight (VLBW) are considered important predictors of neurodevelopmental outcome [5]. The growth of VLBW infants was lower than that of healthy full-term infants through 5 years of age, and there was an association between slower growth and decreased cognitive ability [6]. Furthermore, SGA preterm infants have been characterized as having increased risk of mortality and morbidities showing behavioral problems and cognitive deficiency relative to AGA infants [7].
Reports addressing birth outcome disparities among Asians are few [8–10]; in particular, no studies have investigated weight for gestational age and subsequent growth rates by race/ethnicity among VLBW infants. According to a previous study about Asian birth outcomes in California from 1992–1997, 2.5–135-fold differences in maternal risk factors and 2.2-fold differences in infant mortality among six US Asian population were noted [9]. Differences in maternal risks and birth outcomes between U.S.-born and foreign-born mothers differed greatly across the six Asian subgroups [11]. Adverse birth outcomes differ according to a couple’s ethnic composition [12]. In a population-based study for immigrant mothers in Ontario originating from East Asia, relative to mothers from China, the rate of small for gestational age (SGA) in preterm infants was significantly higher among infants of mothers from the Philippines (RR 2.91) and those from Vietnam (RR 1.68) [8].
Ethnic and racial differences in growth patterns can exist at certain ages. Understanding the granular differences in perinatal growth among Asians and PIs may contribute to targeted clinical management and quality improvement efforts in order to improve outcomes. We aimed to evaluate the potential differences in risk factors for growth outcomes amongst VLBW infants born to Asian and PI mothers in California.
Methods
Subject population
Data were extracted from the California Perinatal Quality Care Collaborative (CPQCC) [13], which included data collected across 132 units that account for the care of more than 95% of VLBW infants born in California. Data from California’s Office of Statewide Health Planning and Development were linked to CPQCC records to obtain detailed maternal information, including race/ethnicity and body mass index (BMI).
Among 74,172 infants assessed for eligibility between 2008 and 2012, 20,736 infants were born at a birth weight between 500–1500 g and gestational age between 23–34 weeks. Infants included were without severe congenital anomaly and discharged alive before 50 weeks corrected gestational age. Infants with missing birth weight, discharge weight, sex, or mother’s race/ethnicity were excluded. Infants in which the weight z-score at birth or at discharge with more than five standard deviations away from the expected mean for their age was considered a measuring error, and therefore were excluded. The final analytic cohort included 2382 VLBW infants born to mothers from ten Asian or PI subgroups. This study was approved by the Institutional Review Board at Stanford University.
Outcomes and variables
Trained data abstractors prospectively gathered maternal, delivery, and neonatal data based on definitions from the CPQCC manual of operations, which uses standard definitions developed by the Vermont Oxford Network. Weight was measured at birth and discharge. To control for variation in gestational age and postnatal age, body weight was converted into a Z-score using the provided calculator of Fenton growth chart that can be downloaded from the website https://www.ucalgary.ca/fenton/2013chart/ [14, 15]. SGA was defined as a weight Z-score at birth and at discharge below the 10th percentile (Z < −1.28). A weight Z-score at birth and at discharge below the 3rd percentile was shown as Z < −2. To ascertain the degree of postnatal growth, growth velocity was defined by subtracting the Z-score at birth from the Z-score at discharge.
Maternal and paternal race/ethnicity, and maternal birthplace were self-reported on the birth certificate, and were linked to the CPQCC database. Maternal factors obtained from the birth certificate included: maternal age categorized as <20, 20–34, 35–39 and 40+ years; maternal education categorized as college or more, high school, and high school or less; payment type categorized as public insurance, private insurance and other; BMI categorized as underweight (<18.5), normal (18.5–22.9), overweight (23.0–24.9), and obese (≥25) [16]; race/ethnicity categorized as Cambodian, Chinese, Filipino, Hmong, Indian, Japanese, Korean, Laotian, PI, Thai, and Vietnamese; maternal birthplace categorized as mothers born in the US (US born) and other countries (foreign-born); parity categorized as primiparity and multiparity; multiple birth vs. singleton; maternal and paternal race/ethnicity categorized as infants from same race parents and infants from mixed race parents.
Gestational age was determined by the best available estimate in weeks and days. Chronic lung disease was defined as oxygen use at 36 weeks postmenstrual age; periventricular leukomalacia as evidence of cystic periventricular leukomalacia on cranial imaging at any time; necrotizing enterocolitis as clinical and radiographic findings ≥stage 2; severe intraventricular hemorrhage as grade 3 or 4 by cranial imaging obtained prior to 28 days of life; severe retinopathy of prematurity as ≥stage 3 disease or treatment with retinal ablation surgery or anti-vascular endothelial growth factor drug.
There are nine Regional Perinatal Programs of California (RPPC) as well as two regions defined by Kaiser Permanente (splitting the state between north and south) in geographic distribution of California NICUs [17]. The RPPC, established by the California Department of Public Health, has divided the state into perinatal referral regions. We generated a map to visualize number of infants born in each region, shown in proportion to the bubble size of pie chart, and distribution of race according to regions.
Statistical analysis
T tests and Chi-square tests were used to compare maternal and neonatal characteristics between Asians and PIs. Logistic regression models, including maternal variables as noted above, were used to examine the risk of SGA at birth and discharge associated with race. We examined the magnitude of growth difference such as the incidence of SGA, mean Z-score at birth and at discharge, and growth velocity among Asian groups; we selected the Filipino population as the reference group because they were the largest Asian population in the cohort and they have previously been reported as having the highest risk of preterm SGA in a previous study [8]. All statistical analyses were performed using SAS version 9.4 (SAS Institute, Cary, NC). P values < 0.05 were considered to be statistically significant.
Result
Table 1 shows demographic characteristics of 2518 Asian and PI VLBW infants, of which 2382 had further details on Asian race/ethnicity. Figure 1 shows the geographic distribution of maternal race/ethnicity of VLBW infants registered in CPQCC by year among California’s 11 perinatal regions. Los Angeles region (600–800 infants/year) registered the highest number of infants, and East Bay area (400–600 infants/year) the next highest. Asians were the most prevalent in the Los Angeles (mean 69 infants/year) and Kaiser Permanente Northern California Region (mean 63 infants/year). The highest proportion of births occurred in the Kaiser Permanente Northern Region (23.6%) and the Mid-Coastal region (21.1%). PIs were 0.2–1% of the birth population across the 11 regions.
Table 1.
Demographic characteristics between Asians and PIs.
| Asian (n = 2393) | PI (n = 125) | |
|---|---|---|
| Male, n (%) | 1232 (51.5) | 67 (53.6) |
| Multiple pregnancy, n (%) | 718 (30) | 33 (26.4) |
| Gestational age, mean (SD) | 29.03 (2.7) | 28.29 (2.2) |
| Birth weight, mean (SD) | 1129.8 (259.9) | 1098.9 (244.8) |
| Z-score at birth, mean (SD) | −0.48 (1.00) | −0.16 (0.97) |
| Z-score at discharge, mean (SD) | −1.38 (1.03) | −1.08 (1.05) |
| Changes in Z-score, mean (SD) | −0.89 (0.72) | −0.92 (0.92) |
| SGA at birth, n (%) | 526 (22.0) | 12 (9.6) |
| SGA at discharge, n (%) | 1211 (50.6) | 50 (40.0) |
| Nulliparous, n (%) | 1067 (44.6) | 56 (44.8) |
| Maternal age | ||
| <20 | 59 (2.8) | 9 (7.4) |
| 20–34 | 1256 (59.8) | 86 (71.1) |
| 35–39 | 570 (27.1) | 15 (12.4) |
| ≥40 | 216 (10.3) | 11 (9.09) |
| Maternal education | ||
| College or more | 1871 (80.4) | 57 (47.9) |
| High school | 346 (14.2) | 48 (40.3) |
| Some high school or less | 109 (4.7) | 14 (11.3) |
| Insurance | ||
| Public | 531 (21.1) | 61 (48.8) |
| Private | 1791 (75.1) | 59 (47.2) |
| Other | 66 (2.8) | 5 (4) |
| Gestational hypertension, n (%) | 754 (31.6) | 36 (29.0) |
| Chorioamnionitis, n (%) | 125 (5.3) | 8 (6.6) |
| Gestational diabetes mellitus, n (%) | 440 (18.4) | 23 (18.6) |
| Body mass index (prepregnancy) | ||
| <18.5 | 332 (14.0) | 22 (17.7) |
| 18.5–22.9 | 881 (37.2) | 23 (18.6) |
| 23.0–24.9 | 378 (16.0) | 11 (8.9) |
| ≥25 | 776 (32.8) | 68 (54.8) |
| Respiratory distress syndrome, n (%) | 1491 (62.3) | 93 (74.4) |
| Late sepsis n (%) | 97 (4.2) | 7 (5.7) |
| Necrotizing enterocolitis, n (%) | 67 (2.8) | 3 (2.4) |
| Chronic lung disease, n (%) | 427 (18.9) | 27 (22.9) |
| Severe retinopathy of prematurity, n (%) | 130 (7.0) | 10 (9.0) |
| Severe intraventricular hemorrhage, n (%) | 56 (2.6) | 9 (7.4) |
| Patent ductus arteriosus, n (%) | 778 (37.6) | 55 (49.6) |
| Periventricular leukomalacia, n (%) | 35 (1.6) | 3 (2.4) |
| Formula only at discharge, n (%) | 487 (21.9) | 53 (47.3) |
Fig. 1. Geographic distribution of maternal race/ethnicity for the infants registered in CPQCC.
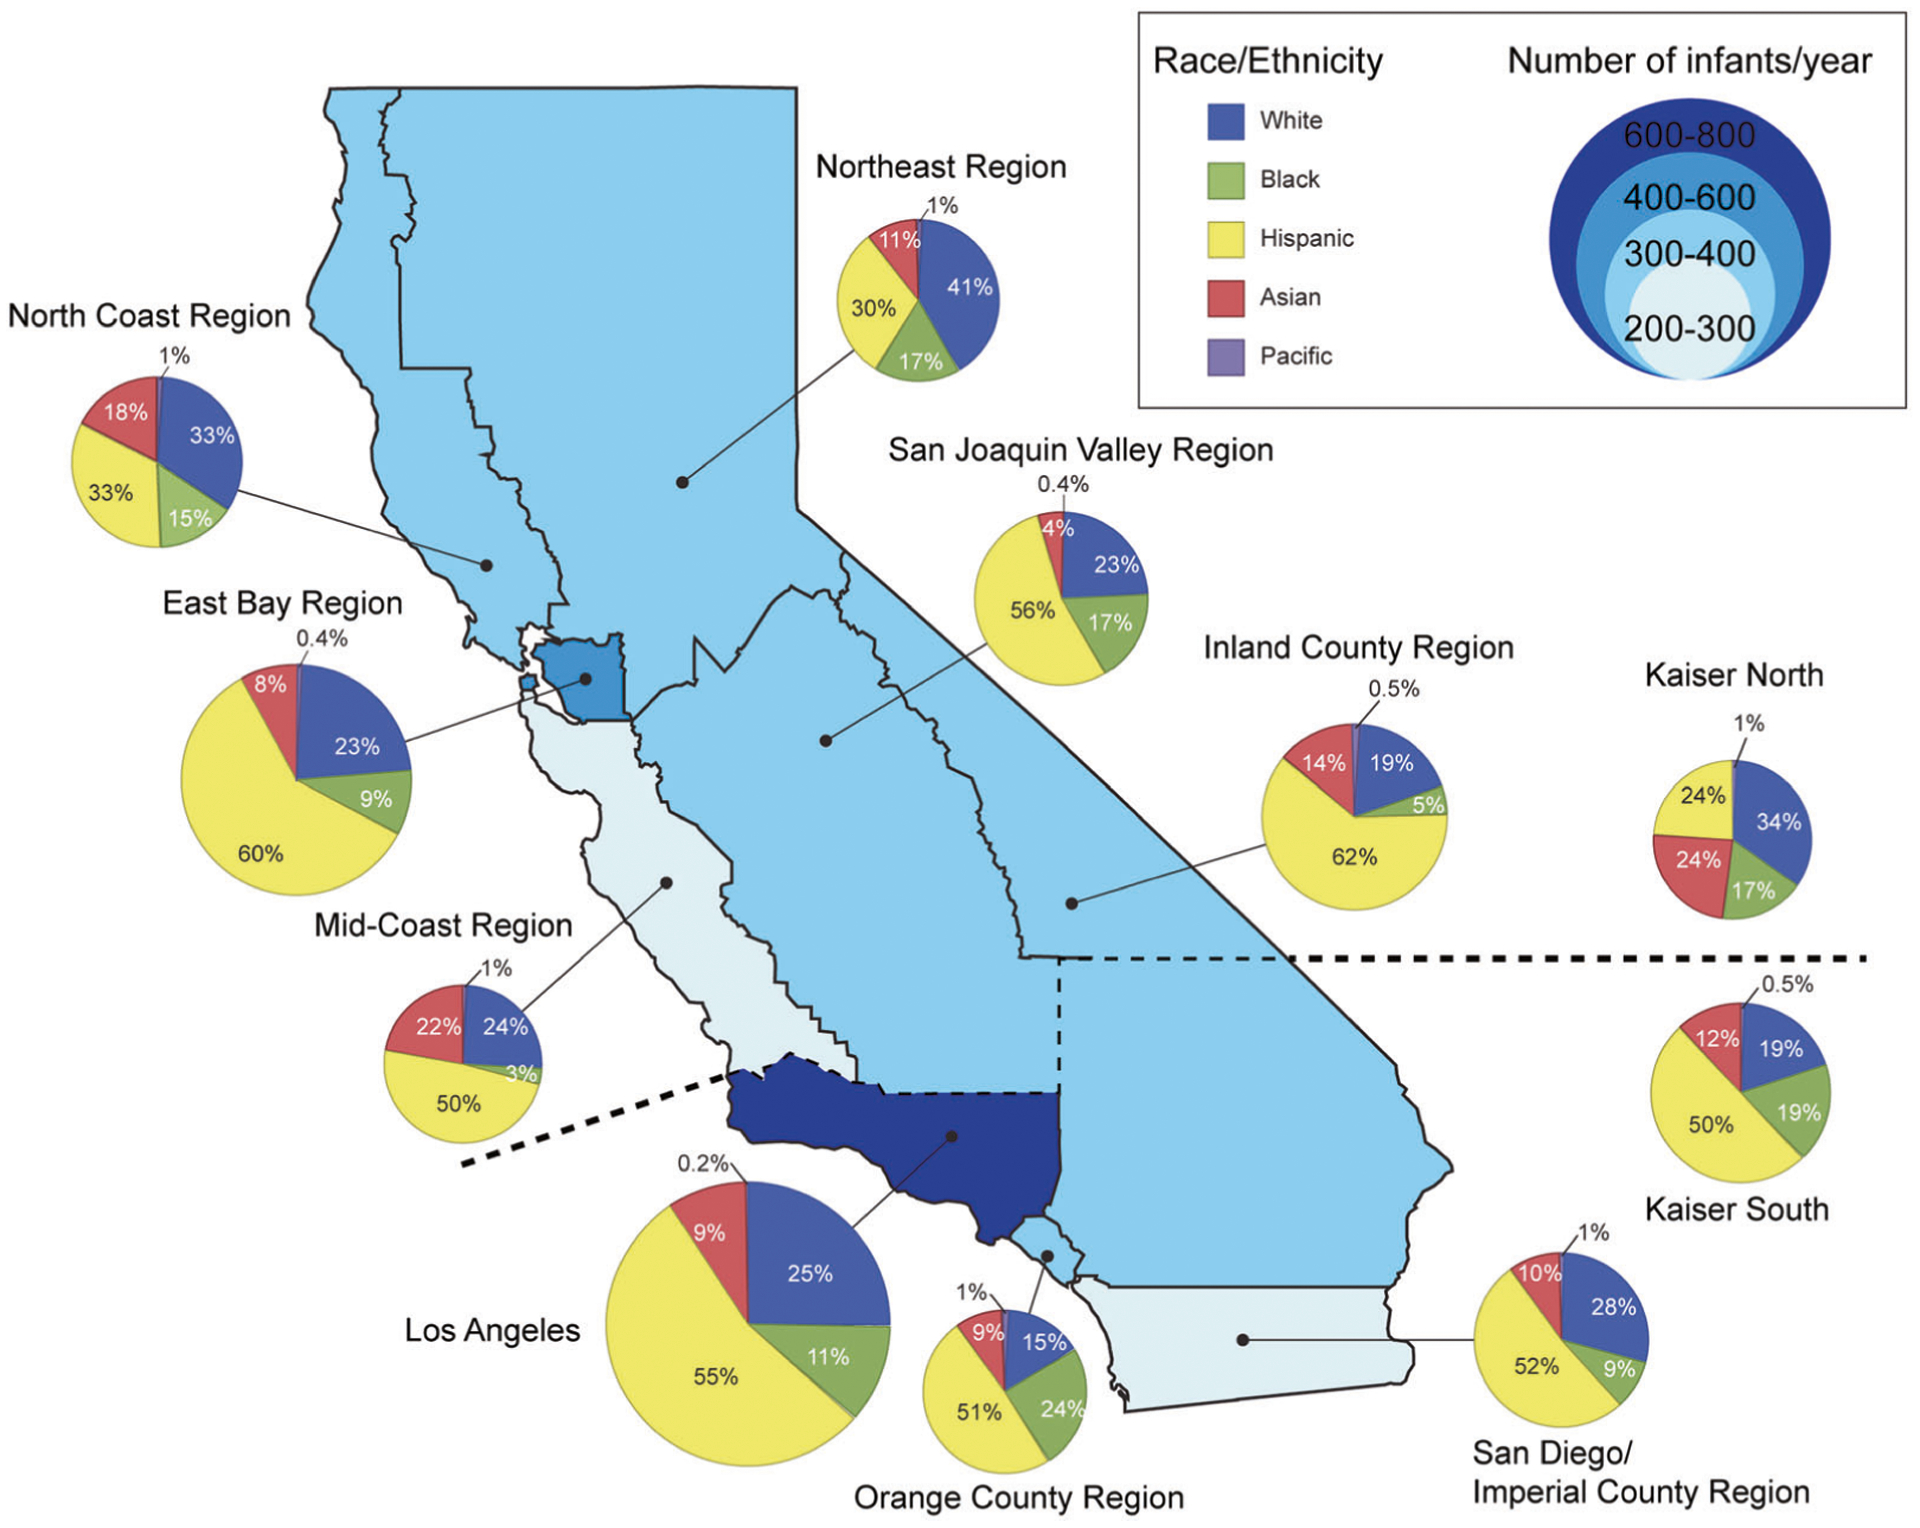
Number of infants born in each region is shown in proportion to the bubble size of pie chart.
Among 2382 VLBW infants born to mothers with detailed Asian or Pacific Islander (PI) ethnicities, the distribution of maternal race was as follows: Filipino, 31.7% (756); Chinese, 17.8% (424); Indian, 16.3% (389); Vietnamese, 9.0% (214); Korean, 5.3% (126); PI, 5.2% (124); Hmong, 4.5% (107); Cambodian, 3.5% (83); Japanese, 3.2% (76); Laotian, 2.2% (52); and Thai, 1.3% (31). The proportion of births to US-born mothers was the highest in Japanese and the lowest in Vietnamese. The proportion of infants having parents with the same race was the highest in Indians (90%) and the lowest in Thai (11%) (Fig. 2).
Fig. 2. Distribution of maternal race among Asians and PI infant.
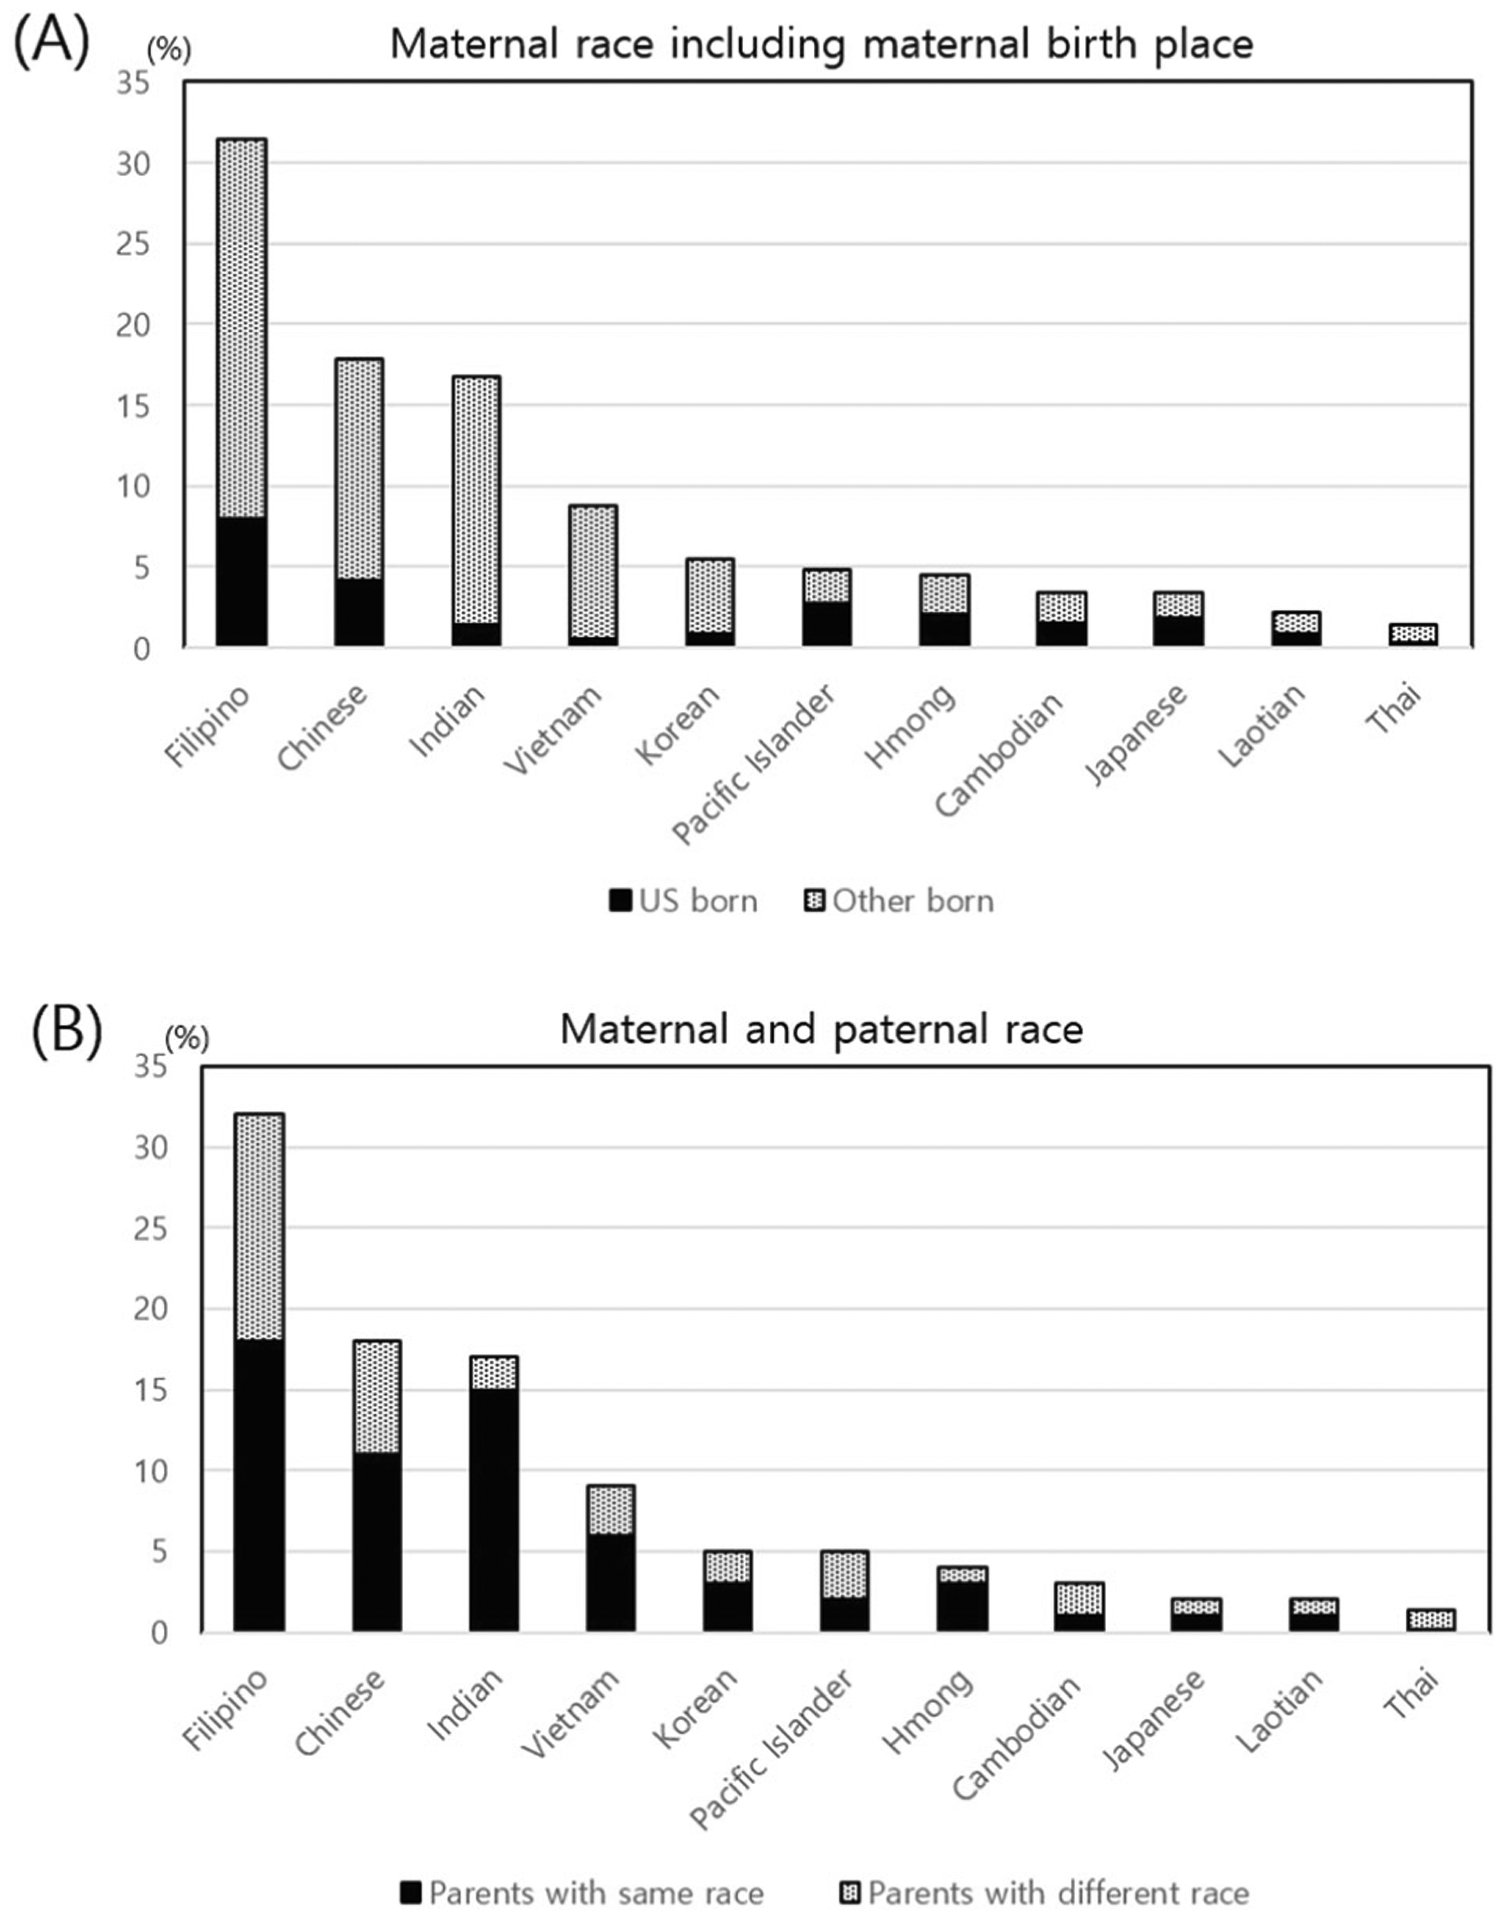
(a) maternal birth place: US-born vs. foreign-born; and (b) maternal and paternal race: same race or different race parents.
The analysis of the differences in growth among infants born to mothers among the ten Asian and PI races showed heterogeneous features (Fig. 3). The incidence of SGA at birth and at discharge differed significantly among various Asian and PI infants (P < 0.0001). Rates of SGA at birth and discharge were highest among Indians. The mean weight Z-score at birth and discharge varied significantly among Asian subgroups (P < 0.0001). However, growth velocity during the birth hospitalization did not differ significantly amongst groups.
Fig. 3. Incidence of SGA.
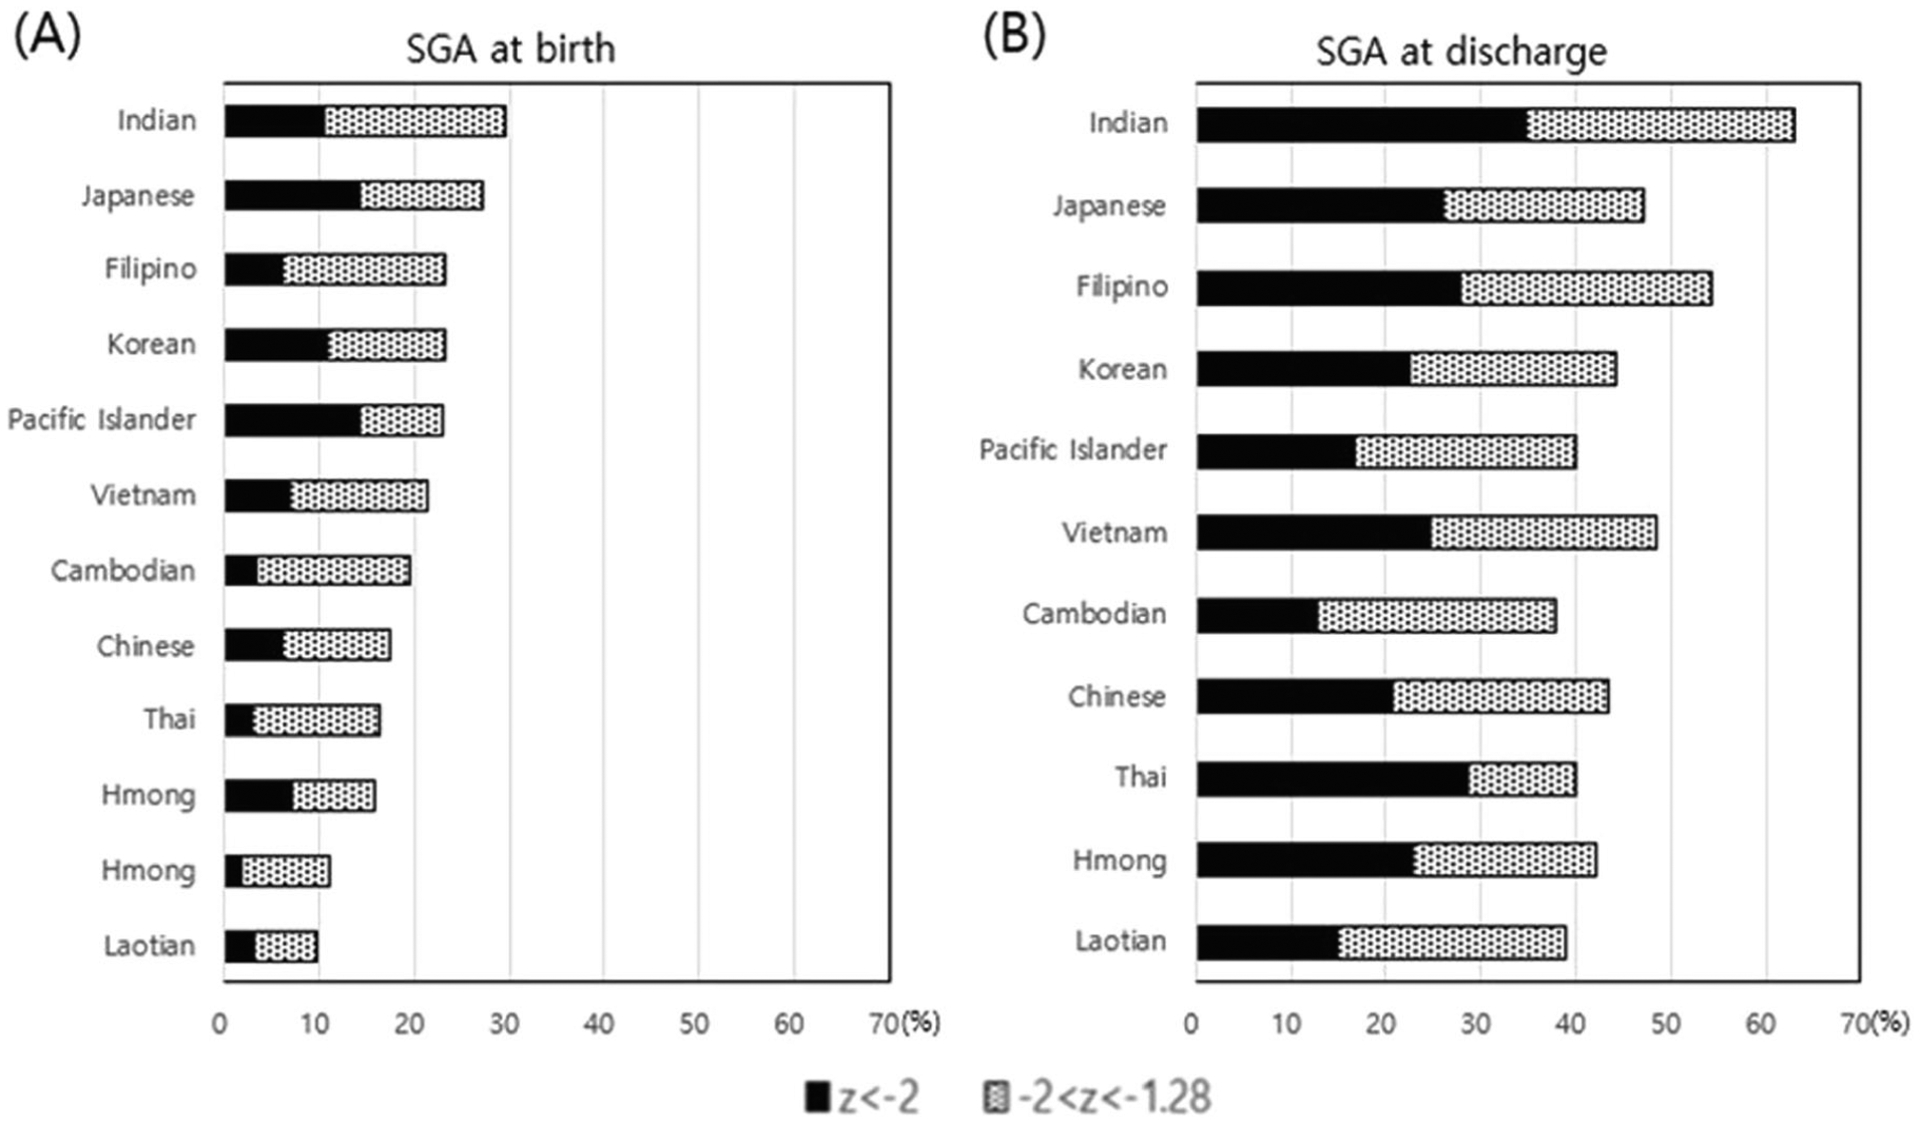
(a) at birth; and (b) at discharge.
Table 2 shows the unadjusted risk of SGA status at birth compared with the Filipino reference population. Indians had a statistically significant higher risk, while Chinese, Vietnamese, Laotians, and PIs had a statistically significant lower risk for SGA at birth. After controlling for potential confounding from maternal risk factors, including maternal age, maternal education, payer-type, multiparity, multiple pregnancy and BMI, the difference between Filipinos and Vietnamese, Laotians, and PIs was not significant, while the difference between Filipinos and Indian [OR (95% CI) 1.36 (1.01–1.84)] and Chinese [OR (95% CI) 0.60 (0.43–0.84)] persisted. With regard to SGA status at discharge, after controlling for maternal risk factors, the difference between Filipinos and Indian, Chinese, Korean, Cambodian, and PIs persisted. After adding SGA at birth to the model in addition to maternal risk factors, the difference between Filipinos and Korean, Indians and PIs was not significant, and only Chinese and Cambodians had a statistically significant lower risk than Filipinos.
Table 2.
Logistic regression models predicting the risk of SGA at birth and SGA at discharge.
| SGA at birth | SGA at discharge | ||||
|---|---|---|---|---|---|
| Unadjusted OR (95% CI) | Adjusted OR (95% Cl) | Unadjusted OR (95% Cl) | Adjusted OR (95% Cl) | Adjusted (+SGA at birth) OR (95% Cl) | |
| Filipino | Reference | Reference | Reference | Reference | Reference |
| Chinese | 0.69 (0.51–0.93)* | 0.60 (0.43–0.84)* | 0.65 (0.51–0.82)* | 0.57 (0.44–0.74)* | 0.62 (0.46–0.84)* |
| Japanese | 1.22 (0.74–2.03) | 1.32 (0.75–2.30) | 0.75 (0.48–1.18) | 0.77 (0.46–1.27) | 0.58 (0.30–1.09) |
| Korean | 0.99 (0.65–1.53) | 0.88 (0.54–1.43) | 0.67 (0.47–0.96)* | 0.66 (0.44–0.99)* | 0.62 (0.38–1.01) |
| Vietnamese | 0.65 (0.44–0.96)* | 0.59 (0.38–0.93) | 0.793 (0.59–1.07) | 0.73 (0.52–1.03) | 0.87 (0.59–1.28) |
| Cambodian | 0.80 (0.46–1.39) | 0.93 (0.50–1.71) | 0.52 (0.33–0.82)* | 0.59 (0.36–0.98)* | 0.51 (0.28–0.94)* |
| Thai | 0.98 (0.44–2.19) | 1.29 (0.56–3.00) | 0.56 (0.28–1.13) | 0.47 (0.22–1.02) | 0.26 (0.09–0.76)* |
| Laotian | 0.41 (0.17–0.98)* | 0.45 (0.17–1.18) | 0.54 (0.31–0.95)* | 0.68 (0.36–1.26) | 0.84 (0.42–1.69) |
| Hmong | 0.62 (0.36–1.05) | 0.83 (0.47–1.47) | 0.62 (0.41–0.92)* | 0.74 (0.48–1.13) | 0.73 (0.45–1.20) |
| Indian | 1.38 (1.05–1.80)* | 1.36 (1.01–1.84)* | 1.44 (1.13–1.83)* | 1.38 (1.05–1.80)* | 1.29 (0.95–1.75) |
| Pacific Islander | 0.35 (0.19–0.65)* | 0.43 (0.22–0.84) | 0.58 (0.40–0.89)* | 0.6 (0.39–0.92)* | 0.72 (0.45–1.14) |
Adjusted for maternal age, maternal education, payer-type, multiparity, multiple pregnancy and BMI using Asian reference.
p < 0.05.
According to Asian mother’s birthplace, the odds of SGA at birth showed no significant difference; however, SGA at discharge was significantly higher for infants of US-born mothers (OR 1.3, 95% CI 1.1–1.6, p = 0.0076) than of foreign-born mothers. In contrast, among infants born to PI mothers, the odds of SGA at birth was significantly higher for US-born PI mothers [OR (95% CI) 4.7 (1.2–18.2), p = 0.026] compared with their foreign-born counterparts; yet, we found no significant difference in rates of SGA at discharge.
Infants from same race parents had an increased risk of SGA at birth (OR 1.60, 95% CI 1.28–1.93, p < 0.0001) and SGA at discharge (OR 1.41, 95% CI 1.23–1.71, p < 0.0001) compared with infants from mixed race parents. Infants from same race parents had a decrease in z-score at birth of −0.220 (95% CI, −0.301 to −0.140) and Z-score at discharge of −0.112 (95% CI −0.321 to −0.155) compared with infants from mixed race parents.
Discussion
In this population-based large cohort of VLBW infants born in California, we confirmed that various Asian/PI races showed heterogeneous features in their growth patterns, which contributed to their risk of SGA status at birth and at discharge. Understanding racial differences among Asian/PI infants is important to optimally support their growth and development.
Birth weight, especially SGA status in birth weight falling below the physiological boundaries of normal fetal growth, may serve as an important indicator of severe morbidity and risk of mortality and it can influence both clinical care and parental expectations [18–20]. Preterm SGA confers a 15-fold risk of mortality in the first month after birth [21, 22]. From a study of immigrants to Canada, which included infants from five Asian countries such as Vietnam, South Korea, China, Hong Kong, and the Philippines, the risk of preterm SGA was highest among those from the Philippines, suggesting that a public health strategy is needed to reduce the incidence of preterm SGA in Filipino women [8]. In our current study, which included infants from ten Asian and PI groups, we found that Indian infants had significantly higher odds for SGA at birth, compared with Filipino infants.
It is clear that SGA at birth is a significant risk factor for poor postnatal growth; however, ethnic disparities in postnatal growth have not been well explained. In this study, after controlling for the potential confounding of maternal risk factors and SGA at birth, Indian infants did not show a significant risk for SGA at discharge, and only Chinese and Cambodian infants had a statistically significant lower risk, compared with Filipino infants. Ethnicity should be considered as a strong influencing factor for postnatal growth.
The maternal country of origin and maternal immigrant status can influence an infant’s birth weight, but these relationships are poorly understood [12, 23]. Infants born to immigrant Mexican mothers were shown to have higher incidences of SGA and mortality than infants born at the mother’s birthplace in their native country [24]. In our current study, the odds of SGA at birth were significantly higher for US-born PI mothers compared with their foreign-born counterparts; however, no such differences were observed for Asian mothers.
Since both parents contribute to the genetic potential of fetal growth, paternal and maternal origins also influence newborn weight [23, 25]. Among the immigrant population in Canada, the infants born to two foreign-born parents showed the lowest birth weights, and infants from mixed-origin couples had lower birth weights than those born to two Canadian-born parents [24]. In a Swedish study, infants born to two South Asian parents had the highest risk of SGA (adjusted risk ratio, 4.69), compared with infants born to two Swedish born parents; infants born to ethnically mixed couples experienced intermediate risks [12]. In accordance with these previous studies, infants of same race parents had an increased risk of birth SGA and discharge SGA, compared with the infants of mixed race parents, revealing that the parents’ ethnicity can influence postnatal growth.
It has been suggested that the best practice continues to be to support the growth rates of preterm infants at the intrauterine rate [26]. To describe an infant’s size and growth rate precisely, it is useful to obtain an infant’s exact percentiles or z-scores. However, the lack of consensus on how to define abnormal growth and the confusion surrounding the choice of the best growth chart to use remain important reasons for deficiencies in the current clinical performance of growth monitoring. Also, some investigators have advocated the use of race-specific birth weight percentile curves to more accurately reflect populations that may have constitutionally lower birth weights [12, 20, 24]. Although an infant’s smaller size can be attributable to genetics and race may not be a pathological factor, some medical risk from smaller size may affect infants across racial groups. Also, each race-based birth weight percentile may have limitations in terms of international validation. Having more accurate and personalized growth parameters will facilitate optimal approaches for quality improvement that are targeted at the specific infant.
The major strength of our study is the inclusion of a large diverse population that covers over 90% of California NICUs for all VLBW infants and includes the greatest number of Asian and PI infants in the US. Size at birth and growth from birth to discharge differed across the Asian groups and considerations should be tailored to specific racial and ethnic groups in risk assessment and strategies for therapies. Quality improvement in order to optimize nutrition and growth depends on appropriate benchmarks and standards. By recognizing that infants with specific race and ethnicity have differing average birth weights and growth trajectories, clinical providers and quality improvement teams will be better able to detect opportunities for quality improvement and track outcomes. The infants’ growth velocities followed similar trajectories during NICU admission, suggesting that current NICU practices for these groups are equitable in promoting nutrition, although further improvements are needed for all groups.
Our study has to be viewed in light of its design, showing associations not causal relationships between race/ethnicity and growth parameters. Quantitative nutritional data, monitoring of growth at only birth and discharge, and assessments of other growth parameters including length, head circumference, and BMI were all unavailable in our data source. Maternal and paternal race/ethnicity, and maternal birthplace were self-reported on the birth certificate, with some missing variables and potential for reporting errors. We didn’t have enough infants to separate out the different PI ethnic groups.
Conclusion
In this population-based large cohort of VLBW infants born in California, we confirmed that various Asian and PI race/ethnicities were an independent risk factor for SGA at birth and at discharge, showing heterogeneous growth patterns. Clinical study designs should carefully consider whether these individuals should be combined as just one group.
Acknowledgements
This work was supported by the March of Dimes Prematurity Research Center at Stanford University School of Medicine. JP contribution is supported by a grant from the Eunice Kennedy Shriver National Institute of Child Health and Human Development (R01 HD084667-01, PI). This content is solely the responsibility of the authors and does not necessarily represent the official views of the National Institutes of Health or the March of Dimes. The authors thank Medical Illustration & Design for helping to design Fig. 1.
Footnotes
Conflict of interest The authors declare that they have no conflict of interest.
References
- 1.Ghosh C. A national health agenda for Asian Americans and Pacific Islanders. JAMA. 2010;304:1381–2. [DOI] [PubMed] [Google Scholar]
- 2.Anderson JG, Rogers EE, Baer RJ, Oltman SP, Paynter R, Partridge JC, et al. Racial and ethnic disparities in preterm infant mortality and severe morbidity: a population-based study. Neonatology. 2018;113:44–54. [DOI] [PubMed] [Google Scholar]
- 3.Sentell T, Chang A, Cheng Y, Miyamura J. Maternal quality and safety outcomes for Asians and Pacific Islanders in Hawai’i: an observational study from five years of statewide data. BMC Pregnancy Childbirth. 2014;14:298. [DOI] [PMC free article] [PubMed] [Google Scholar]
- 4.Schempf AH, Mendola P, Hamilton BE, Hayes DK, Makuc DM. Perinatal outcomes for Asian, Native Hawaiian, and other Pacific Islander mothers of single and multiple race/ethnicity: California and Hawaii, 2003–2005. Am J Public Health. 2010;100:877–87. [DOI] [PMC free article] [PubMed] [Google Scholar]
- 5.Ehrenkranz RA, Dusick AM, Vohr BR, Wright LL, Wrage LA, Poole WK. Growth in the neonatal intensive care unit influences neurodevelopmental and growth outcomes of extremely low birth weight infants. Pediatrics. 2006;117:1253–61. [DOI] [PubMed] [Google Scholar]
- 6.Wang PW, Fang LJ, Tsou KI. The growth of very-low-birth-weight infants at 5 years old in Taiwan. Pediatr Neonatol. 2014;55:114–9. [DOI] [PubMed] [Google Scholar]
- 7.Guellec I, Lapillonne A, Marret S, Picaud JC, Mitanchez D, Charkaluk ML, et al. Effect of intra- and extrauterine growth on long-term neurologic outcomes of very preterm infants. J Pediatr. 2016;175:93–9.e1. [DOI] [PubMed] [Google Scholar]
- 8.Bartsch E, Park AL, Jairam J, Ray JG. Concomitant preterm birth and severe small-for-gestational age birth weight among infants of immigrant mothers in Ontario originating from the Philippines and East Asia: a population-based study. BMJ Open. 2017;7:e015386. [DOI] [PMC free article] [PubMed] [Google Scholar]
- 9.Qin C, Gould JB. The Asian birth outcome gap. Paediatr Perinat Epidemiol. 2006;20:279–89. [DOI] [PubMed] [Google Scholar]
- 10.Kim DH, Jeon J, Park CG, Sriram S, Lee KS. Births to parents with Asian Origins in the United States, 1992–2012. J Korean Med Sci. 2016;31:1949–56. [DOI] [PMC free article] [PubMed] [Google Scholar]
- 11.Qin C, Gould JB. Maternal nativity status and birth outcomes in Asian immigrants. J Immigr Minor Health. 2010;12:798–805. [DOI] [PubMed] [Google Scholar]
- 12.Urquia ML, Qiao Y, Ray JG, Liu C, Hjern A. Birth outcomes of foreign-born, native-born, and mixed couples in Sweden. Paediatr Perinat Epidemiol. 2015;29:123–30. [DOI] [PubMed] [Google Scholar]
- 13.Gould JB. The role of regional collaboratives: the California Perinatal Quality Care Collaborative model. Clin Perinatol. 2010;37:71–86. [DOI] [PubMed] [Google Scholar]
- 14.Fenton TR, Kim JH. A systematic review and meta-analysis to revise the Fenton growth chart for preterm infants. BMC Pediatr. 2013;13:59. [DOI] [PMC free article] [PubMed] [Google Scholar]
- 15.Fenton TR, Sauve RS. Using the LMS method to calculate z-scores for the Fenton preterm infant growth chart. Eur J Clin Nutr. 2007;61:1380–5. [DOI] [PubMed] [Google Scholar]
- 16.WHO Expert Consultation. Appropriate body-mass index for Asian populations and its implications for policy and intervention strategies. Lancet. 2004;363:157–63. [DOI] [PubMed] [Google Scholar]
- 17.Health CDoP. Regional Perinatal Programs of California (RPPC). 2015.
- 18.Griffin IJ, Tancredi DJ, Bertino E, Lee HC, Profit J. Postnatal growth failure in very low birthweight infants born between 2005 and 2012. Arch Dis Child Fetal Neonatal Ed. 2016;101:F50–5. [DOI] [PubMed] [Google Scholar]
- 19.De Jesus LC, Pappas A, Shankaran S, Li L, Das A, Bell EF, et al. Outcomes of small for gestational age infants born at <27 weeks’ gestation. J Pediatr. 2013;163:55–60.e1–3. [DOI] [PMC free article] [PubMed] [Google Scholar]
- 20.McIntire DD, Bloom SL, Casey BM, Leveno KJ. Birth weight in relation to morbidity and mortality among newborn infants. N. Engl J Med 1999;340:1234–8. [DOI] [PubMed] [Google Scholar]
- 21.Katz J, Lee AC, Kozuki N, Lawn JE, Cousens S, Blencowe H, et al. Mortality risk in preterm and small-for-gestational-age infants in low-income and middle-income countries: a pooled country analysis. Lancet. 2013;382:417–25. [DOI] [PMC free article] [PubMed] [Google Scholar]
- 22.Ray JG, Park AL, Fell DB. Mortality in infants affected by preterm birth and severe small-for-gestational age birth weight. Pediatrics. 2017;140:e20171881. https://www.ncbi.nlm.nih.gov/pubmed/29117948. [DOI] [PubMed] [Google Scholar]
- 23.Park AL, Urquia ML, Ray JG. Risk of preterm birth according to maternal and paternal country of birth: a population-based study. J Obstet Gynaecol Can. 2015;37:1053–62. [DOI] [PubMed] [Google Scholar]
- 24.Zipursky AR, Park AL, Urquia ML, Creatore MI, Ray JG. Influence of paternal and maternal ethnicity and ethnic enclaves on newborn weight. J Epidemiol Community Health. 2014;68:942–9. [DOI] [PubMed] [Google Scholar]
- 25.Khanlou N, Haque N, Skinner A, Mantini A, Kurtz Landy C. Scoping review on maternal health among immigrant and refugee women in Canada: prenatal, intrapartum, and postnatal care. J Pregnancy. 2017;2017:8783294. [DOI] [PMC free article] [PubMed] [Google Scholar]
- 26.Lucas A. Long-term programming effects of early nutrition - implications for the preterm infant. J Perinatol. 2005;25(Suppl 2): S2–6. [DOI] [PubMed] [Google Scholar]