Abstract
The tumor microenvironment, comprised of tumor cells and tumor‐infiltrating immune cells, is closely associated with the clinical outcome of clear cell renal cell carcinoma (ccRCC) patients. However, the landscape of immune infiltration in ccRCC has not been fully elucidated. Herein, we applied multiple computational methods and various datasets to reveal the immune infiltrative landscape of ccRCC patients. The tumor immune infiltration (TII) levels of 525 ccRCC patients using a single‐sample gene were examined and further categorized into immune infiltration subgroups. The TII score was characterized by distinct clinical traits and showed a significant divergence based on gender, grade, and stage. A high TII score was associated with the ERBB signaling pathway, the TGF‐β signaling pathway, and the MTOR signaling pathway, as well as a better prognosis. Furthermore, patients with high TII scores exhibited greater sensitivity to pazopanib. The low TII score was characterized by a high immune infiltration level of CD8+ T cells, T follicular helper cells, and regulatory T cells (Tregs). Moreover, the immune check point genes, including CTLA‐4, LAG3, PD‐1, and IDO1, presented a high expression level in the low TII score group. Patients in the high TII score group demonstrated significant therapeutic advantages and clinical benefits. The findings in this study have the potential to assist in the strategic design of immunotherapeutic treatments for ccRCC.
Keywords: clear cell renal cell carcinoma, immune cell infiltration, immune check point, immunotherapy, tumor microenvironment
The tumor immune infiltration (TII) level of 525 clear cell renal cell carcinoma (ccRCC) patients was systematically investigated, as well as the association between tumor‐infiltrating immune cells and clinical outcomes. The high TII score was associated with the ERBB, the TGF‐β, and the MTOR signaling pathway. Furthermore, patients with high TII scores exhibited greater sensitivity to sunitinib, cisplatin, and vinblastine. The immune check point genes, including CTLA‐4, LAG3, PD‐1, and IDO1, presented high expression levels in the low TII score group. The present study confirmed that TII scores can serve as effective prognostic biomarkers for immunotherapy.
1. INTRODUCTION
Clear cell renal cell carcinoma (ccRCC) is the most common type of renal cell carcinoma (RCC) and is responsible for approximately 80% of RCC cases. 1 , 2 It is a malignant tumor with multiple molecular features and a poor prognosis. 3 The morbidity and mortality rates of ccRCC remain high, and effective treatment methods are lacking. Due to the lack of typical clinical symptoms, it is difficult to diagnose ccRCC and approximately 35% of patients had developed metastasis at the time of diagnosis. 4 In addition, the mortality rate of ccRCC is high, with rates of up to approximately 60% within the first 2‐3 years of diagnosis. 5 Therefore, there is an urgent need to identify effective biomarkers and therapeutic targets to improve the prognosis and survival of ccRCC patients.
Surgery is now the most common therapy in the treatment of ccRCC, followed by chemotherapy and radiotherapy. 6 However, due to the insensitivity and drug resistance using the conventional therapies, patient prognosis is still poor. Since the first PD‐1 inhibitor (nivolumab) aprroved in 2014, tumor immunotherapy has emerged as an attractive approach in cancer therapy. The approach is focused on establishing an understanding of the associations among the tumor microenvironment (TME), tumor cells, and the immune system and promoting human immunity to control the development of tumors. 7 However, only a minority of patients can benefit from immunotherapy due to the lack of identified biomarkers. Thus, identifying novel therapeutic markers for immunotherapy for ccRCC is urgent. The TME is closely related to the clinical outcome in ccRCC patients. The infiltration immune cells form an ecosystem in the TME. They are involved in tumor progression and have essential prognostic value. 7 Studies have demonstrated that the cytotoxic CD8+ T cells and CD4+ helper T cells can target antigenic tumor cells and inhibit the growth of tumor cells. 8 The infiltrating CD4+ T cells can regulate the proliferation of RCC by modulating the TGFβ1/YBX1/HIF2α signals. 9 Moreover, the TME can also prevent the T cell response through regulatory T cells (Tregs), which generate immunosuppressive cytokines, leading to T cell dysfunction, and finally causing tumor cells to lose their immunogenicity. 10 , 11 Cumulative evidence has shown that regulatory T cells (Tregs) can efficiently suppress effector T cell proliferation in RCC. 12 Tumor‐associated macrophages (TAM) also play an essential role in promoting or blocking tumor progression. Distinct TAM subsets in different environments can induce or inhibit immunity to cancer. 13 , 14 In recent reports, a high expression level of CD163+ or CD204+ TAM was associated with a poor survival outcome in papillary renal cell carcinoma (pRCC) patients, while CD163 and CD204 were recognized biomarkers for macrophages. 15 This evidence demonstrated that immune cell infiltration plays an essential role in tumor progression. However, the mechanism of immune cells infiltrating the TME of ccRCC has not been fully elucidated.
To thoroughly investigate the landscape of immune cell infiltration in the ccRCC microenvironment, single‐sample gene set enrichment (ssGSEA) and the ESTIMATE algorithm were applied in this study. Three subgroups were then identified using consensus algorithms as per the immune cell infiltration patterns. TII scores were constructed to recognize the distinct immune landscape, which could precisely predict the overall survival (OS) and disease‐free survival outcomes of ccRCC patients and their response to immunotherapy.
2. MATERIALS AND METHODS
2.1. Collection of datasets
To characterize the landscape of the TII level of ccRCC, 539 ccRCC patient gene read‐count data samples were retrieved as well as corresponding clinical information from The Cancer Genome Atlas (TCGA) database. The gene read‐count data were then transformed to transcript per million (TPM) values and cases with survival time equal to 0 were excluded. As a result, 525 patient samples were used in the downstream analysis. To ensure the reliability of results, we also downloaded a pRCC dataset from the TCGA, which included 288 patient samples and clinical information.
2.2. Consensus clustering of tumor‐infiltrating immune cell and function signatures
The proportion of the 29 immune signatures was quantified (16 immune cell and 13 immune‐associated function signatures) in each ccRCC sample using a single‐sample gene set enrichment analysis (ssGSEA) algorithm. The ESTIMATE algorithm was applied to evaluate the immune cell infiltration level (immune score) and the stromal content (stromal score) for each ccRCC sample. The ConsensuClusterPlus R package was used to perform consensus clustering of each ccRCC sample based on the 29 immune signature and the Kaplan‐Meier method was used in the analysis. 16
2.3. Differentially expression genes associated with tumor immune infiltration subgroup
The ccRCC patients were classified into three TII subgroups based on the immune infiltrate level to identify DEG related to TII subgroups. The DEG were identified using the “limma” R package with the screening criterion: absolute fold change >1.5 and false discovery rate (FDR) <0.05. 17
2.4. Construction of tumor immune infiltration score
The ConsensuClusterPlus R package was used to perform consensus clustering of each ccRCC sample based on DEG expression data. Then, the DEG values that were positively and negatively associated with the gene cluster signatures served as TII gene signatures A and B, respectively. Principal component analysis (PCA) was used to define the TII score and the principal component 1 was extracted as the TII signature score. Finally, a method similar to immune cell infiltration (ICI) was used as an index to define the TII score of each ccRCC sample:
TII score = Ʃ PC1A − Ʃ PC1B.
To explore the potential pathway of gene signatures A and B, “clusterProfiler” was used to identify the significant pathways with the criterion: FDR < 0.05. 18
2.5. External validation with the tumor immune infiltration score
An independent dataset named IMvigor210 was downloaded from a freely available data package (http://research‐pub.gene.com/IMvigor210CoreBiologies). The dataset comprises 298 urothelial cancer cases, including immunotherapy and corresponding clinical information. After that, the TII score and its predictive value were determined through analyzing the IMvigor210 dataset.
2.6. Chemotherapy drug response prediction
The chemotherapeutic response of each ccRCC sample was predicted based on the Genomics of Drug Sensitivity in Cancer (GDSC) database (https://www.cancerrxgene.org/). 19 Four commonly used chemo drugs, sorafenib, sunitinib, pazopanib, and axitinib, were selected. The prediction procedure was carried out using R package “pRRophetic,” the half‐maximal inhibitory concentration (IC50) of ccRCC was estimated by ridge regression, and the prediction accuracy was evaluated by 10‐fold cross‐validation based on the GDSC training set.
2.7. Prediction of therapeutic response of compounds
To determine which target compounds may be useful, we first identified the DEG between the high TII score and the low TII score groups using the limma R package. The top 1000 DEG were uploaded to the connectivity map (CMap) (https://www.broadinstitute.org/connectivity‐map‐cmap). 20
2.8. Statistical analyses
All statistical testing and analysis was implemented in the R environment with version 4.0.2. The χ2‐test was used for the categorical data, while the Wilcoxon and Kruskal tests were applied for two‐group and three‐group continuous data, respectively. Kaplan‐Meier curve analysis was used to generate the survival curve of the subgroup, the gene cluster, and the TII score, respectively. The optimal cutoff point for classifying patients into the two groups in each dataset was determined by the “surv_cutpoint” function in the “survminer” R package. In addition, log‐rank test analysis was used to explore the survival difference between the two groups.
3. RESULTS
3.1. Landscape of tumor immune infiltration in clear cell renal cell carcinoma
A total of 29 immune signatures were retrieved (16 immune cell and 13 immune‐associated function signatures). An ssGSEA algorithm was applied to quantify the infiltration level of immune cell and function signatures. According to the 525 ccRCC patients with tumor immune infiltration (TII) profiles, a consensus clustering algorithm was used to categorize patients into distinct subgroups. The cumulative distribution function (CDF) curve and the delta curve were used to determine the optimal k value, and k = 5 was eventually selected as the optimal cluster number after comprehensive consideration (Figure S1A‐C). Five subgroups (designated C1, C2, C3, C4, and C5) have significant survival differences (log‐rank test P value = .03, Figure 1A). PCA were performed to decrease the dimension of features to validate the subgroup assignment. As shown in Figure 1B, the subgroup designations were basically consistent with two‐dimensional distribution patterns. The two key immune checkpoints (PD1 and PD‐L1) were also analyzed in each TII subgroup using the Kruskal‐Wallis test. PD1 had a high expression level in subgroups C1 and C4, while subgroup C3 showed a high expression level of PD‐L1 (Figure 1C,D). In addition, the five subgroups had different infiltration level patterns: subgroup 3 had the highest immune infiltration level; subgroups 1, 5, and 4 were ranked second, third, and fourth, while subgroup 2 showed the lowest immune infiltration level (Figure 2A). Considering that subgroups C1 and C4 had a better prognosis when compared to C2, C3, and C5, we divided all ccRCC samples into a better prognosis group (C1&4) and a poor prognosis group (C2&3&5). The KM curve analysis suggested that there was a significant divergence between the two groups (log‐rank P value = 1.303e‐03, Figure 2B).
FIGURE 1.
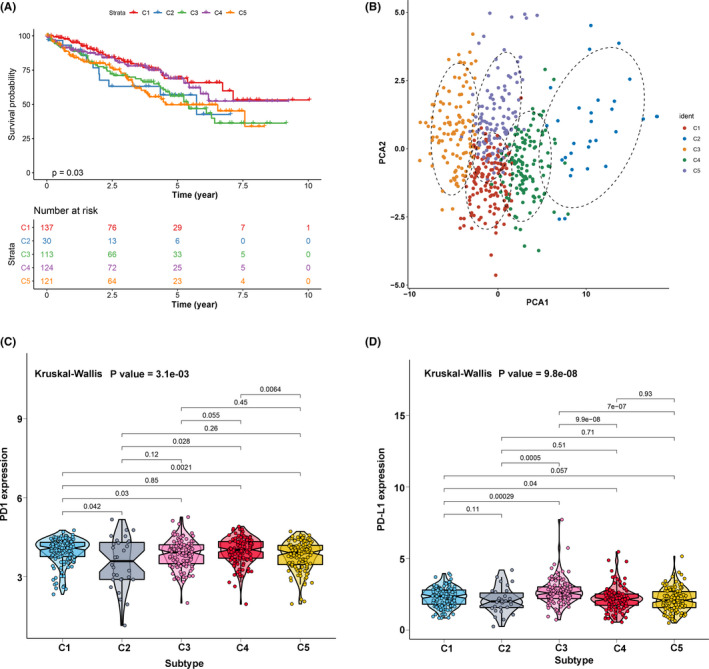
The landscape of tumor immune infiltration in clear cell renal cell carcinoma (ccRCC) patients. (A) Cluster survival analysis of the five subgroups. (B) Principal component analysis supported the stratification into five subgroups of ccRCC. (C) Comparisons of the expression level of PD1 in five subgroups. (D) Comparisons of the expression level of PD‐L1 in five subgroups
FIGURE 2.
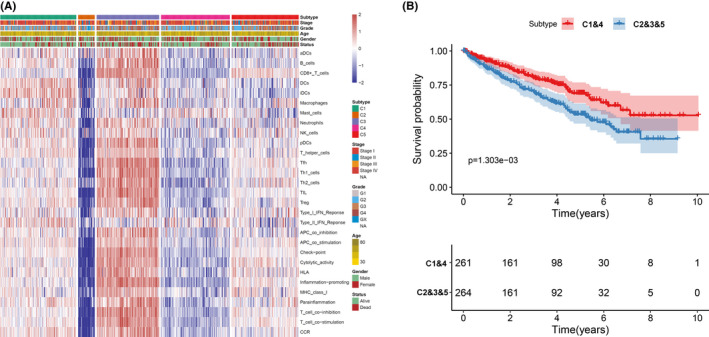
The association between clinical traits and subgroups. (A) A heatmap including the clinical traits and 29 immune signatures. (B) Cluster survival analysis of subgroups C1&4 and C2&3&5
3.2. Characterization of immune gene subgroups
To reveal the underlying biological features of distinct immune infiltration subgroups, a differential expression analysis was conducted to characterize transcriptome variations between subgroups C1&4 and C2&3&5. As a result, a total of 658 DEG were identified and subsequently exploited for the consensus clustering analysis (Table S1). Eventually, three immune‐related gene clusters were obtained based on the CDF curve and the delta curve analysis (Figure S2A‐C; Figure 3). The KM curve analysis results indicated that a significant survival difference existed in gene clusters A, B, and C. Among the three gene clusters, cluster A corresponded to more subgroup C3 cases and a median survival outcome. The patients in cluster B were characterized by a poor survival outcome and showed a negative correlation with DEG in general. The subjects of gene cluster C had better survival outcomes and there was a significant increase of subgroup C1 cases in this group (Figure 4A). In addition, the PCA also showed a significant distinction among three gene clusters (Figure 4B). The expression profile of PD1/PD‐L1 showed a high expression level in cluster C, while cluster B was characterized by a lower PD1/PD‐L1 expression level, based on Kruskal‐Wallis analysis (Figure 4C,D). The immune cell infiltration level was further evaluated, as well as the immune function level of the three gene clusters. We found that gene cluster A was marked by all immune cell and immune function infiltration, except the mast cells and type II interferon (IFN) response. The subject in gene cluster B had the lowest immune cell and immune function infiltration. The patients in gene cluster C were characterized by a significantly high density of mast cells and type II IFN response infiltration (Figure 5A,B). Moreover, the immune score and stromal score presented a similar trend, with a high infiltration level in gene cluster A and a low infiltration level in gene clusters B and C (Figure 5C,D) Previously published studies showed that high immune and stromal scores are associated with an unfavorable prognosis, which is consistent with our result. 21
FIGURE 3.
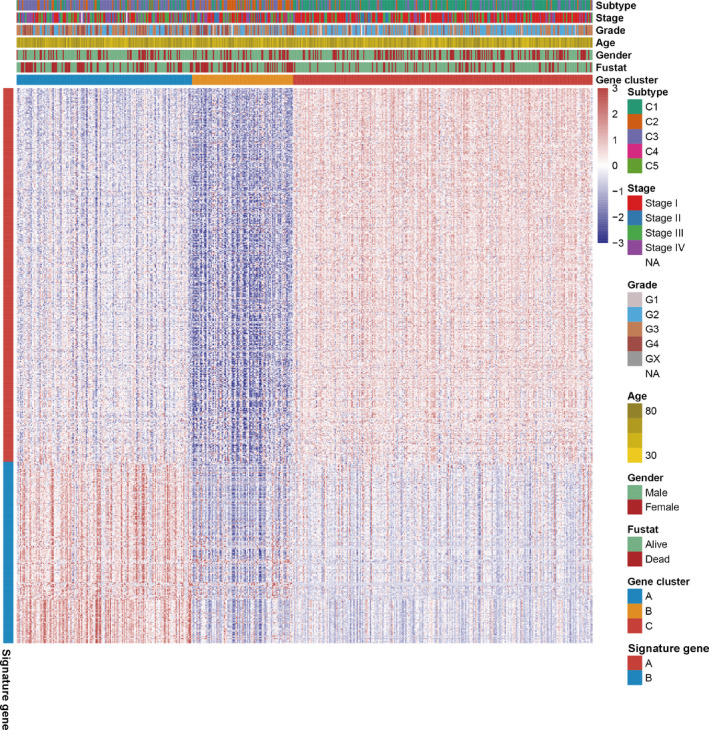
Consensus clustering of common differentially expressed genes among two subgroups (C1&4 and c2&3&5) to categorize patients into three gene clusters (A, B, and C)
FIGURE 4.
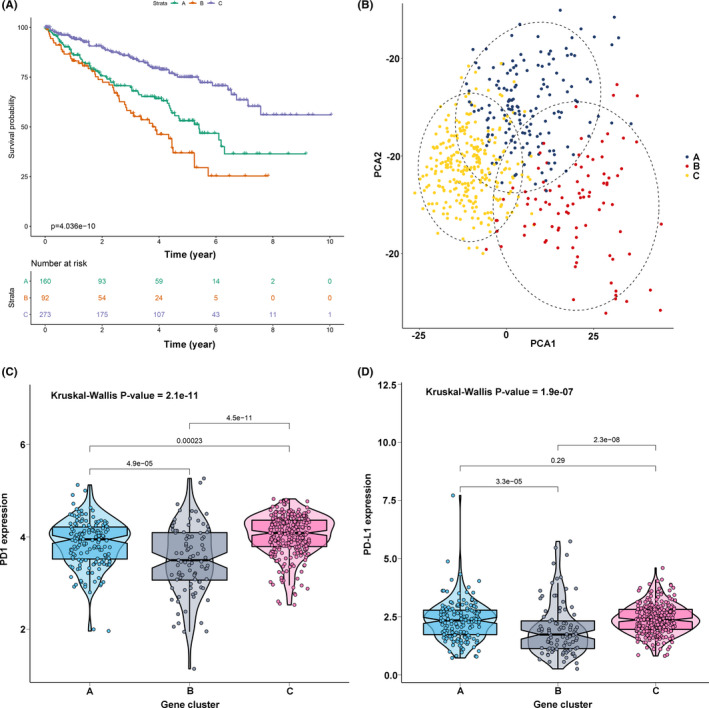
Identification of gene cluster. (A) KM survival curve analysis of the three gene clusters. (B) Principal component analysis supported the stratification into three gene clusters of clear cell renal cell carcinoma (ccRCC). (C) Comparisons of expression level of PD1 in three gene clusters. (D) Comparisons of expression level of PD‐L1 in three gene clusters
FIGURE 5.
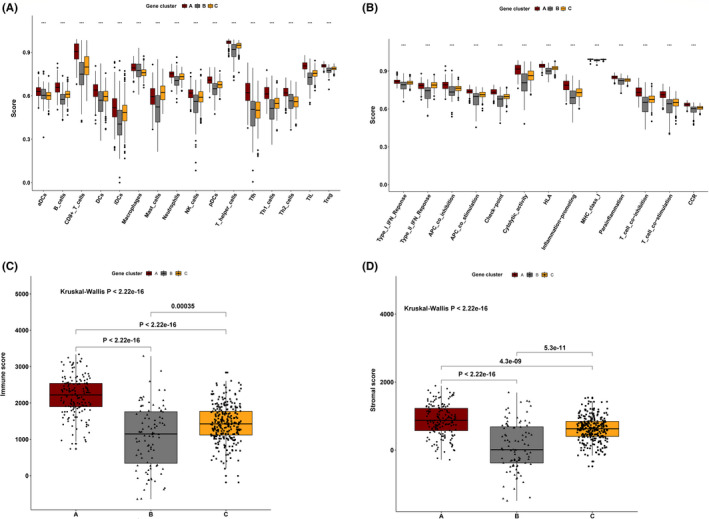
Tumor immune infiltration in three gene clusters. (A) The 16 immune cell infiltration level in three gene clusters. (B) The 13 immune function level in three gene clusters (C) The immune score in three gene clusters. (D) The stromal score in three gene clusters
Among these DEG, a total of 443 gene signatures that positively correlated with gene clusters were referred to as TII signature A; the rest of gene signatures that negatively correlated with gene clusters were referred to as TII signature B (Figure 3). Pathway enrichment analysis was performed using the clusterProfiler R package. As shown in Figure 6, gene signature A was mainly enriched in the PI3K‐Akt signaling pathway, ECM‐receptor interaction, Rap 1 signaling pathway, and focal adhesion, while cytokine‐cytokine receptor interaction, the T cell receptor signaling pathway, the chemokine signaling pathway, Th17 cell differentiation, PD‐L1 expression and the PD‐1 checkpoint pathway in cancer, and Th1 and Th2 cell differentiation were observed in gene signature B.
FIGURE 6.
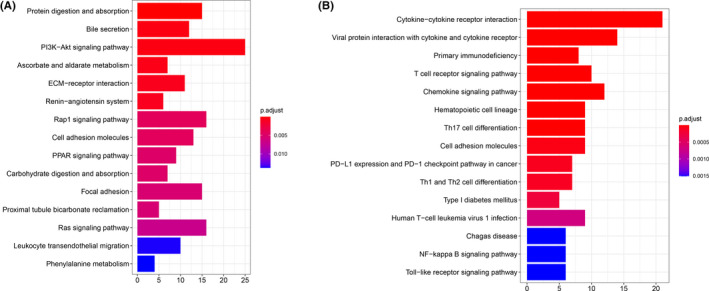
KEGG pathway enrichment analysis for the gene signature A (A) and signature B (B), respectively
3.3. Construction of tumor immune infiltration score
To acquire a quantitative index for the TII landscape in ccRCC patients, PCA was applied to calculate the two aggregate scores: (a) the TII score A retrieved from gene signature A; and (b) the TII score B retrieved from gene signature B. The TIIA and TIIB of each ccRCC patient was computed as the sum of relevant individual scores. Ultimately, we obtained the gene signature score and defined it as the TII score. The patients were then classified into high TII score and low TII score groups based on the optimal cutoff by using the “survminer” R package. KM survival curve analysis results showed that patients in the high TII score group had a significantly better prognosis than those in the low TII score group (Figure 7A). In addition, the distribution of ccRCC patients in three gene clusters and in the TII score group are presented in Figure 7B. The gene set enrichment analysis (GSEA) revealed that patients in the high TII score group were mainly enriched in the ERBB signaling pathway, the MAPK signaling pathway, the MTOR signaling pathway, renal cell carcinoma, spliceosome, the TGF beta signaling pathway, and the ubiquitin mediated proteolysis pathway (Figure 7C). Patients with high non‐synonymous variants had more CD8+ T cell infiltration in the tumor tissue, so that these tumors could be identified and eliminated. This indicates that the tumor burden mutation (TMB) plays an essential role in cancer immunotherapy. Considering the importance of this clinical implication, the intrinsic relationship between TMB and TII were further investigated. A survival analysis between high TMB and low TMB value groups based on the optimal cutoff was performed. As presented in Figure 7D, we discovered that patients in the low TMB group have a better prognosis than those in the high TMB group. The synergistic effect of the TMB value and the TII score was further evaluated through prognostic stratification of ccRCC. The stratified survival analysis results showed that TMB status did not interfere with predictions based on ICI scores. There is a significant survival difference between the TII high score group and the low score group of patients (log‐rank P value < .0001, Figure 7E). These results suggested that the TII score can serve as an effective predictor, independent of TMB. We also evaluated the infiltration level of 16 immune cells and 13 immune functions between the high TII score and low TII score groups. We discovered that patients in the low TII score group had a significantly higher immune cell infiltration level overall, except for mast cells, natural killer (NK) cells, neutrophils, and immature dendritic cells. With the exception of type II IFN response and MHC class I, all the immune functions had a high infiltration level in the low TII score group (Figure 8A,B). Immune checkpoint blockades have emerged as a promising therapy for many cancers. Therefore, we subsequently investigate the expression level of eight immune checkpoints, including CD274 (PD‐L1), PDCD1LG2 (PD‐L2), PDCD1 (PD‐1), LAG3, TIGIT, IDO1, CTLA‐4, and HAVCR2, in the TII score. We observed that most genes, except for PDCD1LG2, IDO1, and HAVCR2, presented a significantly high expression level in the low TII score group (Figure 9A).
FIGURE 7.
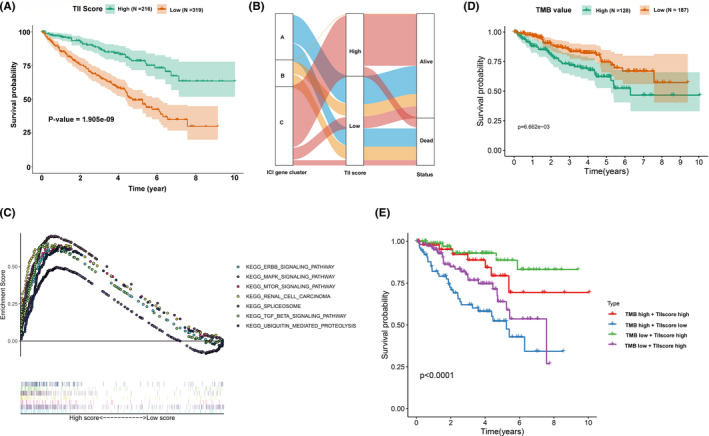
Construction of the tumor immune infiltration (TII) score. (A) KM survival curve analysis between high TII score and low TII score groups. (B) Alluvial diagram of TII gene cluster distribution in groups with distinct gene clusters, TII scores, and survival status. (C) Gene set enrichment analysis (GSEA) for the high TII score group. (D) KM survival curve analysis between high TMB value and low TMB value groups. (E) KM survival curves analysis for clear cell renal cell carcinoma (ccRCC) patients stratified by both TMB and TII scores
FIGURE 8.
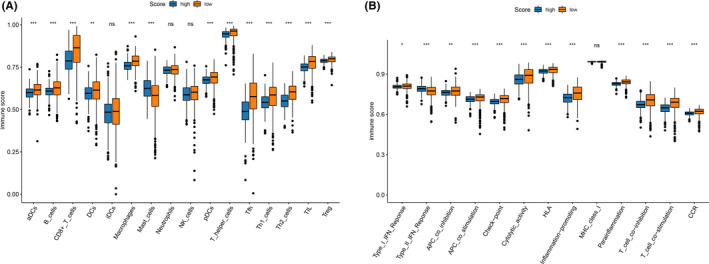
Tumor immune infiltration in tumor immune infiltration (TII) score. (A) The 16 immune cell infiltration level in the two TII score groups. (B) The 13 immune function level in the two TII score groups
FIGURE 9.
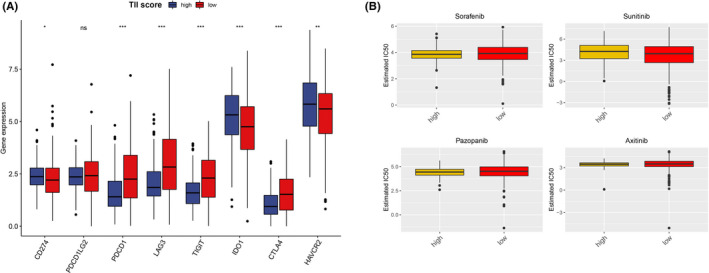
Expression level of immune check point (A) and sensitivity of four chemo drugs (B) evaluation in the two tumor immune infiltration (TII) score groups
3.4. Role of tumor immune infiltration score in the sensitivity prediction for chemotherapies
Presently, surgery and chemotherapy are the most common treatments for the cancer. Therefore, we evaluated the response of the two TII score groups to four chemotherapy drugs: sorafenib, sunitinib, pazopanib, and axitinib. We used the ridge regression to train the predictive model on the GDSC cell line dataset and the predictive accuracy was assessed through 10‐fold cross‐validation. The IC50 value for each ccRCC patient based on a predictive model of eight chemo drugs was then calculated. We observed that patients in the high TII score group showed more sensitivity to pazopanib (Wilcoxon test P value = 0.0489) (Figure 9B). However, the other chemotherapy drugs showed no significant difference in the TII score group.
3.5. Candidate small molecular compounds targeting tumor immune infiltration score
To identify TII‐specific small molecular compounds, we first performed differential expression analysis between high TII score and low TII score groups using the “limma” R package. According to the previous screening criteria, we identified 125 upregulated genes and 77 downregulated genes (Figure 10A,B). These DEG were then uploaded to the CMap database. As a result, a total of 73 compounds with 51 mechanisms of action (MOA) were obtained (Figure 10C). We discovered that multiple compounds shared one MOA. For example, four compounds (indoprofen, valdecoxib, nimesulide, and nabumetone) shared the MOA of the cyclooxygenase inhibitor. Four compounds (remoxipride, piperacetazine, molindone, and spiperone) shared the MOA of the dopamine receptor antagonist. Our study identified compounds targeting the TII signature and might provide therapeutic targets for further study.
FIGURE 10.
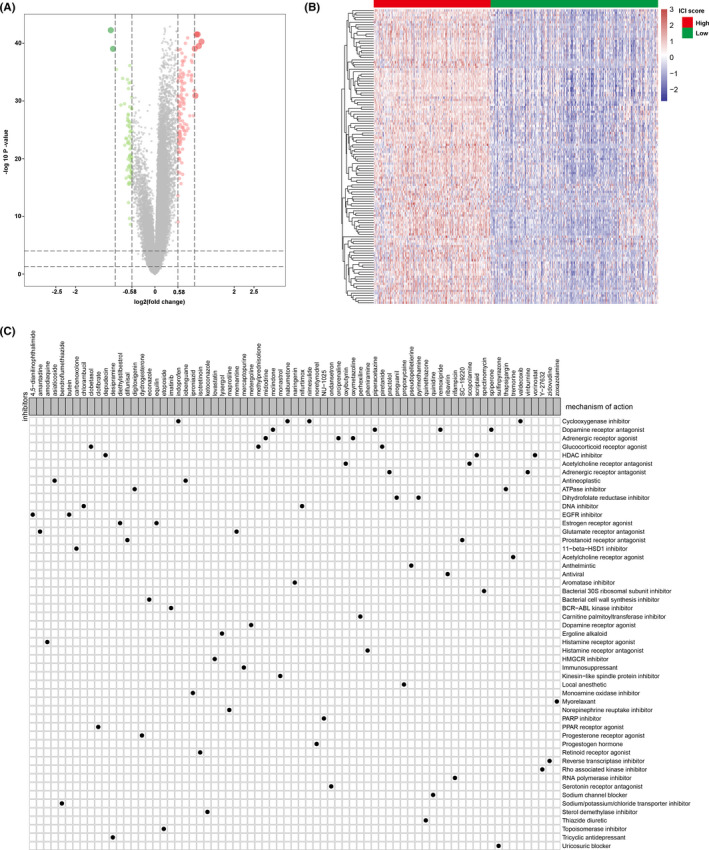
Small molecular compounds identification based on the differentially expressed genes. (A) Volcano plot for the differentially expressed genes; green dots represent the downregulated genes, red dots represent the upregulated genes, and the gray dots represent the non‐significant genes. (B) Heatmap of the differentially expressed genes expression. (C) Small molecular compound identification through CMap analysis based on the differentially expressed genes
3.6. Relationship between tumor immune infiltration score and clinical information
To explore the relationship between the TII score and clinical information (status, gender, age, grade, and stage), we used the Fisher test to analyze the difference between high TII score and low TII score groups. As shown in Figure 11A, we observed that the status (Fisher test P value = 9.9e‐10), gender (fisher test P value = 3.5e‐04), grade (fisher test P value = 2e‐14), and stage (fisher test P value = 4e‐08) were significantly different in the two TII groups. A high TII score was associated with more patients being alive and alive case and more female patients. A low TII score corresponded to more dead patients and more advance grade and stage patients. We also performed multivariate Cox regression analysis for the clinical traits and the TII score for overall survival (OS) and disease‐free survival (DFS). We found that the TII score can serve as an independent predictor for the OS and DFS in ccRCC patients (Figure 11B). The TII score was further compared with previously reported immune signatures 22 , 23 (Figure S3).
FIGURE 11.
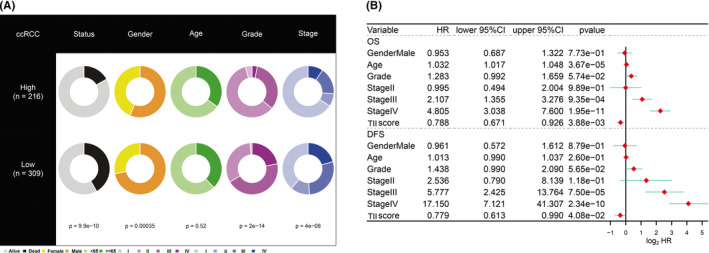
Clinical significance of the tumor immune infiltration (TII) score. (A) Clinical divergence of clinical traits (survival status, age, gender, stage, and grade) in the high TII score group and the low TII score group using the Fisher test or the χ2‐ test. (B) Multivariate Cox regression analysis for the clinical trait (age, gender, stage, and grade) and TII score in the overall survival and disease‐free survival of clear cell renal cell carcinoma (ccRCC) patients
3.7. Validation of the tumor immune infiltration score
To validate the prognostic value of the TII score, we first performed a KM survival curve analysis in the DFS. We discovered that the patients in the high TII score group had a better survival outcome than those in the low TII score group, which is consistent with the OS result (log‐rank test P value = 2.821e‐05; Figure 12A). We downloaded another RCC dataset (pRCC) from the TCGA database to assess the applicability of the TII score. Similarly, patients in the high TII score group also had a significantly better prognosis than those in the low TII score group (log‐rank test P value = 2.035e‐03; Figure 12B). Immune checkpoint blockade therapy has achieved remarkable results in cancer therapy, especially in advanced‐stage patients, although it not effective for all patients. The utility of the TII score was further explored to investigate the benefit of immunotherapy for patients. Therefore, the patients who received the anti‐PD‐L1 immunotherapy in the IMvigor210 cohort were assigned low TII scores or high TII scores. The KM survival curve analysis result indicated that patients in the high TII score group had a better survival rate than those in the low TII score group (Figure 12C). In addition, the response rate of anti‐PD‐L1 immunotherapy in the high TII score group was high in the low TII score group (Figure 12D).
FIGURE 12.
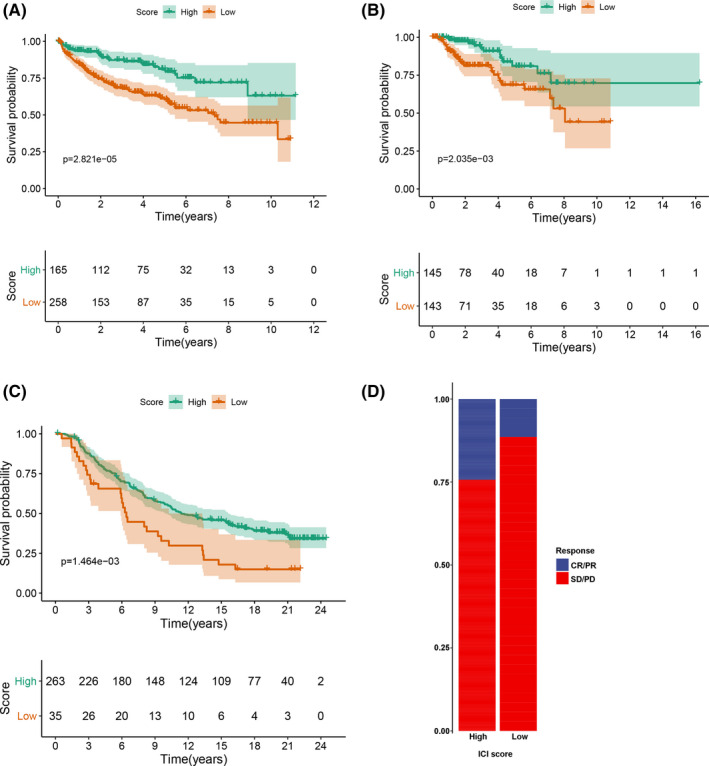
Validation of the tumor immune infiltration (TII) score. (A) KM survival curve analysis of tumor immune infiltration (TII) score group in the disease‐free survival dataset. (B) KM survival curve analysis of the TII score group in the papillary renal cell carcinoma dataset. (C) KM survival curve analysis of TII score group in the IMvigor210 dataset. (D) Rate of clinical response (CR/PR and SD/PD) in TII score groups in the IMvigor210 cohort
4. DISCUSSION
The application of immunotherapy for ccRCC, such as use of PD‐L1/PD‐1 inhibitors, has achieved significant progress. 24 Nivolumab (a PD‐1 immune checkpoint antibody) has demonstrated its efficacy in advanced renal cell carcinoma and was approved by the Food and Drug Administration in the 2015. 25 Moreover, in Motzer et al, combined immunotherapy with nivolumab plus ipilimumab led to a higher objective response rate and longer progression‐free survival when compared with sunitinib in intermediate‐risk and poor‐risk patients with previously untreated advanced‐stage RCC cases. 26 However, it is worth noting that the individual variation at the genetic level resulted in only a minority of patients benefiting from the curative effect; outcomes for other patients were unsatisfactory. In the present study, we applied multiple algorithms to quantify the tumor immune infiltration of ccRCC. This study demonstrated that the TII score is an effective and independent biomarker for the survival of ccRCC and is a predictive indicator in evaluating the response to immunotherapy.
Numerous studies have revealed that immune cell function disorders will lead to immunosuppression and promote tumor progression and escape. 27 , 28 Therefore, it is necessary to analyze the intrinsic correlation of TME and the survival of patients. In this study, we used the ssGSEA algorithm to quantify 29 immune signature infiltration levels and further classified into five distinct groups using the consensus clustering algorithm. Interestingly, we found that the infiltration level exhibited different expression patterns in subgroups; subgroup C3 had the highest immune infiltration level, while subgroup C2 had the lowest immune infiltration level. To the best of our knowledge, this is the first attempt in ccRCC patients to use the ssGSEA algorithm to quantify the 29 immune signatures and to classify the tumor infiltration level through the consensus clustering algorithm. Subgroups C1 and C4 had a better survival outcome compared to subgroups C2, C3, and C5. We thus categorized patients into a better prognosis group and a poor prognosis group, and the results revealed a significant difference in survival between the two groups.
Furthermore, in this study, the mRNA transcriptome difference between the two prognosis groups proved to be significantly associated with the immune‐related pathway. These deferentially expression genes were assumed to be TII‐related signature genes. By using the same consensus clustering methods, three distinct genomic clusters were identified, which showed a significant correlation with the immune infiltration level. Similar to previous studies, the lower immune score and stromal score cluster (gene cluster C) was associated with a better survival outcome, indicating that the gene cluster has the potential to promote the development of more precise immunotherapy.
Considering the individual heterogeneity of TME, quantification of the TII modification patterns of individual tumors is urgently needed. The individual‐based model originated from subgroup biomarkers has been well constructed in gastric cancer and head and neck squamous cell carcinoma to increase the accuracy of survival prediction. 7 In our study, we identified a “subgroup biomarker” and constructed a TII score to quantify the immune infiltration through a consensus clustering algorithm and differential expression analysis. Through survival analysis, we discovered that the high TII score was associated with a better prognosis than low TII scores, which was further validated in the DFS and pRCC dataset. The impact of TME on the survival of patients is well documented in the previous research. The TII score also can serve as an independent predictor for OS and DFS in ccRCC patients by performing multivariate Cox regression analysis. The GSEA analysis result revealed that the genes in the high TII score group were enriched in immunosuppressive pathways, such as the ERBB signaling pathway, the MAKP signaling pathway, the MTOR signaling pathway, and the TGF BETA signaling pathway. 29 Previous research demonstrated that CD4+ T cells can differentiate into opposite functions of subsets, including CD8+ T cell activation, and NK cell killing, recognition of cancer antigens, and promoting CD8+ T cells in tumor immune responses. In the current study, we also evaluated the relationship between TII scores and TII patterns. Most of immune cells, such as B cells CD8+ T cell, Tfh cells, T helper cells, Th1 cells, and Th2 cells, had a higher level in the low TII score group than high TII score group. Therefore, the anti‐tumor impact of the high infiltration level of T cells is offset by the strong immunosuppressive pathway activated by overexpressed immune checkpoint genes. 30 Sorafenib, sunitinib, cisplatin, gefitinib, vinblastine, vinorelbine, vorinostat, and gemcitabine have been widely applied in cancer chemotherapy and have achieved some progress, especially sorafenib and sunitinib, which have been approved by the US Food and Drug Administration for treatment of RCC. 31 Here, we assessed the sensitivity of eight chemo drugs using the TII score. We found that the patients in the high TII score group could benefit significantly from sunitinib, cisplatin, and vinblastine. In addition, using the CMap database, we demonstrated 73 compounds with 51 MOA. These compounds include the HDAC inhibitor (vorinostat, scriptaid, and depudecin), the ATPase inhibitor (thapsigargin and digitoxigenin), the EGFR inhibitor (4,5‐dianilinophthalimide, butein), the immunosuppressant (mercaptopurine), the PARP inhibitor (NU‐1025), and the PPAR receptor agonist (clofibrate). We also identified other candidate compounds that might have an impact in the implementation of targeting TII score‐related treatments for ccRCC patients. The tumor mutational burden (TMB) was considered to be an effective and independent predictor of immunotherapy response. Therefore, we analyzed the relationship between TMB and the TII score. We demonstrated that there is no association between TMB and TII score (Cor = 0.090, P value = 0.112). The stratified survival analysis indicated that the prognostic value of the TII score was independent of TMB in ccRCC.
Considering the lower correlation between the TII score and TMB, individual predictive values and the GSEA outcome of TII scores, we inferred that the TII score and TMB represent distinct aspects of tumor immunobiology and can predict patient response to immunotherapy independently of TMB. Ultimately, we assessed the benefit that patients received from immunotherapy in the IMvigor210 dataset and found that the high TII score was elevated in ccRCC patients responding to immunotherapy, which validated its prognostic value. Overall, this indicates that immunotherapy might be beneficial for ccRCC patients with high TII scores.
In conclusion, we comprehensively investigated the TII landscape of ccRCC patients, which may contribute to enhancing our knowledge of the TME infiltrating characterization and assist in guiding more effective immunotherapy strategies. Moreover, the construction of the TII score can be used to effectively and independently predict the OS and DFS of ccRCC patients. Future studies should focus on the potential compounds from our results and validate our research findings.
DISCLOSURE
The authors declare that they have no conflict of interests.
Supporting information
Supplementary Material
ACKNOWLEDGMENTS
This work was supported by the Science Technology and Innovation Commission of Shenzhen Municipality (20205354), Natural Science Foundation of Zhejiang Province (LGF19H200005), Natural Science Foundation of China (81601553), and the Japan China Medical Association (国卫‐2018920). The Frontiers Science Center for Flexible Electronics (FSCFE) is acknowledged for providing space, computational facilities, and services.
Bai D, Feng H, Yang J, Yin A, Qian A, Sugiyama H. Landscape of immune cell infiltration in clear cell renal cell carcinoma to aid immunotherapy. Cancer Sci. 2021;112:2126–2139. 10.1111/cas.14887
Contributor Information
Dan Bai, Email: danbai@xjtu.edu.cn.
Hiroshi Sugiyama, Email: sugiyama.hiroshi.3s@kyoto-u.ac.jp.
REFERENCES
- 1. Gulati S, Vaishampayan U. Current state of systemic therapies for advanced renal cell carcinoma. Curr Oncol Rep. 2020;22:26. [DOI] [PubMed] [Google Scholar]
- 2. Frew I, Moch H. A clearer view of the molecular complexity of clear cell renal cell carcinoma. Annu Rev Pathol. 2014;10:263‐289. [DOI] [PubMed] [Google Scholar]
- 3. Hsieh J, Purdue M, Signoretti S, et al. Renal cell carcinoma. Nat Rev Dis Primers. 2017;3:17009. [DOI] [PMC free article] [PubMed] [Google Scholar]
- 4. Antonelli A, Cozzoli A, Zani D, et al. The follow‐up management of non‐metastatic renal cell carcinoma: definition of a surveillance protocol. BJU Int. 2007;99:296‐300. [DOI] [PubMed] [Google Scholar]
- 5. Bruijn R, Mulders P, Jewett M, et al. Surgical safety of cytoreductive nephrectomy following sunitinib: results from the multicentre, randomised controlled trial of immediate versus deferred nephrectomy (SURTIME). Eur Urol. 2019;76:437‐440. [DOI] [PubMed] [Google Scholar]
- 6. Zhou J, Wang T, Qiu T, et al. Ubiquitin‐specific protease‐44 inhibits the proliferation and migration of cells via inhibition of JNK pathway in clear cell renal cell carcinoma. BMC Cancer. 2020;20:214. [DOI] [PMC free article] [PubMed] [Google Scholar]
- 7. Zhang X, Chen T, Zhang B. Characterization of the immune cell infiltration landscape in head and neck squamous cell carcinoma to aid immunotherapy. Mol Ther Nucleic Acids. 2020;22:298‐309. [DOI] [PMC free article] [PubMed] [Google Scholar]
- 8. Vesely M, Kershaw M. Natural innate and adaptive immunity to cancer. Annu Rev Immunol. 2010;29:235‐271. [DOI] [PubMed] [Google Scholar]
- 9. Wang Y, Xu L, Lu X, et al. CD4+ T cells promote renal cell carcinoma proliferation via modulating YBX1. Exp Cell Res. 2018;363:95‐101. [DOI] [PubMed] [Google Scholar]
- 10. Speiser D, Ho P‐C, Verdeil G. Regulatory circuits of T cell function in cancer. Nat Rev Immunol. 2016;16:599‐611. [DOI] [PubMed] [Google Scholar]
- 11. Wherry EJ, Kurachi M. Molecular and cellular insights into T cell exhaustion. Nat Rev Immunol. 2015;15:486‐499. [DOI] [PMC free article] [PubMed] [Google Scholar]
- 12. Santagata S, Napolitano M, D'Alterio C, et al. Targeting CXCR4 reverts the suppressive activity of T‐regulatory cells in renal cancer. Oncotarget. 2017;8:77110‐77120. [DOI] [PMC free article] [PubMed] [Google Scholar]
- 13. Sica A, Larghi P, Mancino A, et al. Macrophage polarization in tumour progression. Semin Cancer Biol. 2008;18:349‐355. [DOI] [PubMed] [Google Scholar]
- 14. Quatromoni J, Eruslanov E. Tumor‐associated macrophages: function, phenotype, and link to prognosis in human lung cancer. Am J Transl Res. 2012;4:376‐389. [PMC free article] [PubMed] [Google Scholar]
- 15. Motoshima T, Miura Y, Wakigami N, et al. Phenotypical change of tumor‐associated macrophages in metastatic lesions of clear cell renal cell carcinoma. Med Mol Morphol. 2018;51:57‐63. [DOI] [PubMed] [Google Scholar]
- 16. Wilkerson M, Hayes D. ConsensusClusterPlus: a class discovery tool with confidence assessments and item tracking. Bioinformatics. 2010;26:1572‐1573. [DOI] [PMC free article] [PubMed] [Google Scholar]
- 17. Ritchie M, Phipson B, Wu D, et al. LIMMA powers differential expression analyses for RNA‐sequencing and microarray studies. Nucleic Acids Res. 2015;43:e47. [DOI] [PMC free article] [PubMed] [Google Scholar]
- 18. Yu G, Wang L‐G, Han Y, He Q‐Y. clusterProfiler: an R package for comparing biological themes among gene clusters. OMICS. 2012;16:284‐287. [DOI] [PMC free article] [PubMed] [Google Scholar]
- 19. Yang W, Lightfoot H, Bignell G, et al. Genomics of drug sensitivity in cancer (GDSC): a resource for biomarker discovery in cancer cells. Eur J Cancer. 2016;69:S82. [DOI] [PMC free article] [PubMed] [Google Scholar]
- 20. Soltan Ghoraie L, Zhang S‐D, Glazko G, et al. A review of connectivity map and computational approaches in pharmacogenomics. Brief Bioinform. 2017;18:903. [DOI] [PMC free article] [PubMed] [Google Scholar]
- 21. Luo J, Xie Y, Zheng Y, et al. Comprehensive insights on pivotal prognostic signature involved in clear cell renal cell carcinoma microenvironment using the ESTIMATE algorithm. Cancer Med. 2020;9:4310‐4323. [DOI] [PMC free article] [PubMed] [Google Scholar]
- 22. Ren S, Wang W, Shen H, et al. Development and validation of a clinical prognostic model based on immune‐related genes expressed in clear cell renal cell carcinoma. Front Oncol. 2020;10:1496. [DOI] [PMC free article] [PubMed] [Google Scholar]
- 23. Wu Z, Shen Y, Fan D, et al. A novel prognostic model based on immunogenomics for clear cell renal cell carcinoma. Int Immunopharmacol. 2021;90:107119. [DOI] [PubMed] [Google Scholar]
- 24. Santoni M, Massari F, Nunno V, et al. Immunotherapy in renal cell carcinoma: latest evidence and clinical implications. Drugs Context. 2018;7:1‐8. [DOI] [PMC free article] [PubMed] [Google Scholar]
- 25. Anastasia S, Audrey ML, Jennifer A, et al. Pericardial effusion under nivolumab: case‐reports and review of the literature. J Immunother Cancer. 2019;7:266. [DOI] [PMC free article] [PubMed] [Google Scholar]
- 26. Motzer R, Tannir N, McDermott D, et al. Nivolumab plus ipilimumab versus sunitinib in advanced renal‐cell carcinoma. N Engl J Med. 2018;378:1277‐1290. [DOI] [PMC free article] [PubMed] [Google Scholar]
- 27. Elpek K, Cremasco V, Shen H, et al. The tumor microenvironment shapes lineage, transcriptional, and functional diversity of infiltrating myeloid cells. Cancer Immunol Res. 2014;2:655‐667. [DOI] [PMC free article] [PubMed] [Google Scholar]
- 28. Kitamura T, Qian B, Pollard J. Immune cell promotion of metastasis. Nat Rev Immunol. 2015;15:73‐86. [DOI] [PMC free article] [PubMed] [Google Scholar]
- 29. Zhang B, Wu Q, Li B, Wang D, Wang L, Zhou Y. m6A regulator‐mediated methylation modification patterns and tumor microenvironment infiltration characterization in gastric cancer. Mol Cancer. 2020;19:53. [DOI] [PMC free article] [PubMed] [Google Scholar]
- 30. Matsushita H, Sato Y, Karasaki T, et al. Neoantigen load, antigen presentation machinery, and immune signatures determine prognosis in clear cell renal cell carcinoma. Cancer Immunol Res. 2016;4:463‐471. [DOI] [PubMed] [Google Scholar]
- 31. Bellmunt J, Guix M. The medical management of metastatic renal cell carcinoma: integrating new guidelines and recommendations. BJU Int. 2009;103:572‐577. [DOI] [PubMed] [Google Scholar]
Associated Data
This section collects any data citations, data availability statements, or supplementary materials included in this article.
Supplementary Materials
Supplementary Material


