

Abstract
Metastasis is a major obstacle to better prognosis in patients with hepatocellular carcinoma (HCC). Mesenchymal‐epithelial transition (MET) is the driving force for metastatic colonization in which E‐cadherin re‐expression is a critical procedure. It has been reported that the loss of paired‐related homeobox transcription factor 1 (PRRX1) is required for cancer cell metastasis. However, the role of PRRX1 in MET and how its downregulation triggers E‐cadherin re‐expression are unknown. In this study, we performed a systematic, mechanistic study regarding the role of PRRX1 in MET of HCC. We observed PRRX1 downregulation in HCC tissues, which correlated with early metastasis and short overall survival. Overexpression of PRRX1 induced epithelial‐mesenchymal transition (EMT), but did not promote metastasis formation, while knockdown of PRRX1 promoted metastasis and colonization of circulating HCC cells as shown in animal model. PRRX1 protein levels reversely correlated with E‐cadherin levels in HCC cell lines. PRRX1 knockdown promoted E‐cadherin re‐expression and cell proliferation and inhibited cell invasion and migration. The microarray results showed that PRRX1 deficiency regulated extracellular matrix (ECM) interaction, focal adhesion, TGF‐β signaling and cancer pathways. PRRX1 knockdown upregulated paired‐like homeodomain 2 (PITX2) and inhibited catenin beta 1 (CTNNB1) and SNAIL family zinc finger 2 (SLUG). Silencing of PITX2 reversed CTNNB1 and SLUG inhibition and E‐cadherin re‐expression. PITX2 upregulation increased miR‐200a and miR‐200b/429, which further inhibited the transcription of CTNNB1 and SLUG, respectively, thus abrogating the inhibitory effect on E‐cadherin. In conclusion, our data showed that the downregulation of PRRX1 induced E‐cadherin re‐expression through PITX2/miR‐200a/CTNNB1 and PITX2/miR‐200b/429/SLUG pathway.
Keywords: E‐cadherin re‐expression, hepatocellular carcinoma, mesenchymal‐epithelial transition, PITX2, PRRX1
PRRX1 deficiency upregulated PITX2‐miR‐200a and PITX2‐miR‐200b/429, which further inhibited the transcription of CTNNB1 and SLUG, respectively, leading to abrogation of the inhibitory effect on E‐cadherin.

Abbreviations
- AFP
α‐fetoprotein
- CDH1
E‐cadherin 1
- CDK2
cyclin‐dependent kinase 2
- COL3A1
collagen type III alpha 1 chain
- CTNNB1
catenin beta 1
- DFS
disease‐free survival
- EMT
epithelial‐mesenchymal transition
- GAPDH
glyceraldehyde‐3‐phosphate dehydrogenase
- H&E
hematoxylin & eosin
- HCC
hepatocellular carcinoma
- IHC
immunohistochemistry
- LAMB1
laminin subunit beta 1
- MET
mesenchymal‐epithelial transition
- OS
overall survival
- PITX2
paired‐like homeodomain transcription factor 2
- PRRX1
paired‐related homeobox transcription factor 1
- SLUG
SNAIL family zinc finger 2
- SMAD6
SMAD family member 6
- TF
transcription factor
- TGFBR2
transforming growth factor beta receptor 2
- UTR
untranslated region
- WB
Western blotting
1. INTRODUCTION
Metastasis is the major obstacle to better prognosis in patients with cancer. The formation of metastasis can be organized into two major processes: the dissemination of cancer cells from the original sites and metastatic colonization to distant organs. 1 For distant metastasis to occur, cancer cells undergo EMT to gain invasion and migration capacities. During EMT, epithelial cancer cells lose their cell‐cell adhesion structures. E‐cadherin downregulation of epithelial cells is considered a hallmark of EMT. In addition, their basal‐apical polarity is modulated, and their cytoskeleton is rearranged, resulting in the formation of migratory mesenchymal cells with invasive properties. 2 , 3 The mesenchymal cancer cells then invade adjacent tissues, enter the microvasculature of the lymph and blood systems, and colonize lymph nodes and distant organs. However, clinical observations have shown that most metastases exhibit a differentiated epithelial morphology. 4 , 5
According to the theory by Brabletsz et al, in the MET‐dependent pathway of metastatic progression, mesenchymal cells must go through MET to restore the epithelial phenotype to form a typical well‐differentiated metastasis. 6 , 7 , 8 MET is the driving force for metastatic colonization in some cancers. 7 , 9 In metastasis, re‐expression of E‐cadherin is observed in many cancer types. 10 The research by Hugo et al in human breast cancer cells demonstrated that E‐cadherin expression promoted the formation of metastases of breast cancer, supporting the theory that MET is involved in metastasis. 11
The EMT inducer PRRX1 was reported to induce EMT and confer cancer cells with migratory and invasive properties. 6 PRRX1 was first discovered to be expressed in a mesodermally restricted pattern in embryos and was involved in modulating developmental morphogenetic processes. 12 During embryogenesis, PRRX1 played a vital role in the development of the cardiovascular system and the formation of preskeletal condensations. 13 , 14 In tumor progression, PRRX1 was a novel EMT inducer essential for the acquisition of invasive properties. 6 PRRX1 enhanced the mesenchymal phenotype of many cancer cells. 15 , 16 , 17 , 18 , 19 PRRX1 inhibition was taken as critical in converting mesenchymal cells to epithelial phenotypes. 6 , 20 Loss of PRRX1 initiates MET and endows cancer cells with stem cell properties that are required for metastatic formation. 6 However, the mechanism underlying PRRX1‐deficiency–induced MET in cancer cells has not been reported. The regulatory network between PRRX1 deficiency and E‐cadherin re‐expression is missing to date.
In the current study, we investigated the role of PRRX1 downregulation in triggering MET in HCC cells and focused on clarifying the mechanisms of how PRRX1 deficiency regulated E‐cadherin re‐expression.
2. MATERIALS AND METHODS
2.1. Cell culture and reagents
Huh7 and HepG2 were obtained from the cell bank of the Shanghai Institute of Biological Sciences. SMMC‐7721 cells were purchased from the cell bank of Xiangya Central Laboratory. MHCC‐97L, MHCC‐97H, and HCCLM3 cells were gifts from the Liver Cancer Institute, Zhongshan Hospital. Cell lines were maintained in DMEM (Gibco) supplemented with 10% FBS (Gibco) and cultured at 37°C with 5% CO2. PRRX1 (HPA051084) and PITX2 (HPA050074) antibodies were purchased from Sigma Aldrich. E‐cadherin (3195), cyclin D1 (2922), CDK2 (2546), CDK4 (12790), CDK6 (13331), P‐Smad2 (3104), P‐Smad3 (9520), slug (9585), and β‐catenin (8480) antibodies were purchased from Cell Signaling Technology. GAPDH antibody (AB22131) was obtained from Bioworld.
2.2. Human HCC samples
HCC tissues and peritumoral tissues were collected from HCC patients undergoing curative resection from 2005 to 2014 at our hospital. Our study was approved by the Ethics Committee of the Affiliated Drum Tower Hospital of Nanjing University Medical School and conformed to the provisions of the Declaration of Helsinki. Written informed consent was obtained.
2.3. Animal model
Four‐week‐old male BALB/C‐nu/nu mice were purchased from the Model Animal Research Center of Nanjing University. In the primary liver tumor model, 1 × 10⁶ HCC cells in 60 μL PBS were injected into the livers. The livers and lungs were harvested 8 weeks post injection. In the colonization model, 5 × 10⁶ HCC cells in 80 μL PBS were injected through the tail veins, and the lungs were harvested. This study was approved by the Ethics Committee of our hospital.
2.4. PRRX1 knockdown
HCC cells with PRRX1 knockdown were generated by transfection with lentivirus carrying shRNA targeting PRRX1 synthesized by GeneChem. HCC cells transfected with lentivirus carrying nontargeting shRNA were used as control.
2.5. Ectopic PRRX1 overexpression
The pEGFP‐PRRX1α cDNA and pEGFP‐PRRX1β cDNA GV18 lentiviral vectors with Ubi‐MCS‐EGFP‐IRES‐puromycin elements were purchased from GeneChem. HCC cells transfected with lentivirus carrying a control vector were used as a control.
2.6. Microarray
The mRNA from three pairs of control and PRRX1 knockdown cells was harvested and hybridized to GeneChip microarray (Affymetrix, Thermo Fisher Scientific). The microarray data have been deposited in the Gene Expression Omnibus database with the accession no. GSE148851.
2.7. WB
WB was conducted as previous reported. 21 The signals were developed by an ECL system (Merck Millipore) and captured by a Tanon 5200 Chemiluminescent Imaging System.
2.8. RT‐qPCR
Total RNA was extracted and determined by RT‐qPCR as previously reported. 21 GAPDH was set as the internal control. Primer sequences are presented in Table S1.
2.9. MicroRNA extraction and qPCR
The miRNAs were extracted with the QIAGEN miRNeasy Mini Kit (QIAGEN) and reverse‐transcribed using PrimeScript™ RT Master Mix (Takara Bio Inc). The primers for reverse transcription are presented in Table S2. RT‐qPCR was performed with the SYBR® Premix Ex Taq™ PCR kit (Takara) with U6 as the internal control. Specific primers are presented in Table S3.
2.10. IHC
IHC was performed following published protocols. 21 The staining scores were calculated by combining the quantity score with the staining intensity score. The quantity score ranges from 0 to 4: 0, no immunostaining; 1, 1‐10% of cells are positive; 2, 11‐50%; 3, 51‐80%; and 4, ≥81%. The staining intensity was scored as 0 (negative), 1 (weak), 2 (moderate), and 3 (strong).
2.11. Immunofluorescence
Cells seeded on round coverslips were fixed with 4% formaldehyde, permeabilized with 0.2% Triton X‐100 and blocked in 1% BSA. After incubation with primary antibody at 4°C overnight, they were incubated with FITC‐conjugated goat anti‐rabbit IgG (Zenon® Alexa Fluor® 546 Rabbit IgG Labeling Kit, Thermo Fisher Scientific). Finally, the cells were washed and incubated with DAPI (Thermo Fisher Scientific) for 5 minutes at room temperature. Images were captured using a fluorescence confocal microscope (500 IX71, Olympus).
2.12. Transwell assay
A transwell assay was conducted as previously reported. 22 The cells were stained with crystal violet, photographed, and counted.
2.13. Wound healing assay
A wound healing assay with culture inserts (Ibidi) was conducted as previously reported. 22 The images were captured under a microscope.
2.14. Colony formation
Briefly, 5 × 10² cells were seeded in a six‐well plate and cultivated for 4 weeks. Then, cells were fixed with methanol and stained with crystal violet for 5 minutes. Cell colonies were counted.
2.15. H&E staining
Sections (5 µm thick) were stained with H&E following published protocols 21 and photographed.
2.16. Small interfering RNA transfection
The human PITX2 siRNA was synthetized by GenePharm with the sequences: sense (5′‐3′): CAGCCUGAAUAACUUGAACTT, antisense (5′‐3′): GUUCAAGUUAUUCAGGCUGTT. Transfection was conducted using Lipofectamine® RNAiMAX (Thermo Fisher Scientific).
2.17. Transfection of miRNA inhibitors and mimics
The inhibitors and mimics for miR‐200a, miR‐200b, and miR‐429 were obtained from RiboBio and transfected using Lipofectamine 3000 (Thermo Fisher Scientific).
2.18. Luciferase reporter assay
SLUG and SLUG‐Mut 3′UTR were amplified and cloned into the GV272 vector with an SV40‐Luc‐MCS element and Xbal/Xbal restriction site (GeneChem). Pre‐miRNAs and DNA plasmids were cotransfected using Lipofectamine 3000. Luciferase activity was measured 24 hours after transfection using a Firefly Luciferase Reporter Gene Assay Kit (Beyotime).
2.19. Statistics
Statistical analyses were performed with SPSS 18.0 software. WB, qPCR, transwell, and wound healing assay were repeated three times. All the data were presented as the means ± SD. The continuous variables were analyzed using Student's t‐test and two‐way ANOVA with Bonferroni correction. Variance was similar between the groups that are being statistically compared. Kaplan‐Meier plots of the DFS and OS curves were created using log‐rank tests. P‐value < .05 was considered statistically significant.
3. RESULTS
3.1. PRRX1 was downregulated in HCC and correlated with poor prognosis
We first detected PRRX1 in 10 pairs of normal liver tissue, peritumoral and tumoral tissues from HCC patients, and found PRRX1 decreased in tumoral tissues in six cases (case 1, 4, 5, 6, 8, and 10) (Figure 1A). Then, we analyzed PRRX1 in 221 pairs of HCC tumoral and peritumoral tissues by IHC. Demographic data are listed in Table S4. PRRX1 was found downregulated in tumor tissues after comparing the IHC staining scores (Figure 1B). The IHC revealed PRRX1 deficiency in tumoral tissues compared with peritumor tissues (Figure 1C). Based on the relative staining intensity of PRRX1 in tumoral and peritumor tissues, patients were divided into two groups: PRRX1 low (n = 152) and PRRX1 high (n = 69). Univariate analysis revealed that AFP (≥200 ng/mL), maximum tumor size (≥5 cm), microvascular invasion, macrovascular invasion, TNM stage (III‐IV), Barcelona Clinic Liver Cancer (BCLC) stage (B‐C), and PRRX1 downregulation were correlated with shorter DFS and OS (Table 1). Multivariate analysis showed that microvascular invasion and PRRX1 downregulation were correlated with shorter DFS and OS (Table 2). Kaplan‐Meier plots demonstrated a statistical correlation between PRRX1 downregulation and shorter DFS and OS (Figure 1D,E), indicating that PRRX1 deficiency predicted poor prognosis in HCC.
FIGURE 1.
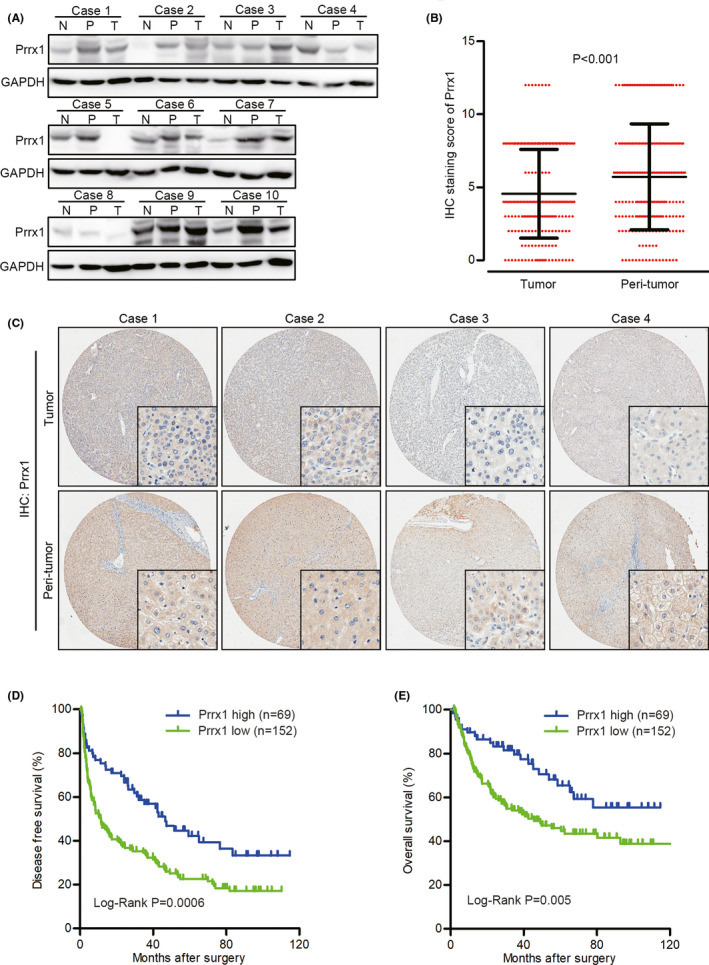
Paired‐related homeobox transcription factor 1 (PRRX1) was down‐regulated in hepatocellular carcinoma (HCC) and correlated with poor prognosis. A, Western blotting (WB) results of Prrx1 in 10 pairs of normal (N) liver tissue and peritumoral (P) and tumoral (T) tissues. B, Quantification and comparison of immunohistochemistry (IHC) staining scores of PRRX1 in 221 pairs of HCC tumor and peritumor tissues. C, Representative images of IHC staining of Prrx1 in peritumoral and tumoral tissues. D and E, Kaplan‐Meier plot of the disease‐free survival (DFS) and overall survival (OS) of patients with HCC, stratified by PRRX1 levels
TABLE 1.
Univariate analysis of the risk factors for DFS and OS in HCC
| Variable | DFS | OS | |||
|---|---|---|---|---|---|
| HR (95% CI) | P | HR (95% CI) | P | ||
| Age | |||||
| >50 | 140 | 1.299 (0.827‐2.039) | .256 | 0.778 (0.521‐1.163) | .221 |
| ≤50 | 81 | ||||
| Sex | |||||
| Male | 187 | 0.777 (0.564‐1.071) | .123 | 1.165 (0.673‐2.017) | .585 |
| Female | 34 | ||||
| HBsAg | |||||
| Positive | 173 | 1.291 (0.863‐1.932) | .214 | 1.149 (0.705‐1.875) | .577 |
| Negative | 48 | ||||
| HCVAb | |||||
| Positive | 2 | 1.753 (0.433‐7.094) | .431 | 0.049 (0.000‐218.68) | .482 |
| Negative | 219 | ||||
| Cirrhosis | |||||
| Yes | 166 | 1.238 (0.782‐1.960) | .363 | 1.078 (0.613‐1.897) | .794 |
| No | 55 | ||||
| Portal hypertension | |||||
| Yes | 26 | 0.920 (0.581‐1.456) | .721 | 1.163 (0.681‐1.985) | .581 |
| No | 195 | ||||
| Child‐Pugh | |||||
| B | 12 | 0.891 (0.417‐1.901) | .765 | 1.814 (0.839‐3.922) | .13 |
| A | 209 | ||||
| AFP | |||||
| ≥200 ng/mL | 109 | 1.447 (1.058‐1.979) | .021 | 2.663 (1.770‐4.006) | <.001 |
| <200 ng/mL | 112 | ||||
| Maximum tumor size | |||||
| ≥5 cm | 133 | 1.426 (1.029‐1.975) | .033 | 1.947 (1.270‐2.984) | .002 |
| <5 cm | 88 | ||||
| Multiple tumors | |||||
| Yes | 57 | 1.262 (0.888‐1.792) | .194 | 1.506 (0.993‐2.284) | .054 |
| No | 164 | ||||
| Microvascular invasion | |||||
| Yes | 103 | 1.733 (1.263‐2.376) | .001 | 2.298 (1.534‐3.441) | <.001 |
| No | 118 | ||||
| Macrovascular Invasion | |||||
| Yes | 36 | 1.912 (1.279‐2.856) | .002 | 3.006 (1.912‐4.725) | <.001 |
| No | 185 | ||||
| Surgical margin | |||||
| ≥1 cm | 37 | 1.347 (0.895‐2.029) | .153 | 1.620 (0.991‐2.649) | .054 |
| <1 cm | 184 | ||||
| Differentiation | |||||
| Poor | 28 | 0.984 (0.609‐1.590) | .948 | 1.186 (0.695‐2.023) | .532 |
| Well‐moderate | 193 | ||||
| Portal occlusion | |||||
| Yes | 142 | 1.249 (0.893‐1.747) | .194 | 0.971 (0.647‐1.455) | .885 |
| No | 79 | ||||
| Blood transfusion | |||||
| Yes | 69 | 1.338 (0.962‐1.861) | .084 | 1.604 (1.071‐2.402) | .022 |
| No | 152 | ||||
| TNM stage | |||||
| III‐IV | 66 | 1.775 (1.277‐2.468) | .001 | 2.837 (1.912‐4.209) | <.001 |
| I‐II | 155 | ||||
| BCLC stage | |||||
| B‐C | 88 | 1.763 (1.288‐2.413) | <.001 | 3.210 (2.134‐4.829) | <.001 |
| A | 133 | ||||
| PRRX1 downregulation | |||||
| Yes | 152 | 1.867 (1.299‐2.685) | .001 | 1.946 (1.212‐3.124) | .006 |
| No | 69 | ||||
Abbreviations: AFP, α‐fetoprotein; BCLC, Barcelona Clinic Liver Cancer; CI, confidence interval; DFS, disease‐free survival; HBsAg, hepatitis B virus surface antigen; HCC, hepatocellular carcinoma; HCVAb, hepatitis C virus antibody; HR, hazard ratio; OS, overall survival; PRRX1, paired‐related homeobox transcription factor; TNM, tumor node metastasis. Statistically significant P values were shown in bold.
TABLE 2.
Multivariate analysis of the risk factors for DFS and OS in HCC
| Variable | DFS | OS | |||
|---|---|---|---|---|---|
| HR (95% CI) | P | HR (95% CI) | P | ||
| AFP | |||||
| ≥200 ng/mL | 109 | 1.122 (0.806‐1.561) | .495 | 1.945 (1.266‐2.989) | .002 |
| <200 ng/mL | 112 | ||||
| Maximum tumor size | |||||
| ≥5 cm | 133 | 1.099 (0.765‐1.578) | .610 | 1.220 (0.759‐1.961) | .410 |
| <5 cm | 88 | ||||
| Microvascular invasion | |||||
| Yes | 103 | 1.497 (1.051‐2.133) | .026 | 1.628 (1.025‐2.587) | .039 |
| No | 118 | ||||
| Macrovascular invasion | |||||
| Yes | 36 | 1.068 (0.629‐1.812) | .808 | 1.121 (0.608‐2.065) | .714 |
| No | 185 | ||||
| Blood transfusion | |||||
| Yes | 69 | — | — | 0.823 (0.517‐1.310) | .413 |
| No | 152 | ||||
| TNM stage | |||||
| III‐IV | 66 | 1.189 (0.719‐1.964) | .500 | 1.206 (0.681‐2.138) | .520 |
| I‐II | 155 | ||||
| BCLC stage | |||||
| B‐C | 88 | 1.351 (0.882‐2.069) | .166 | 2.201 (1.310‐3.700) | .003 |
| A | 133 | ||||
| PRRX1 downregulation | |||||
| Yes | 152 | 1.866 (1.290‐2.698) | .001 | 1.765 (1.082‐2.879) | .023 |
| No | 69 | ||||
Abbreviations: AFP, α‐fetoprotein; BCLC, Barcelona Clinic Liver Cancer; CI, confidence interval; DFS, disease‐free survival; HCC, hepatocellular carcinoma; HR, hazard ratio; OS, overall survival; PRRX1, paired‐related homeobox transcription factor; TNM, tumor node metastasis. Statistically significant P values were shown in bold.
3.2. Downregulation of PRRX1 promoted metastasis and colonization of circulating tumor cells
We firstly tried to find whether increased PRRX1 was involved in HCC metastasis. By incubating HCC cells with TGF‐β to induce EMT, we detected upregulated PRRX1 (Figure S1A,B). Then, after ectopic overexpression of PRRX1α and PRRX1β (verified in Figure S1C,D), we found the morphology of HepG2 cells changed to mesenchymal phenotype (Figure S1E). PRRX1 overexpression promoted cell invasion and migration and activated TGF‐β signaling (Figure S1F‐H). PRRX1 overexpression induced EMT in HCC cells; however, we did not detect metastasis in the animal model (data not shown).
To reveal the effects of decreased PRRX1 on HCC metastasis, PRRX1 was knocked down in HCCLM3 cells (Figure 2A,B). The in situ tumor model revealed larger tumor volumes after PRRX1 knockdown (Figure 2C). Also, more metastatic lung nodules were generated after PRRX1 knockdown (Figure 2D). Histology of the metastatic pulmonary nodules was confirmed by H&E staining (Figure 2E). In addition, two mice developed subcutaneous metastasis after PRRX1 knockdown (Figure 2F). To assess the capacity of metastatic colonization in vivo, HCCLM3 cells with PRRX1 knockdown were injected through the tail vein of nude mice. The mice injected with HCCLM3 cells with PRRX1 knockdown had a shorter OS than the control (Figure 2G). In addition, lung nodules were more common after PRRX1 knockdown (Figure 2H,I), indicating the promoting effect of PRRX1 downregulation on the formation of metastasis and colonization of circulating HCC cells.
FIGURE 2.
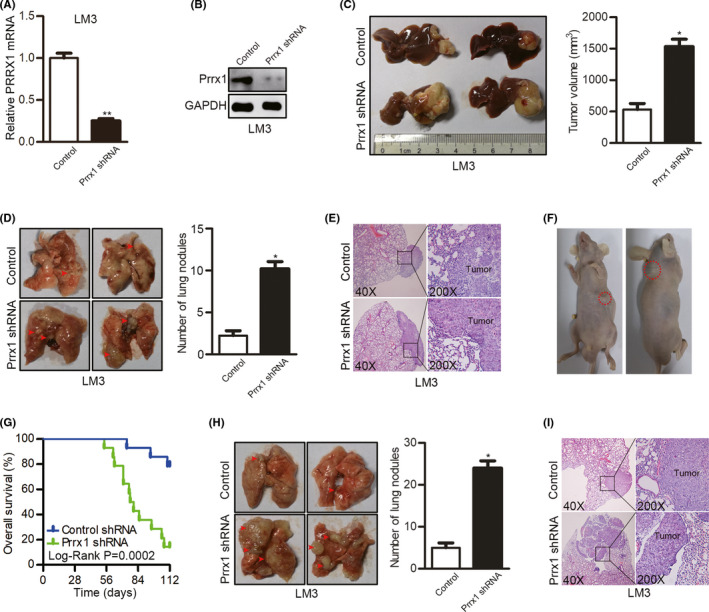
Downregulation of paired‐related homeobox transcription factor 1 (PRRX1) promoted metastasis and colonization of circulating tumor cells. A, The interfering efficiency was verified by qPCR after Prrx1 shRNA transfection in HCCLM3 cells. **P < .01. B, The interfering efficiency was verified by Western blotting (WB) after Prrx1 shRNA transfection in HCCLM3 cells. C, Comparison of the tumor volumes in the livers of nude mice injected with HCCLM3 cells transfected with control shRNA or PRRX1 shRNA using an in situ tumor model (n = 12 in each group). *P < .05. D, Representative images of metastatic lung nodules in the in situ liver tumor model. *P < .05. E. Representative images of lung tissue sections from the in situ liver tumor model. F. Two mice injected with HCCLM3 cells with PRRX1 knockdown developed subcutaneous metastasis in the in situ liver tumor model. G. Comparisons of overall survival (OS) curves in a lung metastatic colonization model of mice injected with HCCLM3 cells transfected with control shRNA or PRRX1 shRNA (n = 14 in each group). H, Comparison of pulmonary metastasis in the lung metastatic colonization model. *P < .05. I, Representative images of lung tissue sections from the metastatic colonization model
3.3. Downregulation of PRRX1 induced MET in HCC cells
To investigate the function of PRRX1 in mediating the phenotypic transformation, we first evaluated PRRX1 and E‐cadherin in HCC cell lines (Figure 3A) and analyzed their correlations. SMMC‐7721 was not involved in the analysis because no PRRX1 or E‐cadherin was detected. PRRX1 was reversely correlated with E‐cadherin protein in HCC cells (Person r = −.8949, P = .0403) (Figure 3B). To further revel their relations, we detected E‐cadherin after PRRX1 overexpression, and found decreased E‐cadherin (Figure 3C,D). In HCC cells with PRRX1 knockdown (confirmed in Figure S2A,B), E‐cadherin was re‐expressed, indicative of MET after PRRX1 inhibition (Figure 3E,F). Accordingly, we assayed the phenotypic changes after PRRX1 knockdown. We found inactivated β‐catenin pathway, as total β‐catenin was decreased (Figure 3G). PRRX1 downregulation inhibited invasion and migration, but enhanced cell proliferation (Figure 3H‐J). Cell cycle–related proteins increased after PRRX1 knockdown (Figure 3K). Moreover, the TGF‐β signaling was inhibited after PRRX1 knockdown (Figure S2C). These results suggested PRRX1 downregulation induced MET and promoted cell proliferation in HCC.
FIGURE 3.
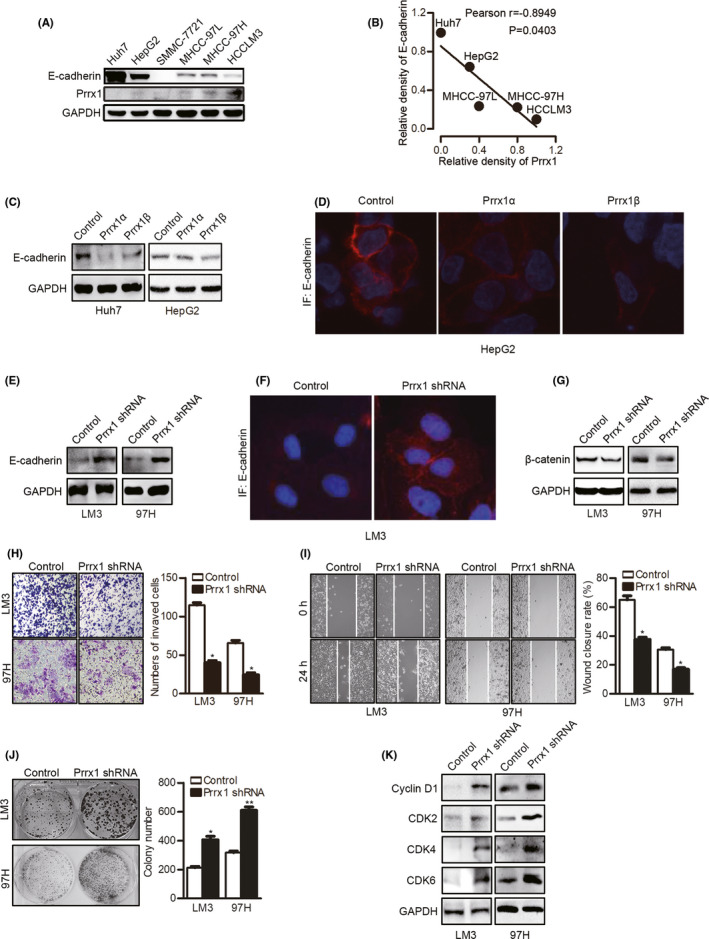
Downregulation of paired‐related homeobox transcription factor 1 (PRRX1) induced mesenchymal‐epithelial transition (MET) in hepatocellular carcinoma (HCC) cells. A, Western blotting (WB) results of E‐cadherin and PRRX1 in HCC cell lines. B, Correlation between the relative density of E‐cadherin and PRRX1 bands in HCC cell lines (Pearson r = −0.8949, P = .0403). C, WB results of E‐cadherin in HCC cells with Prrx1α or Prrx1β overexpression. D, Immunofluorescent staining of E‐cadherin in HepG2 cells with Prrx1α or Prrx1β overexpression. E, WB results of E‐cadherin in HCC cells with PRRX1 knockdown. F. Immunofluorescent staining of E‐cadherin in HCCLM3 cells with PRRX1 knockdown. G, WB results of β‐catenin in HCC cells with PRRX1 knockdown. H, Cell invasion was tested using transwell Matrigel invasion assays after PRRX1 knockdown in HCC cells. The quantitation of cell invasion is in the right panel. *P < .05. I, Cell migration was tested using wound healing assays after PRRX1 knockdown in HCC cells. The quantitation of cell migration is in the right panel. *P < .05. J, Cell proliferation was tested using a colony formation assay after PRRX1 knockdown. *P < .05, **P < .01. K, WB results of cyclin D1 and cyclin‐dependent kinases (CDKs) in HCC cells with PRRX1 knockdown
3.4. Downregulation of PRRX1 enriches MET‐related pathways
To further reveal the mechanism underlying PRRX downregulation–induced MET, we conducted a microarray (Figure 4A). The pathway enrichment analysis displayed the 10 most related pathways based on the KEGG and BIOCARTA databases. The top four were ECM interaction, focal adhesion, TGF‐β signaling, and cancer pathways (Figure 4B). The gene network plot based on the top four pathways is shown in Figure 4C. To test the significance of the expression profile data, eight genes (TGFBR2, SMAD6, SMAD1, and PITX2 [four genes from the TGF‐β signaling pathway]; CDH1, LAMB1, and COL3A1 [three genes from the ECM interaction pathway]; and SLUG [the only changed EMT TF]) were selected for independent qPCR assays, which showed reproducible expression changes (Figure 4D,E).
FIGURE 4.
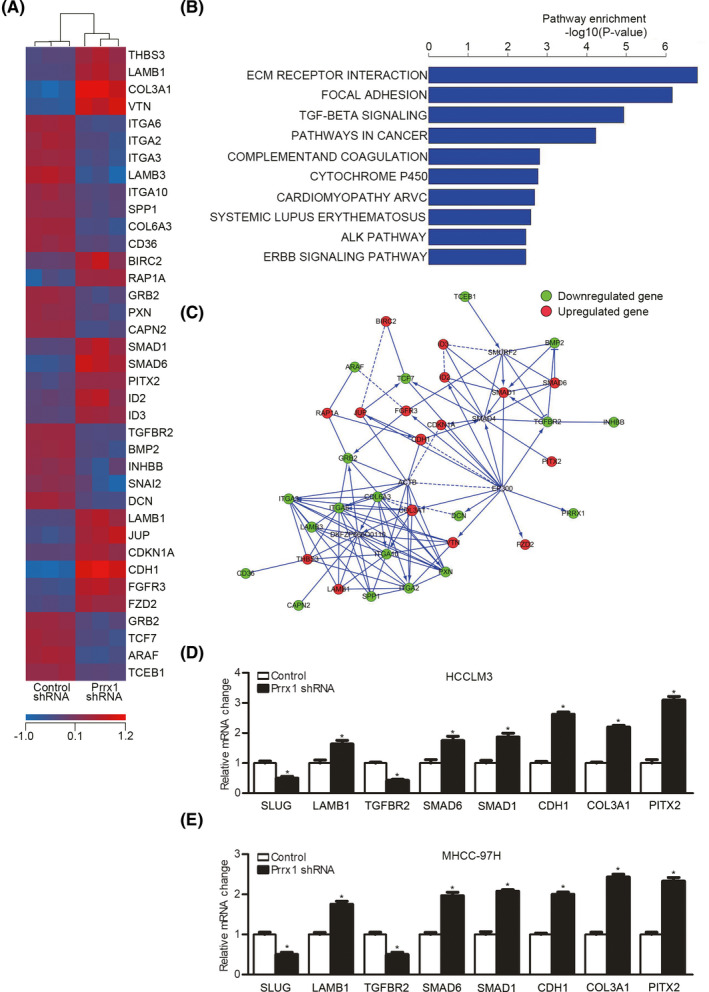
Downregulation of paired‐related homeobox transcription factor 1 (PRRX1) enriched mesenchymal‐epithelial transition (MET)‐related pathways. A, Heat map of the most differentially expressed genes between three pairs of control cells and HCCLM3 cells with PRRX1 knockdown. B, Ten most changed pathways between control cells and HCCLM3 cells with PRRX1 knockdown. C, The gene network plot based on the top four pathways. D and E, qPCR results for SNAIL family zinc finger 2 (SLUG), catenin beta 1 (CTNNB1), transforming growth factor beta receptor 2 (TGFBR2), SMAD family member 6 (SMAD6), SMAD family member 1 (SMAD1), E‐cadherin 1 (CDH1), collagen type III alpha 1 chain (COL3A1), and paired‐like homeodomain transcription factor 2 (PITX2) in HCC cells with PRRX1 knockdown. *P < .05
3.5. Inhibition of PITX2 reverses PRRX1 deficiency–induced decreases in SLUG and CTNNB1 and increase of E‐cadherin
The microarray results showed that PITX2 was upregulated after PRRX1 knockdown. PITX2 was a member of the bicoid‐related homeobox family with a vital role in converting mesenchymal cells to epithelial cells in dental cell development and differentiation 23 , 24 , 25 ; thus, it was reasonable to speculate that PITX2 upregulation might be a candidate that mediated PRRX1 deficiency–induced MET.
We first confirmed the correlation between PRRX1 and PITX2. PITX2 protein levels increased after PRRX1 knockdown (Figure 5A) but decreased after ectopic PRRX1 overexpression (Figure 5B). Furthermore, to determine whether PITX2 was responsible for MET, PITX2 siRNA was adopted. PITX2 inhibition reversed E‐cadherin re‐expression, which could be considered the reverse of MET. As E‐cadherin repression by EMT inducers was taken as a key event in EMT, 26 , 27 , 28 , 29 we speculated that E‐cadherin upregulation in MET might be caused by the removal of its repressors and deactivation of EMT pathways. Because SLUG was the only inducer found to be downregulated and β‐catenin signaling was inhibited after PRRX1 knockdown, we speculated that SLUG and CTNNB1 might be involved in PITX2‐induced MET. Thus, we measured SLUG and CTNNB1 after inhibiting PITX2. The results showed that PITX2 inhibition reversed the decreases in SLUG and CTNNB1 (Figure 5C‐E). PITX2 might act through suppressing SLUG and CTNNB1 and upregulating E‐cadherin.
FIGURE 5.
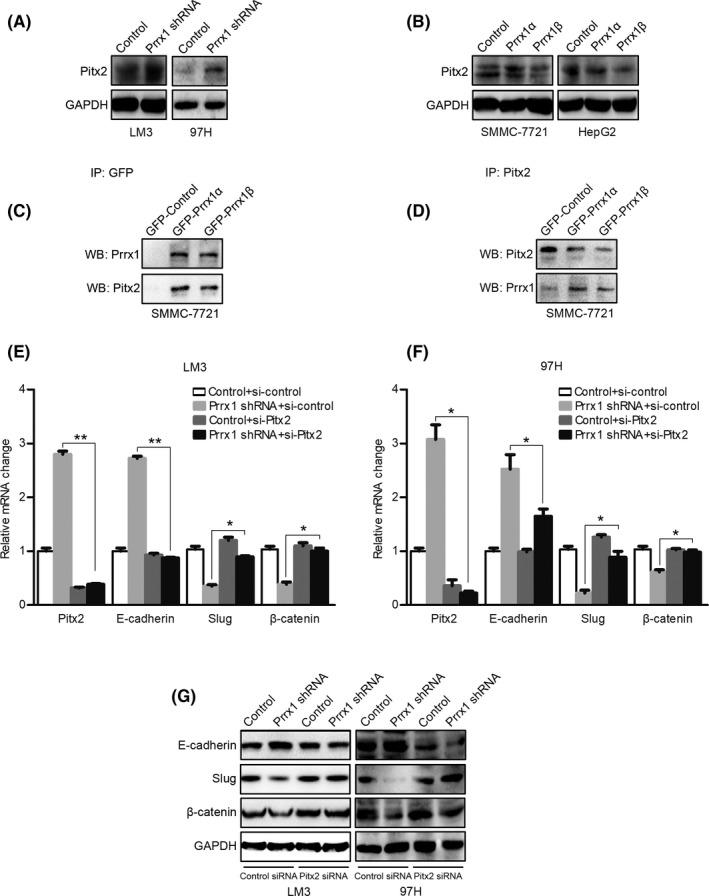
Inhibition of paired‐like homeodomain transcription factor 2 (PITX2) reverses paired‐related homeobox transcription factor 1 (PRRX1) deficiency–induced decreases in SNAIL family zinc finger 2 (SLUG) and catenin beta 1 (CTNNB1) and increase in E‐cadherin. A, Western blotting (WB) results of PITX2 in control cells and hepatocellular carcinoma (HCC) cells with PRRX1 knockdown. B, WB results of PITX2 in control HCC cells and HCC cells overexpressing PRRX1. C, GFP was immunoprecipitated with a GFP antibody and then analyzed by WB using a PITX2 antibody. D, PITX2 was immunoprecipitated with a PITX2 antibody and then analyzed by WB using a PRRX1 antibody. E and F, PITX2 in HCC cells transfected with control or PRRX1 shRNA was silenced by siRNA; then, PITX2, E‐cadherin, SLUG, and CTNNB1 mRNA levels were detected by qPCR. *P < .05, **P < .01. G, PITX2 in HCC cells transfected with control or PRRX1 shRNA was silenced by siRNA; then, E‐cadherin, SLUG, and β‐catenin protein levels were detected by WB
3.6. PITX2 upregulates miR‐200s, which suppresses CTNNB1 and SLUG expression
In the following experiments, we focused on the interactions between PITX2 and SLUG and CTNNB1. Evidence suggested that PITX2 functions through modulating miR‐200 family members during cell type conversion 23 , 25 ; thus, we detected the five miR‐200 members by qPCR. PRRX1 knockdown increased miR‐200a, miR‐200b, and miR‐429 which could be reversed by silencing PITX2 (Figure 6A,B). Then, we searched the miRNA.org database for the possible targets of these three miRNAs and found the 3′‐UTR of CTNNB1 was predicted to contain a conserved miR‐200a binding site, while the 3′‐UTR of SLUG was predicted to contain a miR‐200b and miR‐429 binding site (Figure 6C). Therefore, we further verified whether the predicted miR‐200 elements were functional.
FIGURE 6.
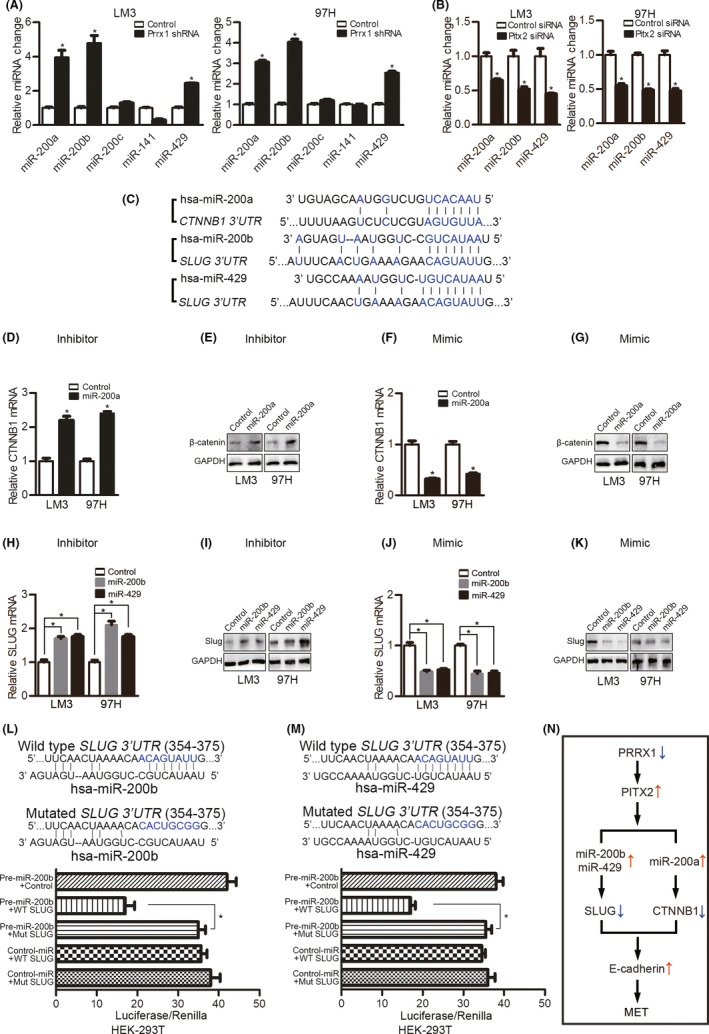
Paired‐like homeodomain transcription factor 2 (PITX2) upregulates miR‐200s, which suppress catenin beta 1 (CTNNB1) and SNAIL family zinc finger 2 (SLUG) expression. A, qPCR analyses of miR‐200 family members in hepatocellular carcinoma (HCC) cells with paired‐related homeobox transcription factor 1 (PRRX1) knockdown. *P < .05. B, PITX2 in HCC cells transfected with control or PRRX1 shRNA was silenced by siRNA; then, miR‐200 family members were detected by qPCR. *P < .05. C, miR‐200a target sites in the 3′‐UTR of CTNNB1 and miR‐200b/miR‐429 target sites in the 3′‐UTR of SLUG. D and E, HCCL cells with PRRX1 knockdown were transfected with a miR‐200a inhibitor; then, CTNNB1 was detected by qPCR and Western blotting (WB). *P < .05. F and G, HCC cells with PRRX1 knockdown were transfected with the miR‐200a mimic, and CTNNB1 was detected by qPCR and WB. H and I, HCC cells with PRRX1 knockdown were transfected with a miR‐200b or miR‐429 inhibitor, and SLUG was detected by qPCR and WB. J and K, HCC cells with PRRX1 knockdown were transfected with a miR‐200b or miR‐429 mimic, and SLUG was detected by qPCR and WB. L and M, Normalized luciferase activity of the 3′‐UTR SLUG gene luciferase reporter (wild‐type SLUG) with control miRNA or pre‐miR‐200a (L)/pre‐miR‐429 (M) shows a loss of luciferase activity upon the expression of miR‐200a and miR‐429. *P < .05. N, Diagram showing PRRX1 deficiency–induced mesenchymal‐epithelial transition (MET) in HCC
We found that miR‐200a inhibitors increased CTNNB1 (Figure 6D,E), while miR‐200a mimics inhibited CTNNB1 (Figure 6F,G). As functional miR‐200a regulation of CTNNB1 had been reported, 24 we did not further test the interactions. To determine whether miR‐200b and miR‐429 suppressed SLUG, inhibitors and mimics of miR‐200b and miR‐429 were used. The miR‐200b and miR‐429 inhibitors both upregulated SLUG (Figure 6H,I), while the mimics inhibited SLUG (Figure 6J,K). To determine whether the predicted miR‐200b element in the 3′‐UTR of SLUG was functional, we ligated this sequence downstream of the luciferase gene in the pGL3 plasmid and cotransfected the construct with a miR‐200b expression plasmid into HEK‐293T cells. The luciferase activity was lower in HEK‐293T cells cotransfected with miR‐200b than in cells transfected with the control vector. However, the mutation of the predicted miR‐200b binding site in SLUG abolished this suppression (Figure 6L). Similar results were observed for the regulation of SLUG by miR‐429 (Figure 6M).
4. DISCUSSION
The role of PRRX1 in predicting cancer prognosis is controversial. In colorectal cancer, high PRRX1 expression is correlated with poor prognosis, 15 which is in contrast to the findings in breast cancer and lung squamous cell carcinoma. 6 In HCC, we reported in the largest published set of clinically resected samples that PRRX1 deficiency was a risk factor for early recurrence and short OS, consistent with the findings of Hirata and Fan et al. 30 , 31
The EMT process is usually reported to be responsible for metastasis. However, in our research, ectopic overexpression of PRRX induced EMT but did not form metastasis. On the contrary, PRRX1 knockdown induced metastatic formation. The reason why PRRX1 loss was associated with metastasis could be attributed to two factors: PRRX1 deficiency promoted cell proliferation, and PRRX1 deficiency induced MET.
In our research, we found that PRRX1 downregulation promoted cell proliferation and tumor growth, consistent with the findings in lung and breast cancer. 6 Enhanced cell proliferation was usually reported to be observed in the process of EMT; however, there are researches reporting impaired cell proliferation in EMT. 32 , 33 , 34 Enhanced cell proliferation in MET favors the formation of distant metastasis because it is essential to form a solid tumor after colonization. 7 We also found loss of PRRX1 induced MET in HCC. Mechanically, E‐cadherin re‐expression was detected after PRRX1 knockdown, which could be regarded as the abrogation of the EMT process. 35 SLUG and CTNNB1 were downregulated after PRRX1 knockdown during MET. MET induced by PRRX1 downregulation might be the consequence of the decrease of SLUG and the inhibition of β‐catenin. SLUG can suppress E‐cadherin and induce EMT in epithelial cells, 36 , 37 and E‐cadherin suppression frequently occurs in tandem with the activation of the Wnt/β‐catenin signaling cascade. 38 So, the loss of SLUG and CTNNB1 abolished the inhibitory effect on E‐cadherin after PRRX1 inhibition.
We also determined how PRRX1 downregulation inhibited SLUG and CTNNB1. We found that PITX2 was the pivotal element in mediating MET. PITX2 is a member of the bicoid‐related homeobox family and functions in the asymmetrical development of the heart, spleen, and lungs; in the establishment of the left‐right axis and the twisting of the gut and stomach; and in the development of the eyes and teeth. 25 Both PRRX1 and PITX2 participate in heart development, and their aberrant expression plays important roles in the pathogenesis of atrial fibrillation. 39 , 40 It has been reported that left identity is mediated by the left‐specific nodal‐PITX2 axis, while the bone morphogenetic protein (BMP)‐PRRX1 pathway governs heart morphogenesis more prominently from the right. PRRX1 may suppress PITX2 by increasing SNAIL in heart looping. 41 The interaction between PRRX1 and PITX2 has not yet been reported in cancers. Our research showed that PRRX1 had an inhibitory effect on PITX2. Given the regulatory relationship between PRRX1 and SLUG/CTNNB1, we hypothesized that loss of PRRX1 might inhibit SLUG and CTNNB1 by increasing PITX2 during MET. In the present study, we confirmed that PITX2 inhibition reversed PRRX1 deficiency–induced decreases in SLUG and CTNNB1.
We also found that PRRX1 downregulation increased miR‐200a, miR‐200b, and miR‐429, which could be reversed by inhibiting PITX2. There was a PITX2‐binding element (5‐TAATCC‐3) in the 5′‐flanking regions of the miR‐200a‐200b‐429 cluster. PITX2 bound to a PITX2 element in the 5′‐flanking region of the chromatin and upregulated miR‐200a, miR‐200b, and miR‐429. 24 PITX2 inhibited β‐catenin in a miRNA‐dependent manner. The PITX2‐miR‐200a‐CTNNB1 pathway induced MET by converting mesenchymal cells to epithelial cell type with increased E‐cadherin. 24 However, to the best of our knowledge, whether the regulatory effect of PITX2 on SLUG is mediated by miRNAs has not been reported. Li et al reported that miR‐200 overexpression resulted in SLUG downregulation, leading to the morphologic reversal of the EMT phenotype in pancreatic cancer cells. 42 According to luciferase assays in this study, we found that the upregulated miR‐200b and miR‐429 could bind directly to the 3′‐UTR of SLUG and inhibit its expression.
In conclusion, we found that PRRX1 downregulation correlated with earlier recurrence and shorter OS in HCC patients. We also report for the first time the mechanisms by which PRRX1 deficiency induces MET. PRRX1 deficiency upregulated PITX2‐miR‐200a and PITX2‐miR‐200b/429, which further inhibited the transcription of CTNNB1 and SLUG, respectively, leading to abrogation of the inhibitory effect on E‐cadherin (Figure 6N).
DISCLOSURE
The authors have no conflict of interest.
Supporting information
Figures S1‐S2
Table S1
Table S2
Table S3
Table S4
ACKNOWLEDGEMENTS
The research was supported by the National Natural Science Foundation of China (no. 81572393, 81602093, 81602054), the Natural Science Foundation of Jiangsu Province (no. BK20160118 and BK20151042), the Key Project supported by the Medical Science and Technology Development Foundation, Nanjing Municipality Health Bureau (no. ZKX15020, ZKX17022), the Fundamental Research Funds for the Central Universities (no. 021414380215, 021414380242, 021414380258), the Applied Basic Research of Changzhou Technology Bureau (no. CJ20190093), the Major Science and Technology Project of Changzhou Health Committee (no. ZD201906), and the Chen Xiao‐Ping Foundation for the Development of Science and Technology of Hubei Province (CXPJJH12000001‐2020318).
Chen W, Wu J, Shi W, et al. PRRX1 deficiency induces mesenchymal‐epithelial transition through PITX2/miR‐200–dependent SLUG/CTNNB1 regulation in hepatocellular carcinoma. Cancer Sci. 2021;112:2158–2172. 10.1111/cas.14853
Weibo Chen, Junyi Wu, and Weiwei Shi contributed equally to this work.
Contributor Information
Zhongxia Wang, Email: freud_t@126.com.
Junhua Wu, Email: wujunhua@nju.edu.cn.
Chunping Jiang, Email: chunpingjiang@163.com.
REFERENCES
- 1. Chaffer CL, Weinberg RA. A perspective on cancer cell metastasis. Science. 2011;331:1559‐1564. [DOI] [PubMed] [Google Scholar]
- 2. Giannelli G, Koudelkova P, Dituri F, Mikulits W. Role of epithelial to mesenchymal transition in hepatocellular carcinoma. J Hepatol. 2016;65:798‐808. [DOI] [PubMed] [Google Scholar]
- 3. Brabletz T, Kalluri R, Nieto MA, Weinberg RA. EMT in cancer. Nat Rev Cancer. 2018;18:128‐134. [DOI] [PubMed] [Google Scholar]
- 4. Tarin D, Thompson EW, Newgreen DF. The fallacy of epithelial mesenchymal transition in neoplasia. Cancer Res. 2005;65:5996‐6001; discussion 6000‐5991. [DOI] [PubMed] [Google Scholar]
- 5. Nieto MA, Huang RY, Jackson RA, Thiery JP. Emt: 2016. Cell. 2016;166:21‐45. [DOI] [PubMed] [Google Scholar]
- 6. Ocana OH, Corcoles R, Fabra A, et al. Metastatic colonization requires the repression of the epithelial‐mesenchymal transition inducer Prrx1. Cancer Cell. 2012;22:709‐724. [DOI] [PubMed] [Google Scholar]
- 7. Brabletz T. To differentiate or not–routes towards metastasis. Nat Rev Cancer. 2012;12:425‐436. [DOI] [PubMed] [Google Scholar]
- 8. Pei D, Shu X, Gassama‐Diagne A, Thiery JP. Mesenchymal‐epithelial transition in development and reprogramming. Nat Cell Biol. 2019;21:44‐53. [DOI] [PubMed] [Google Scholar]
- 9. Jolly MK, Ware KE, Gilja S, Somarelli JA, Levine H. EMT and MET: necessary or permissive for metastasis? Mol Oncol. 2017;11:755‐769. [DOI] [PMC free article] [PubMed] [Google Scholar]
- 10. Kowalski PJ, Rubin MA, Kleer CG. E‐cadherin expression in primary carcinomas of the breast and its distant metastases. Breast Cancer Res. 2003;5:26. [DOI] [PMC free article] [PubMed] [Google Scholar]
- 11. Hugo HJ, Gunasinghe N, Hollier BG, et al. Epithelial requirement for in vitro proliferation and xenograft growth and metastasis of MDA‐MB‐468 human breast cancer cells: oncogenic rather than tumor‐suppressive role of E‐cadherin. Breast Cancer Res. 2017;19:017‐0880. [DOI] [PMC free article] [PubMed] [Google Scholar]
- 12. Kern MJ, Argao EA, Birkenmeier EH, Rowe LB, Potter SS. Genomic organization and chromosome localization of the murine homeobox gene Pmx. Genomics. 1994;19:334‐340. [DOI] [PubMed] [Google Scholar]
- 13. Bergwerff M, Gittenberger‐de Groot AC, DeRuiter MC, van Iperen L, Meijlink F, Poelmann RE. Patterns of paired‐related homeobox genes PRX1 and PRX2 suggest involvement in matrix modulation in the developing chick vascular system. Dev Dyn. 1998;213:59‐70. [DOI] [PubMed] [Google Scholar]
- 14. Martin JF, Bradley A, Olson EN. The paired‐like homeo box gene MHox is required for early events of skeletogenesis in multiple lineages. Genes Dev. 1995;9:1237‐1249. [DOI] [PubMed] [Google Scholar]
- 15. Takahashi Y, Sawada G, Kurashige J, et al. Paired related homoeobox 1, a new EMT inducer, is involved in metastasis and poor prognosis in colorectal cancer. Br J Cancer. 2013;109:307‐311. [DOI] [PMC free article] [PubMed] [Google Scholar]
- 16. Reichert M, Takano S, von Burstin J, et al. The Prrx1 homeodomain transcription factor plays a central role in pancreatic regeneration and carcinogenesis. Genes Dev. 2013;27:288‐300. [DOI] [PMC free article] [PubMed] [Google Scholar]
- 17. Hardin H, Guo Z, Shan W, et al. The roles of the epithelial‐mesenchymal transition marker PRRX1 and miR‐146b‐5p in papillary thyroid carcinoma progression. Am J Pathol. 2014;184:2342‐2354. [DOI] [PMC free article] [PubMed] [Google Scholar]
- 18. Sugiyama M, Hasegawa H, Ito S, et al. Paired related homeobox 1 is associated with the invasive properties of glioblastoma cells. Oncol Rep. 2015;33:1123‐1130. [DOI] [PubMed] [Google Scholar]
- 19. Guo J, Fu Z, Wei J, Lu W, Feng J, Zhang S. PRRX1 promotes epithelial‐mesenchymal transition through the Wnt/beta‐catenin pathway in gastric cancer. Med Oncol. 2015;32:393. [DOI] [PubMed] [Google Scholar]
- 20. Tang Y, Lu Y, Chen Y, et al. Pre‐metastatic niche triggers SDF‐1/CXCR4 axis and promotes organ colonisation by hepatocellular circulating tumour cells via downregulation of Prrx1. J Exp Clin Cancer Res. 2019;38:019‐1475. [DOI] [PMC free article] [PubMed] [Google Scholar]
- 21. Chen WB, Lai SS, Yu DC, et al. GGPPS deficiency aggravates CCl4‐induced liver injury by inducing hepatocyte apoptosis. FEBS Lett. 2015;589:1119‐1126. [DOI] [PubMed] [Google Scholar]
- 22. Chen W, Yang J, Zhang Y, Cai H, Chen X, Sun D. Regorafenib reverses HGF‐induced sorafenib resistance by inhibiting epithelial‐mesenchymal transition in hepatocellular carcinoma. FEBS Open Bio. 2019;9:335‐347. [DOI] [PMC free article] [PubMed] [Google Scholar]
- 23. Cao H, Jheon A, Li X, et al. The Pitx2:miR‐200c/141:noggin pathway regulates Bmp signaling and ameloblast differentiation. Development. 2013;140:3348‐3359. [DOI] [PMC free article] [PubMed] [Google Scholar]
- 24. Sharp T, Wang J, Li X, et al. A pituitary homeobox 2 (Pitx2):microRNA‐200a‐3p:beta‐catenin pathway converts mesenchymal cells to amelogenin‐expressing dental epithelial cells. J Biol Chem. 2014;289:27327‐27341. [DOI] [PMC free article] [PubMed] [Google Scholar]
- 25. Gage PJ, Suh H, Camper SA. The bicoid‐related Pitx gene family in development. Mamm Genome. 1999;10:197‐200. [DOI] [PubMed] [Google Scholar]
- 26. Adhikary A, Chakraborty S, Mazumdar M, et al. Inhibition of epithelial to mesenchymal transition by E‐cadherin up‐regulation via repression of slug transcription and inhibition of E‐cadherin degradation: dual role of scaffold/matrix attachment region‐binding protein 1 (SMAR1) in breast cancer cells. J Biol Chem. 2014;289:25431‐25444. [DOI] [PMC free article] [PubMed] [Google Scholar]
- 27. Thaper D, Vahid S, Nip KM, et al. Targeting Lyn regulates Snail family shuttling and inhibits metastasis. Oncogene. 2017;36:3964‐3975. [DOI] [PubMed] [Google Scholar]
- 28. Hojo N, Huisken AL, Wang H, et al. Snail knockdown reverses stemness and inhibits tumour growth in ovarian cancer. Sci Rep. 2018;8:8704. [DOI] [PMC free article] [PubMed] [Google Scholar]
- 29. Yook JI, Li XY, Ota I, Fearon ER, Weiss SJ. Wnt‐dependent regulation of the E‐cadherin repressor snail. J Biol Chem. 2005;280:11740‐11748. [DOI] [PubMed] [Google Scholar]
- 30. Hirata H, Sugimachi K, Takahashi Y, et al. Downregulation of PRRX1 Confers Cancer Stem Cell‐Like Properties and Predicts Poor Prognosis in Hepatocellular Carcinoma. Ann Surg Oncol. 2015;22(Suppl 3):S1402‐S1409. [DOI] [PubMed] [Google Scholar]
- 31. Fan M, Shen J, Liu H, et al. Downregulation of PRRX1 via the p53‐dependent signaling pathway predicts poor prognosis in hepatocellular carcinoma. Oncol Rep. 2017;38:1083‐1090. [DOI] [PubMed] [Google Scholar]
- 32. Vega S, Morales AV, Ocaña OH, Valdés F, Fabregat I, Nieto MA. Snail blocks the cell cycle and confers resistance to cell death. Genes Dev. 2004;18:1131‐1143. [DOI] [PMC free article] [PubMed] [Google Scholar]
- 33. Mejlvang J, Kriajevska M, Vandewalle C, et al. Direct repression of cyclin D1 by SIP1 attenuates cell cycle progression in cells undergoing an epithelial mesenchymal transition. Mol Biol Cell. 2007;18:4615‐4624. [DOI] [PMC free article] [PubMed] [Google Scholar]
- 34. Thiery JP, Acloque H, Huang RY, Nieto MA. Epithelial‐mesenchymal transitions in development and disease. Cell. 2009;139:871‐890. [DOI] [PubMed] [Google Scholar]
- 35. Thiery JP, Sleeman JP. Complex networks orchestrate epithelial‐mesenchymal transitions. Nat Rev Mol Cell Biol. 2006;7:131‐142. [DOI] [PubMed] [Google Scholar]
- 36. Cano A, Perez‐Moreno MA, Rodrigo I, et al. The transcription factor snail controls epithelial‐mesenchymal transitions by repressing E‐cadherin expression. Nat Cell Biol. 2000;2:76‐83. [DOI] [PubMed] [Google Scholar]
- 37. Batlle E, Sancho E, Franci C, et al. The transcription factor snail is a repressor of E‐cadherin gene expression in epithelial tumour cells. Nat Cell Biol. 2000;2:84‐89. [DOI] [PubMed] [Google Scholar]
- 38. Uematsu K, He B, You L, Xu Z, McCormick F, Jablons DM. Activation of the Wnt pathway in non small cell lung cancer: evidence of dishevelled overexpression. Oncogene. 2003;22:7218‐7221. [DOI] [PubMed] [Google Scholar]
- 39. Zhou M, Liao Y, Tu X. The role of transcription factors in atrial fibrillation. J Thorac Dis. 2015;7:152‐158. [DOI] [PMC free article] [PubMed] [Google Scholar]
- 40. Shang Y, Yoshida T, Amendt BA, Martin JF, Owens GK. Pitx2 is functionally important in the early stages of vascular smooth muscle cell differentiation. J Cell Biol. 2008;181:461‐473. [DOI] [PMC free article] [PubMed] [Google Scholar]
- 41. Ocana OH, Coskun H, Minguillon C, et al. A right‐handed signalling pathway drives heart looping in vertebrates. Nature. 2017;549:86‐90. [DOI] [PMC free article] [PubMed] [Google Scholar]
- 42. Li Y, VandenBoom TG 2nd, Kong D, et al. Up‐regulation of miR‐200 and let‐7 by natural agents leads to the reversal of epithelial‐to‐mesenchymal transition in gemcitabine‐resistant pancreatic cancer cells. Cancer Res. 2009;69:6704‐6712. [DOI] [PMC free article] [PubMed] [Google Scholar]
Associated Data
This section collects any data citations, data availability statements, or supplementary materials included in this article.
Supplementary Materials
Figures S1‐S2
Table S1
Table S2
Table S3
Table S4