Abstract
The unfolded protein response (UPR) plays an important role in carcinogenesis, but the functional role and mechanism of UPR‐associated bladder carcinogenesis remain to be characterized. Upon UPR activation, ATF6α is activated to upregulate the transcription of UPR target genes. Although the mechanism of ATF6 activation has been studied extensively, the negative regulation of ATF6 stabilization is not well understood. Here, we report that the deubiquitinase otubain 1 (OTUB1) facilitates bladder cancer progression by stabilizing ATF6 in response to endoplasmic reticulum stress. OTUB1 expression is raised in bladder cancer patients. Genetic ablation of OTUB1 markedly inhibited bladder cancer cell proliferation, viability, and migration both in vitro and in vivo. Mechanistically, luciferase pathway screening showed that ATF6 signaling was clearly activated compared with other pathways. OTUB1 was found to activate ATF6 signaling by inhibiting its ubiquitylation, thereby remodeling the stressed cells through transcriptional regulation. Our results show that high OTUB1 expression promotes bladder cancer progression by stabilizing ATF6 and that OTUB1 is a potential therapeutic target in bladder cancer.
Keywords: ATF6, bladder cancer, deubiquitination, OTUB1, UPR
Our results show that high OTUB1 expression promotes bladder cancer progression by stabilizing ATF6 and that OTUB1 is a potential therapeutic target in bladder cancer.
1. INTRODUCTION
Bladder cancer is a highly prevalent malignancy in males worldwide 1 . Bladder cancer is divided into 2 groups: muscle‐invasive bladder cancer (MIBC) and non‐muscle‐invasive bladder cancer (NMIBC). The 5‐y and 10‐y survival rates of treated MIBC patients are approximately 50 and 36%, respectively 2 . The prognosis of bladder cancer patients has not changed in the last 10 y, and most patients are diagnosed with macroscopic hematuria 3 . NMIBC is treated with endoscopic resection and risk‐based intravesical therapy, whereas MIBC is treated more aggressively, such as with bladder removal with or without chemotherapy 2 . Some immunotherapies, such as pembrolizumab 4 and atezolizumab 5 , are being studied in bladder cancer. However, new targets and effective treatments still need to be identified and developed.
Cancer cells are exposed to various intrinsic and extrinsic factors that can produce endoplasmic reticulum (ER) stress. The accumulation of ER stress leads to the activation of a homeostatic intracellular signaling network called the unfolded protein response (UPR), which has evolved to maintain a productive protein‐folding environment in the ER 6 . When unfolded proteins accumulate in the ER lumen, stress signals are transduced by the dissociation of binding immunoglobulin protein (BiP) 7 , which frees the sensors inositol‐required enzyme 1 (IRE1), protein kinase‐like ER kinase (PERK), and activating transcription factor 6α (ATF6α) to begin UPR signaling. These 3 activated sensors transduce information to the nucleus to halt the translation of new proteins and to promote increased protein folding and proteasome activity to restore ER homeostasis. If the UPR cannot resolve the protein‐folding defect, cells enter apoptosis. In normal cells, activation of the IRE1‐XBP1 and ATF6α pathways is attenuated in response to chronic stress, which then triggers apoptosis 8 , 9 . However, some cancer cells have constitutive activation of the IRE1‐XBP1 pathway or BIP overexpression, which suppresses apoptosis 10 , 11 . UPR activation also represses cyclin D1 translation, leading to cell cycle arrest in G1 phase and permitting cancer cell survival in the stressed environment 12 . Persistent ER stress or UPR activation induces apoptosis in both cancer cells and normal cells. Lee’s group demonstrated that chronic exposure to tumor‐derived extracellular vesicles results in IRE1 activation and the transformation of nonmalignant human SV‐HUC urothelial cells 13 . However, there have been no substantial studies on the relationship between ER stress or UPR activation and bladder cancer development.
ATF6α (called ATF6 from this point forwards), a member of the leucine zipper family, localizes to the ER 14 . Under normal conditions, ATF6 interacts with BIP in the ER, but on ER stress, ATF6 is exported to the Golgi complex and cleaved by site‐1 protease (S1P) and S2P, which releases a 50‐kDa amino‐terminal cytoplasmic fragment (ATF6f). Then, ATF6f enters the nucleus and binds ER stress‐response elements 15 . Lack of ATF6 impairs adaption to chronic and acute ER stress 16 . ATF6 was proposed as a marker for early dysplastic 17 . Overexpressed ATF6 induces intestinal dysbiosis and innate immune response to promote colorectal tumorigenesis 18 . Although the mechanism of ATF6 activation has been studied extensively, the negative regulation of ATF6 stabilization is not well understood.
Ubiquitination, the posttranslational addition of ubiquitin to target proteins, is a cellular process that alters protein stability 19 . Ubiquitination is regulated by both ubiquitin ligases and deubiquitinases (DUBs) 20 . The DUB otubain 1 (OTUB1) specifically cleaves K48‐linked polyubiquitin chains 21 and is widely expressed in human tissues, especially in the brain 22 . OTUB1 regulates many pathways associated with cancer development and progression, for example OTUB1 inhibits the monoubiquitination of RAS, resulting in RAS accumulation at the plasma membrane and triggering ERK1/2 signaling in wild‐type (WT) RAS lung carcinoma cells. Overexpression of OTUB1 enhances the soft agar colony formation and xenograft tumor growth of lung carcinoma cell lines 23 . In breast cancer, OTUB1 deubiquitinates and stabilizes FOXM1 in cells treated with epirubicin, thereby potentiating cell proliferation 24 . In prostate cancer (PCa), OTUB1 silencing reduces the expression of several androgen receptor (AR)‐regulated proteins 25 , and OTUB1 enhances PCa cell invasion in vitro by altering P53/RhoA activity 26 . Although evidence for the critical role of OTUB1 in cancer imitation and progression has emerged, the function and mechanism of OTUB1 in bladder cancer remain unclear.
We found that OTUB1 is overexpressed in bladder cancer samples and that patients with high OTUB1 expression have an unfavorable prognosis. In vitro, OTUB1 overexpression promotes the proliferation and migration of bladder cancer EJ cells. Consistent with these results, OTUB1 deficiency represses cell proliferation and migration of bladder cancer T24 cells. To explore the mechanism, we performed RNA sequencing (RNA‐seq) analysis and identified the ATF6 signaling pathway. We found that OTUB1 binds and stabilizes ATF6 by deubiquitination, thereby promoting the ATF6 signaling cascade. The studies described here identify the oncogenic role of OTUB1 in bladder cancer, in which OTUB1 targets ATF6 to affect the UPR.
2. MATERIALS AND METHODS
2.1. Antibodies
Rabbit monoclonal anti‐ATF6 antibody (65880S) and rabbit monoclonal anti‐OTUB1 antibody (3783S) were purchased from CST Inc (Beverly, Massachusetts, USA); antibodies against HA (M180‐3) and FLAG (M185‐3L) were procured from MBL Beijing Biotech Co., Ltd. (Beijing, China); the anti‐GAPDH antibody (cat# CW0266A) was purchased from Beijing Cowin Biotech Co., Ltd. (Beijing, China) and horseradish peroxidase (HRP)‐conjugated secondary antibodies (cat. nos. 111‐035‐003 and 115‐035‐003) were obtained from Jackson ImmunoResearch Laboratories, Inc (West Grove, PA, USA).
2.2. Xenografts
Given the effect size and standard deviation, the sample size for the animal studies was chosen in accordance with the suggestion by the animal research committee. OTUB1‐/‐ and parental T24 cells were collected and washed twice with PBS. In total, 4 × 10⁶ cells were resuspended in 0.2 mL of PBS and inoculated into the flanks of 5 6‐wk‐old female nude mice. Tumors were measured 3 times per week, and tumor volume was calculated in accordance with the following formula: [length × width2] × 0.5. Mice were killed 28 d post inoculation. All animal studies were conducted in accordance with the Guidelines of the China Animal Welfare Legislation and were approved by the Committee on Ethics in the Care and Use of Laboratory Animals of Wuhan University (permit number: IACUC2018055). All efforts were made to minimize suffering.
2.3. Cell culture and cell lines
HEK293T cells, human bladder cancer T24 cells with OTUB1 knockout and human bladder cancer EJ cells with OTUB1 overexpression were maintained in Dulbecco's modified Eagle's medium (DMEM, HyClone, Logan, UT, USA) supplemented with 10% fetal bovine serum (FBS; GE Healthcare Life Sciences, Logan, UT, USA) and 100 U penicillin/streptomycin (Gibco, Carlsbad, CA, USA) at 37°C in a 5% CO2 incubator. All cell lines were purchased from ATCC. The commonly used HEK293T and T24 cell lines were screened for mycoplasma contamination, but none was found.
2.4. Cell proliferation, colony formation, soft agar, and Transwell assays
Cell proliferation assays were performed using the Cell Counting Kit‐8 (CCK‐8, Dojindo Laboratories, Kumamoto, Japan) in accordance with the manufacturer’s instructions. The indicated cells were seeded into 96‐well plates at a density of 1 × 10³ cells/well. Subsequently, CCK‐8 solution (10 μL of CCK‐8 reagent in 90 μL DMEM) was added to each well, and the plates were incubated at 37°C for 1‐3 h. The optical density was measured at a wavelength of 450 nm. Soft agar and colony formation assays were performed to examine the viability and tumorigenicity of bladder cancer cell lines with OTUB1 knockout or overexpression. Briefly, 4 × 10² cells were seeded into 6‐well plates. After 2 wk of incubation, colonies were stained with 0.025% crystal violet at room temperature for 15 min, and images were captured using a scanner. For soft agar assays, 2 ml of 0.7% agar was plated into each well of 6‐well plates and then 1 mL of cells (2 × 10⁴ cells) was mixed with 1 mL of 0.7% agar to form the upper gel. Plates containing cancer cells were incubated at 37°C in a 5% CO2 in air incubator for 2‐3 wk, then the number of colonies was counted, and images were captured under a microscope. For cell migration assays, Transwell inserts (Corning) were placed into 24‐well plates. DMEM with 40% FBS was added to the lower chamber and then the indicated cells were seeded into the upper chamber in serum‐free medium at a density of 4 × 10⁴ cells/well. The plates were incubated for 48 h. Cells that migrated into the lower chamber were fixed with 4% paraformaldehyde and stained with 0.025% crystal violet, and images were captured under a microscope.
2.5. RNA isolation and real‐time (RT) quantitative PCR (qPCR)
The mRNA levels of the indicated genes were detected using qPCR. The cells were lysed using RNAiso Plus (9108, TaKaRa Biomedical Technology [Beijing] Co., Ltd.), and total RNA was isolated in accordance with a standard protocol, followed by reverse transcription in accordance with the manufacturer’s instructions (04896866001; Roche, Munich, Germany).
2.6. Western blot analysis
Cells were lysed with SDS sample buffer (62.5 mM Tris‐HCl, pH 6.8, 2% SDS, and 10% glycerol) at 95°C for 10 min. Protein concentration was determined using a BCA protein assay kit (Thermo Fisher Scientific, Inc). Proteins (20‐40 μg) were separated using 8‐12% SDS‐PAGE and transferred to PVDF membranes (IPVH00010; Millipore, Billerica, MA, USA). The membranes were incubated with primary antibodies overnight at 4°C and then with HRP‐conjugated secondary antibodies at room temperature for 1 h before visualization in the ChemiDoc™ MP Imaging System (Bio‐Rad, Hercules, CA, USA).
2.7. Coimmunoprecipitation
HEK293T cells were lysed in NP‐40 lysis buffer (20 mM Tris‐HCl pH 7.4, 150 mM NaCl, and 1% NP‐40) supplemented with a proteinase inhibitor cocktail (Roche). Cell lysates were collected and subjected to immunoprecipitation with 2 µg of the indicated antibody at 4°C overnight and then protein A/G magnetic beads were added to the lysates (Thermo Fisher Scientific, Inc) at 4°C for 3 h. The immunoprecipitated proteins were separated using SDS‐PAGE and visualized in the ChemiDoc™ MP Imaging System (Bio‐Rad, Hercules, CA, USA).
2.8. Luciferase assay
HEK293T cells were seeded into 24‐well plates and transfected with the indicated plasmids. The reporter plasmid (200 ng/well), pRL‐CMV (2 ng/well) and gene expression plasmid were included in each transfection. After 36 h, reporter assays were performed with a dual‐specific luciferase assay kit (Promega).
2.9. Immunofluorescence
The cells were cultured in 24‐well plates with coverslips and fixed with 4% paraformaldehyde for 15 min. Then, the cells were permeabilized with 0.1% Triton X‐100 in PBS, washed with PBS, blocked with 5% bovine serum albumin in PBS for 30 min, and incubated with primary antibody overnight at 4°C. The next day, the cells were washed 3 times, incubated with secondary antibody for 30 min, and stained with DAPI. Coverslips were mounted onto glass slides with anti‐fade solution. Finally, the slides were observed and digitally photographed using an Olympus Laser Scanning Confocal Microscope.
2.10. KEGG pathway and gene set enrichment analysis (GSEA)
The genes involved in biological pathways were annotated using the Kyoto Encyclopedia of Genes and Genomes (KEGG) database. The enrichment analysis tool clusterProfiler was used in this study.
2.11. Statistical analysis
All experiments (except the xenografts) were performed at least 3 times. The phenotype studies, mechanism studies, and data analysis were performed by different investigators. Statistical analyses were conducted using GraphPad Prism software. Data are expressed as the mean ± SEM. The statistical significance of differences between 2 groups was evaluated using an unpaired two‐tailed Student t test, and differences among more than 2 groups were analyzed by one‐way analysis of variance (ANOVA) with the Bonferroni post hoc test for homogeneity of variance or with Tamhane’s T2 analysis for data heteroscedasticity. The sample size in the animal/cell experiments in this study was fixed in a prospective manner; no statistical method was used to predetermine the sample size, which was determined from previous studies from our group and others. P < .05 was considered to show statistical significance.
3. RESULTS
3.1. OTUB1 is overexpressed in bladder cancer
Several studies have indicated OTUB1 overexpression in certain types of cancer. The interactive web server GEPIA was used to analysis OTUB1 expression in bladder cancer, and RNA‐seq expression data in the TCGA and GTEx databases were examined. As shown in Figure 1A, OTUB1 expression was higher in tumor tissue compared with in normal tissue. We also evaluated the superficial bladder cancer and infiltrating bladder urothelial carcinoma data in Oncomine and obtained results similar to those of our analysis and consistent with those in the GEPIA dataset, indicating that OTUB1 is upregulated in bladder cancer (Figure 1B). To evaluate whether OTUB1 expression is associated with a poor prognosis, we performed survival analysis of overall survival using the web server GEPIA. The results showed that bladder cancer patients with high OTUB1 expression had poorer survival compared with those with low OTUB1 expression (Figure 1C). To verify OTUB1 expression in bladder cancer, we examined OTUB1 protein levels in bladder cancer tissues and adjacent bladder tissues from patients using immunohistochemistry (IHC); this analysis revealed that OTUB1 was highly expressed in bladder cancer compared with normal tissue (Figure 1D, E). The results show that OTUB1 is closely associated with bladder cancer progression.
FIGURE 1.
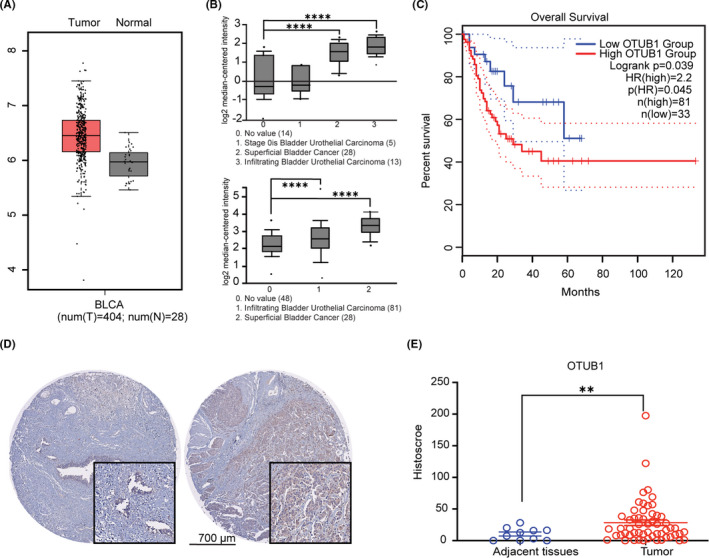
OTUB1 expression in bladder cancer. A, OTUB1 expression in bladder urothelial carcinoma tissues compared with normal tissues on the GEPIA website. B, OTUB1 expression in bladder urothelial carcinoma, superficial bladder cancer, and infiltrating bladder urothelial carcinoma tissues compared with normal tissues on the Oncomine website. C, GEPIA survival analysis of overall survival for 114 bladder cancer samples and OTUB1 expression. The high OTUB1 group showed significantly lower survival rates (P = 0.039). D, Immunohistochemical staining of OTUB1 on tissue microarrays containing ovarian cancer and normal tissues. E, Tissue microarray data analysis of OTUB1 expression in tumor (n = 70) and adjacent normal (n = 10) tissues from 70 patients with bladder cancer (P<.01). Data are presented as the mean ± SEM. Statistical significance was analyzed by ANOVA or Student t test. *P < .05, **P < .01, ****P < .0001
3.2. Overexpression of OTUB1 promotes cell proliferation and migration
To examine the function of OTUB1 in bladder cancer cells, EJ cells were transfected with a FLAG‐OTUB1 (WT OTUB1) plasmid or FLAG‐OTUB1 C91S (catalytic‐inactive mutant) plasmid and OTUB1 expression was detected using western blotting (Figure 2A). Functional colony formation, cell growth, soft agar, and Transwell assays were performed to assess the effects of OTUB1 on cell proliferation, viability, and migration. Colony formation, cell growth, and soft agar assays demonstrated that exogenous expression of OTUB1 potently increased colony number and cell proliferation, but not the OTUB1 C91S (Figure 2B‐D). Transwell assays showed that stable OTUB1 overexpression, but not the OTUB1 C91S, notable increased the number of migrating EJ cells (Figure 2E). The same results were also confirmed in T24 cells transfected with FLAG‐OTUB1 (Figure S1). These results suggest that OTUB1 overexpression, but not the OTUB1 C91S, promotes bladder cancer cell viability, proliferation, and migration.
FIGURE 2.
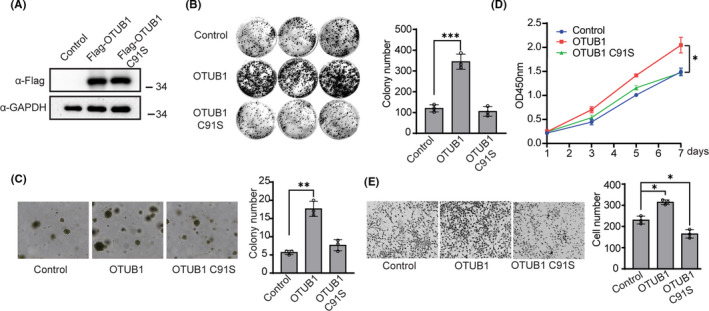
OTUB1 overexpression promotes bladder cancer cell proliferation, viability, and migration. A, EJ cells were transfected with FLAG‐OTUB or FLAG‐OTUB1 C91S, and protein levels were detected by western blot. GAPDH served as a control. B, EJ cells were transfected with OTUB1 or FLAG‐OTUB1 C91S as indicated, and wild‐type EJ cells served as control. Colony formation assays were performed to detect cell viability. The colonies were stained with crystal violet and photographed. The number of colonies was counted and plotted (n = 3). C, EJ cells were transfected with FLAG‐OTUB or FLAG‐OTUB1 C91S as indicated, and wild‐type EJ cells served as control. Soft agar colony formation assays were performed to evaluate the anchorage‐independent growth of cells overexpressing OTUB1. The colonies were imaged (left, ×20 magnification) and counted, and the results were plotted (right, n = 3). D, EJ cells were transfected with FLAG‐OTUB or FLAG‐OTUB1 C91S as indicated, and wild‐type EJ cells served as control. and CCK‐8 assays were used to analyze cell proliferation (n = 6). E, EJ cells were transfected with FLAG‐OTUB or FLAG‐OTUB1 C91S as indicated, and wild‐type EJ cells served as control. Transwell experiments were used to evaluate the effects of OTUB1 overexpression on cell migration. The cells were imaged (left, ×20 magnification) and counted, and the results were plotted (right, n = 3). Data (mean ± SEM) are representative of 3 independent experiments. Statistical significance was analyzed by ANOVA or Student t test. *P <.05 , **P, ***P < .001
3.3. OTUB1 deficiency represses cell proliferation and migration
To further verify the function of OTUB1 in bladder cancer tumorigenesis, we generated OTUB1‐knockout cell lines by the CRISPR technique in T24 cells. Western blotting analysis was used to examine OTUB1 expression in the knockout cell lines (Figure 3A). Next, colony formation and soft agar assays were used to assess cell viability and tumorigenicity. The results showed that WT T24 cells had a strong ability to form colonies, whereas OTUB1‐deficient T24 cells formed significantly fewer colonies (Figure 3B). Subsequently, we performed soft agar colony formation assays to determine whether OTUB1 deficiency influences the anchorage‐independent growth of T24 cells. The results showed that OTUB1 ablation notably decreased colony number (Figure 3C). We also examined the effects of OTUB1 on cell proliferation using CCK‐8 assays and found that the proliferation of OTUB1‐deficient T24 cells was inhibited compared with that of the parental cells (Figure 3D). Finally, Transwell assays showed that OTUB1 deficiency inhibited the migration of T24 cells (Figure 3E). In summary, genetic OTUB1 deficiency led to reduced proliferation, viability, and migration of T24 cells.
FIGURE 3.
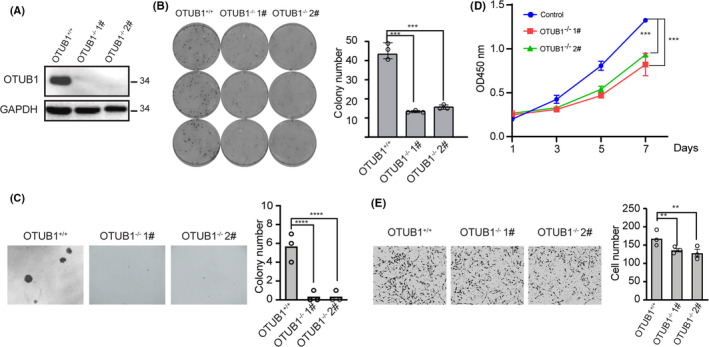
Genetic depletion of OTUB1 inhibits T24 cell proliferation, viability, and migration. A, OTUB1 protein levels in WT and OTUB1‐deficient T24 cells were detected by western blotting with GAPDH as a loading control. B, Colony formation assays showed the viability of OTUB1‐deficient T24 bladder cancer cells. Colonies were stained with crystal violet and subsequently imaged (left). The number of colonies was counted and plotted (right, n = 3). C, Cell proliferation was analyzed by CCK‐8 assays daily for 7 d (n = 6). D, Soft agar colony formation assays were performed to assess the anchorage‐independent growth of OTUB1‐deficient T24 bladder cancer cells. The cell colonies were imaged (left, ×20 magnification) and counted, and the results were plotted (right, n = 3). E, Transwell experiments were used to evaluate the effects of OTUB1 deficiency on T24 bladder cancer cell migration. The cells were imaged (left, ×20 magnification) and counted, and the results were plotted (right, n = 3). Data (mean ± SEM) are representative of 3 independent experiments. Statistical significance was analyzed by ANOVA or Student t test
3.4. OTUB1 deficiency leads to downregulation of the ATF6 pathway
To investigate the molecular mechanism of OTUB1 in bladder cancer, we performed RNA‐seq analysis using OTUB1‐deficient and WT T24 cells. KEGG pathway enrichment analysis was conducted to identify changes in signaling pathways (Figure 4A). The results revealed that multiple signaling pathways involving numerous biological processes were affected in OTUB1‐deficient cells. We also performed luciferase pathway screening using cancer‐related reporters in the HEK293T cell line to identify the underlying pathway. The results showed that OTUB1 expression noticeably activated the ATF6 luciferase reporter compared with the other pathway reporters (Figure 4B). Considering these findings, we believe that OTUB1 is important in ATF6‐regulated protein folding, sorting, and degradation. Therefore, heatmap assays were performed to verify whether genes downstream of ATF6 are regulated in OTUB1‐deficient T24 cells, and the results showed that most genes were downregulated in these cells (Figure 4C). Subsequently, GSEA was conducted to detect enrichment of the ATF6 signaling pathway between the WT and OTUB1‐deficient groups. As expected, the ATF6 signaling pathway was enriched in the WT group but not the OTUB1‐deficient group (Figure 4D). ATF6 transcriptional activity was activated by OTUB1 in a dose‐dependent manner (Figure 4E). Once activated, the transcription factor ATF6 enters the nucleus and regulates the expression of downstream genes. We examined the expression of downstream target genes of ATF6, including HEDJ, PERK and PDIA4, in OTUB1‐deficient T24 cells. Compared with parental cells, OTUB1‐deficient T24 cells had decreased mRNA levels of these ATF6 target genes. The above results show that OTUB1 influences bladder cancer cell behavior by regulating ATF6‐associated pathway activity.
FIGURE 4.
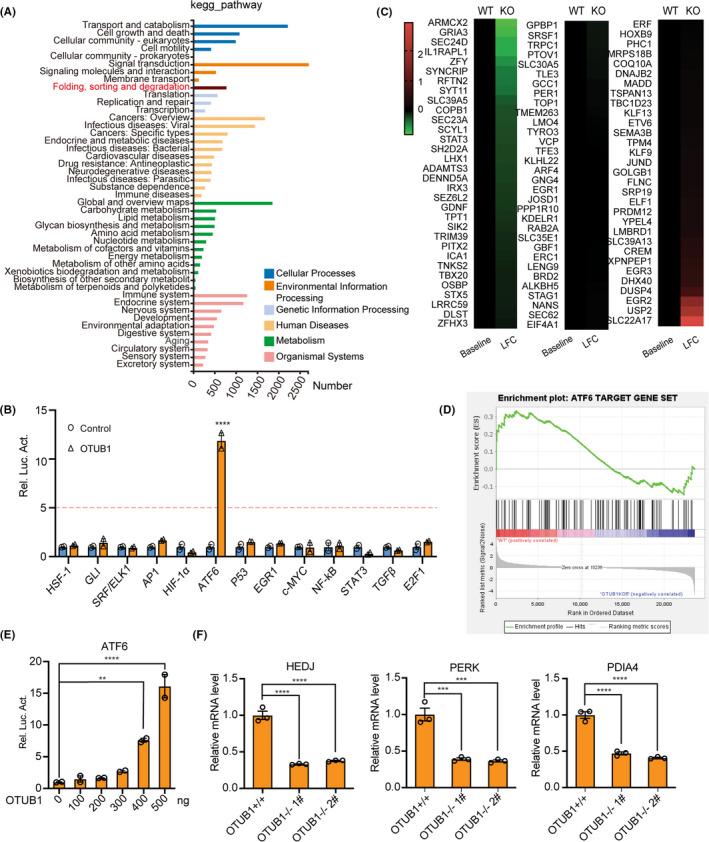
ATF6 pathway is downregulated in OTUB1‐deficient cells. A, KEGG pathway enrichment analysis on the basis of most significantly differentially expressed genes between the WT and OTUB1‐deficient groups (P < .05 using Fisher exact test). B, Luciferase pathway screening revealed that OTUB1 significantly promoted ATF6 activation in HEK293T cells (n = 3). C, Heatmap of differentially expressed genes in WT and OTUB1‐deficient T24 bladder cancer cells: red, upregulated; green, downregulated. D, GSEA of ATF6 target genes in the WT and OTUB1‐deficient groups. E, Luciferase assays showing ATF6 activity in HEK293T cells transfected with increasing amounts of the OTUB1 expression plasmid (n = 3). F, The transcription of endogenous genes downstream of ATF6 was decreased in OTUB1‐deficient T24 cells, as examined by RT‐qPCR (n = 3). Data (mean ± SEM) are representative of 3 independent experiments. Statistical significance was analyzed by ANOVA or Student t test. **P < .01, ***P < .001, ****P < .0001
3.5. OTUB1 interacts with and stabilizes ATF6
We next investigated the relationship between OTUB1 and ATF6, and confocal laser scanning microscopy showed that OTUB1 and ATF6 colocalize in the cytoplasm when overexpressed exogenous plasmids in HEK293T cells (Figure 5A). We performed coimmunoprecipitation experiments to explore the possibility that OTUB1 and ATF6 directly interact. As shown in Figure 5B, endogenous interactions between OTUB1 and ATF6 were confirmed in T24 cells.
FIGURE 5.
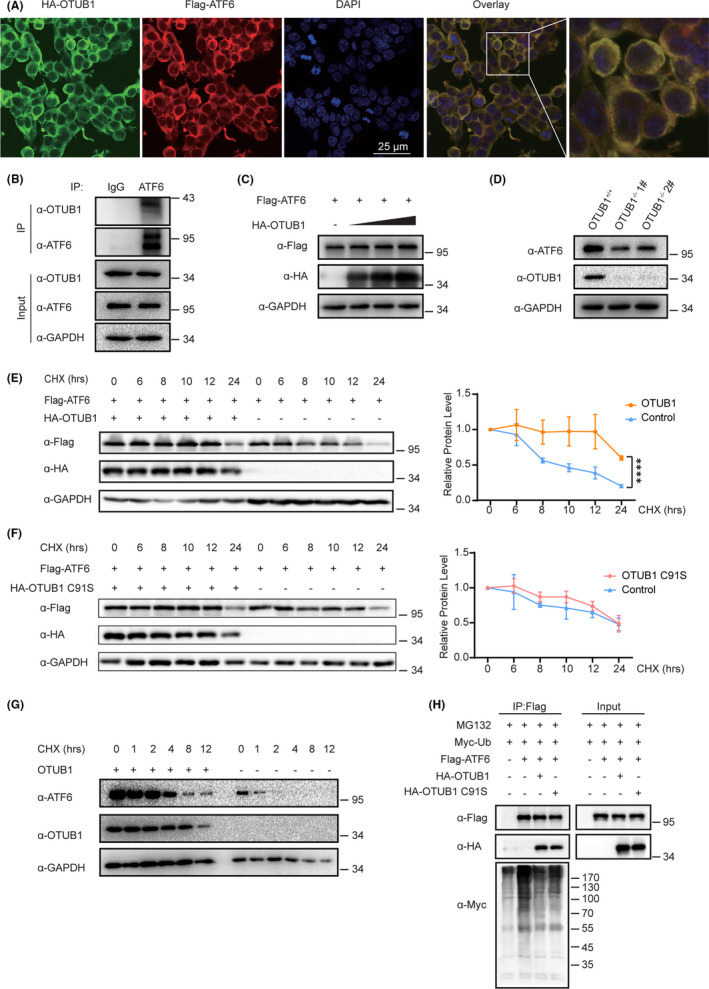
OTUB1 interacts with ATF6 and promotes ATF6 stability. A, Immunofluorescence images of OTUB1 (red) and ATF6 (green) in HEK293T cells. DAPI was used as a nuclear stain (blue). B, Immunoprecipitation experiments showed the endogenous interaction between OTUB1 and ATF6 in T24 cells. C, Cells were transfected with increasing amounts of HA‐OTUB1 (0, 200, 400, or 600 ng) and FLAG‐ATF6, and western blotting was performed to determine the effect of OTUB1 protein levels on ATF6 expression in HEK293T cells. D, Western blot analysis of ATF6 expression in OTUB1‐deficient T24 cells. E, Cells were transfected with FLAG‐ATF6 with or without HA‐OTUB1 as indicated. Western blot analysis of ATF6 stability after treatment with CHX (50 μg/mL) for the indicated time. GAPDH served as a control. The results were plotted (right). F, Cells were transfected with FLAG‐ATF6 with or without HA‐OTUB1 C91S as indicated. Western blot analysis of ATF6 stability after treatment with CHX (50 μg/mL) for the indicated time. GAPDH served as a control. The results were plotted (right). G, Western blot analysis of ATF6 stability in OTUB1‐deficient cells after treatment with CHX (50 μg/mL) for the indicated time. GAPDH served as a control. H, Cells were cotransfected with FLAG‐ATF6 and Myc‐Ub with or without HA‐OTUB1 or HA‐OTUB1 C91S, treated with MG132 (10 μM) for 6 h and then subjected to ubiquitination assays. Data are representative of 3 independent experiments. Statistical significance was analyzed by ANOVA or Student t test. ***<.0001
Given that OTUB1 is a deubiquitinating enzyme, we investigated whether OTUB1 affects ATF6 stability. We first cotransfected T24 cells with FLAG‐OTUB1 and HA‐ATF6 and detected ATF6 protein levels using western blotting. Figure 5C shows that FLAG‐ATF6 protein levels were raised when OTUB1 was overexpressed, and this increase occurred in a dose‐dependent manner (Figure 5C). To assess whether OTUB1 deficiency affects ATF6 protein levels, we determined ATF6 expression in the OTUB1‐deficient cell line; the results showed that OTUB1 deficiency reduced ATF6 levels (Figure 5D). To further confirm the effect of OTUB1 on ATF6 stability, we performed cycloheximide (CHX) chase assays to verify the time course of ATF6 degradation. The half‐life of ATF6 increased on transfection of the OTUB1 plasmid compared with an empty vector (Figure 5E). To clarify whether the deubiquitin activity of OTUB1 is caused the stabilization of ATF6, we determined the half‐life of ATF6 when OTUB1 C91S was overexpressed. The results showed that the half‐life of ATF6 was not increased by OTUB1 C91S compared with the control (Figure 5F). Consistent with these results, the half‐life of ATF6 was significantly reduced in OTUB1‐deficient cells (Figure 5G). The ubiquitin‐proteasome pathway is the main protein degradation pathway, so we next investigated whether OTUB1 can reduce the ubiquitination of ATF6. The results showed that the levels of ubiquitinated ATF6 were markedly reduced by OTUB1 compared with the control. However, OTUB1 C91S abolished this reduction compared with the WT OTUB1 (Figure 5H). Taken together, these results show that OTUB1 interacts with ATF6 and regulates its stability by inhibiting ubiquitination.
3.6. OTUB1 deficiency represses tumor formation in vivo
To further verify whether OTUB1 influences tumorigenesis in vivo, we injected WT and OTUB1‐deficient T24 cells into the flank of nude mice. As shown in Figure 6A, in contrast with those injected with WT T24 cells, mice injected with OTUB1‐deficient T24 cells showed no tumor formation. Accordingly, there was a noticeable difference in tumor weight between the knockout and WT groups (Figure 6B, D). Tumor volume was monitored throughout the experimental period, and the growth of the tumors from OTUB1‐deficient T24 cells was found to be significantly attenuated (Figure 6C). These findings show that OTUB1 potentially promotes bladder cancer growth in vivo.
FIGURE 6.
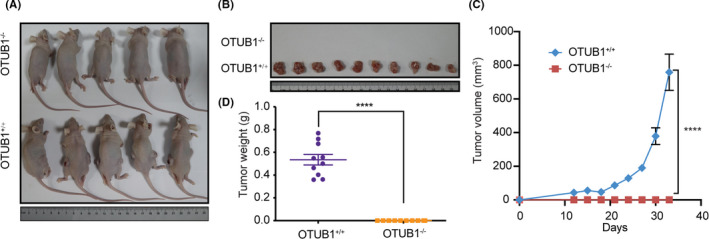
Genetic depletion of OTUB1 in T24 cells inhibits in vivo tumorigenesis. Xenograft‐based assessment of the effect of OTUB1 deficiency on tumor growth in vivo. WT or OTUB1‐deficient T24 cells were injected subcutaneously into the right dorsal flanks of nude mice. A, B, Tumors were extracted from euthanized mice and weighed, and representative images are shown. C, Tumors were measured 3 times per week, and the tumor volume was plotted. D, Quantitative results of tumor weight. Data are presented as the mean ± SEM. Statistical significance was analyzed by ANOVA or Student t test. ****P < .0001
4. DISCUSSION
The ER is an essential organelle for protein folding and quality control. Only properly folded proteins are transported to their intended destination from the ER; misfolded proteins are trafficked to the cytosol for ubiquitination and degradation. Excessive amounts of misfolded or unfolded proteins cause ER stress, which activates the UPR. It has been well documented that both ER stress and UPR activation are involved in the development of various cancers 27 . ATF6 is an important ER stress sensor, but the regulation of ATF6 by post translation modification is not well understood. Ubiquitin ligases and DUBs add or remove ubiquitin, respectively, from intracellular proteins to regulate their stability and degradation. We analyzed numerous DUBs using the TCGA dataset and found that OTUB1 expression was highly upregulated in bladder cancer patient tumor tissue. An analysis of Oncomine datasets yielded the same conclusion. From survival curve analysis, we found that patients with high OTUB1 expression survived longer compared with those with low expression. To verify our findings, we examined OTUB1 expression by IHC in bladder cancer tissue and, as expected, found OTUB1 to be upregulated in cancer tissue compared with control tissue. To examine whether OTUB1 influences bladder cancer progression, we analyzed the phenotypes of OTUB1‐overexpressing and OTUB1‐deficient bladder cancer cells in vitro. The results demonstrated that OUTB1 promotes cell viability and growth, with a particularly strong effect on cell proliferation.
OTUB1 regulates many cancer‐associated signaling pathways, including the MAPK, epithelial‐mesenchymal transition (EMT) 28 , 29 , mTORC1 30 and P53 pathways, to promote tumor cell survival, proliferation, and invasion. Clinical studies have reported that high OTUB1 expression is associated with several types of cancer, including glioma and colon, gastric, ovarian, breast, and lung cancer 31 . To determine the mechanism of OTUB1 in bladder cancer, we performed RNA‐seq and luciferase screening and found notable changes in signaling pathways related to protein folding, sorting, and degradation in response to changes in OTUB1 biological function. Heatmaps and GSEA confirmed that most genes were downregulated in OTUB1‐deficient cells. The ATF6 pathway was obviously activated in OTUB1‐overexpressing cells, and the transcription of downstream genes was decreased in OTUB1‐deficient cells. We verified the association between OTUB1 and ATF6. Full‐length ATF6 is a membrane‐localized protein, and we detected ATF6 and OTUB1 colocalization in the cytoplasm. We detected that overexpression of OTUB1 stabilizes ATF6 protein levels. D88, C91, and H265 are the catalytic residues in OTUB1 32 , and OTUB1 specifically cleaves K48‐linked polyubiquitin chains. To verify whether these catalytic residues are related to ATF6 deubiquitination, we constructed the catalytic‐inactive C91S mutant plasmid and performed cycloheximide (CHX) chase assays and deubiquitination assay. The results suggest that OTUB1, as a DUB, stabilizes ATF6 protein levels by inhibiting its ubiquitination.
Finally, the in vivo xenograft mouse study results demonstrated that OTUB1 deficiency inhibits tumorigenesis. We generated xenograft mouse models with OTUB1‐deficient T24 cells, however these cells did not form tumors, indicating that OTUB1 plays an important role in bladder cancer development.
In conclusion, our experimental research results showed that OTUB1 is associated with bladder cancer and has a particular effect on cell proliferation. OTUB1 plays a pivotal oncogenic role through deubiquitination of ATF6. Our findings give new insight into the role of OTUB1 in the UPR pathway in bladder cancer, and OTUB1 is a potential target for the treatment of bladder cancer.
CONFLICT OF INTEREST
The authors declare that they have no conflicts of interest to report.
Supporting information
Figure S1
ACKNOWLEDGEMENTS
This work was supported by grants from the National Natural Science Foundation of China (NSFC) (81602450, 81902844) and the Natural Science Foundation of Hunan Province, China (2018JJ3337) and Research Foundation of Education Bureau of Hunan Province (16B161).
Zhang H‐H, Li C, Ren J‐W, et al. OTUB1 facilitates bladder cancer progression by stabilizing ATF6 in response to endoplasmic reticulum stress. Cancer Sci. 2021;112:2199–2209. 10.1111/cas.14876
Hui‐Hui Zhang, Chao Li, Jian‐Wei Ren contributed equally to this work.
Contributor Information
Tao Liu, Email: liutaozaiwuda@whu.edu.cn.
Shang‐Ze Li, Email: shangze.li@whu.edu.cn.
References
- 1. Grayson M. Bladder cancer. Nature. 2017;551(7679):S33. [DOI] [PubMed] [Google Scholar]
- 2. Butt SU, Malik L. Role of immunotherapy in bladder cancer: past, present and future. Cancer Chemother Pharmacol. 2018;81(4):629–645. [DOI] [PubMed] [Google Scholar]
- 3. Charlton ME, Adamo MP, Sun L, Deorah S. Bladder cancer collaborative stage variables and their data quality, usage, and clinical implications: a review of SEER data, 2004‐2010. Cancer. 2014;120:3815‐3825. [DOI] [PMC free article] [PubMed] [Google Scholar]
- 4. Gourd E. Neoadjuvant pembrolizumab in bladder cancer. Lancet Oncol. 2018;19(12):e669. [DOI] [PubMed] [Google Scholar]
- 5. Rosenberg JE, Hoffman‐Censits J, Powles T, et al. Atezolizumab in patients with locally advanced and metastatic urothelial carcinoma who have progressed following treatment with platinum‐based chemotherapy: a single‐arm, multicentre, phase 2 trial. Lancet (London, England). 2016;387(10031):1909–1920. [DOI] [PMC free article] [PubMed] [Google Scholar]
- 6. Walter P, Ron D. The unfolded protein response: from stress pathway to homeostatic regulation. Science (New York, NY). 2011;334(6059):1081–1086. [DOI] [PubMed] [Google Scholar]
- 7. Kozutsumi Y, Segal M, Normington K, Gething MJ, Sambrook J. The presence of malfolded proteins in the endoplasmic reticulum signals the induction of glucose‐regulated proteins. Nature. 1988;332(6163):462–464. [DOI] [PubMed] [Google Scholar]
- 8. Rutkowski DT, Arnold SM, Miller CN, et al. Adaptation to ER stress is mediated by differential stabilities of pro‐survival and pro‐apoptotic mRNAs and proteins. PLoS Biol. 2006;4(11):e374. [DOI] [PMC free article] [PubMed] [Google Scholar]
- 9. Walter F, Schmid J, Düssmann H, Concannon CG, Prehn JH. Imaging of single cell responses to ER stress indicates that the relative dynamics of IRE1/XBP1 and PERK/ATF4 signalling rather than a switch between signalling branches determine cell survival. Cell Death Differ. 2015;22(9):1502–1516. [DOI] [PMC free article] [PubMed] [Google Scholar]
- 10. Carrasco DR, Sukhdeo K, Protopopova M, et al. The differentiation and stress response factor XBP‐1 drives multiple myeloma pathogenesis. Cancer Cell. 2007;11(4):349–360. [DOI] [PMC free article] [PubMed] [Google Scholar]
- 11. Leung‐Hagesteijn C, Erdmann N, Cheung G, et al. Xbp1s‐Negative Tumor B Cells and Pre‐Plasmablasts Mediate Therapeutic Proteasome Inhibitor Resistance in Multiple Myeloma. Cancer Cell. 2015;28(4):541–542. [DOI] [PubMed] [Google Scholar]
- 12. Brewer JW, Hendershot LM, Sherr CJ, Diehl JA. Mammalian unfolded protein response inhibits cyclin D1 translation and cell‐cycle progression. Proc Natl Acad Sci USA. 1999;96(15):8505–8510. [DOI] [PMC free article] [PubMed] [Google Scholar]
- 13. Wu CH, Silvers CR, Messing EM, Lee YF. Bladder cancer extracellular vesicles drive tumorigenesis by inducing the unfolded protein response in endoplasmic reticulum of nonmalignant cells. The Journal of biological chemistry. 2019;294(9):3207–3218. [DOI] [PMC free article] [PubMed] [Google Scholar]
- 14. Haze K, Yoshida H, Yanagi H, Yura T, Mori K. Mammalian transcription factor ATF6 is synthesized as a transmembrane protein and activated by proteolysis in response to endoplasmic reticulum stress. Mol Biol Cell. 1999;10(11):3787–3799. [DOI] [PMC free article] [PubMed] [Google Scholar]
- 15. Shen J, Chen X, Hendershot L, Prywes R. ER stress regulation of ATF6 localization by dissociation of BiP/GRP78 binding and unmasking of Golgi localization signals. Dev Cell. 2002;3(1):99–111. [DOI] [PubMed] [Google Scholar]
- 16. Gomez JA, Tyra HM, DeZwaan‐McCabe D, Olivier AK, Rutkowski DT. Synthetic embryonic lethality upon deletion of the ER cochaperone p58(IPK) and the ER stress sensor ATF6α. Biochem Biophys Res Comm. 2014;443(1):115–119. [DOI] [PMC free article] [PubMed] [Google Scholar]
- 17. Hanaoka M, Ishikawa T, Ishiguro M, et al. Expression of ATF6 as a marker of pre‐cancerous atypical change in ulcerative colitis‐associated colorectal cancer: a potential role in the management of dysplasia. J Gastroenterol. 2018;53(5):631–641. [DOI] [PMC free article] [PubMed] [Google Scholar]
- 18. Coleman OI, Lobner EM, Bierwirth S, et al. Activated ATF6 Induces Intestinal Dysbiosis and Innate Immune Response to Promote Colorectal Tumorigenesis. Gastroenterology. 2018;155(5):1539–52.e12. [DOI] [PubMed] [Google Scholar]
- 19. Hochstrasser M. Origin and function of ubiquitin‐like proteins. Nature. 2009;458(7237):422–429. [DOI] [PMC free article] [PubMed] [Google Scholar]
- 20. Clague MJ, Barsukov I, Coulson JM, Liu H, Rigden DJ, Urbé S. Deubiquitylases from genes to organism. Physiol Rev. 2013;93(3):1289–1315. [DOI] [PubMed] [Google Scholar]
- 21. Edelmann MJ, Iphöfer A, Akutsu M, et al. Structural basis and specificity of human otubain 1‐mediated deubiquitination. Biochem J. 2009;418(2):379–390. [DOI] [PubMed] [Google Scholar]
- 22. Fagerberg L, Hallström BM, Oksvold P, et al. Analysis of the Human Tissue‐specific Expression by Genome‐wide Integration of Transcriptomics and Antibody‐based Proteomics. Mol Cell Proteomics. 2014;13(2):397–406. [DOI] [PMC free article] [PubMed] [Google Scholar]
- 23. Baietti MF, Simicek M, Abbasi Asbagh L, et al. OTUB1 triggers lung cancer development by inhibiting RAS monoubiquitination. EMBO Mol Med. 2016;8(3):288–303. [DOI] [PMC free article] [PubMed] [Google Scholar]
- 24. Karunarathna U, Kongsema M, Zona S, et al. OTUB1 inhibits the ubiquitination and degradation of FOXM1 in breast cancer and epirubicin resistance. Oncogene. 2016;35(11):1433–1444. [DOI] [PMC free article] [PubMed] [Google Scholar]
- 25. Iglesias‐Gato D, Chuan Y‐C, Jiang N, et al. OTUB1 de‐ubiquitinating enzyme promotes prostate cancer cell invasion in vitro and tumorigenesis in vivo. Mol Cancer. 2015;14(1):8. [DOI] [PMC free article] [PubMed] [Google Scholar]
- 26. Du C, Wu H, Leng RP. UBE4B targets phosphorylated p53 at serines 15 and 392 for degradation. Oncotarget. 2015;7(3). [DOI] [PMC free article] [PubMed] [Google Scholar]
- 27. Wang M, Kaufman RJ. The impact of the endoplasmic reticulum protein‐folding environment on cancer development. Nat Rev Cancer. 2014;14(9):581–597. [DOI] [PubMed] [Google Scholar]
- 28. Xu L, Li J, Bao Z, et al. Silencing of OTUB1 inhibits migration of human glioma cells in vitro. Neuropathology : official journal of the Japanese Society of Neuropathology. 2017;37(3):217–226. [DOI] [PubMed] [Google Scholar]
- 29. Bates RC, DeLeo MJ 3rd, Mercurio AM. The epithelial‐mesenchymal transition of colon carcinoma involves expression of IL‐8 and CXCR‐1‐mediated chemotaxis. Exp Cell Res. 2004;299(2):315–324. [DOI] [PubMed] [Google Scholar]
- 30. Zhao L, Wang X, Yu Y, et al. OTUB1 protein suppresses mTOR complex 1 (mTORC1) activity by deubiquitinating the mTORC1 inhibitor DEPTOR. The Journal of biological chemistry. 2018;293(13):4883–4892. [DOI] [PMC free article] [PubMed] [Google Scholar]
- 31. Saldana M, VanderVorst K, Berg AL, Lee H, Carraway KL. Otubain 1: a non‐canonical deubiquitinase with an emerging role in cancer. Endocr Relat Cancer. 2019;26(1):R1–r14. [DOI] [PMC free article] [PubMed] [Google Scholar]
- 32. Balakirev MY, Tcherniuk SO, Jaquinod M, Chroboczek J. Otubains: a new family of cysteine proteases in the ubiquitin pathway. EMBO Rep. 2003;4(5):517–522. [DOI] [PMC free article] [PubMed] [Google Scholar]
Associated Data
This section collects any data citations, data availability statements, or supplementary materials included in this article.
Supplementary Materials
Figure S1


