

Watch a video presentation of this article
Abbreviations
- AADR
age‐adjusted death rate
- ALD
alcoholic liver disease
- CLD
chronic liver disease
- DAA
direct‐acting antiviral therapy
- HBV
hepatitis B virus
- HCV
hepatitis C virus
- IVDU
intravenous drug use
- NAFLD
nonalcoholic fatty liver disease
- NASH
nonalcoholic steatohepatitis
- WHO
World Health Organization
Global Burden of CLD
Cirrhosis is a leading cause of mortality and morbidity across the world. It is the 11th leading cause of death and 15th leading cause of morbidity, accounting for 2.2% of deaths and 1.5% of disability‐adjusted life years worldwide in 2016. 1 CLD caused 1.32 million deaths in 2017, approximately two‐thirds among men and one‐third among women. 2
Historically, viral hepatitis has been the leading etiology for CLD. However, improved prevention strategies (in the case of hepatitis B) and treatment (in the case of hepatitis C) have led to improving CLD trends. This is reflected in global declines that have been observed in liver disease mortality rates over the past 30 years. Specifically, the age‐adjusted death rate (AADR) from CLD has declined from 21 to 16.5 per 100,000 population from 1990 to 2017. 2 , 3 As depicted in Fig. 1, these declines have been most marked for liver disease from hepatitis B infection.
FIG 1.
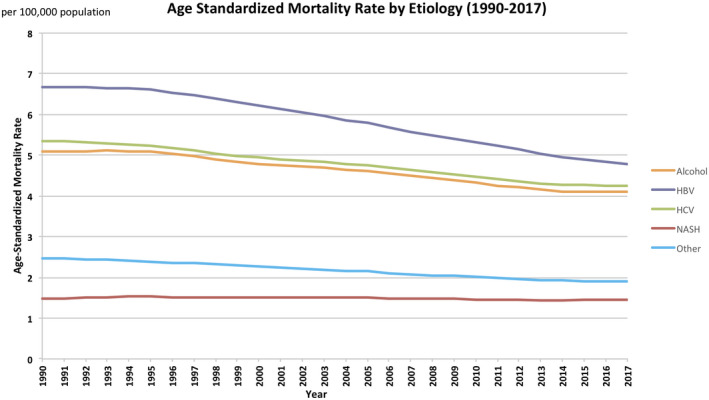
Age‐standardized death rate per 100,000 from cirrhosis, by etiology. 38
Meanwhile, obesity and alcohol consumption, which are common and increasing in many parts of the world, have become key liver disease risk factors. They are anticipated to drive CLD epidemiology going forward and to account for increasing proportions of death in the future, although mortality trends have not yet reflected their impact (Fig. 2).
FIG 2.
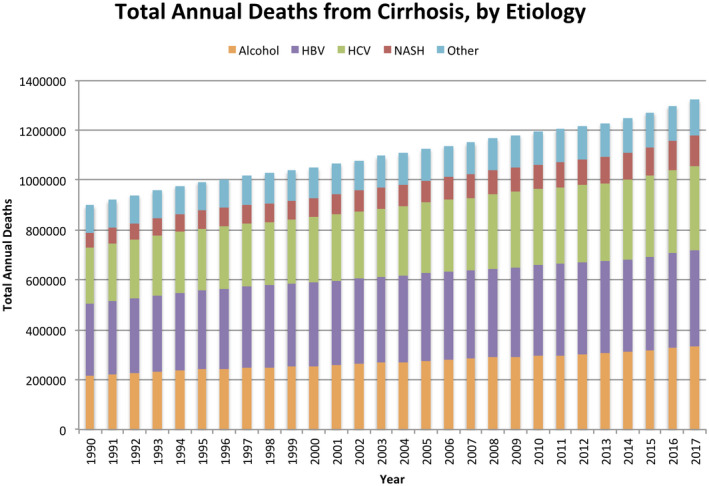
Total global deaths from cirrhosis by year. 38
Temporal Trends in CLD
Reductions in CLD mortality rates vary across regions and reflect country‐specific approaches to viral hepatitis prevention and treatment, as well as trends in IVDU, alcohol consumption, and obesity rates. From 1980 to 2010, mortality significantly declined in countries as varied as China (66% AADR reduction from 43 to 16 per 100,000) and the United States (24% reduction from 15 to 11 per 100,000), largely because of HBV prevention efforts. 3 Meanwhile, other countries have experienced significant mortality reductions but still face persistently high liver disease mortality rates: an example is Egypt with a 26% AADR decline from 98 to 72 per 100,000 largely a result of massive efforts targeting chronic hepatitis C infection and schistosomiasis. 3 Finally, there are regions that have experienced increases in mortality rates. For example, AADR increased by 24% in Mongolia (44‐55 per 100,000) and by 18% in India (17‐20 per 100,000), largely driven by viral hepatitis and in part by increasing alcohol consumption and obesity rates; AADR increased by 64% in Russia (11‐19 per 100,000) and 31% in the United Kingdom (7‐9 per 100,000) largely because of alcohol‐related liver disease. 3
Current Prevalence and Etiologies of CLD
The absolute number of CLD cases (inclusive of any stage of disease severity) is estimated at 1.5 billion worldwide. 4 The most common causes of prevalent disease are NAFLD (59%), followed by HBV (29%), HCV (9%), and ALD (2%) (Table 1). 2 , 5 Other liver diseases, including primary biliary cholangitis, primary sclerosing cholangitis, alpha‐1‐antitrypsin deficiency, Wilson’s disease, and autoimmune hepatitis, account for 1% of cases. An important caveat to these data is that alcohol most likely accounts for a larger proportion of liver disease prevalence and mortality but is underreported by persons and countries because of cultural concerns and is often a secondary (and unreported) liver disease etiology that coexists with viral hepatitis or NAFLD.
TABLE 1.
| Disease | Cirrhosis Deaths, Men | Cirrhosis Deaths, Women |
|---|---|---|
| Hepatitis B | 31.5% | 24.0% |
| Hepatitis C | 25.5% | 26.7% |
| ALD | 27.3% | 20.6% |
| NASH/NAFLD | 7.7% | 11.3% |
| Other* | 8% | 17.3% |
Including cryptogenic, autoimmune, Wilson’s disease, alpha‐1 anti‐trypsin deficiency, and hemochromatosis.
Hepatitis B
There are 257 million people worldwide who are living with chronic HBV. Without proper management, approximately 20% will die early of liver failure or hepatocellular carcinoma. 6 It is estimated that only 11% of infected persons are aware of their infection, and 17% of those receive treatment. 7
Vertical transmission, IVDU, sexual transmission, and nosocomial transmission (use of contaminated medical equipment or blood products) are the main modes of spread. 6 Childhood acquisition represents the highest risk for chronic HBV infection: 80% to 90% of infections acquired within the first year of life and 50% to 60% of infections before age 6 years lead to chronic HBV. 6 In contrast, <5% of infections lead to chronic HBV when acquired during adulthood.
Universal childhood vaccination is key to mitigating HBV’s burden. The World Health Organization (WHO) formally recommended inclusion of the HBV vaccine into universal childhood immunization programs in 1992. Since then, vaccination campaigns have already made an impact as childhood rates of chronic HBV have declined from 4.7% in the prevaccination era to 1.3% in 2015. 6 However, these gains have varied across countries largely related to how early they adopted the HBV vaccine into their universal immunization programs. The Western Pacific region and the Americas have achieved 90% HBV vaccine coverage among children younger than 1 year—a threshold set by the WHO in 2015. Immunization rates in other areas (e.g., Eastern Europe, the African Region, and parts of Southeast Asia) are improving but still lag behind. 8 Barriers in these regions include delays in presentation to health care as a result of the majority of births in these areas occurring outside of the hospital. 6 , 8
Universal vaccine campaigns in addition to improved blood product screening, sterilization of medical equipment, and needle exchange programs have led to a 28% reduction in overall HBV prevalence since 2000. 2 This reduction will likely translate to even more marked reductions in HBV mortality over the next 20 years. Current HBV mortality, however, is driven by adults already with chronic hepatitis B, many of whom are unaware of their diagnosis and have limited access to care. 4 In addition, upswings in IVDU in some parts of the world (e.g., in Russia and Poland) are driving new HBV infections and potentially threaten overall improvements in HBV trends. 6 , 9
Hepatitis C
Globally, 71 million people are infected with chronic HCV, with 51% concentrated in six countries: India, China, Egypt, Russia, United States, and Pakistan. 10 The main routes of HCV transmission are IVDU, nosocomial spread, and to a lesser degree, sexual and vertical transmission. HCV prevalence was stable with declines in some regions from 2000 to 2015, attributed mainly to improved blood product screening. In addition, countries such as Egypt, Iceland, and the Republic of Georgia have been able to reduce HCV mortality through large‐scale HCV screening and treatment intervention. 6 , 11 , 12 , 13 , 14 , 15
Several contemporary trends are worrisome for a growing HCV burden. First, there are more infections (e.g., 1.75 million in 2016) being diagnosed annually than successfully treated. 6 Second, reuse of unsterilized medical equipment and an absence of blood screening programs are persistent problems in several regions, such as India, Pakistan, and parts of Southeast Asia. 6 , 14 Finally, there has been an upswing in IVDU among young adults, particularly in Russia, China, and the United States. 13 , 15
In the absence of effective vaccines, reducing the burden of HCV relies on three approaches: targeting nosocomial spread through improved blood supply screening and medical equipment sterilization, needle exchange programs, and treatment. Treating HCV with direct‐acting antiviral therapies (DAAs) is important both for reducing current infections and preventing new ones, and this is a key part of the WHO’s strategy to eliminate viral hepatitis by 2030. Unfortunately, less than 10% of people infected with HCV have been treated and cured since the introduction of DAAs in 2014. 16 A major barrier has been the high price of DAAs; additional stumbling blocks include the cost and complicated logistics around infection screening and diagnosis, as well as limitations in health services capacity in many countries, leading to failure in linking people with diagnosed HCV infection to treatment. 6 These barriers have affected low‐ and middle‐income countries, which bear an estimated 80% of the world’s HCV burden, as well as high‐income countries, although in different ways. Some low‐ and middle‐income countries have been able to surmount these barriers through generic medication agreements and coordinated government responses. 17 Egypt and Pakistan (both low‐/middle‐income countries) are examples, accounting for nearly half of all people starting DAA treatment in 2016. 18 However, HCV treatment rates lag in most low‐ and middle‐income countries, attributed in part to a lack of political will and/or awareness. Meanwhile, HCV‐infected people living in high‐income countries, where generic medication agreements are not available, have had to grapple with high DAA prices or insurance policies that ration treatment to advanced stages of disease. Ultimately, reducing HCV’s burden requires region‐specific prevention strategies tailored according to the transmission modes most prevalent in that area. Also important are coordinated government responses to create policies and conditions for improved access to HCV treatment.
ALD
When considered as both a primary cause and a cofactor, alcohol accounts for 30% to 50% of cirrhosis‐related deaths globally. 4 , 19 Precise estimates of ALD are difficult to determine because the diagnosis relies on people’s self‐report of alcohol intake, unlike viral hepatitis, which can be determined based on objective testing. Instead, annual per capita alcohol consumption, which is directly related to ALD burden on a population level, is used as a marker of disease trends. For example, per capita alcohol consumption ranges from <1 to 2 L/year in regions where <50% of cirrhosis is alcohol related and 7 to 11 L/year where the attributable fraction is >50%. In 2016, Russia was among the highest alcohol‐consuming countries (12 L/year), followed by the United States (8‐10 L/year) and moderate use in India and China (4‐6 L/year). The Middle East has the lowest consumption rates; Egypt, for instance, consumes <2 L/year. 19 , 20
ALD’s burden is expected to increase based on several indicators. First, global alcohol consumption has increased from 5.4 L/year in 2005 to 6.4 L/year in 2016. Consumption is expected to continue to increase in Southeast Asia, the Western Pacific, and the Americas until 2025. 20 Rising consumption has already impacted China, the United States, and Denmark, all of which have documented a doubling in ALD hospitalizations over the past 10 years. 21 , 22 , 23 Finally, a troubling trend has been a disproportionate increase in alcohol cirrhosis deaths among people younger than 45 years. 24 , 25
Reducing ALD’s burden ultimately means reducing alcohol consumption. The WHO offers guidance to this end through a set of cost‐effective and evidence‐based public health measures for reducing harmful alcohol use called “best buys.” They include increasing alcohol beverage excise taxes, restricting alcohol advertising and sales, enforcing driving under the influence of alcohol, and psychosocial interventions for persons who practice harmful alcohol use. 26 Region‐specific drivers and patterns of alcohol use should tailor which and how these best buys are implemented.
NAFLD
NAFLD has a 24% estimated global prevalence rate, and it is >30% in the Middle East and South America. 27 Up to 59% of NAFLD cases are of the nonalcoholic steatohepatitis (NASH) phenotype, the main disease subtype with risk for fibrotic progression to cirrhosis. 28 Although direct markers of NASH do not exist, obesity and type 2 diabetes are strong clinical risk factors for fibrotic progression, and their population‐level trends provide insight into disease trends. 29 , 30 , 31 , 32 Obesity has increased in nearly all regions of the world since 1975. Obesity rates in the United States are among the highest, estimated at >30%. However, despite obesity prevalence rates <5%, China and India account for a very large proportion of global obesity because of their large populations. Russia, Mexico, and Egypt also have the highest absolute numbers of adults with obesity. 33 , 34
Mathematical modeling studies using current estimates of NAFLD, obesity, and diabetes forecast that the burden of NASH will increase over the next 10 years. These models estimate that the United States will have a 168% increase in decompensated cirrhosis and 178% increase in death related to NAFLD, 35 and that China will have the largest absolute number of NAFLD‐related deaths. 36 Also important to consider is that the simultaneous increase in alcohol consumption in the population potentially has implications for obesity‐related liver disease. Alcohol consumption, even at low‐to‐moderate quantities, has been noted to increase the risk for CLD among obese individuals and also may exacerbate NAFLD progression. 37
Conclusion
CLD is a significant public health concern. NAFLD and ALD are expected to increase given that most of the world is experiencing increasing obesity rates, and many areas are experiencing increasing alcohol consumption. HBV’s burden will most likely decline with greater childhood vaccination coverage; however, it will take time to see its impact, and in the meantime improved diagnosis and better access to treatment are key. Finally, despite the availability of effective treatments, increasing IVDU and breaks in the cascade of care are concerning for an increasing HCV burden. Reducing the impact of CLD requires region‐specific interventions tailored according to local epidemiological trends and specific risk factors.
Key Points
Cirrhosis is a public health problem because it is a leading cause of global mortality and morbidity.
Hepatitis B virus (HBV) burden and mortality are high but are expected to decline because of universal childhood vaccines programs that have scaled up since 2010 but will take 15 to 20 years to see the full effect.
Hepatitis C virus (HCV) rates are increasing, mainly driven by intravenous drug use (IVDU) and persistent iatrogenic exposure.
Nonalcoholic fatty liver disease (NAFLD) and alcoholic liver disease (ALD) will likely increase. Screening for chronic liver disease (CLD) in the population at large and NAFLD in high‐risk groups is key for targeting prevention and treatment strategies.
Country‐specific strategies will need to be tailored to local trends and risk factors.
Potential conflict of interest: M.B. received grants from Intercept, GalMed, and Viking. She has other interest in ebix.
References
- 1. Global Health Estimates. Geneva: World Health Organization; 2016. Available at: https://www.who.int/healthinfo/global_burden_disease/estimates/en/. Accessed June 15, 2020. [Google Scholar]
- 2. Sepanlou SG, Safiri S, Bisignano C, et al. The global, regional, and national burden of cirrhosis by cause in 195 countries and territories, 1990‐2017: a systematic analysis for the Global Burden of Disease Study 2017. Lancet Gastroenterol Hepatol 2020;5:245‐266. [DOI] [PMC free article] [PubMed] [Google Scholar]
- 3. Mokdad AA, Lopez AD, Shahraz S, et al. Liver cirrhosis mortality in 187 countries between 1980 and 2010: a systematic analysis. BMC Med 2014;12:145. [DOI] [PMC free article] [PubMed] [Google Scholar]
- 4. Moon AM, Singal AG, Tapper EB. Contemporary epidemiology of chronic liver disease and cirrhosis. Clin Gastroenterol Hepatol 2020;18:2650‐2666. [DOI] [PMC free article] [PubMed] [Google Scholar]
- 5. Asrani SK, Devarbhavi H, Eaton J, Kamath PS. Burden of liver diseases in the world. J Hepatol 2019;70:151‐171. [DOI] [PubMed] [Google Scholar]
- 6. Global Hepatitis Report 2017. Geneva: World Health Organization; 2017. Licence: CC BY‐NC‐SA 3.0 IGO. Available at: https://www.who.int/hepatitis/publications/global‐hepatitis‐report2017/en/ [Google Scholar]
- 7. Waheed Y, Siddiq M, Jamil Z, Najmi MH. Hepatitis elimination by 2030: progress and challenges. World J Gastroenterol 2018;24:4959‐4961. [DOI] [PMC free article] [PubMed] [Google Scholar]
- 8. McMahon BJ. Meeting the WHO and US goals to eliminate hepatitis B infection by 2030: opportunities and challenges. Clin Liver Dis 2018;12:29‐32. [DOI] [PMC free article] [PubMed] [Google Scholar]
- 9. Ott JJ, Horn J, Krause G, Mikolajczyk RT. Time trends of chronic HBV infection over prior decades – a global analysis. J Hepatol 2017;66:48‐54. [DOI] [PubMed] [Google Scholar]
- 10. The Polaris Observatory HCV Collaborators . Global prevalence and genotype distribution of hepatitis C virus infection in 2015: a modelling study. Lancet Gastroenterol Hepatol 2017;2:161‐176. [DOI] [PubMed] [Google Scholar]
- 11. Sonderup M. The global elimination of hepatitis C? S Afr Med J 2018;108:31‐34. [DOI] [PubMed] [Google Scholar]
- 12. Cooke GS, Andrieux‐Meyer I, Applegate TL, et al. Accelerating the elimination of viral hepatitis: a Lancet Gastroenterology & Hepatology Commission. Lancet Gastroenterol Hepatol 2019;4:135‐184. [DOI] [PubMed] [Google Scholar]
- 13. Degenhardt L, Peacock A, Colledge S, et al. Global prevalence of injecting drug use and sociodemographic characteristics and prevalence of HIV, HBV, and HCV in people who inject drugs: a multistage systematic review. Lancet Glob Health 2017;5:e1192‐e1207. [DOI] [PMC free article] [PubMed] [Google Scholar]
- 14. Lemoine M, Thursz M, Hepatitis C. Hepatitis C, a global issue: access to care and new therapeutic and preventive approaches in resource‐constrained areas. Semin Liver Dis 2014;34:89‐97. [DOI] [PubMed] [Google Scholar]
- 15. Jafri S, Gordon SC. Epidemiology of hepatitis C. Clin Liver Dis 2018;12:140‐142. [DOI] [PMC free article] [PubMed] [Google Scholar]
- 16. Hepatitis C Fact Sheet. Geneva: World Health Organization; 2020. Available at: https://www.who.int/news‐room/fact‐sheets/detail/hepatitis‐c. Published July 27, 2020. Accessed October 2, 2020. [Google Scholar]
- 17. Graham CS. The current status of US and global access to direct‐acting antiviral regimens for hepatitis C virus infection. Clin Liver Dis 2020;16:16‐19. [DOI] [PMC free article] [PubMed] [Google Scholar]
- 18. Progress report on access to hepatitis C treatment—key messages. Geneva: World Health Organization. Available at: https://www.who.int/hepatitis/news‐events/hep‐c‐access‐report‐2018‐key‐messages/en/ [Google Scholar]
- 19. Stein E, Cruz‐Lemini M, Altamirano J, et al. Heavy daily alcohol intake at the population level predicts the weight of alcohol in cirrhosis burden worldwide. J Hepatol 2016;65:998‐1005. [DOI] [PubMed] [Google Scholar]
- 20. World Health Organization . Global status report on alcohol and health 2018. World Health Organization; 2018. Available at: https://apps.who.int/iris/handle/10665/274603. License: CC BY-NC-SA 3.0 IGO. Accessed June 15, 2020. [Google Scholar]
- 21. Huang A, Chang B, Sun Y, et al. Disease spectrum of alcoholic liver disease in Beijing 302 Hospital from 2002 to 2013. Medicine (Baltimore) 2017;96:e6163. [DOI] [PMC free article] [PubMed] [Google Scholar]
- 22. Damgaard Sandahl T. Alcoholic hepatitis. Dan Med J 2014;61:B4755. [PubMed] [Google Scholar]
- 23. Jinjuvadia R, Liangpunsakul S. Trends in alcoholic hepatitis‐related hospitalizations, financial burden, and mortality in the united states. J Clin Gastroenterol 2015. ;49:506‐511. [DOI] [PMC free article] [PubMed] [Google Scholar]
- 24. Kim D, Li AA, Gadiparthi C, et al. Changing trends in etiology‐based annual mortality from chronic liver disease, from 2007 through 2016. Gastroenterology 2018;155:1154‐1163.e3. [DOI] [PMC free article] [PubMed] [Google Scholar]
- 25. Yoon Y‐H, Chen CM. Liver cirrhosis mortality in the United States: national, state, and regional trends, 2000–2015. Bethesda, MD: National Institutes of Health; 2018. Available at: https://pubs.niaaa.nih.gov/publications/surveillance111/Cirr15.htm [Google Scholar]
- 26. The Updated Appendix 3 of the WHO Global NCD Action Plan 2013‐2020. Geneva: World Health Organization; 2017. Available at: https://www.who.int/ncds/management/WHO_Appendix_BestBuys_LS.pdf?ua=1 [Google Scholar]
- 27. Younossi ZM, Koenig AB, Abdelatif D, et al. Global epidemiology of nonalcoholic fatty liver disease: meta‐analytic assessment of prevalence, incidence, and outcomes. Hepatology 2016;64:73‐84. [DOI] [PubMed] [Google Scholar]
- 28. Ekstedt M, Franzén LE, Mathiesen UL, et al. Long‐term follow‐up of patients with NAFLD and elevated liver enzymes. Hepatology 2006;44:865‐873. [DOI] [PubMed] [Google Scholar]
- 29. Mellinger JL. Epidemiology of alcohol use and alcoholic liver disease. Clin Liver Dis 2019;13:136‐139. [DOI] [PMC free article] [PubMed] [Google Scholar]
- 30. Perumpail BJ, Khan MA, Yoo ER, et al. Clinical epidemiology and disease burden of nonalcoholic fatty liver disease. World J Gastroenterol 2017;23:8263‐8276. [DOI] [PMC free article] [PubMed] [Google Scholar]
- 31. Mitra S, De A, Chowdhury A. Epidemiology of non‐alcoholic and alcoholic fatty liver diseases. Transl Gastroenterol Hepatol 2020;5:16. [DOI] [PMC free article] [PubMed] [Google Scholar]
- 32. Younossi ZM, Marchesini G, Pinto‐Cortez H, et al. Epidemiology of nonalcoholic fatty liver disease and nonalcoholic steatohepatitis. Transplantation 2019;103:22‐27. [DOI] [PubMed] [Google Scholar]
- 33. Obesity and Overweight. Geneva: World Health Organization; 2020. Available at: https://www.who.int/news‐room/fact‐sheets/detail/obesity‐and‐overweight. Accessed June 15, 2020. [Google Scholar]
- 34. Ford ND, Patel SA, Narayan KMV. Obesity in low‐ and middle‐income countries: burden, drivers, and emerging challenges. Annu Rev Public Health 2017;38:145‐164. Available at: https://www.who.int/news-room/fact-sheets/detail/obesity-and-overweight. Accessed June 15, 2020. [DOI] [PubMed] [Google Scholar]
- 35. Estes C, Razavi H, Loomba R, et al. Modeling the epidemic of nonalcoholic fatty liver disease demonstrates an exponential increase in burden of disease. Hepatology 2018;67:123‐133. [DOI] [PMC free article] [PubMed] [Google Scholar]
- 36. Estes C, Anstee QM, Arias‐Loste MT, et al. Modeling NAFLD disease burden in China, France, Germany, Italy, Japan, Spain, United Kingdom, and United States for the period 2016‐2030. J Hepatol 2018;69:896‐904. [DOI] [PubMed] [Google Scholar]
- 37. Mahli A, Hellerbrand C. Alcohol and obesity: a dangerous association for fatty liver disease. Dig Dis 2016;34:32‐39. [DOI] [PubMed] [Google Scholar]
- 38. Global Burden of Disease Study 2017. Seattle, WA: Institute for Health Metrics and Evaluation; 2018. Available at: http://ghdx.healthdata.org/gbd‐results‐tool [Google Scholar]