. 2021 May 25;10:e63359. doi: 10.7554/eLife.63359

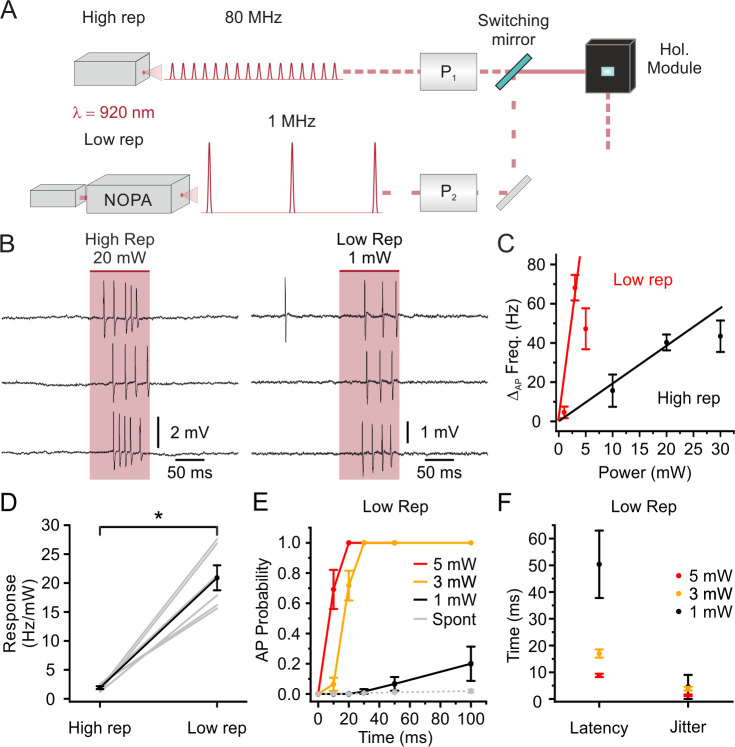
Figure 3. Stimulation with low repetition rate laser sources decreases the average power delivered to the sample while maintaining high stimulation efficiency: principal neurons.

(A) Schematic of the experimental configuration: one high (80 MHz) and one low (1 MHz) repetition rate laser sources are alternated to stimulate the same electrophysiologically recorded cell. Both laser sources are tuned at 920 nm. P1, Pockels cell 1; P2, Pockels cell 2; NOPA, Non- collinear Optical Parametric Amplifier. (B) Representative traces from the same recorded L2/3 pyramidal neuron in vivo showing the effect of holographic stimulation using the high (left, average power: 20 mW) and the low (right, average power: 1 mW) repetition rate laser. (C) Change in AP frequency as a function of average stimulation power. Black indicates results using the high repetition rate laser and red indicates results using the low repetition rate laser. The red and black lines are fitting the values obtained with non-saturating stimulation power (1 and 3 mW for low repetition, 10 and 20 mW for high repetition, respectively). In this as well in the other panels of this figure, n = 6 cells from two mice. (D) Neural response in terms of AP frequency increase per mW of delivered average laser power in the case of stimulation with the high repetition rate laser (High rep) and low repetition rate laser (Low rep). Wilcoxon signed rank test, p=0.031. (E) AP probability as a function of duration in holographic stimulation experiments using low repetition rate on L2/3 pyramidal neurons expressing stCoChR. Red, yellow, and black indicate different average stimulation powers. Grey indicates the spontaneous AP probability in the absence of holographic stimulation. (F) Latency to first AP and jitter of first AP in holographic stimulation experiments using low repetition rate on L2/3 pyramidal neurons expressing stCoChR. Average stimulation power used in the experiments is indicated with the color code.

Figure 3—source data 1. Source data for Figure 3.

Figure 3.

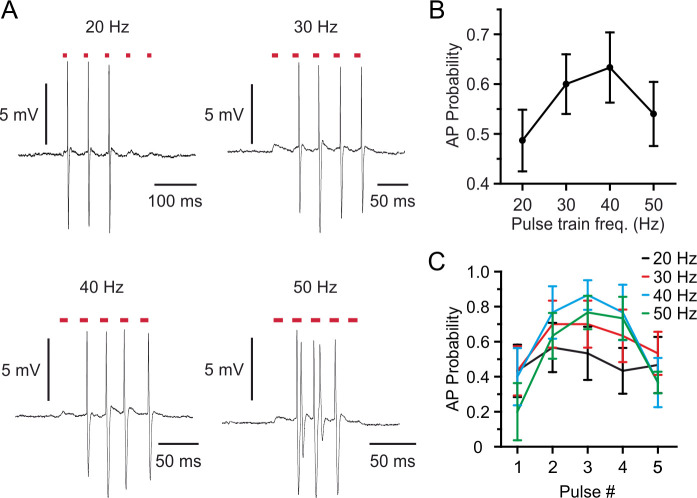
Figure 3—figure supplement 1. Spike control in stCoChR-expressing neurons at different stimulation frequencies.

Figure 3—figure supplement 1.

(A) Representative traces recorded from the same L2/3 pyramidal neuron during two-photon holographic stimulation with a 5-pulses train at different frequency (pulse duration, 10 ms; average power, 5 mW; stimulation frequency, 20–50 Hz). (B) Probability of discharging at least one AP per pulse as a function of the frequency of the stimulation train. n = 6 neurons from three mice. (C) Probability of eliciting APs for each pulse of the stimulation train. n = 6 neurons from three mice.
Figure 3—figure supplement 1—source data 1. Source data_for Figure 3—figure supplement 1.
Figure 3—figure supplement 2. Stimulation with low repetition rate laser sources decreases the average power delivered to the sample while maintaining high stimulation efficiency: somatostatin (SST)-positive interneurons.
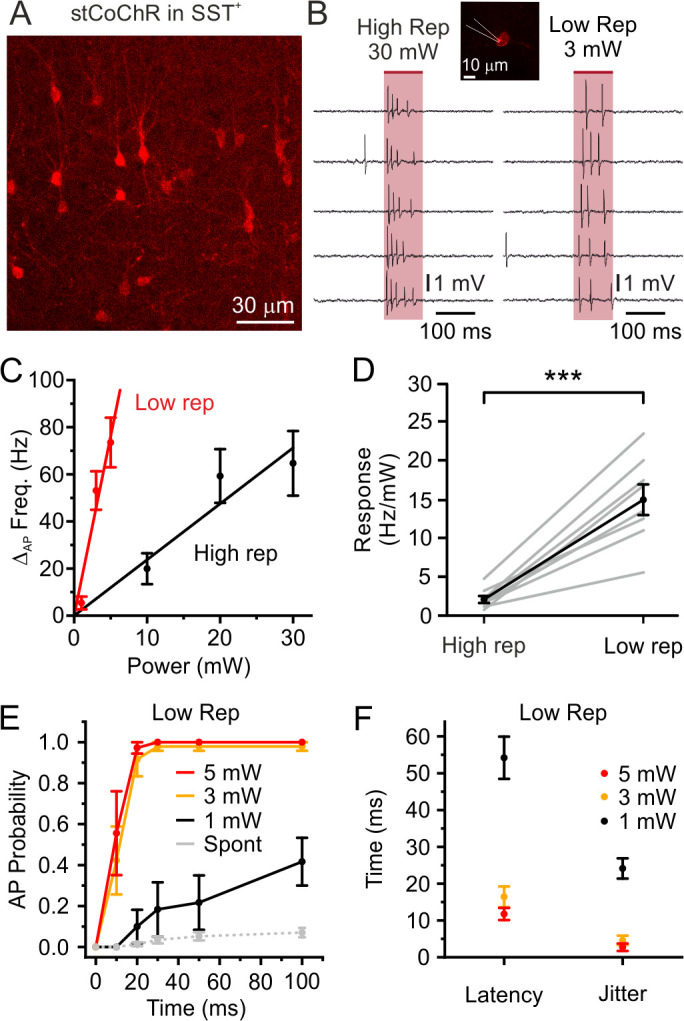
Figure 3—figure supplement 2.

Related to Figure 3. (A) Confocal image showing expression of stCoChR (CoChR-Kv2.1-P2A-mScarlet) in SST-positive (SST+) interneurons. (B) Representative traces from the same electrophysiologically recorded interneuron in vivo showing the effect of holographic stimulation using the high (left, 80 MHz) and the low (right, 1 MHz) repetition rate laser. (C) Change in AP frequency as a function of average stimulation power. Black indicates results using the high repetition rate laser (High rep) and red indicates results using the low repetition rate laser (Low rep); n = 8 cells from four animals. (D) Neural response in terms of AP frequency increase per mW of delivered average laser power in the case of stimulation with the high repetition rate laser (High rep) and low repetition rate laser (Low rep). n = 8 cells from four mice; paired Student’s t-test, p=2E-4. (E) AP probability as a function of time in holographic stimulation in SST-positive interneurons. Red, yellow, and black indicate different average stimulation powers. Gr indicates the spontaneous AP probability in the absence of holographic stimulation. n = 6 cells from two mice. (F) Latency (left) to first AP and jitter (right) of first AP in holographic stimulation experiments on SST-positive interneurons expressing stCoChR. Average stimulation power: 5 mW. n = 10 cells from four mice.
Figure 3—figure supplement 2—source data 1. Source data_for Figure 3—figure supplement 2.
Figure 3—figure supplement 3. Latency and jitter decrease with the average power of low repetition rate stimulation.
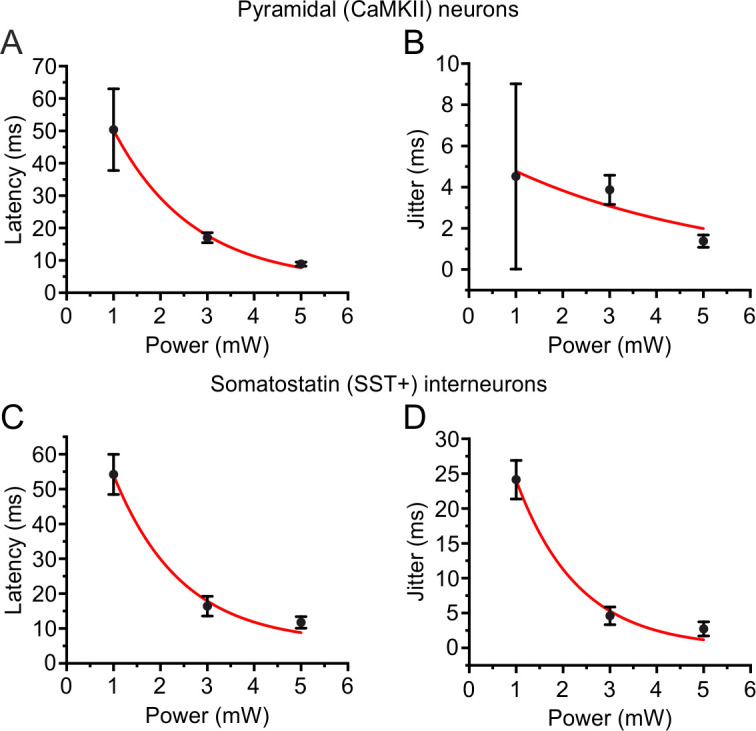
Figure 3—figure supplement 3.

Related to Figure 3. (A) Latency to first AP as a function of the average power of the holographic stimulation with low repetition rate lasers in L2/3 pyramidal neurons. (B) Jitter of first AP as a function of the average power of the holographic stimulation with low repetition rate lasers in L2/3 pyramidal neurons. (C) Same as in (A) but for L2/3 somatostatin-positive interneurons. (D) Same as in (B) but for L2/3 somatostatin-positive interneurons. In A-B, n = 6 cells from two mice; in C-D, n = 10 cells from four mice.
Figure 3—figure supplement 3—source data 1. Source data_for Figure 3—figure supplement 1.