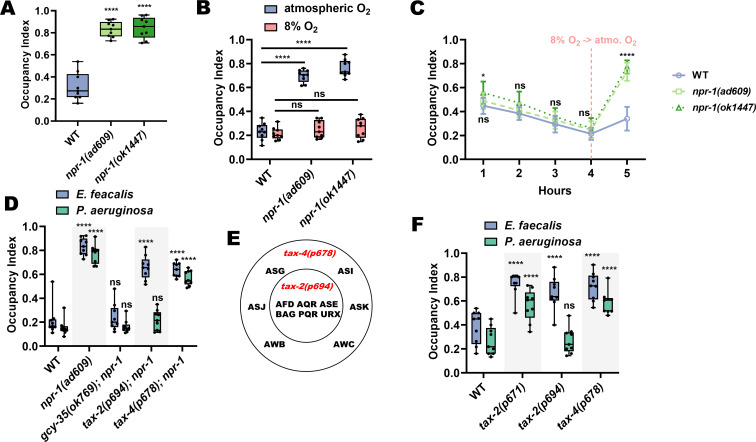
Figure 4. TAX-2/4 pathways regulate avoidance of E. faecalis and P. aeruginosa.
(A) Occupancy index of WT animals compared to npr-1(ad609) and npr-1(ok1447) after 4 hr on E. faecalis. One-way ANOVA with subsequent comparison to WT animals as the control group was performed. (B) Occupancy index of WT, npr-1(ad609) and npr-1(ok1447) on lawns of E. faecalis in atmospheric oxygen or a chamber containing 8% oxygen. Two-way ANOVA with subsequent comparison to WT animals of each respective oxygen condition was performed. (C) Occupancy index of WT, npr-1(ad609), and npr-1(ok1447) in an 8% oxygen chamber at 1, 2, 3, and 4 hr, and 1 hr after removal from the chamber (vertical dashed line). Two-way ANOVA with subsequent comparison at each time point to WT animals was performed. N = 9 for all animals. Points are the mean of each group and error bars are standard deviation. (D) Occupancy index for WT and double loss-of-function mutants for gcy-35, tax-2, or tax-4, and npr-1 on E. faecalis for 4 hr and P. aeruginosa for 24 hr. Two-way ANOVA with subsequent comparisons to WT animals for each bacterium were performed. (E) Diagram of the neurons affected by tax-2(p694) and tax-4(p678). The latter allele covers all tax-2 expressing sensory neurons, while the former covers a subset. (F) Occupancy index for WT and single loss-of-function mutants for tax-2 or tax-4 on E. faecalis for 4 hr and P. aeruginosa for 24 hr. Two-way ANOVA as in with subsequent comparisons to WT animals for each bacterium were performed.


