


Keywords: behavior testing, canonical correlation analysis, gait analysis, Gaussian graphical models, ischemic stroke, magnetic resonance imaging, pig model, principal component analysis
Abstract
Magnetic resonance imaging (MRI) is a clinically relevant, real-time imaging modality that is frequently utilized to assess stroke type and severity. However, specific MRI biomarkers that can be used to predict long-term functional recovery are still a critical need. Consequently, the present study sought to examine the prognostic value of commonly utilized MRI parameters to predict functional outcomes in a porcine model of ischemic stroke. Stroke was induced via permanent middle cerebral artery occlusion. At 24 hours post-stroke, MRI analysis revealed focal ischemic lesions, decreased diffusivity, hemispheric swelling, and white matter degradation. Functional deficits including behavioral abnormalities in open field and novel object exploration as well as spatiotemporal gait impairments were observed at 4 weeks post-stroke. Gaussian graphical models identified specific MRI outputs and functional recovery variables, including white matter integrity and gait performance, that exhibited strong conditional dependencies. Canonical correlation analysis revealed a prognostic relationship between lesion volume and white matter integrity and novel object exploration and gait performance. Consequently, these analyses may also have the potential of predicting patient recovery at chronic time points as pigs and humans share many anatomical similarities (e.g., white matter composition) that have proven to be critical in ischemic stroke pathophysiology. The study was approved by the University of Georgia (UGA) Institutional Animal Care and Use Committee (IACUC; Protocol Number: A2014-07-021-Y3-A11 and 2018-01-029-Y1-A5) on November 22, 2017.
Chinese Library Classification No. R445; R364; R741
Introduction
Projections show that within the next 10 years an additional 3.4 million Americans over the age of 18 will suffer a stroke (Ovbiagele et al., 2013). With limited Food and Drug Administration (FDA)-approved therapies, stroke has quickly become one of the leading causes of long-term disability. Statistics show that > 50% of stroke survivors experience a reduction in mobility of which 25–50% require some degree of assistance and ~50% experience long-term dependency (Benjamin et al., 2019; Miller et al., 2010). Early predictions of long-term functional recovery are therefore critical for determining patient prognosis and realistic rehabilitation goals as well as informing patients and caregivers of potential home adjustments and necessary community support (Kwakkel et al., 2011). Expected functional recovery projections could also be utilized to group patient populations enrolled in clinical trials in order to improve the accuracy in which novel therapeutic interventions are assessed (Young et al., 2005; Menaa, 2013). Neuroimaging modalities including magnetic resonance imaging (MRI) are widely used for diagnosing acute ischemic stroke and could provide important insight into identifying key stroke pathologies that influence optimal post-stroke motor recovery (Campbell et al., 2012).
Multiplanar MRI has significant potential to reliably predict post-stroke recovery as it can provide high-resolution structural information post-stroke. In particular, diffusion tensor imaging (DTI)-derived fractional anisotropy (FA) values have been used to estimate motor function in patients (Puig et al., 2011; Schulz et al., 2012; Groisser et al., 2014). Although differing prediction potentials have been reported between specific stroke phases (e.g., acute, chronic), FA reductions in the subacute phase (24 hours to 5 days post-stroke) have been identified as the best predictor of poor motor outcomes (Puig et al., 2011; Groisser et al., 2014; Jin et al., 2017). Diffusion weighted imaging (DWI) lesion volumes have also been shown to have predictive value when estimating functional outcomes showing strong correlations with the Modified Rankin Scale (mRS) and National Institutes of Health Stroke Scale (NIHSS) scores (Tong et al., 1998; Attyé et al., 2012). These correlations are important as the mRS and NIHSS scales are regularly used in hospitals to assess patients at acute and chronic stroke stages and are themselves gross predictors of motor recovery and mortality (Sun et al., 2014; Kandiah et al., 2016). However, these scales show limited precision in estimating long-term functional deficits. DWI-determined swelling is an independent predictor of poor outcome, with a cerebral swelling ≥ 11 mL identified as the threshold with greatest sensitivity and specificity for predicting poor outcome in patients (Battey et al., 2014). By potentially combining key MRI metrics such as lesion volume and FA, it may be possible to develop a robust model to more accurately predict functional outcomes.
Recently, there have been advances in integrative data analysis as multivariate methods have displayed advantages over univariate methods due to the high dimensionality and latent structure within neuroimaging (Fan et al., 2008; Shamy et al., 2011; Xie et al., 2020) or more specifically, structural MRI datasets (Grosenick et al., 2013; Sabuncu and Van Leemput, 2011). These complex datasets make it possible to relate two separate multivariate patterns such as MRI outcomes (e.g. lesion, swelling) and post-stroke phenotypes. These datasets may be best analyzed with methods such as canonical correlation analysis (CCA), which is closely related to multivariate regression and partial least squares (Avants et al., 2014). CCA can be viewed as identifying basis vectors for two sets of variables such that the correlation between the projections of the variables onto these basis vectors are mutually maximized (Hardoon et al., 2004). The main difference between CCA and other commonly used MRI analytical approaches like partial least squares, principal component analysis (PCA), and independent component analysis is that CCA captures mutual information between datasets (Borga, 1998). Another appropriate statistical approach, a Gaussian graphical model, is based on modeling the precision matrix (i.e., the inverse of the covariance matrix) (Marrelec et al., 2006). Under a Gaussian assumption, zero elements of the precision matrix represent an absence of direct connections. Regularization approaches based on the l1-norm, such as the graphical lasso (GL), allow for identification of the zero elements in the precision matrix. This sparsifies connections and consequently, eliminates indirect functional connections between MRI and recovery variables (Friedman et al., 2008; Vidaurre, 2013). As a result, this sparse network enables interpretation of tissue damage from a functional point of view and thus permits fundamental insights into potential disease biomarkers (Huang et al., 2010; Coloigner et al., 2016).
To further examine these correlations, the present study utilized these multivariate analysis methods in a clinically relevant pig model of ischemic stroke. Pigs exhibit strong similarities to humans in cerebral size, gyrification, vasculature, and white-to-gray matter ratios (Gralla et al., 2006; Kobayashi et al., 2012). Similarities in size enable the use of human MRI modalities leading to higher clinical predictability. Gyrification is a key architectural feature that correlates with cerebral connectivity and the complexity of stroke pathological processes (Sun and Hevner, 2014). Preservation of white-to-gray matter ratios in an animal model is also essential in modeling stroke as white matter (WM) possesses a unique susceptibility to ischemia compared to gray matter due to differences in vascularization (Borowsky and Collins, 1989; Nonaka et al., 2003; Peters et al., 2004). Additional evidence suggests that edema accumulation, which is associated with poor patient outcome, is more prevalent in WM versus gray matter compartments (Stokum et al., 2015). Collectively, these shared neuroanatomical features corroborate the importance of assessing potential MRI biomarkers in a representative animal model to improve the probability of predicting post-stroke functional prognosis in clinical applications.
Therefore, the objective of this study was to utilize GL and sparse CCA to identify potential MRI diagnostic biomarkers that could predict a broader range of stroke severity in terms of functional deficits in a pig middle cerebral artery occlusion (MCAO) model. This study provides novel characterization of the relationships between acute swelling, lesion volumes, diffusivity, and WM damage and quantifiable deficits in novel exploration and gait performance using integrative multivariate analytic techniques. The present study provides compelling evidence that select MRI parameters could serve as a valuable tool to predict longitudinal functional deficits in stroke patients.
Materials and Methods
Animals
All work performed in this study was approved by the University of Georgia (UGA) Institutional Animal Care and Use Committee (IACUC; Protocol Number: A2014-07-021-Y3-A11 and 2018-01-029-Y1-A5) on November 22, 2017 and in accordance with the National Institutes of Health Guide for the Care and Use of Laboratory Animals guidelines. The minimum sample size for this study was determined by a power calculation based on our routine use of the MCAO model with lesion volume changes by MRI imaging being the primary endpoint. The power analysis was calculated using a two-tailed anlysis of variance test, α = 0.05, and an 80% power of detection effect size of 1.19 and a standard deviation of 44.63. A total of 11 animals were included in this study. Specifically, five sexually mature, castrated male Landrace pigs (body weight 72–104 kg, aged 5–6 months) as well as four sexually mature, castrated male and two ovariectomized female Yucatan miniature pigs (body weight 68–98 kg, aged ≥ 1 years) were purchased from the University of Georgia Swine Unit and Exemplar Genetics, respectively. Pigs were individually housed in a Public Health Service and Association for Assessment and Accreditation of Laboratory Animal Care approved facility at a room temperature approximately 27°C with a 12-hour light/dark cycle. Pigs were given access to water and fed standard UGA grower 1 diets with provision of enrichment through daily human contact and toys.
MCAO surgical procedures
All pigs were administered antibiotics (ceftiofur crystalline free acid, 5 mg/kg intramuscular (IM) in the cervical muscle groups, Zoetis, Parsippany, NJ, USA) and analgesia (Fentanyl patch, 100 mg/kg per hour. transdermal along the thoracic vertebrae, Mayne Pharma, Salisbury, Australia) the day prior to MCAO induction. Two pigs were randomly assigned to each surgical day. Pre-operative analgesia and sedation were administered to facilitate intubation (xylazine, 2 mg/kg, IM, VetOne, Boise, ID, USA; midazolam, 0.2 mg/kg, IM, Heritage, Eatontown, NJ, USA; propofol, to effect (0–4 mL) intravenously (IV) in the lateral auricular vein, Zoetis; prophylactic 2% lidocaine, 1.0 mL topically to the laryngeal folds, VetOne). Anesthesia was maintained (1.0–2% isoflurane, Abbott Laboratories, Chicago, IL, USA) in oxygen and air with vitals including temperature, respiration, heart rate, and blood pressure continuously monitored and maintained within normal parameters.
Ischemic stroke was induced via permanent right-sided MCAO as previously described (Additional Figure 1 (700.9KB, tif) ) (Platt et al., 2014). In short, an incision from the auricle to the orbit was made. The temporal fascia and muscle were elevated to permit resection of the zygomatic arch. Utilizing a craniotome air drill (3M C100), a craniectomy exposed the local dura mater and the distal middle cerebral artery (MCA). The MCA and associated branches were permanently occluded using bipolar cautery forceps while the exposed cerebrum was covered with sterile biograft made of porcine small intestine submucosa (MatriStem, ACell, Columbia, MD, USA). The temporalis muscle and epidermis were re-apposed and anesthesia was discontinued. The mean surgery time was 2 hours per pig with no intraoperative mortality observed. Once extubated, pigs were monitored every 15 minutes until vitals (temperature, heart rate, and respiratory rate) returned to normal parameters; every 4 hours for 24 hours; and every 12 hours thereafter until epidermal sutures were removed approximately 10 days post-surgery. Like patients, all animals demonstrated thermoregulation abnormalities, elevated heart/respiration rates, and the inability to independently ambulate or feed within the first 24 hours post-stroke. Banamine (2.2 mg/kg, IM; Merck) was utilized every 12 hours for the first 24 hours and every 24 hours for 72 hours post-stroke for post-operative pain and fever management.
MRI acquisition and analysis
MRI was performed 24 hours post-stroke on a Siemens (Erlangen, Germany) or General Electric (Boston, MA, USA) 3.0 Tesla Magnetom Avanto system (Additional Table 1). Utilizing the previously described surgical anesthesia protocol, MRI was performed with pigs positioned in supine recumbency. Standard multiplanar sequences were acquired including T2 fluid attenuated inversion recovery, T2 weighted (T2W), DWI, apparent diffusion coefficient (ADC), DTI, and FA. All sequences were analyzed using Osirix software (Version 10.0.5, Pixmeo, Bernex, Switzerland) at default thresholds.
Additional Table 1.
Magnetic resonance imaging collection protocol
| Siemens | General Electric | |||||||
|---|---|---|---|---|---|---|---|---|
| T2FLAIR | T2W | DWI/ADC | DTI/FA | T2FLAIR | T2W | DWI/ADC | DTI/FA | |
| Slice thickness (mm) | 3 | 3 | 3.5 | 4 | 3 | 3 | 3 | 2 |
| FOV (mm) | 200 | 200 | 202 | 200 | 20 | 20 | 26.6 | 25.6 |
| TR | 9070 | 115 | 4644 | 3400 | 9072 | 6260 | 6000 | 10000 |
| TE | 97 | 6260 | 97 | 92 | 120 | 124 | 96.1 | 99.2 |
| B-value 1 (s/mm2) | N/A | N/A | 0 | 0 | N/A | N/A | 0 | 0 |
| B-value 2 (s/mm2) | N/A | N/A | 500 | 1000 | N/A | N/A | 1000 | 1000 |
| B-value 3 (s/mm2) | N/A | N/A | 1000 | N/A | N/A | N/A | 10000 | N/A |
Magnetic resonance imaging was performed 24 hours post-stroke on a Siemens or General Electric 3.0 Tesla Magnetom Avanto system according the following parameters. ADC: apparent diffusion coefficient; DTI: diffusion tensor imaging; DWI: diffusion weighted imaging; FA: fractional anisotropy; FOV: field-of-view; TE: echo time; TR: repetition time; T2FLAIR: T2 fluid attenuated inversion recovery; T2W: T2 weighted.
To confirm the presence of ischemic stroke, hyperintense regions of interest (ROI) in T2 fluid attenuated inversion recovery and DWI sequences were compared to hypointense ROIs in ADC maps. Ischemic infarction often spanned from the most caudal aspect of the frontal lobe to significant areas of the temporal lobe and to regions of the parietal and occipital lobes. Changes in diffusivity were assessed via DWI-derived ADC maps. ADC hypointense ROIs in the ipsilateral hemisphere were identified and an identical ROI was directly copied to the contralateral hemisphere for each axial slice. The mean ADC values of the ipsilateral and contralateral hemispheres were compared and reported as a percent change from contralateral.
Hemisphere volumes were calculated using T2W sequences for each axial slice by manually outlining the ipsilateral and contralateral hemispheres. To control for the space-occupying effect of brain edema, ischemic lesion volumes were calculated via DWI-generated ADC maps as previously described by Gerriets et al (Gerriets et al., 2004). Corrected lesion volumes were calculated according to the following formula modified from Loubinoux et al. where LVc and LVu indicate corrected and uncorrected lesion volume, respectively, and HVc and HVi indicate volume of the contralateral and ipsilateral hemisphere, respectively (Loubinoux et al., 1997):
LVc= HVC+HVi–(HVC+HVi–LVu)·(HVC+HVi)/2HVC
DTI-derived FA maps were utilized to evaluate changes in WM integrity. FA values of the internal capsules (ICs) and corpus callosum (CC) were calculated on the same representative slice per pig and were expressed as a percent change in the ipsilateral hemisphere relative to the contralateral hemisphere.
Gait analysis
Gait data was collected using an automated GAITRite® pressure-sensitive mat (CIR Systems, Franklin, NJ, USA) to assess changes in motor function. The mat was 7.01 × 0.85 m2 with an active area of 6.10 × 0.61 m2 (480 × 48 sensors). At 2 weeks prior to stroke induction, pigs were trained to ambulate across the gait mat at a consistent, 2-beat pace. Once trained, pre-stroke gait data was collected on 3 separate days for each pig and averaged together. Gait data was then collected 4 weeks post-stroke and was represented as a percent change relative to each pig’s pre-stroke performance to control for individual variability.
Gait data was semi-automatically analyzed using GAITFour® Software (Version 4.9X9i, CIR Systems) to provide quantitative measurements of the left front (LF), right front (RF), left hind (LH), and right hind (RH) limbs. Additional measurements were specifically quantified for the hemiparetic front left limb as quadrupeds inherently distribute approximately 60% of their body weight to the forelimbs (versus 40% to the hindlimbs) and the contralateral side of the body (relative to the MCAO) is generally the most affected post-stroke.
Behavior testing
As an additional measure of functional outcome, pigs underwent open field (OF) and novel object recognition (NOR) behavior testing pre- and 4 weeks post-stroke. Behavior testing took place in a 2.7 × 2.7 m2 arena and curtains were hung around the perimeter to reduce visual distractions. All trials were automatically recorded using EthoVision video tracking software (Version 11.5, Noldus Systems, Wageningen, Netherlands) to obtain objective and quantifiable measures of behavioral characteristics including velocity, distance traveled, and object exploration. For NOR testing, personnel secured two similar objects in the open field arena and allowed pigs to explore the objects. Pigs were then removed from the arena for a 10-minute inter-phase interval, while one of the similar objects was replaced with a novel object (NO). Finally, pigs were returned to the arena and exploration of the familiar and NOs was recorded.
Study design
All endpoints and functional measurements were prospectively planned and underwent blinded analysis. Predefined exclusion criteria from all endpoints included instances of infection at the incision site, self-inflicted injuries that required euthanasia, uncontrolled seizure activity, and/or respiratory distress. 20% of pigs met the predefined exclusion criteria and were euthanized prior to the conclusion of the study. Pigs were euthanized at the conclusion of the study via lethal IV injection of euthanasia solution (1 mL/4.5 kg; VetOne; pentobarbital sodium and phenytoin sodium). No outliers were removed from the data.
Statistical analysis
Gaussian graphical models and CCA were used to evaluate the predictive relationship between MRI and functional recovery parameters (Table 1) (Hotelling, 1936; Whittaker, 1991). R statistical software (Version 3.6.2, R Core Team, , Vienna, Austria) was used for all analyses. First, unsupervised dimension reduction (i.e., MRI biomarkers were not utilized to guide the dimension reduction) was performed for the gait variables as some gait parameters inherently measured similar motor deficits, thus resulting in highly correlated and redundant variables. Specifically, stride length, stance time, and cycle time showed an exceptionally high degree of correlation among the four paw measurements. In addition, stance time was nearly perfectly correlated with cycle time and therefore, stance time was dropped from the analysis. Stride length and cycle time were averaged across the fore and hind limbs.
Table 1.
Definitions of assessed magnetic resonance and functional outcome variables
| Abbreviation | Variable | Description |
|---|---|---|
| Swelling %Lesion |
Right hemisphere volume (cm3)/left hemisphere volume (cm3) Lesion volume (cm3)/right hemisphere volume (cm3) |
Change in hemisphere volume as assessed by T2 weighted sequences Portion of the ipsilateral hemisphere affected by lesion as assessed by T2 weighted and diffusion weighted imaging sequences |
| ΔADC | Mean ADC value of the right hemisphere/mean ADC value of the left hemisphere | Change in diffusivity as assessed by apparent diffusion coefficient (ADC) maps |
| ΔCC FA | Mean fractional anisotropy (FA) value of the right corpus callosum/ mean FA value of the left corpus callosum | Change in white matter integrity as assessed by FA maps |
| RCC FA | FA value of the right corpus callosum | White matter integrity as assessed by FA maps |
| LCC FA | FA value of the left corpus callosum | White matter integrity as assessed by FA maps |
| ΔIC FA | Mean FA value of the right internal capsule/mean FA value of the leftinternal capsule | Change in white matter integrity as assessed by FA maps |
| RIC FA | FA value of the right internal capsule | White matter integrity as assessed by FA maps |
| LIC FA | FA value of the left internal capsule | White matter integrity as assessed by FA map |
| Distance traveled | Distance traveled (m) | Distance traveled during open field (OF) testing as assessed by Ethovision XT software |
| Velocity | Distance traveled (m)/time (s) | Velocity during OF testing as assessed by Ethovision XT software |
| %Exploration | (Time pig spent exploring (s)/time pig spent not exploring (s) ) × 100% | Percentage of time spent exploring during OF testing as assessed by Ethovision XT software |
| NO exploration | (Time pig spent exploring the novel object (NO) (s)/total time pig spent exploring objects (s) ) ,!× 100% | Percentage of time spent exploring the NO during novel object recognition testing as assessed by Ethovision XT software |
| NO visits | Number of instances the NO is explored | The cumulative number of instances the NO was investigated during NOR testing as assessed by Ethovision XT software |
| FO exploration | (Time pig spent exploring the familiar object (FO) (s)/total time pig spent exploring objects (s) ) × 100% | Percentage of time spent exploring the FO during novel object recognition testing as assessed by Ethovision XT software |
| FO visits | Number of instances the FO is explored | The cumulative number of instances the FO was investigated during NOR testing as assessed by Ethovision XT software |
| Velocity | Distance traveled (cm)/ambulation time (s) | As assessed by GAITFour® software |
| Cadence | Number of strides/time (min) | As assessed by GAITFour® software |
| Step length | Length (cm) between the heel center of the current hoof print to the heel center of the previous hoof print on the opposite hoof (i.e., left front to right front, right hind to left hind) | As assessed by GAITFour® software |
| Stride length | Length (cm) between the heel points of two consecutive hoof prints of the same hoof (i.e., left front to left front, right hind to right hind) | As assessed by GAITFour® software |
| Swing time | The swing phase is the non-weight-bearing portion of each gait cycle; the time elapsed (s) between the last contact and the first contact of one identified hoof | As assessed by GAITFour® software |
| Stance time | The stance phase is the weight-bearing portion of each gait cycle; the time elapsed (s) between the firstcontact and the last contact of one identified hoof | As assessed by GAITFour® software |
| #Sensors | Number of sensors activated by contact of each hoof | As assessed by GAITFour® software |
| TSP | Total scaled pressure shows sum of peak pressure values (arbitrary units) recorded from each activated sensor by a hoof during gait mat contact | As assessed by GAITFour® software |
| Hind reach | Length (cm) measured from the heel center of the hind hoof to the heel center of the previous forehoof onthe same side (i.e., left hind to previous left front) | As assessed by GAITFour® software |
| %TPI | Total pressure index shows weight distribution (%) of all four hooves | As assessed by GAITFour® software |
| Cycle time | Time elapsed (s) between the first contacts of two consecutive hoof strikes of the same hoof (i.e., left front to left front) | As assessed by GAITFour® software |
Following simple dimension reduction, PCA was employed to further consolidate the gait variables. The principal component (PC) loadings from PCA were used to construct linear combinations of the original gait variables (gait PC variables) that retained a large proportion of the total variation. The gait PC variables were interpreted as latent variables describing the dominant modes of variation within the data with the first five gait PCs accounting for 95.54% of the total variation. These gait PC variables were used in both GL and sparse CCA analyses rather than the original gait variables. The gait PCs were interpreted by examining the correlations between each of the original gait variables with each of the five gait PC variables (Additional Table 2). The variables that were highly correlated with a gait PC contributed most to the mode of variation captured by the gait PC. These correlations were used to interpret how post-stroke tissue-level injury impacted the mode of variation captured by a gait PC.
Additional Table 2.
Correlation between the original gait parameters and gait principal component variables
| Variable | Gait PC1 | Gait PC2 | Gait PC3 | Gait PC4 | Gait PC5 |
|---|---|---|---|---|---|
| Velocity | -0.96 | -0.02 | -0.24 | 0.07 | 0.04 |
| Cadence | -0.94 | 0.12 | -0.27 | -0.05 | 0.06 |
| Cycle time | 0.94 | -0.06 | 0.32 | 0.06 | 0.04 |
| Stride length | -0.90 | -0.28 | -0.17 | 0.24 | -0.13 |
| Hind reach | |||||
| L | 0.85 | -0.13 | -0.30 | 0.04 | 0.09 |
| R | 0.77 | -0.08 | -0.34 | 0.31 | -0.03 |
| Step length | |||||
| LF | -0.88 | -0.38 | -0.14 | 0.21 | -0.12 |
| RF | -0.90 | -0.21 | -0.21 | 0.26 | -0.16 |
| LH | -0.85 | -0.41 | -0.14 | 0.07 | -0.04 |
| RH | -0.87 | -0.13 | -0.20 | 0.36 | -0.19 |
| Swing time | |||||
| LF | 0.66 | -0.44 | 0.52 | 0.25 | 0.03 |
| RF | 0.77 | -0.22 | 0.45 | 0.21 | -0.29 |
| LH | 0.90 | -0.29 | 0.16 | 0.23 | -0.09 |
| RH | 0.80 | -0.30 | 0.23 | 0.20 | -0.37 |
| #Sensors | |||||
| LF | -0.62 | -0.47 | 0.46 | -0.03 | 0.39 |
| RF | -0.73 | -0.49 | 0.17 | -0.23 | 0.07 |
| LH | -0.70 | 0.42 | 0.48 | -0.26 | -0.00 |
| RH | 0.56 | 0.34 | 0.35 | 0.61 | 0.06 |
| TSP | |||||
| LF | -0.80 | -0.35 | 0.48 | 0.05 | 0.01 |
| RF | -0.88 | -0.44 | 0.10 | -0.04 | -0.08 |
| LH | -0.82 | 0.22 | 0.47 | -0.13 | -0.16 |
| RH | -0.78 | 0.14 | 0.32 | 0.50 | 0.06 |
| %TPI | |||||
| LF | 0.37 | -0.72 | 0.49 | -0.06 | 0.15 |
| RF | 0.04 | -0.73 | -0.60 | -0.24 | -0.03 |
| LH | -0.40 | 0.67 | 0.34 | -0.43 | -0.25 |
| RH | 0.15 | 0.51 | -0.16 | 0.78 | 0.20 |
The relative correlations between the original gait variables and the gait PC variables can aid in interpreting the modes of variation captured by each PC. PC1 is highly correlated with velocity, cadence, cycle time, and stride length, and moderately correlated with many others. The large number of variables correlated with PC1 suggests it is capturing general aspects of movement, such as the size of an animal's steps and how quickly it is walking. PC2 is most correlated with the total pressure index (%TPI) followed by number of sensors (%sensors). The front paws are negatively correlated with PC2 and the hind paws are positively correlated, suggesting that PC2 is capturing a shift in the distribution of weight between the front and hind. PC3 is most correlated with %TPI of the right front (RF), followed by several variables measured from the left front (LF) and left hind (LH) paws. The correlation with %TPI RF is in the opposite direction as the others, suggesting that PC3 captures a shift in the distribution of weight between the left and right sides. Gait PC4 is positively correlated with %TPI, #sensors, and total scaled pressure (TSP) measured on the right hind (RH) paw, suggesting it is capturing how weight is distributed onto that paw. Gait PC5 is only moderately correlated with #sensors LF and swing time of the right paws; it may be capturing variability in the length of time animals take to move their right-side limbs.
Gaussian graphical models described the conditional dependence between two variables, given all the others. Under a Gaussian assumption, the inverse covariance matrix, or the precision matrix, contained information regarding the conditional dependencies among variables. Variables corresponding to zero elements in the precision matrix were conditionally independent given the other variables, whereas variables corresponding to nonzero elements in the precision matrix were conditionally dependent given the others. The GL (Friedman et al., 2008), a regularized version of the Gaussian graphical model, was implemented in the R package “glasso” (R package version 1.10, , Stanford, CA, USA). This method produced a sparse estimate of the precision matrix, thus identifying which variables were conditionally dependent versus independent. Here, conditional independence did not imply marginal independence (i.e., a sparse covariance matrix).
While the GL involved the inverse covariance matrix and addressed conditional dependencies between variables, CCA involved the covariance matrix and addressed marginal dependencies among variables. CCA was utilized to characterize the relationship between MRI parameters (X) and functional recovery (Y) by finding linear combinations Xu and Yv such that the correlation ρ = Cor (Xu, Yv) was maximized. The solution to CCA required the singular value decomposition of the matrix:

where  , and
, and  denoted the sample within- and between-covariance matrices of X and Y, respectively. Because the total number of variables in our analysis exceeded the sample size, it was necessary to use a regularized version of CCA. Specifically, the sparse CCA method of Witten et al. (2009) was employed in the R package “Penalized Multivariate Analysis” (R Core Team, 2019). This method standardized X and Y and assumed
  and were identity matrices, which was equivalent to working with the sample correlation matrix between X and Y. Furthermore, this sparse CCA method incorporated sparsity constraints into the singular value decomposition of the sample correlation matrix:

The final estimates produced by sparse CCA were two vectors û and vˆ in which a large proportion of the elements were estimated as zero. In the present analysis, the estimate û was applied to construct a linear combination Xû, which was interpreted as a composite MRI score. As the vector was sparse, the MRI score utilized information only from the most relevant biomarkers. Similarly, the estimate vˆ was used to construct a linear combination Yvˆ, which was interpreted as a composite recovery score utilizing only the most important variables relevant to the pattern of recovery. By construction, the correlation between Xû and Yvˆ was maximized and therefore the MRI score possessed strong predictive capacity for the functional recovery score. The sparse CCA method was utilized to rank the variables according to importance as defined by the number of instances in which the variable was selected (i.e., the canonical vector loading was nonzero) as the amount of regularization was adjusted to achieve a variety of levels of sparsity.
Results
MCAO induces acute ischemic infarction, decreases diffusivity, and WM loss with chronic decreases in exploratory behavior and motor function
To characterize and confirm ischemic stroke pathology, MRI was performed 24 hours post-stroke. T2W images revealed the formation of hyperintense lesions (Figure 1A, white arrows), increased hemispheric swelling, and midline shift. T2F (Figure 1B) and DWI (Figure 1C) sequences exhibited territorial hyperintense lesions (white arrows), while corresponding hypointense lesions indicative of restricted diffusion and cytotoxic edema were observed on ADC maps (Figure 1D), white arrow), thus confirming ischemic stroke. FA maps (Figure 1E) derived from DTI sequences revealed a loss of WM integrity in the right IC and CC (white arrows).
Figure 1.
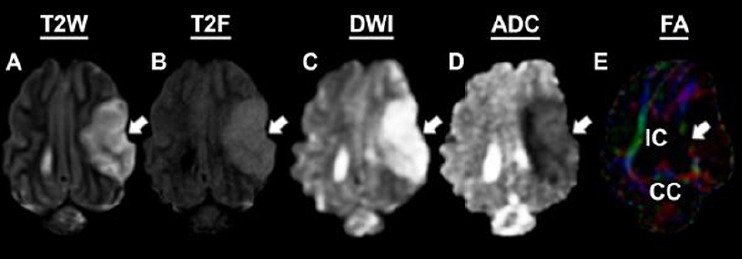
Magnetic resonance imaging confirms permanent middle cerebral artery occlusion results in ischemic stroke.
Pathological changes including hyperintense lesion formation was observed in T2 weighted (T2W; A), T2 fluid attenuated inversion recovery (T2F; B), and diffision weighted imaging (DWI; C) sequences (white arrows). Corresponding hypointensities indicative of decreased diffusivity and cytotoxic edema were observed on apparent diffusion coefficient (ADC; D) maps (white arrow). Loss of white matter integrity was observed in the internal capsule (IC; white arrow) and corpus callosum (CC) utilizing fractional anisotropy (FA) maps (E).
Open field testing revealed a decrease in distance traveled and velocity between pre- (Figure 2A) and 4 weeks post-stroke (Figure 2B). Differences in NOR performance were observed as pigs spent more time exploring the NO (yellow circle) compared to the familiar object (pink circle) pre-stroke (Figure 2C) compared to post-stroke (Figure 2D). Key spatiotemporal gait parameters were collected using a pressure mat pre- (Figure 2E) and 4 weeks post-stroke to detect potential impairments in left front (blue circle), right front (red circle), left hind (green circle), and right hind (black circle)motor function. Deficits in the measured gait parameters indicated stroke led to substantial motor impairments in pigs.
Figure 2.
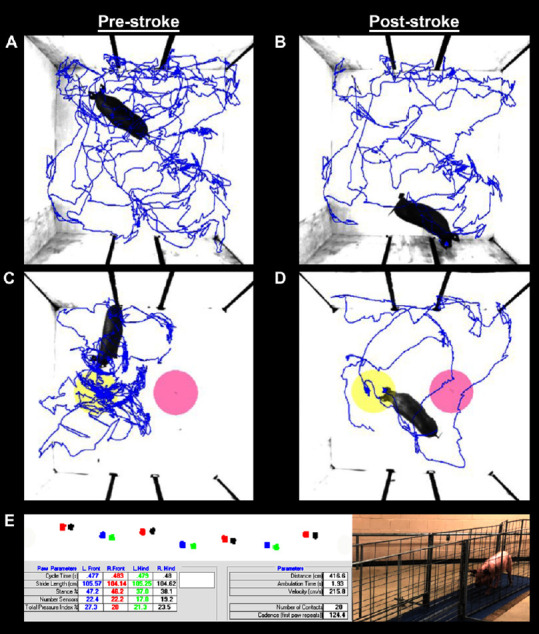
Ischemic stroke results in functional impairments as assessed by behavior testing and spatiotemporal gait analysis.
Ethovision XT tracking software was utilized during open field (OF; A and B) and novel object recognition (NOR; C and D) testing to automatically assess differences in distance traveled, velocity, moving percent, and exploration of novel (yellow circles) and familiar objects (pink circles); representative movement tracings (blue lines) are shown pre- (A and C) and post-stroke (B and D). Additional motor function data was automatically analyzed using GAITFour® software to provide quantitative measurements of 36 gait variables; representative gait tracings shown for the left front (blue circles), right front (red circles), left hind (green circles), right hind (black circles) hooves (E).
GL analysis reveals acute WM integrity has the strongest conditional dependency with chronic recovery parameters
To investigate whether any of the gait parameters could be eliminated due to highly overlapping information, Pearson correlations between the gait parameters were calculated. A heatmap including the gait variables (Figure 3) stride length, stance time, and cycle time showed an exceptionally high degree of correlation among the four paw measurements. Stance time was dropped from the analysis and stride length, stance time, and cycle time were averaged across the four limbs. Even after eliminating a subset of redundant gait parameters from the originally assessed 36 variables, an additional reduction step was required for gait to be included in GL and CCA as the number of gait parameters was more than two times the sample size. To consolidate, yet still capture the complexity of these gait variables, PCA was performed and gait PC1-5 were used in downstream GL and CCA.
Figure 3.

Heat map of Pearson correlations between gait variables.
Gait parameters exhibited a high degree of overlapping information, as indicated by the presence of many large magnitude Pearson correlations. Overlapping information is caused by small variability across the four paws (e.g., cycle time) or redundancy between parameters (e.g., stance time with cycle time). %TPI: Total pressure index; TSP: total scaled pressure; LF: left front; LH: left hind; RF: right front; RH: right hind.
GL analysis was performed to determine which MRI parameters evaluated at 24 hours showed dependent relationships with functional outcomes captured at 4 weeks post-stroke. The results from GL analysis were represented as a network in which conditionally dependent variables share a line, while conditionally independent variables do not. The GL utilized a regularization parameter λ that controlled the number of connections in the network; larger values of λ resulted in fewer connections, while smaller values resulted in more connections. GL analysis at λ = 0.600 showed dependent relationships between MRI and functional outcomes (pink lines) between % lesion and NO visits and gait PC5; ΔIC FA and gait PC3; RCC FA and gait PC4; and LCC FA and gait PC3 (Figure 4A). Interestingly, 24-hour WM FA parameters showed the largest number of dependent connections with 4-week functional outcomes. Upon increasing the tuning parameter to λ = 0.616 (Figure 4B) and 0.640 (Figure 4C), a decreasing number of dependent relationships were observed with the ΔIC FA showing the strongest dependent relationship with gait PC3 at λ = 0.820 (Figure 4D).
Figure 4.

Estimated precision matrix visualized as a network for a sequence of values of the graphical lasso regularization parameter λ.
Connections among magnetic resonance imaging variables 24 hours post-stroke (green lines). Connections among behavior and gait variables 4 weeks post-stroke (blue lines). Connections between MRI variables and behavior and gait variables across time points (pink lines). λ = 0.600 (A), 0.616 (B), 0.640 (C), 0.820 (D). See Table 1 for definitions of assessed magnetic resonance and functional outcome variables.
GL analysis also showed several conditionally dependent relationships between MRI parameters at 24 hours (green lines) and functional outcomes at 4 weeks post-stroke (Figure 4A–D; blue lines). At the highest tuning parameter level of λ = 0.820, MRI parameters showed dependent relationships between ΔCC FA and LCC FA, while functional outcomes showed dependent relationships between of distance traveled, velocity, and %exploration (Figure 4D).
%Lesion and RIC FA predict the functional variables NO visits, gait PC5, and gait PC2 in the best candidate CCA models
Sparse CCA was also performed on 9 MRI biomarkers and 12 recovery variables to identify the most important variables with importance being determined by the number of times the variable was selected as the amount of regularization was adjusted to achieve a variety of levels of sparsity. Sparse CCA indicated that %lesion, swelling, RIC FA, ΔIC FA, and LIC FA ranked the highest within the set of MRI parameters, while NO visits, gait PC2, gait PC5, distance traveled, and NO exploration ranked the highest within the set of functional recovery variables (Table 2).
Table 2.
Sparse canonical correlation analysis variable ranking based on importance
| Rank | MRI parameters | Functional recovery variables |
|---|---|---|
| 1 | %Lesion | NO visits |
| 2 | Swelling | Gait PC5 |
| 3 | RIC | FA Gait PC2 |
| 4 | ΔIC FA | Distance traveled |
The 5 most important 24-hour magnetic resonance imaging biomarkers and 4-week post-stroke recovery variables. RIC FA: FA value of the right internal capsule; LIC FA: FA value of the left internal capsule; NO visits: number of instances the novel object is explored; ΔIC FA: mean FA value of the right internal capsule/mean FA value of the left internal capsule.
In order to build a predictive model for functional recovery variables based on MRI parameters identified in Table 2, standard CCA was performed using all possible combinations of these variables, total (25–1)2 CCA models to be exact. Among those, the three most predictive models utilized the MRI parameters %lesion and RIC FA and the functional recovery variables NO visits, gait PC5, and gait PC2 (Table 3). The estimated canonical variates reveal the directions and weights of the relationships within each model, while the corresponding canonical correlations signify the prediction powers. Model 1 was found to be the most predictive with the canonical correlation 0.920, thus suggesting that an increase in %lesion and a decrease in RIC FA resulted in decreased NO visits, Gait PC2, and Gait PC5.
Table 3.
Variables and estimated canonical loadings and correlations for the best candidate models
| Models | Canonical variates of MRI parameters | Canonical variates of functional recovery variables | Canonical correlation |
|---|---|---|---|
| 1 | 0.775 × %lesion – 0.336 × RIC FA | –0.643 × NO visits –0.381 × gait PC2 –0.676 × gait PC5 | 0.92 |
| 2 | 1.000 × %lesion | –0.648 × NO visits – 0.375 × gait PC2 – 0.675 × gait PC5 | 0.90 |
| 3 | 1.000 × %lesion | –0.722 – 0.643 × NO visits – 0.720 × gait PC5 | 0.84 |
The best candidate models using 3, 4 and 5 total variables for canonical correlation analysis (CCA). The loading vectors suggest that an increase in percent lesion (%lesion) and a decrease in the mean fractional anisotropy value of the right internal capsule (RIC FA) result in decreased novel object (NO) visits, gait PC2, and gait PC5.
Discussion
The results of this study demonstrate that GL and CCA statistical approaches can be used to identify clinically relevant acute MRI outputs that can be used to predict functional outcomes at chronic time points in a porcine model of ischemic stroke. GL results revealed IC FA and gait PC3 possessed the strongest conditional dependence among all the between-set variable pairs. CCA showed that %lesion and RIC FA predicted NO visits, gait PC2, and gait PC5 and consequently could serve as potential biomarkers indicative of future functional deficits. Interestingly, both GL and CCA showed that WM IC FA values were an important component of predicting 4-week functional outcomes.
The IC is a subcortical WM structure that is highly involved in the complex communication and feedback loops between the cerebral cortex and the brainstem (Ng et al., 2007; Patterson et al., 2008). As a result, stroke patients with IC lesions often demonstrate persistent motor deficits including decreased swing phases and mean pressure of the hemiplegic limb (Titianova and Tarkka, 1995; Roth et al., 1997; Lee et al., 2017). This pig MCAO model closely replicated patient outcomes as GL analysis revealed Gait PC3 positively correlated with ΔIC FA in which smaller ipsilateral IC FA values correlated with more severe gait deficits. Specifically, TPI RF was the greatest negative correlation associated with gait PC3, followed by positive correlations with TPI LF, swing time LF, #sensors LF/LH, and TSP LF/LH. This suggests increased WM damage within the RIC stimulated a shift in weight from the affected LF contralateral limb to the RF ipsilateral limb. This asymmetric weight distribution is believed to arise from the loss of tissue integrity in the striato-capsular area with IC and basal ganglia involvement resulting in reduced neural signaling from the right IC to the left side of the body (Alexander et al., 2009; Biesbroek et al., 2017). In a comparable clinical study utilizing the analogous GAITRite system, WM lesions corresponded with poorer gait performance as patients shifted their weight from the contralateral to the ipsilateral leg in response to muscle weakness and dynamic instability (Srikanth et al., 2009). These similarities reinforced the importance of utilizing an animal model with comparable cerebral WM volumes to humans like the pig in order to more accurately identify acute biomarkers that are indicative of patient recovery (Tanaka et al., 2008; Nakamura et al., 2009). Furthermore, understanding the relationship between acute IC WM damage and subsequent gait compensatory strategies may improve patient motor recovery by providing a specific target in which novel therapeutic interventions can be assessed.
In clinical applications, acute lesion volume is also a frequently utilized predictor of patient prognosis due to its high correlation with functional outcomes (Schiemanck et al., 2006; Borsody et al., 2009; Huisa et al., 2014). Interestingly, a clear correlation between lesion volume and motor deficits was also observed in the present study. Pigs with positive %lesion loadings demonstrated negative gait PC2 and gait PC5 loadings. For gait PC5, #sensors LF possessed the greatest positive correlation, thus indicating increased lesion volumes led to decreased contact between the hemiparetic LF limb and the gait mat. In the context of clinical applications, this possesses important implications as many studies confirm similar impairments in the contralateral hemiparetic limbs of acute ischemic stroke patients (Hidler et al., 2007). In addition, RH swing time exhibited the greatest negative correlation with gait PC5 providing evidence that increased lesion volumes correlated with increased suspension of the compensatory RH limb. The stronger ipsilateral RH limb was likely utilized to initiate propulsive forces and thus manifested as increased swing time. These observations are likely due to lesioning of the IC, putamen, and basal ganglia, thus supporting evidence that hemiplegic patient functional outcomes correlate with stroke lesion profiles (a combination of delimiting lesion sizes and primary locations) (Chen et al., 2000). Additionally, negative forelimb and positive hind limb correlations in %TPI and #sensors for gait PC2 revealed a shift in pig weight distribution from the forelimbs to the hind limbs relative to increased lesion volumes. Further understanding of this correlation is critically important as patients have also demonstrated imbalance in terms of both static (e.g., weight distribution, foot-pressure) and dynamic (e.g., weight shifting) postural control (Dickstein et al., 1984; de Haart et al., 2004). Specifically, weight-shifting correlations have revealed unique post-stroke recovery patterns as the ability to initiate and control voluntary weight shifts is an important prerequisite for independent ambulation in patients (de Haart et al., 2005). Consequently, continued understanding of the correlation between acute lesion volumes and locomotion is of considerable importance as it may facilitate the merging of clinical observations and neuroimaging data to provide more targeted rehabilitation programs for patients (Brunnstrom, 1965).
The identification of quantitative MRI biomarkers at acute time points may also assist in improving cognitive prognosis. Cognitive dysfunction is considered one of the most common consequences of stroke, often leading to a reduction in quality of life in 10–82% of patients (Rasquin et al., 2004). Interestingly, NOR testing in pigs revealed similar cognitive dysfunction in nonspatial learning and memory. Further CCA demonstrated that the number of NO visits were negatively correlated with %Lesion, thus indicating increased lesion volumes at 24 hours induced a reduction in spontaneous exploratory behavior 4 weeks post-stroke. Although the pathogenesis of cognitive decline is not well understood, larger stroke lesions that span both gray and WM compartments predict cognitive decline and correlate to the level of cognitive impairment in patients (Pantoni, 2010). Moreover, the majority of damage caused by larger lesions is often located in subcortical regions and, remarkably, WM occupies nearly half of these volumes (Wang et al., 2016). A comparative clinical study in a broad cohort of ischemic stroke patients demonstrated that quantitative thresholds applied to MRI parameters could be used to predict poor functional outcome with high specificity when initial DWI lesion volumes exceeded 72 mL (Yoo et al., 2010). Although similar thresholds existed for baseline NIHSS scores, researchers reported neuroimaging provided additional prognostic information over NIHSS alone. Consequently, early reperfusion interventions could mitigate cognitive impairment by decreasing acute stroke lesioning (National Institute of Neurological Disorders and Stroke rt-PA Stroke Study Group, 1995; Rha and Saver, 2007).
Conclusion
As an effective model of acute ischemic stroke pathophysiology, the pig is an excellent translational platform that can be utilized to identify potential MRI biomarkers and test predictive correlations using clinically relevant, integrative data analysis. The results from this study suggest acutely measured MRI parameters including lesion volume and IC WM integrity have the potential to improve accuracy of stroke prognosis, provide valuable insights into the pathophysiology of stroke injury, and provide biomarkers to test the efficacy of putative therapies on functional recovery. These results must be interpreted while considering the limitations of this study including the relatively small sample size. Future studies should include larger cohorts of animals as well as additional MRI diffusion metrics to further expand upon these findings. Nevertheless, these multivariate projection models may be used in the future to generate individually targeted rehabilitation programs to moderate patient cognitive and motor function disabilities post-stroke.
Additional files:
Additional file 1: Open peer review reports 1 (92.6KB, pdf) and 2 (94KB, pdf) .
Additional Table 1: Magnetic resonance imaging collection protocol.
Additional Table 2: Correlation between the original gait parameters and gait principal component variables.
Additional Figure 1 (700.9KB, tif) : Experimental timeline.
Experimental timeline.
Animals underwent pre-stroke gait and behavior testing to control for individual variability between pigs. 24 hours following middle cerebral artery occlusion (MCAO) stroke induction, magnetic resonance imaging (MRI) was collected to evaluate changes in hemispheric swelling, lesion volume, diffusivity, and white matter. Gait and behavior testing was conducted at 4 weeks post-stroke as diagramed.
Acknowledgments
The authors would like to thank Dr. Simon Platt, Dr. Janet Grimes, Dr. Jennifer Mumaw, Dr. Gina Kim, Lisa Reno, Ethan Kardstedt, Samantha Spellicy, Elizabeth Waters, Sydney Sneed and our team of undergraduate researchers who were involved in various aspects of surgeries, post-operative care, pig gait/behavioral testing, and data collection. We would also like to thank Dr. Emily Baker and Dr. Holly Kinder for their project management.
Footnotes
P-Reviewers: Menaa F, Jantzie LL; C-Editors: Zhao M, Li CH; T-Editor: Jia Y
Funding: This work was supported by the National Institutes of Health, National Institute of Neurological Disorders and Stroke grant R01NS093314 as well as Small Business Innovation Research grant 1R43NS103596-01.
Conflicts of interest: The authors have no declarations of interest to report.
Financial support: This work was supported by the National Institutes of Health, National Institute of Neurological Disorders and Stroke grant R01NS093314 as well as Small Business Innovation Research grant 1R43NS103596-01.
Institutional review board statement: The study was approved by the University of Georgia (UGA) Institutional Animal Care and Use Committee (IACUC; Protocol Number: A2014-07-021-Y3-A11 and 2018-01-029-Y1-A5) on November 22, 2017.
Copyright license agreement: The Copyright License Agreement has been signed by all authors before publication.
Data sharing statement: Datasets analyzed during the current study are available from the corresponding author on reasonable request.
Plagiarism check: Checked twice by iThenticate.
Peer review: Externally peer reviewed.
Open peer reviewers: Farid Menaa, California Innovation Corporation, Internal Medicine and Nanomedicine, USA; Lauren L. Jantzie, Johns Hopkins University School of Medicine, USA.
References
- 1.Alexander LD, Black SE, Patterson KK, Gao F, Danells CJ, McIlroy WE. Association between gait asymmetry and brain lesion location in stroke patients. Stroke. 2009;40:537–544. doi: 10.1161/STROKEAHA.108.527374. [DOI] [PubMed] [Google Scholar]
- 2.Attyé A, Boncoeur-Martel MP, Maubon A, Mounayer C, Couratier P, Labrunie A, Le Bas JF. Diffusion-Weighted Imaging infarct volume and neurologic outcomes after ischemic stroke. J Neuroradiol. 2012;39:97–103. doi: 10.1016/j.neurad.2012.01.001. [DOI] [PubMed] [Google Scholar]
- 3.Avants BB, Libon DJ, Rascovsky K, Boller A, McMillan CT, Massimo L, Coslett HB, Chatterjee A, Gross RG, Grossman M. Sparse canonical correlation analysis relates network-level atrophy to multivariate cognitive measures in a neurodegenerative population. Neuroimage. 2014;84:698–711. doi: 10.1016/j.neuroimage.2013.09.048. [DOI] [PMC free article] [PubMed] [Google Scholar]
- 4.Battey TW, Karki M, Singhal AB, Wu O, Sadaghiani S, Campbell BC, Davis SM, Donnan GA, Sheth KN, Kimberly WT. Brain edema predicts outcome after nonlacunar ischemic stroke. Stroke. 2014;45:3643–3648. doi: 10.1161/STROKEAHA.114.006884. [DOI] [PMC free article] [PubMed] [Google Scholar]
- 5.Benjamin EJ, Muntner P, Alonso A, Bittencourt MS, Callaway CW, Carson AP, Chamberlain AM, Chang AR, Cheng S, Das SR, Delling FN, Djousse L, Elkind MSV, Ferguson JF, Fornage M, Jordan LC, Khan SS, Kissela BM, Knutson KL, Kwan TW, et al. Heart Disease and Stroke Statistics-2019 Update: A Report From the American Heart Association. Circulation. 2019;139:e56–528. doi: 10.1161/CIR.0000000000000659. [DOI] [PubMed] [Google Scholar]
- 6.Biesbroek JM, Weaver NA, Biessels GJ. Lesion location and cognitive impact of cerebral small vessel disease. Clin Sci (Lond) 2017;131:715–728. doi: 10.1042/CS20160452. [DOI] [PubMed] [Google Scholar]
- 7.Borga M. Linköping, Sweden: Linköping University; 1998. Learning multidimensional signal processing. [Google Scholar]
- 8.Borowsky IW, Collins RC. Metabolic anatomy of brain: a comparison of regional capillary density, glucose metabolism, and enzyme activities. J Comp Neurol. 1989;288:401–413. doi: 10.1002/cne.902880304. [DOI] [PubMed] [Google Scholar]
- 9.Borsody M, Warner Gargano J, Reeves M, Jacobs B. MASCOTS Insula-Stroke Substudy Group (2009) Infarction involving the insula and risk of mortality after stroke. Cerebrovasc Dis. 27:564–571. doi: 10.1159/000214220. [DOI] [PubMed] [Google Scholar]
- 10.Brunnstrom S. Walking preparation for adult patients with hemiplegia. Phys Ther. 1965;45:17–29. doi: 10.1093/ptj/45.1.17. [DOI] [PubMed] [Google Scholar]
- 11.Campbell BC, Tu HT, Christensen S, Desmond PM, Levi CR, Bladin CF, Hjort N, Ashkanian M, Sølling C, Donnan GA, Davis SM, Ostergaard L, Parsons MW. Assessing response to stroke thrombolysis: validation of 24-hour multimodal magnetic resonance imaging. Arch Neurol. 2012;69:46–50. doi: 10.1001/archneurol.2011.232. [DOI] [PubMed] [Google Scholar]
- 12.Chen CL, Tang FT, Chen HC, Chung CY, Wong MK. Brain lesion size and location: effects on motor recovery and functional outcome in stroke patients. Arch Phys Med Rehabil. 2000;81:447–452. doi: 10.1053/mr.2000.3837. [DOI] [PubMed] [Google Scholar]
- 13.Coloigner J, Phlypo R, Bush A, Lepore N, Wood J. Functional connectivity analysis for thalassemia disease based on a graphical lasso model. Proc IEEE Int Symp Biomed Imaging. 2016;2016:1295–1298. doi: 10.1109/ISBI.2016.7493504. [DOI] [PMC free article] [PubMed] [Google Scholar]
- 14.de Haart M, Geurts AC, Dault MC, Nienhuis B, Duysens J. Restoration of weight-shifting capacity in patients with postacute stroke: a rehabilitation cohort study. Arch Phys Med Rehabil. 2005;86:755–762. doi: 10.1016/j.apmr.2004.10.010. [DOI] [PubMed] [Google Scholar]
- 15.de Haart M, Geurts AC, Huidekoper SC, Fasotti L, van Limbeek J. Recovery of standing balance in postacute stroke patients: a rehabilitation cohort study. Arch Phys Med Rehabil. 2004;85:886–895. doi: 10.1016/j.apmr.2003.05.012. [DOI] [PubMed] [Google Scholar]
- 16.Dickstein R, Nissan M, Pillar T, Scheer D. Foot-ground pressure pattern of standing hemiplegic patients. Major characteristics and patterns of improvement. Phys Ther. 1984;64:19–23. doi: 10.1093/ptj/64.1.19. [DOI] [PubMed] [Google Scholar]
- 17.Fan Y, Batmanghelich N, Clark CM, Davatzikos C. Alzheimer’s Disease Neuroimaging Initiative (2008) Spatial patterns of brain atrophy in MCI patients, identified via high-dimensional pattern classification, predict subsequent cognitive decline. Neuroimage. 39:1731–1743. doi: 10.1016/j.neuroimage.2007.10.031. [DOI] [PMC free article] [PubMed] [Google Scholar]
- 18.Friedman J, Hastie T, Tibshirani R. Sparse inverse covariance estimation with the graphical lasso. Biostatistics. 2008;9:432–441. doi: 10.1093/biostatistics/kxm045. [DOI] [PMC free article] [PubMed] [Google Scholar]
- 19.Gerriets T, Stolz E, Walberer M, Müller C, Kluge A, Bachmann A, Fisher M, Kaps M, Bachmann G. Noninvasive quantification of brain edema and the space-occupying effect in rat stroke models using magnetic resonance imaging. Stroke. 2004;35:566–571. doi: 10.1161/01.STR.0000113692.38574.57. [DOI] [PubMed] [Google Scholar]
- 20.Gralla J, Schroth G, Remonda L, Fleischmann A, Fandino J, Slotboom J, Brekenfeld C. A dedicated animal model for mechanical thrombectomy in acute stroke. AJNR Am J Neuroradiol. 2006;27:1357–1361. [PMC free article] [PubMed] [Google Scholar]
- 21.Groisser BN, Copen WA, Singhal AB, Hirai KK, Schaechter JD. Corticospinal tract diffusion abnormalities early after stroke predict motor outcome. Neurorehabil Neural Repair. 2014;28:751–760. doi: 10.1177/1545968314521896. [DOI] [PMC free article] [PubMed] [Google Scholar]
- 22.Grosenick L, Klingenberg B, Katovich K, Knutson B, Taylor JE. Interpretable whole-brain prediction analysis with GraphNet. Neuroimage. 2013;72:304–321. doi: 10.1016/j.neuroimage.2012.12.062. [DOI] [PubMed] [Google Scholar]
- 23.Hardoon DR, Szedmak S, Shawe-Taylor J. Canonical correlation analysis: an overview with application to learning methods. Neural Comput. 2004;16:2639–2664. doi: 10.1162/0899766042321814. [DOI] [PubMed] [Google Scholar]
- 24.Hidler JM, Carroll M, Federovich EH. Strength and coordination in the paretic leg of individuals following acute stroke. IEEE Trans Neural Syst Rehabil Eng. 2007;15:526–534. doi: 10.1109/TNSRE.2007.907689. [DOI] [PubMed] [Google Scholar]
- 25.Hotelling H. Relations between two sets of variants. Biometrika. 1936;28:321–377. [Google Scholar]
- 26.Huang S, Li J, Sun L, Ye J, Fleisher A, Wu T, Chen K, Reiman E. Alzheimer’s Disease NeuroImaging Initiative (2010) Learning brain connectivity of Alzheimer’s disease by sparse inverse covariance estimation. Neuroimage. 50:935–949. [Google Scholar]
- 27.Huisa BN, Neil WP, Schrader R, Maya M, Pereira B, Bruce NT, Lyden PD. Clinical use of computed tomographic perfusion for the diagnosis and prediction of lesion growth in acute ischemic stroke. J Stroke Cerebrovasc Dis. 2014;23:114–122. doi: 10.1016/j.jstrokecerebrovasdis.2012.10.020. [DOI] [PMC free article] [PubMed] [Google Scholar]
- 28.Jin JF, Guo ZT, Zhang YP, Chen YY. Prediction of motor recovery after ischemic stroke using diffusion tensor imaging: A meta-analysis. World J Emerg Med. 2017;8:99–105. doi: 10.5847/wjem.j.1920-8642.2017.02.003. [DOI] [PMC free article] [PubMed] [Google Scholar]
- 29.Kandiah N, Chander RJ, Lin X, Ng A, Poh YY, Cheong CY, Cenina AR, Assam PN. Cognitive impairment after mild stroke: development and validation of the SIGNAL2 risk score. J Alzheimers Dis. 2016;49:1169–1177. doi: 10.3233/JAD-150736. [DOI] [PubMed] [Google Scholar]
- 30.Kobayashi E, Hishikawa S, Teratani T, Lefor AT. The pig as a model for translational research: overview of porcine animal models at Jichi Medical University. Transplant Res. 2012;1:8. doi: 10.1186/2047-1440-1-8. [DOI] [PMC free article] [PubMed] [Google Scholar]
- 31.Kwakkel G, Veerbeek JM, Harmeling-van der Wel BC, van Wegen E, Kollen BJ. Early Prediction of functional Outcome after Stroke (EPOS) Investigators (2011) Diagnostic accuracy of the Barthel Index for measuring activities of daily living outcome after ischemic hemispheric stroke: does early poststroke timing of assessment matter. Stroke. 42:342–346. doi: 10.1161/STROKEAHA.110.599035. [DOI] [PubMed] [Google Scholar]
- 32.Lee KB, Kim JS, Hong BY, Sul B, Song S, Sung WJ, Hwang BY, Lim SH. Brain lesions affecting gait recovery in stroke patients. Brain Behav. 2017;7:e00868. doi: 10.1002/brb3.868. [DOI] [PMC free article] [PubMed] [Google Scholar]
- 33.Loubinoux I, Volk A, Borredon J, Guirimand S, Tiffon B, Seylaz J, Méric P. Spreading of vasogenic edema and cytotoxic edema assessed by quantitative diffusion and T2 magnetic resonance imaging. Stroke. 1997;28:419–427. doi: 10.1161/01.str.28.2.419. [DOI] [PubMed] [Google Scholar]
- 34.Marrelec G, Krainik A, Duffau H, Pélégrini-Issac M, Lehéricy S, Doyon J, Benali H. Partial correlation for functional brain interactivity investigation in functional MRI. Neuroimage. 2006;32:228–237. doi: 10.1016/j.neuroimage.2005.12.057. [DOI] [PubMed] [Google Scholar]
- 35.Menaa F. Stroke in sickle cell anemia patients: a need for multidisciplinary approaches. Atherosclerosis. 2013;229:496–503. doi: 10.1016/j.atherosclerosis.2013.05.006. [DOI] [PubMed] [Google Scholar]
- 36.Miller EL, Murray L, Richards L, Zorowitz RD, Bakas T, Clark P, Billinger SA. American Heart Association Council on Cardiovascular Nursing and the Stroke Council (2010) Comprehensive overview of nursing and interdisciplinary rehabilitation care of the stroke patient: a scientific statement from the American Heart Association. Stroke. 41:2402–2448. doi: 10.1161/STR.0b013e3181e7512b. [DOI] [PubMed] [Google Scholar]
- 37.Nakamura M, Imai H, Konno K, Kubota C, Seki K, Puentes S, Faried A, Yokoo H, Hata H, Yoshimoto Y, Saito N. Experimental investigation of encephalomyosynangiosis using gyrencephalic brain of the miniature pig: histopathological evaluation of dynamic reconstruction of vessels for functional anastomosis. Laboratory investigation. J Neurosurg Pediatr. 2009;3:488–495. doi: 10.3171/2008.6.PEDS0834. [DOI] [PubMed] [Google Scholar]
- 38.National Institute of Neurological Disorders and Stroke rt-PA Stroke Study Group (1995) Tissue plasminogen activator for acute ischemic stroke. N Engl J Med. 333:1581–1587. doi: 10.1056/NEJM199512143332401. [DOI] [PubMed] [Google Scholar]
- 39.Ng YS, Stein J, Ning M, Black-Schaffer RM. Comparison of clinical characteristics and functional outcomes of ischemic stroke in different vascular territories. Stroke. 2007;38:2309–2314. doi: 10.1161/STROKEAHA.106.475483. [DOI] [PubMed] [Google Scholar]
- 40.Nonaka H, Akima M, Hatori T, Nagayama T, Zhang Z, Ihara F. The microvasculature of the cerebral white matter: arteries of the subcortical white matter. J Neuropathol Exp Neurol. 2003;62:154–161. doi: 10.1093/jnen/62.2.154. [DOI] [PubMed] [Google Scholar]
- 41.Ovbiagele B, Goldstein LB, Higashida RT, Howard VJ, Johnston SC, Khavjou OA, Lackland DT, Lichtman JH, Mohl S, Sacco RL, Saver JL, Trogdon JG. American Heart Association Advocacy Coordinating Committee and Stroke Council (2013) Forecasting the future of stroke in the United States: a policy statement from the American Heart Association and American Stroke Association. Stroke. 44:2361–2375. doi: 10.1161/STR.0b013e31829734f2. [DOI] [PubMed] [Google Scholar]
- 42.Pantoni L. Cerebral small vessel disease: from pathogenesis and clinical characteristics to therapeutic challenges. Lancet Neurol. 2010;9:689–701. doi: 10.1016/S1474-4422(10)70104-6. [DOI] [PubMed] [Google Scholar]
- 43.Patterson KK, Parafianowicz I, Danells CJ, Closson V, Verrier MC, Staines WR, Black SE, McIlroy WE. Gait asymmetry in community-ambulating stroke survivors. Arch Phys Med Rehabil. 2008;89:304–310. doi: 10.1016/j.apmr.2007.08.142. [DOI] [PubMed] [Google Scholar]
- 44.Peters A, Schweiger U, Pellerin L, Hubold C, Oltmanns KM, Conrad M, Schultes B, Born J, Fehm HL. The selfish brain: competition for energy resources. Neurosci Biobehav Rev. 2004;28:143–180. doi: 10.1016/j.neubiorev.2004.03.002. [DOI] [PubMed] [Google Scholar]
- 45.Platt SR, Holmes SP, Howerth EW, Duberstein KJJ, Dove CR, Kinder HA, Wyatt EL, Linville AV, Lau VW, Stice SL, Hill WD, Hess DC, West FD. Development and characterization of a Yucatan miniature biomedical pig permanent middle cerebral artery occlusion stroke model. Exp Transl Stroke Med. 2014;6:5. doi: 10.1186/2040-7378-6-5. [DOI] [PMC free article] [PubMed] [Google Scholar]
- 46.Puig J, Pedraza S, Blasco G, Daunis-I-Estadella J, Prados F, Remollo S, Prats-Galino A, Soria G, Boada I, Castellanos M, Serena J. Acute damage to the posterior limb of the internal capsule on diffusion tensor tractography as an early imaging predictor of motor outcome after stroke. AJNR Am J Neuroradiol. 2011;32:857–863. doi: 10.3174/ajnr.A2400. [DOI] [PMC free article] [PubMed] [Google Scholar]
- 47.R Core Team. R: A Language and Environment for Statistical Computing. R for Statistical Computing. Vienna: 2019. [Google Scholar]
- 48.Rasquin SM, Lodder J, Ponds RW, Winkens I, Jolles J, Verhey FR. Cognitive functioning after stroke: a one-year follow-up study. Dement Geriatr Cogn Disord. 2004;18:138–144. doi: 10.1159/000079193. [DOI] [PubMed] [Google Scholar]
- 49.Rha JH, Saver JL. The impact of recanalization on ischemic stroke outcome: a meta-analysis. Stroke. 2007;38:967–973. doi: 10.1161/01.STR.0000258112.14918.24. [DOI] [PubMed] [Google Scholar]
- 50.Roth EJ, Merbitz C, Mroczek K, Dugan SA, Suh WW. Hemiplegic gait. Relationships between walking speed and other temporal parameters. Am J Phys Med Rehabil. 1997;76:128–133. doi: 10.1097/00002060-199703000-00008. [DOI] [PubMed] [Google Scholar]
- 51.Sabuncu MR, Van Leemput K. The Relevance Voxel Machine (RVoxM): a Bayesian method for image-based prediction. Med Image Comput Comput Assist Interv. 2011;14(Pt 3):99–106. doi: 10.1007/978-3-642-23626-6_13. [DOI] [PMC free article] [PubMed] [Google Scholar]
- 52.Schiemanck SK, Kwakkel G, Post MW, Prevo AJ. Predictive value of ischemic lesion volume assessed with magnetic resonance imaging for neurological deficits and functional outcome poststroke: A critical review of the literature. Neurorehabil Neural Repair. 2006;20:492–502. doi: 10.1177/1545968306289298. [DOI] [PubMed] [Google Scholar]
- 53.Schulz R, Park CH, Boudrias MH, Gerloff C, Hummel FC, Ward NS. Assessing the integrity of corticospinal pathways from primary and secondary cortical motor areas after stroke. Stroke. 2012;43:2248–2251. doi: 10.1161/STROKEAHA.112.662619. [DOI] [PMC free article] [PubMed] [Google Scholar]
- 54.Shamy JL, Habeck C, Hof PR, Amaral DG, Fong SG, Buonocore MH, Stern Y, Barnes CA, Rapp PR. Volumetric correlates of spatiotemporal working and recognition memory impairment in aged rhesus monkeys. Cereb Cortex. 2011;21:1559–1573. doi: 10.1093/cercor/bhq210. [DOI] [PMC free article] [PubMed] [Google Scholar]
- 55.Srikanth V, Beare R, Blizzard L, Phan T, Stapleton J, Chen J, Callisaya M, Martin K, Reutens D. Cerebral white matter lesions, gait, and the risk of incident falls: a prospective population-based study. Stroke. 2009;40:175–180. doi: 10.1161/STROKEAHA.108.524355. [DOI] [PubMed] [Google Scholar]
- 56.Stokum JA, Mehta RI, Ivanova S, Yu E, Gerzanich V, Simard JM. Heterogeneity of aquaporin-4 localization and expression after focal cerebral ischemia underlies differences in white versus grey matter swelling. Acta Neuropathol Commun. 2015;3:61. doi: 10.1186/s40478-015-0239-6. [DOI] [PMC free article] [PubMed] [Google Scholar]
- 57.Sun JH, Tan L, Yu JT. Post-stroke cognitive impairment: epidemiology, mechanisms and management. Ann Transl Med. 2014;2:80. doi: 10.3978/j.issn.2305-5839.2014.08.05. [DOI] [PMC free article] [PubMed] [Google Scholar]
- 58.Sun T, Hevner RF. Growth and folding of the mammalian cerebral cortex: from molecules to malformations. Nat Rev Neurosci. 2014;15:217–232. doi: 10.1038/nrn3707. [DOI] [PMC free article] [PubMed] [Google Scholar]
- 59.Tanaka Y, Imai H, Konno K, Miyagishima T, Kubota C, Puentes S, Aoki T, Hata H, Takata K, Yoshimoto Y, Saito N. Experimental model of lacunar infarction in the gyrencephalic brain of the miniature pig: neurological assessment and histological, immunohistochemical, and physiological evaluation of dynamic corticospinal tract deformation. Stroke. 2008;39:205–212. doi: 10.1161/STROKEAHA.107.489906. [DOI] [PubMed] [Google Scholar]
- 60.Titianova EB, Tarkka IM. Asymmetry in walking performance and postural sway in patients with chronic unilateral cerebral infarction. J Rehabil Res Dev. 1995;32:236–244. [PubMed] [Google Scholar]
- 61.Tong DC, Yenari MA, Albers GW, O’Brien M, Marks MP, Moseley ME. Correlation of perfusion- and diffusion-weighted MRI with NIHSS score in acute (<6.5 hour) ischemic stroke. Neurology. 1998;50:864–870. doi: 10.1212/wnl.50.4.864. [DOI] [PubMed] [Google Scholar]
- 62.Vidaurre D, Bielza C, Larranaga P. A survey of L1 regression. Int Stat Rev. 2013;81:361–387. [Google Scholar]
- 63.Wang Y, Liu G, Hong D, Chen F, Ji X, Cao G. White matter injury in ischemic stroke. Prog Neurobiol. 2016;141:45–60. doi: 10.1016/j.pneurobio.2016.04.005. [DOI] [PMC free article] [PubMed] [Google Scholar]
- 64.Whittaker J. Chichester: John Wiley and Sons; 1991. Graphical models in applied multivariate statistics. [Google Scholar]
- 65.Witten DM, Tibshirani R, Hastie T. A penalized matrix decomposition, with applications to sparse principal components and canonical correlation analysis. Biostatistics. 2009;10:515–534. doi: 10.1093/biostatistics/kxp008. [DOI] [PMC free article] [PubMed] [Google Scholar]
- 66.Xie Q, Zhang X, Peng S, Sun J, Chen X, Deng Y, Yi L. Identification of novel biomarkers in ischemic stroke: a genome-wide integrated analysis. BMC Med Genet. 2020;21:66. doi: 10.1186/s12881-020-00994-3. [DOI] [PMC free article] [PubMed] [Google Scholar]
- 67.Yoo AJ, Barak ER, Copen WA, Kamalian S, Gharai LR, Pervez MA, Schwamm LH, González RG, Schaefer PW. Combining acute diffusion-weighted imaging and mean transmit time lesion volumes with National Institutes of Health Stroke Scale Score improves the prediction of acute stroke outcome. Stroke. 2010;41:1728–1735. doi: 10.1161/STROKEAHA.110.582874. [DOI] [PubMed] [Google Scholar]
- 68.Young FB, Lees KR, Weir CJ GAIN International Trial Steering Committee and Investigators. Improving trial power through use of prognosis-adjusted end points. Stroke. 2005;36:597–601. doi: 10.1161/01.STR.0000154856.42135.85. [DOI] [PubMed] [Google Scholar]
Associated Data
This section collects any data citations, data availability statements, or supplementary materials included in this article.
Supplementary Materials
Experimental timeline.
Animals underwent pre-stroke gait and behavior testing to control for individual variability between pigs. 24 hours following middle cerebral artery occlusion (MCAO) stroke induction, magnetic resonance imaging (MRI) was collected to evaluate changes in hemispheric swelling, lesion volume, diffusivity, and white matter. Gait and behavior testing was conducted at 4 weeks post-stroke as diagramed.