

Summary
Thousands of proteins localize to the nucleus; however, it remains unclear which contain transcriptional effectors. Here, we develop HT-recruit - a pooled assay where protein libraries are recruited to a reporter, and their transcriptional effects are measured by sequencing. Using this approach, we measure gene silencing and activation for thousands of domains. We find a relationship between repressor function and evolutionary age for the KRAB domains, discover Homeodomain repressor strength is collinear with Hox genetic organization, and identify activities for several Domains of Unknown Function. Deep mutational scanning of the CRISPRi KRAB maps the co-repressor binding surface and identifies substitutions that improve stability/silencing. By tiling 238 proteins, we find repressors as short as 10 amino acids. Finally, we report new activator domains, including a divergent KRAB. Together, these results provide a resource of 600 human proteins containing effectors and demonstrate a scalable strategy for assigning functions to protein domains.
Keywords: Chromatin regulation, Protein domains, High-throughput screening, Transcriptional effectors, Mammalian synthetic biology, KRAB, Hox, CRISPRi, Deep mutational scan, Domain of Unknown Function
In brief:
The high-throughput method (HT-recruit) is developed to quantitatively measure the transcription activity of thousands of human nuclear Pfam domains.
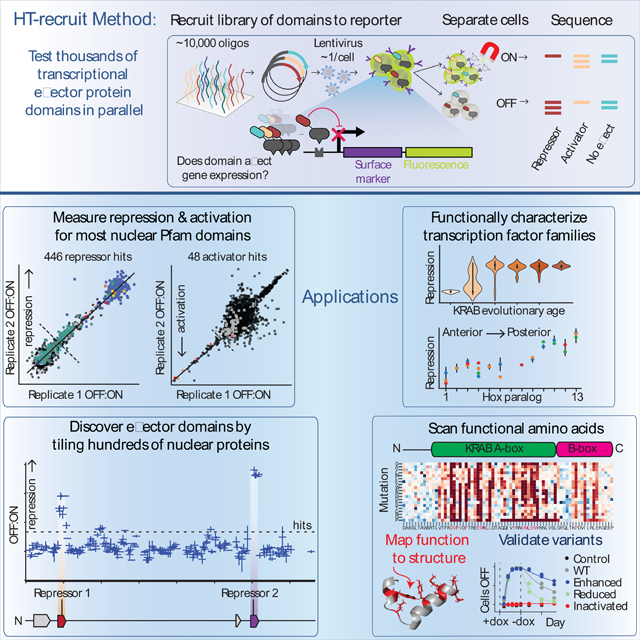
Graphical Abstract
Introduction
In order to understand the molecular underpinnings of human biology and disease, we require systematic knowledge of how proteins function in human cells. Functional studies are challenging to approach systematically because the sequence space of proteins and their mutant variants is vast. For example, the human proteome includes over 1,600 transcription factors (TFs) (Lambert et al., 2018). Extensive efforts have generated maps of genome occupancy for a subset of these TFs (ENCODE Project Consortium et al., 2020; Partridge et al., 2020). However, we still lack a complete understanding of their transcriptional effector functions. With systematic knowledge of which proteins can activate or repress transcription, which protein domains mediate these functions, and which residues in these domains are critical, we could build better models of gene regulation and devise better approaches to correct dysregulated gene expression in disease contexts. Thus, a scalable approach to determine and measure transcriptional effector function is needed.
Traditionally, effector function is measured with a recruitment assay, in which a candidate effector protein is fused onto a synthetic DNA binding domain and recruited to a reporter gene promoter, resulting in change in reporter expression (Sadowski et al., 1988). The recruitment assay has been applied extensively to characterize individual proteins (reviewed in (Tycko et al., 2017)), but the throughput of this assay is limited because each effector protein is individually cloned, delivered into cells, and measured. Recently, systematic recruitment of hundreds of chromatin regulators was achieved in yeast in an arrayed screen (Keung et al., 2014), and pooled strategies for recruitment assays of activator domains were implemented in yeast (Erijman et al., 2020; Staller et al., 2018) and Drosophila cells (Arnold et al., 2018).
Here, we report the development of HT-recruit, a high-throughput recruitment assay in human cells that allows us to measure the function of tens of thousands of candidate effector domains in parallel. The method combines pooled synthesis of oligonucleotide libraries encoding protein domains and variants, a synthetic surface marker reporter allowing facile magnetic cell separation, and next generation sequencing of the protein domains as a readout. This approach enabled us to quantify the effector activity of thousands of Pfam-annotated domains in nuclear-localized human proteins, providing a comprehensive functional assessment of large domain families such as the KRAB and Homeodomain. We also assign effector function to a number of Domains of Unknown Function (DUF). Further, we performed a deep mutational scan of the KRAB repressor domain used in CRISPRi (Gilbert et al., 2014), identifying mutations that ablate and enhance its gene silencing effects. Lastly, we identify compact repressor domains in unannotated regions of nuclear proteins using a library tiling 238 nuclear proteins. Together, we demonstrate a method for systematic functional analysis of effector domains, establish a resource for interpreting the roles of proteins in the human nucleus based on the capacity of their domains to activate or repress transcription, and generate a toolbox of compact and efficient effector domains to enable synthetic biology approaches to perturb and manipulate the epigenome and transcription.
Results
HT-recruit identifies hundreds of repressor domains in human proteins
To turn the classical recruitment assay into a high-throughput assay of transcriptional domains, we had to solve two problems: (1) modify the reporter to make it compatible with rapid screening of libraries of tens of thousands of domains, and (2) devise a strategy to generate a library of candidate effector domains. To improve on our previously published fluorescent reporter (Bintu et al., 2016), we engineered a synthetic surface marker to enable facile magnetic separation of large numbers of cells and integrated the reporter at the AAVS1 safe harbor locus in K562 cells that are amenable to large scale culture (Figure 1A). We used flow cytometry to confirm that recruitment of a known repressor, the KRAB domain from zinc finger transcription factor ZNF10, silences this reporter in a doxycycline (dox) dependent manner (Figures S1A and S1B). We also confirmed that the synthetic surface marker allows magnetic separation of reporter ON from OFF cells (Figure S1C).
Figure 1. HT-recruit discovers hundreds of repressors in a screen of thousands of Pfam domains.

A. Schematic of high-throughput recruitment assay (HT-recruit). A pooled library of Pfam domains is synthesized, cloned as a fusion to the rTetR DNA-binding domain, and delivered to reporter cells. The repression reporter uses a pEF promoter that can be silenced by dox-mediated recruitment of repressor domains via rTetR at TetO sites. The reporter includes a fluorescent citrine and a synthetic surface marker (Igκ-hIgG1-Fc-PDGFRβ) for magnetic bead separation of ON from OFF cells. Cells were treated with dox for 5 days, ON and OFF cells were separated, and domains were sequenced. Dox was removed and time points were taken to measure epigenetic memory.
B. Pfam domain lengths for nuclear proteins. Domains ≤80 AA (dashed line) were selected for the library. Cumulative Distribution Function (CDF) on the right-side axis. KRAB is an example effector family.
C. Reproducibility from 2 biological replicates with selected families colored. The hit threshold is set two S.D. above the mean of the poorly expressed negative controls (dashed line).
D. Boxplots of repressor families, ranked by maximum repression of any domain in the family. Line=median. Whiskers extend beyond the high- and low-quartile by 1.5X the interquartile range. Diamonds=outliers. Dashed line=hit threshold.
E. Individual validations for RYBP domain and 2 DUFs, measured by flow cytometry. Untreated cell distributions (grey) and dox-treated cells (colors); 2 independently-transduced biological replicates per condition. Vertical line=citrine gate used to determine OFF fraction.
F. Validation time courses fit with the gene silencing model: exponential silencing with rate ks, followed by exponential reactivation (Methods). Dox (1000 ng/ml) added on day 0 and removed on day 5 (N=2 biological replicates). The fraction of mCherry positive cells with the citrine reporter OFF was determined by flow cytometry, as in (E), and normalized for background silencing using the untreated, time-matched controls.
G. Correlation of high-throughput measurements at day 5 with the silencing rate ks (R2=0.86, n=15 domains, N=2–3 biological replicates). Horizontal error bars are S.D. for the fitted rates, vertical error bars are the range of screen biological replicates, and dashed lines are the 95% confidence interval of the linear regression.
We next curated a list of candidate transcriptional effector domains. First, we pulled sequences from the UniProt database for Pfam domains in nuclear proteins, totalling 14,657 domains. Of these, 72% were ≤80 amino acids (AA) long (Figure 1B), compatible with pooled synthesis as 300 base oligonucleotides. For domains shorter than 80 AA, we extended the domain sequence on both ends with adjacent residues from the native protein sequence in order to reach 80 AA and avoid PCR amplification biases. We excluded the C2H2 Zinc finger DNA-binding domains, which are highly abundant, repetitive, and not expected to function as transcriptional effectors, resulting in 5,093 Pfam domains in the library. We added 861 negative controls that were either random 80 AA sequences or 80 AA tiled along the DMD protein with a 10 AA tiling window (Materials and Methods). The DMD protein is not localized in the nucleus (Chevron et al., 1994), and thus unlikely to feature domains with transcriptional activity. The library (Table S1) was cloned for lentiviral expression as a fusion protein with either the rTetR dox-inducible DNA-binding domain alone, or with a 3X-FLAG-tagged rTetR (Figure S1D and Table S2) and delivered to K562 reporter cells (Figure 1A).
Before assaying for transcriptional activity, we determined which protein domains were well-expressed in K562 cells using immunostaining against the FLAG-tagged library, sequencing the domains in the FACS-sorted FLAGhigh and FLAGlow populations, and setting a FLAGhigh:FLAGlow threshold ratio one S.D. above the median of the random controls to define well-expressed domains (Figures S1F – S1I). By this definition, 66% of the Pfam domains (that passed the sequencing depth threshold, Methods) were well-expressed; these 3,014 domains were the focus of further analysis.
Next, we screened the Pfam domain library for transcriptional repressors. We treated the pooled library of cells with dox for 5 days, sufficient for the reporter mRNA silencing and protein degradation and dilution from cell division, resulting in a clear bimodal mixture of ‘ON’ and ‘OFF’ cells (Figure S2A). Then, we performed magnetic cell separation (Figure S2A) and domain sequencing, computing the log2(OFF:ON) ratio for each library member using the read counts in the unbound (‘OFF’) and bead-bound (‘ON’) populations (Figure 1A). The measurements were highly reproducible (r2=0.96, Figure 1C) and contained data for 2,978 domains that were well-expressed and passed the sequencing depth threshold. We found 446 repressor hits at day 5, representing 63 domain families (Figure 1D). Known repressor domains (e.g. KRAB from human ZNF10, Chromoshadow from CBX5) from 10 domain families described as repressors or co-repressor-binding domains by Pfam were among the hits (Table S4), as expected. Overall, the high reproducibility and identification of expected positive control repressors suggested our screening method, which we called HT-recruit, yielded reliable results.
To measure epigenetic memory, we took additional time points at days 9 and 13. The set of proteins containing hits was significantly enriched for transcription factors and chromatin regulators when compared to all nuclear proteins used in our library, but different categories of proteins were differentially enriched when classified by their memory levels (Figure S2B). Specifically, the repressors with high memory (cells remaining OFF) at day 13 were most enriched for C2H2 zinc finger transcription factors, including KRAB ZNF proteins, and the repressors with low memory were most enriched for homeodomain transcription factors, including the Hox proteins.
One of the strongest hits was the YAF2_RYBP, a domain present in the RING1- and YY1-binding protein (RYBP) and its paralog YY1-associated Factor 2 (YAF2), both components of the polycomb repressive complex 1 (PRC1) (Chittock et al., 2017; García et al., 1999). We individually tested the domain from the RYBP protein as annotated by Pfam (which is just 32 amino acids, thus shorter than the version in our 80 AA domain library) and confirmed rapid silencing of the reporter (Figure 1E). RYBP-mediated silencing was also demonstrated by full-length RYBP protein recruitment in mouse embryonic stem cells (Moussa et al., 2019; Zhao et al., 2020). Our result establishes that the 32 AA RYBP domain, the minimal required domain to bind the polycomb histone modifier enzyme RING1B (Wang et al., 2010), is sufficient to mediate silencing.
We used the percentage of cells OFF over time to quantify the rates of silencing (Methods) for RYBP (Figure 1F), other domains with previous support for repressor function (Figures 1F and S2C – S2F), and other new repressors (Figures S2G – S2K). We performed these individual validations using a new variant of the DNA binding domain rTetR (SE-G72P) engineered to mitigate leakiness in the absence of dox in yeast (Roney et al., 2016), and which we found is not leaky in human cells and has the same silencing strength at maximum dox (Figures S3A – S3C). Encouragingly, silencing rates from all individual measurements correlated well with the high-throughput measurements of silencing (R2=0.86, Figure 1G).
Identification of domains of unknown function that repress transcription
Over 22% of the Pfam domain families are labeled as Domains of Unknown Function (DUFs), while others are not labeled DUF but also lack experimental characterization (El-Gebali et al., 2019). Our high-throughput domain screen offered the opportunity to associate initial functions with DUFs. First, we identified DUF3669 domains, found in KRAB zinc finger proteins, as repressor hits (Figures 1D – 1F). Two DUF3669 domains were recently shown to be repressive(Al Chiblak et al., 2019), and our high-throughput results expand this finding to include the four remaining DUF3669 sequences (Table S4). The HNF_C DUF domains from both FOXA1 and 2 were repressor hits (Table S4); both include an EH1 (engrailed homology 1) motif — FxIxxIL — that has been nominated as a candidate repressor motif (Copley, 2005).
All three of the IRF-2BP1_2 N-terminal zinc finger domains (Childs and Goodbourn, 2003), an uncharacterized domain found in the interferon regulatory factor 2 (IRF2) co-repressors IRF2BP1, IRF2BP2, and IRF2BPL, were repressor hits (Table S4). The Cyt-b5 domain in the DNA repair factor HERC2 E3 ligase (Mifsud and Bateman, 2002) is another functionally uncharacterized domain that we validated as a strong repressor hit (Figure S2G). The SH3_9 domain in BIN1 is a largely uncharacterized variant of the SH3 protein-binding domain, which we also validated as a repressor (Figure S2H). BIN1 is a Myc-interacting protein and tumor suppressor (Elliott et al., 1999) that is also associated with Alzheimer’s disease risk (Nott et al., 2019). Both full-length BIN1 and a Myc-binding domain deletion mutant were previously shown to repress transcription in a Gal4 recruitment assay in HeLa cells (Elliott et al., 1999), and the BIN1 yeast homolog hob1 has been linked to transcriptional repression and histone methylation (Ramalingam and Prendergast, 2007). Next, we validated the repressor activity of the HMG_box domain from the transcription factor TOX and of the zf-C3HC4_2 RING finger domain from the polycomb component PCGF2 (Figures S2I and S2J). DUF1087 is found in CHD chromatin remodelers and, although its high-throughput measurement was just below the significance threshold (Figure 1D), we validated it as a weak repressor (Figures 1E and 1F). Surprisingly, one of the random negative control sequences was a strong repressor and flow cytometry confirmed this sequence fully silenced the reporter with moderate epigenetic memory two weeks after dox removal (Figure S2K). Together, these results demonstrate that high-throughput protein domain screens can assign initial functions to DUFs and expand our understanding of the functions of incompletely characterized domains.
Repressor KRAB domains are found in younger proteins
We analyzed all effector domains in the largest family of transcription factors, the KRAB domains, which include some of the strongest known repressors. Previous studies of a subset of repressive KRAB domains revealed they can repress transcription by interacting with the co-repressor KAP1 (Cheng et al., 2014). However, it remains unclear how many of the KRAB domains are repressors, and whether the recruitment of KAP1 is necessary or sufficient for repression across all KRABs.
Our library included 335 unique KRAB domain sequences from 350 proteins, and 249 were repressor hits (out of 273 well-expressed domains with sufficient sequencing coverage). We individually validated 9 repressor hits and 2 non-hit KRAB domains by flow cytometry and confirmed these categorizations (Figure S3D). We compared our results with published immunoprecipitation mass spectrometry data generated from full-length KRAB protein pulldowns (Helleboid et al., 2019) all but one of the non-repressive KRABs were in proteins that do not interact with KAP1 (one exception was poorly expressed). All of the repressor KRAB domains were KAP1 interactors (p<1e-9, Fisher’s exact test, Figure 2A). Furthermore, we analyzed available ChiP-seq and ChIP-exo data (ENCODE Project Consortium et al., 2020; Imbeault et al., 2017; Najafabadi et al., 2015; Schmitges et al., 2016) (Table S5) and found that repressive KRABs co-localize with KAP1, in contrast to non-repressive KRAB domains (Figure 2B).
Figure 2. Repressor KRAB domains are found in younger KRAB-Zinc finger proteins that co-localize and bind to the KAP1 co-repressor.

A. KRAB domain repression strength distributions (OFF:ON ratio after 5 days of recruitment) categorized by whether their KRAB Zinc Finger protein (KZFP) interacts significantly with co-repressor KAP1 by co-IP mass-spec. Mass spec dataset from (Helleboid et al., 2019). Each dot is a KRAB domain; dashed line=hit threshold (N=76 domains).
B. Aggregate distance of solo ChIP peak locations (Methods) of KZFPs away from the nearest peaks of the co-repressor KAP1. Each dot shows the fraction of peaks in a 40 bp bin. ChIP data retrieved from external datasets (Table S5) (N=150 hit KZFP ChIP datasets, N=11 non-hit KZFP ChIP datasets).
C. Repression measurements for KRAB domains (dots) natively found in KZFPs with three different architectures. Dashed line=hit threshold.
D. Repression strength for KRAB domains (dots) from KZFPs of varying evolutionary age as determined by the most recent human ancestor with a genetic homolog (ages as reported in (Imbeault et al., 2017)). Dashed line=hit threshold.
Interestingly, repressive KRAB domains were mostly found in proteins with the simplest domain architecture consisting of just a KRAB domain and a zinc-finger array, while the non-repressive KRAB domains were mostly found in genes that also include a DUF3669 or SCAN domain (Figure 2C). Only one KRAB in a DUF3669-containing gene, the uncharacterized ZNF783, was a repressor. ZNF783 uniquely lacks a zinc finger array, suggesting it is distinctive among this class of transcription factors in both its effector function and its mode of localizing to targets.
The compound domain architecture that includes a SCAN or DUF3669 is more common in evolutionary old KRAB genes (Imbeault et al., 2017). Here, we observed a clear relationship between the evolutionary age of the KRAB genes and its repressor strength, with KRAB domains from genes predating the marsupial-human common ancestor having no repressor activity, and KRAB domains from genes that evolved later consistently functioning as strong repressors (Figure 2D).
Deep mutational scan of the CRISPRi ZNF10 KRAB effector
The KRAB domain from ZNF10 has been extensively used for gene repression applications, particularly fused to dCas9 in the programmable epigenetic and transcriptional control tool known as CRISPR interference (Gilbert et al., 2014). To better understand its sequence-function relationships, we performed a deep mutational scan (DMS) of this KRAB domain using HT-recruit. We designed a library with all possible single substitutions and all consecutive double and triple substitutions (Figure 3A). We performed HT-recruit (Figure S4A) using the reporter and workflow in Figure 1A. Measurements were highly reproducible and showed increasing deleteriousness with increasing mutation length from singles to triples, as expected (Figure S4B). We performed a statistical analysis of the necessity of each KRAB residue using data from all possible single substitutions - an approach that limits the potential confounding impact of any particular variant containing silent mutations that might affect translation efficiency (Wilcoxon rank sum test, Figure 3B, bottom). We compared these results with the KRAB amino acid conservation and found a striking correlation between conservation and deleteriousness of mutations (Figure 3B, bottom). Several of these mutations had previously been tested with a recruitment CAT assay in COS and 3T3 cells; those data correlated well with our measurements in K562 cells (Figure 3C).
Figure 3. Deep mutational scan of the ZNF10 KRAB domain identifies substitutions that reduce or enhance repressor function.

A. Library including all single and consecutive double and triple substitutions in the KRAB domain of ZNF10 (5,731 elements). Red residues differ from the WT. DNA oligos are designed to be more distinct by varying codon usage.
B. (Top) All single and triple substitution (sub) variant repressor measurements relative to the WT are shown underneath a schematic of the KRAB domain. The N-terminal extension is encoded on exon 2, the KRAB A-box is encoded on exon 3, and the KRAB B-box is encoded on exon 4. Substitutions start at the position indicated. Dashes=WT residue and grey =missing value. Asterisks show significant residues. (Bottom) For each position at each timepoint, the distribution of all single substitutions was compared to the distribution of wild-type effects (Wilcoxon rank sum test). Positions with signed log10(p)<−5 at day 5 are colored in red (highly significantly decrease in silencing), with signed log10(p)<−5 at day 9 but not day 5 are colored in green, and the position W8 with log10(p)>5 at day 13 is colored in blue (highly significant increase). Dashed horizontal lines=hit thresholds. ConSurf is a sequence conservation score.
C. HT-recruit measurements correlate with previously published low-throughput recruitment CAT assay (Margolin et al., 1994; Witzgall et al., 1994). Vertical bars=S.E. from 2 biological replicates. A lower CAT assay value reflects a higher KRAB silencing activity.
D. Residues that abolish silencing at day 5 when mutated are mapped onto the ordered region of the NMR structure of mouse KRAB A-box (PDB: 1v65).
E. Individual validations of rTetR-KRAB mutant fusions. 1000 ng/ml dox was added on day 0 and removed on day 5, the percentage of cells OFF was measured by flow cytometry, normalized for background silencing, and fit with the gene silencing model (Methods, N=2 biological replicates of lentiviral infection).
The ZNF10 KRAB effector has 3 components: the A-box which is necessary for binding KAP1, the B-box which is thought to potentiate KAP1 binding (Peng et al., 2007), and an N-terminal extension found on a separate exon (Figure 3B). We found 12 residues necessary for silencing in the A-box and one residue with significant but weak effects in the B-box (Figure 3B). The mutational impacts across the A-box appeared periodic, suggesting the angle of these residues along an alpha helix could be functionally relevant (Figure 3B). We mapped these substitutions onto an aligned mouse KRAB A-box structure (Figure S4C) and found the necessary residues were similarly oriented in 3D space, suggesting a binding interface (Figures 3D and S5D, red). In agreement with this hypothesis, 10 out of 12 of these A-box residues were necessary for KAP1 binding in a recombinant protein binding assay (Peng et al., 2009) using KRAB-O, which is similar to ZNF10 KRAB (Figure S4C). This high validation rate, and their positioning in the 3D structure, suggests the remaining 2 out of 12 necessary A-box residues from the DMS (V41 and N45) could also be involved in KAP1 binding.
In contrast to the A-box, B-box mutations showed relatively little effect at the end of recruitment, with only one statistically significant position (P59) showing consistent but weak effects. Meanwhile P59 and 4 other positions (K58, I62, L65, E66) showed a significant effect on memory after dox removal (Figure 3B, day 9), as confirmed in individual validations (Figures 3E and S5E). This decreased memory can be linked to a lower silencing rate (Bintu et al., 2016), as evidenced at lower dox concentrations (Figure S4E), and thus lower commitment to irreversible silencing.
Lastly, we found that only the KRAB N-terminus contained residues where many substitutions consistently enhanced silencing relative to wild-type (Figure 3B, blue, day 13 panels). In particular, nearly all substitutions for the tryptophan at position 8 led to increased silencing memory at day 13. We individually validated the memory enhancement for two of the highest-ranked of these mutants, WSR8EEE and AW7EE (Figures 3E and S5E). To test whether KRAB protein expression correlated with silencing strength, we inspected our FLAG-tag expression measurements for the KAP1-binding KRAB domains and found a significant correlation at day 13 (r2=0.49, Figure S4F). In particular, ZNF10 KRAB had lower expression compared to other KRAB domains with higher day 13 silencing. Notably, the N-terminus is very poorly conserved (Figure 3B) and is uniquely found in ZNF10, suggesting that stability-improving mutations in the N-terminus would be unlikely to interfere with KRAB function. In addition, across the entire domain expression dataset, we observed that tryptophan (W) frequency in a domain was slightly negatively correlated with expression level, while glutamic acid (E) frequency was moderately positively correlated with expression level (Figure S4G). Indeed, a Western blot for ZNF10 KRAB variants confirmed that N-terminal tryptophan-to-glutamic acid substitutions were more highly expressed (Figure S4H). Together, these results demonstrated the use of DMS both to map sequence-to-function for a human transcriptional repressor and to improve effectors by incorporating expression-enhancing substitutions into poorly conserved positions.
Homeodomain repressor strength is colinear with Hox gene organization
The second largest domain family that included repressor hits in our screen was the homeodomain family. Homeodomains contain 3 helices and are sequence-specific DNA binding domains that make base contacts through Helix 3 (Lynch et al., 2006). In some cases, they are also known to act as repressors (Holland et al., 2007; Schnabel and Abate-Shen, 1996). Our library included homeodomains from 216 genes, and 57/189 (30%) were repressor hits (after filtering for expression level and sequencing depth), found in 4/11 subclasses of homeodomains: PRD, NKL, HOXL, and LIM (Figure 4A).
Figure 4. Hox homeodomain repression strength is colinear with Hox gene organization.

A. Ranking of homeobox gene classes by median repression strength of their homeodomain at day 5. Horizontal line=hit threshold. The CERS class is not shown because none of the 5 homeodomains were well-expressed.
B. Homeodomains from the Hox gene families. (Top) Hox gene expression pattern along the anterior-posterior axis is colored by Hox paralog number on an adapted embryo image (Hueber et al., 2010). Hox 11 and 12 are expressed at the posterior end and along the proximal-distal axis of limbs (Wellik and Capecchi, 2003). (Middle) Repression strength. Dots are colored by the Hox cluster. Spearman’s rho and p-value were computed for the relationship between the paralog number and repressor strength across all Hox genes. (Bottom) Colored arrows represent the genes in human Hox clusters and point in the direction of transcription from 5′ to 3′. Grey bars separate gene sequence similarity groups as previously classified (Hueber et al., 2010).
C. Alignment of Hox homeodomains, ranked by OFF:ON ratio at day 5, highlighting the RKKR motif (red) and basic residues within the N-terminal arm (lavender).
D. Correlation between the number of positively charged residues in the N-terminal arm of each Hox homeodomain and the repression at day 5. Dot color=paralog number.
E. NMR structure of the HOXA13 homeodomain (PDB ID: 2L7Z, positions G15-S81 in coordinates from (C)), with RKKR motif (red).
The HOXL subclass contains the Hox genes, a subset of 39 homeodomain transcription factors that are master regulators of cell fate and specify regions of the body plan along the anterior-posterior axis during embryogenesis. These genes are found in four Hox paralog clusters (A to D) that are arranged colinearly from 3′ to 5′ corresponding to the temporal order and spatial patterning of their expression along the anterior-posterior axis (Gilbert, 1971). Interestingly, we observed that repressor strength of homeodomains was collinear with genomic arrangement in the Hox clusters, such that homeodomains in more 5′ genes were stronger repressors (Spearman’s ρ = 0.82, Figure 4B). This correlation suggests a possible link between homeodomain repressor function, Hox gene expression timing, and anterior-posterior axis spatial patterning.
We next sought to identify the sequence determinants of the Hox homeodomain repression strength gradient. Multiple sequence alignment of the Hox homeodomains revealed an RKKR motif present in the N-terminal arm of the 11 strongest repressors (Figure 4C). The motif resides in a basic context in the strongest repressors, while the lower ranked domains lack the motif but still contain some basic residues in the disordered N-terminal arm, resulting in a significant correlation between repression strength and the number of positively charged amino acids arginine and lysine (R2=0.85, Figures 4C – 4E). However, outside the Hox homeodomains, 99.5% of the repressor hits in the Pfam nuclear protein domain library do not contain the RKKR motif, while many non-hits do. Also, there was no correlation between net domain charge and repression strength at day 5 in the full library (R2=0.04). Together, these results suggest the RKKR motif and/or charge contribute to Hox homeodomain repression, but may not be sufficient for repression in other domains.
Discovery of transcriptional activators by HT-recruit to a minimal promoter
To discover transcriptional activator domains using HT-recruit, we established a reporter K562 line with a weak minimal CMV (min CMV) promoter that could be activated upon recruitment of fusions between rTetR and activation domains (Figure 5A) and performed a screen with the nuclear Pfam domain library (Figures S5A and 5B). The hits included three known activation domain families: FOXO-TAD from FOXO1/3/6, LMSTEN from Myb/Myb-A, and TORC_C from CRTC1/2/3 and activation strength measurements were highly reproducible between separately transduced biological replicates (r2=0.89, Figure 5B).
Figure 5. HT-recruit discovers activator domains.

A. Activation reporter using a minCMV promoter that can be activated by dox-mediated recruitment of activating effector domains fused to rTetR.
B. HT-recruit activator measurements from 2 independently transduced biological replicates. Activation reporter cells were transduced with the nuclear domain library and treated with dox for 48 hours; ON and OFF cells were magnetically separated, and the domains were sequenced. The OFF:ON ratios are shown for domains that were well-expressed. Pfam-annotated activator domain families are colored in shades of red. A line is drawn to the strongest hit, KRAB from ZNF473. Dashed line=hit threshold two S.D. below the mean of the poorly expressed domains.
C. Rank list of domain families with an activator hit. Dashed line=hit threshold.
D. Acidity of domains, calculated as net charge per residue. Non-hit, well-expressed Pfam domains (except KRAB and annotated activators) compared with hits (left). Pfam-annotated activator domain families are shown as a group as a positive control (orange). Comparison of the activator hits and non-hits from the KRAB family (right). P-values from Mann-Whitney test shown, with bars between groups. n.s. = not significant.
E. Phylogenetic tree of well-expressed KRAB domains with the variant KRAB cluster shown in green (top). HT-recruit measurements for repression at Day 5 are shown in blue (middle) and for activation are shown in red (bottom). Dashed horizontal lines=hit thresholds. KRAB domain start position is written in parentheses.
F. Individual validation of variant KRAB activators. Untreated cells (grey) and dox-treated cells (colors) shown with 2 biological replicates in each condition. Vertical line=citrine gate used to determine the fraction of cells ON (written above distributions).
G. Distance of KZFP ChIP peaks from the nearest peaks of H3K27ac. KRAB proteins are classified based on the repressor screen at day 5 (left). Data is shown individually for ZNF10 (repressor, black), ZNF473 (activator, red), and ZFP28 (contains both an activator and a repressor, yellow) (right). Dots=fraction of peaks in a 40 bp bin. ChIP data retrieved from external datasets (Table S5). Only solo peaks, where a single KRAB Zinc Finger binds, are included for the aggregated data (left), but all peaks are included for the individual proteins because their number of solo peaks is low (right) (Methods).
In total, we found 48 hits from 26 domain families (Table S4). Beyond the three known activator domain families above, the remaining hits were not previously annotated on Pfam as activator domains (Figure 5C), but were significantly enriched for gene ontology terms such as ‘positive regulation of transcription’ (Figure S5B). Overall, we found fewer activators than repressors, which could be because activators are often disordered or low-complexity regions (Liu et al., 2006) that are frequently not annotated as Pfam domains. The hits were significantly more acidic than non-hits (p ≤ 1e-5, Mann Whitney test, Figure 5D), a common property in activation domains (Mitchell and Tjian, 1989; Staller et al., 2018).
Several hits were nonclassical activators from co-activator and transcriptional machinery proteins including Med9, TFIIEβ, and NCOA3. In particular, the Med9 domain, whose ortholog directly binds other mediator complex components in yeast (Takahashi et al., 2009), was a strong activator, despite its weak expression level (Table S4). Nonclassical activators have previously been reported to work individually in yeast (Gaudreau et al., 1999) but only weakly in mammalian cells (Nevado et al., 1999). One exception is TATA-binding protein (Dorris and Struhl, 2000). By screening more nonclassical sequences, we were able to find more exceptions to this notion.
We individually validated activator hits and their trimmed Pfam-annotated domains by flow cytometry (Figure S5C). As expected, the previously annotated FOXO-TAD and LMSTEN were strong activators, in both their extended and trimmed versions. We also validated the activator function of DUF3446 from the transcription factor EGR3 and the largely uncharacterized QLQ domain from the SWI/SNF family SMARCA2 protein. Further, we confirmed that the Dpy-30 motif domain, a DUF found in the Dpy-30 protein, is a weak activator. Dpy-30 is a core subunit of histone methyltransferase complexes that write H3K4me3 (Hyun et al., 2017), a chromatin mark associated with transcriptionally active chromatin regions (Sims et al., 2003). In total, we tested 11 hit domains (including nonclassical hits Med9 and Nuc_rec_co-act from NCOA3) and found that all significantly activated the reporter.
Discovery of KRAB activator domains
Surprisingly, the strongest activator in the library was the KRAB domain from ZNF473 (Figure 5B). KRAB domains from ZFP28, ZNF496, and ZNF597 were also activators. ZNF496 KRAB had previously been reported as an activator (Losson and Nielsen, 2010). Interestingly, ZFP28 contains two KRAB domains: KRAB_1 is a repressor and KRAB_2 is an activator. Previous studies identified significant ZFP28 interactions with both repressor and activator proteins (Schmitges et al., 2016). The activator KRAB domains are significantly more acidic than non-activator KRABs (p = 0.01, Mann Whitney test, Figure 5D), and are divergent from the consensus KRAB sequence while sharing homology to each other, forming a variant KRAB subcluster (Figure 5E). Previous phylogenetic analysis linked this subcluster to a lack of KAP1 binding and older evolutionary age, and ZNF496 and ZNF597 in particular were not found to interact with KAP1 (Helleboid et al., 2019).
We validated ZNF473 KRAB as a strong activator and ZFP28 KRAB_2 as a moderate activator (Figure 5F), when using the same 80 AA sequence centered on the KRAB domains that was used in our library. Further, we found the trimmed 41 AA KRAB from ZNF473 was sufficient for strong activation, while the trimmed 37 AA KRAB_2 from ZFP28 was not (Figure S5C). Based on available ChiP datasets (Table S5), ZNF473 co-localizes with the active chromatin mark H3K27ac, in contrast to the repressive ZNF10 (Figure 5G). The most significant ZNF473 peaks were found near the transcription start site of genes (CASC3, STAT6, WASF2, ZKSCAN2) and a lncRNA (LINC00431). Meanwhile, ZFP28 does not co-localize with H3K27ac, suggesting its KAP1-binding repressor domain is the dominant effector over its activator one. In general, the zinc finger proteins that contain a repressor KRAB do not co-localize with H3K27ac while the non-repressive KRAB proteins as a group do include co-localized peaks (Figure 5G). Together, our results support that variant KRAB proteins are functionally diverse, sometimes functioning as transcriptional activators.
Tiling library uncovers effector domains in unannotated regions of nuclear proteins
Pfam annotations help define functional nuclear protein domains, but likely miss many uncharacterized effectors. To discover effector domains in unannotated regions of proteins, we designed a tiling library by curating a list of 238 proteins from silencer complexes (Table S1) and tiling their sequences with 80 amino acids separated by a 10 amino acid tiling window (Figure 6A). We performed HT-recruit and measured silencing after 5 days of dox and again at day 13 to measure epigenetic memory (Figure S6A). 4.3% of the tiles scored as reproducible repressor hits at day 5 (r2=0.72, Figures 6B and S6B), with hit domains in 141/238 proteins (Table S4). Some hits overlap annotated domains such as a repressive KRAB or RYBP (Figures S6C and S6D). We also identified and validated repressors in REST (overlapping the CoREST binding domain (Ballas et al., 2001)), DNMT3b (overlapping the DNMT1 and DNMT3a binding domain (Kim et al., 2002)), and CBX7 (overlapping the PcBox that recruits PRC1 (Li et al., 2010)) (Figures S6E – S6G). Some hits are not annotated in Pfam, but we found reports of their repressor function in the literature. For example, CTCF[121–200] had a strong repressive function (Figures 6C and 6E), consistent with previous recruitment studies (Drueppel et al., 2004). Together, these results established that HT-recruit of protein tiles is an effective strategy to identify repressor domains.
Figure 6. Tiling screen discovers compact repressor domains within nuclear proteins.

A. Tiling library covering 238 nuclear proteins (15,737 elements). These tiles were fused to rTetR and tested with HT-recruit as in Figure 1A.
B. Genes ranked by maximum repressor strength. Dots=tiles. Hit threshold is log2(OFF:ON) ≥ 2 S.D. above the mean of the negative controls. Genes with a hit (gradient) and genes no hit (grey) are divided by vertical line..
C. Tiling CTCF. Protein annotations from UniProt. Horizontal bars show the tile span and vertical error bars show the S.E. from 2 biological replicates. The strongest hit tile is highlighted with a vertical gradient and annotated as a repressor (orange). D. Tiling BAZ2A (also known as TIP5).
E. Individual lentiviral rTetR(SE-G72P)-tile fusions were delivered to reporter cells, cells were treated with 100 ng/ml dox for 5 days, and then dox was removed. Cells were analyzed by flow cytometry, the fraction of cells with citrine reporter OFF was determined and the data fit with the gene silencing model (Methods) (N=2 biological replicates). KRAB repressor domains are positive controls. Tiling data corresponding to the validations shown on the right (blue) is in Figure S6.
F. Tiling MGA. Two repressor domains are found outside the previously annotated regions and labeled as Repressor 1 and 2 (dark red, purple). The minimized repressor sequences at the overlap of hit tiles are highlighted with narrow red vertical gradients.
G. The maximal strength repressor tiles from two peaks in MGA were individually validated as in (E).
H. MGA repressor 1 was minimized by selecting the region shared between all hit tiles in the peak (red shade between vertical lines). Below, the sequence conservation ConSurf score is shown (orange line) with the confidence interval (the 25th and 75th percentiles of the inferred evolutionary rate distribution, grey). Asterisks=residues Consurf predicts are functional (Methods).
I. The MGA effectors were minimized to 10 and 30 AA sub-tiles, as shown in (H), cloned as lentiviral rTetR(SE-G72P)-tile fusions, and delivered to reporter cells. Cells were treated with 100 or 1000 ng/ml dox for 5 days and the percentages of cells with the reporter silenced were measured by flow cytometry (N=2 biological replicates).
We also discovered unannotated repressor domains. For example, BAZ2A (also known as TIP5) is a nuclear remodeling complex (NoRC) component that mediates transcriptional silencing of some rDNA (Guetg et al., 2010), but does not have any annotated effector domains. Our BAZ2A tiling data showed a peak of repressor function in a glutamine-rich region and we individually validated it as a moderate strength repressor (Figures 6D and 6E). We found repressor tiles in unannotated regions of three TET DNA demethylases (TET1/2/3) (Table S4), and unexpectedly, in the control protein DMD (Figure S6H).
Finally, we focused on the transcription factor MGA which is thought to repress transcription by recruiting the non-canonical polycomb 1.6 complex (Blackledge et al., 2014; Jolma et al., 2013; Stielow et al., 2018); however, the domains responsible for silencing activity had not been identified. HT-recruit revealed two domains with repressor function, located adjacent to the two known DNA binding domains, which we call here Repressor 1 and Repressor 2 (Figure 6F). These repressor domains have distinct dynamics of silencing and memory: the first domain (AA 341–420) featured slow silencing but strong memory, while the second domain (AA 2381–2460), featured rapid silencing but weak memory (Figure 6G).
Since some known repressors are much shorter than 80 AA (Drueppel et al., 2004; Fisher et al., 1996; Han and Manley, 1993; Paroush et al., 1994), we attempted to identify the minimal necessary sequence for repressor function in each independent domain by examining the overlap in all tiles covering a protein region and defining the sequence present in all repressive tiles (Figure 6H). Using this approach, we generated two candidate minimized effector domains for MGA: the 10 amino acid sequence MGA[381–390] and the 30 amino acid sequence MGA[2431–2460]; both overlapped conserved regions and efficiently silenced the reporter (Figure 6I).
Discussion
The team behind Pfam has reported that “over a quarter of Pfam entries lack an experimentally validated function, highlighting the desperate need for more high-throughput functional screening of proteins” (El-Gebali et al., 2019). This need is particularly pressing in human cells, which are more difficult than model organisms like yeast for developing high-throughput assays, but needed to better understand human biology and disease. Here we use HT-recruit to associate functions with Pfam domains including domains of unknown function and discover effectors in unannotated regions of proteins. We find repressors in 552 human proteins and activators in 48 proteins. This resource of >600 effector domains could be used for interpreting the roles of proteins in the human nucleus based on the capacity of their domains to activate or repress transcription. These discoveries set the stage for deepening our knowledge of transcriptional effector mechanisms through detailed analysis of individual effectors and for enabling synthetic biology approaches to manipulate transcription.
Functional divergence in the KRAB Zinc Finger Transcription Factor family
Our approach afforded us the opportunity to comprehensively assess the transcriptional regulatory function of the complete family of human KRAB domains. While >90% of KRAB domains are repressors, we also found 4 evolutionarily old, variant KRAB domains are activators. In agreement with our data, bioinformatic analysis nominated transcriptional activation as the original KRAB function, due to ancestral sequence similarity with the Meisetz/PRDM9 activator (Birtle and Ponting, 2006). Together, these results support an evolutionary history in which the ancestral KRAB domain was non-repressive, with repressive function originating around the time of the most recent human common ancestor with marsupials and subsequently becoming the predominant KRAB function.
Homeodomain repressors in HOX genes
We observed a significant collinear relationship between Hox gene cluster organization and repression strength. While it remains to be seen how this gradation of repressor strength affects Hox gene biological roles in settings such as embryogenesis, it is tempting to speculate that it could contribute to posterior prevalence. Briefly, posterior prevalence can be defined as the tendency for the more 5′ Hox gene to dominate the phenotype of a cell that expresses multiple Hox genes (Duboule and Morata, 1994). Experiments in fly and mouse have identified the homedomain as a mediator of posterior prevalence in some contexts, by performing homeodomain swaps from posterior to anterior Hox genes (Mann and Hogness, 1990; Zhao and Potter, 2001). One possibility is that the Hox genes repress one another, and the stronger repressor function of the 5′ Hox gene promotes its tendency to dominate the 3′ Hox gene. This would be compatible with the widespread evidence that expression of more 5′ Hox genes is correlated with reduced expression of more 3′ Hox genes (reviewed in (Mallo and Alonso, 2013)). Hox homeodomain repression strength correlated with its N-terminal positive charge and the presence of an RKKR motif, which suggests a possible repression mechanism that could be dependent on the RKKR motif, net positive charge, or both. Arginine residues in basic motifs are important for nucleolar localization (Birbach et al., 2004; Martin et al., 2015)and phase separation (Mitrea et al., 2016), and could help localize the Hox proteins to the nucleolus (Corsetti et al., 1995) in close proximity to heterochromatin (Bersaglieri and Santoro, 2019). Meanwhile, a number of experiments have demonstrated Hox regulatory mechanisms outside of the Hox proteins themselves, including miRNA, lncRNA and translational regulatory mechanisms (Mallo and Alonso, 2013). Further study is needed to elucidate if and how Hox homeodomain repression relates to these other mechanisms and contributes to posterior prevalence.
Deep mutational scanning domains in human cells
HT-recruit presents an approach to not only expand our catalog of human transcriptional effectors, but also to map their sequence-function relationships with mutational libraries. Deep mutational scans (DMS) have mostly been applied using yeast, bacteria, bacteriophage display (Fowler and Fields, 2014), and more recently demonstrated with both transient transfection (Heredia et al., 2018) and lentiviral delivery to human cells (Kotler et al., 2018; Sievers et al., 2018). Their application in human cells could be particularly useful for mapping functional consequences of human genetic variation and for engineering enhanced molecular devices in a more relevant cell model. Here, we achieved very reproducible DMS data (R2=0.92) by maintaining a high >12,500x cell coverage using suspension K562 cells in a large spinner flask, and magnetic separation instead of FACS. Thus, we demonstrate an approach to high-quality and lower-difficulty DMS in human cells.
One potential limitation of our approach to barcoding similar protein variants with silent DNA substitutions is that alternate codon usage could impact translation efficiency. A second issue affecting DMS interpretation is that protein variants can affect expression level and/or stability rather than (or in addition to) directly affecting function. Both of these possibilities can be empirically assessed using the FLAG-based high-throughput expression level measurement protocol we report here. In conjunction with such controls, HT-recruit opens up the possibility of performing deep mutational scans on the hundreds of human activator and repressor domains in order to define their functional residues and better understand the biophysical requirements for effector activity.
Applications in Synthetic Biology
Previously, a limited number of transcriptional effector domains were available for the engineering of synthetic transcription factors. HT-recruit enables the discovery of effector domains that can upregulate or downregulate transcription, and the identification of mutants of effector domains with enhanced activity. Here, we identified poorly conserved, unnecessary residues that could be replaced with expression level-enhancing residues to improve the ZNF10 KRAB effector and could readily be ported into the CRISPRi system. This approach could be a generally applicable strategy to improve domains beyond KRAB.
The transcriptional effector domains reported here have several advantages for applications that rely on synthetic transcription factors. We identify short domains (≤80 amino acids) and demonstrate a process for shortening them further to a minimally sufficient sequence as short at 10 amino acids, which is an advantage for delivery (e.g. packaging in viral vectors). The domains are extracted from human proteins, which is advantageous for avoiding immunogenicity associated with viral effector domains.
High-throughput protein domain functional screens in human cells
This work expands the catalog of functional transcriptional effector domains but is still incomplete. We envision new library designs that tile transcription factors or focus on regions with activator-like signatures will identify additional human activator domains, as such designs have uncovered activators in yeast and Drosophila experiments (Arnold et al., 2018; Erijman et al., 2020; Ravarani et al., 2018). Without major modifications, HT-recruit should be compatible with any cell type that is transfectable (to integrate the reporter) and transducible by lentivirus (to deliver the library). Future improvements in synthesis length, or oligonucleotide assembly methods (Sidore et al., 2020), can be expected to enable more complete domain libraries. Magnetic separation, which we previously applied to CRISPR screens (Haney et al., 2018), makes high-throughput screening more accessible in comparison to the conventional approach of sorting libraries, and the synthetic surface marker could facilitate the adaptation to magnetic separation for other reporter-based assays.
More broadly, the strategy we describe here for designing and screening pooled protein domain libraries in high-throughput can readily be applied beyond transcriptional effectors.
STAR Methods
Resource Availability
Lead Contact
Further information and requests for resources and reagents should be directed to and will be fulfilled by the Lead Contact, Lacramioara Bintu (lbintu@stanford.edu).
Materials Availability
The lentiviral recruitment plasmids and reporter donor plasmids generated in this study are available from Addgene (Addgene #161925 – 161928).
Data and Code Availability
The Illumina sequencing datasets generated in this study are available from the Sequencing Read Archive (SRA BioProject PRJNA668427, http://www.ncbi.nlm.nih.gov/bioproject/668427).
External ChIP-seq and ChIP-exo data for KRAB ZNF, KAP1, and H3K27ac (ENCODE Project Consortium et al., 2020; Imbeault et al., 2017; Najafabadi et al., 2015; Schmitges et al., 2016), KRAB ZNF gene evolutionary age (Imbeault et al., 2017), KRAB ZNF protein co-immunoprecipitation/mass-spectrometry data (Helleboid et al., 2019), and CAT assays for KRAB repressor activity (Margolin et al., 1994; Witzgall et al., 1994) were retrieved from previously published studies. The ChIP dataset identifiers are listed in Table S5.
The HT-recruit Analyze software for processing high-throughput recruitment assay and high-throughput stability assays are available on GitHub (https://github.com/bintulab/HT-recruit-Analyze).
Experimental Model and Subject Details
Cell lines and cell culture
All experiments presented here were carried out in K562 cells (female, ATCC CCL-243). Cells were cultured in a controlled humidified incubator at 37°C and 5% CO2, in RPMI 1640 (Gibco) media supplemented with 10% FBS (Hyclone), penicillin (10,000 I.U./mL), streptomycin (10,000 ug/mL), and L-glutamine (2 mM). HEK293FT (RRID:CVCL_6911) and HEK293T-LentiX (Takara Bio) cells (female), used to produce lentivirus, as described below, were grown in DMEM (Gibco) media supplemented with 10% FBS (Hyclone), penicillin (10,000 I.U./mL), and streptomycin (10,000 ug/mL). Reporter cell lines were generated by TALEN-mediated homology-directed repair to integrate a donor construct into the AAVS1 locus as follows: 1.2×10⁶ K562 cells were electroporated in Amaxa solution (Lonza Nucleofector 2b, setting T0–16) with 1000 ng of reporter donor plasmid (Table S2), and 500 ng of each TALEN-L (Addgene #35431) and TALEN-R (Addgene #35432) plasmid (targeting upstream and downstream the intended DNA cleavage site, respectively). The reporter donors were pJT039 (pEF promoter, Addgene #161927) and pDY32 (minCMV promoter, Addgene #161928). After 7 days, the cells were treated with 1000 ng/mL puromycin antibiotic for 5 days to select for a population where the donor was stably integrated in the intended locus, which provides a promoter to express the PuroR resistance gene. Fluorescent reporter expression was measured by microscopy and by flow cytometry (BD Accuri). hAAVS1 1L TALEN (Addgene plasmid #35431; http://n2t.net/addgene:35431; RRID:Addgene_35431) and hAAVS1 1R TALEN (Addgene plasmid #35432; http://n2t.net/addgene:35432; RRID:Addgene_35432) were gifts from Feng Zhang (Sanjana et al., 2012). These cells were not authenticated.
Method Details
Nuclear protein Pfam domain library design
We queried the UniProt database (UniProt Consortium, 2015) for human genes that can localize to the nucleus. Subcellular location information on UniProt is determined from publications or ‘by similarity’ in cases where there is only a publication on a similar gene (e.g. ortholog) and is manually reviewed. We then retrieved Pfam-annotated domains using the ProDy searchPfam function (Bakan et al., 2011). We filtered for domains that were 80 amino acids or shorter and excluded the C2H2 Zinc finger DNA-binding domains, which are highly abundant, repetitive, and not expected to function as transcriptional effectors. We retrieved the sequence of the annotated domain and extended it equally on either side to reach 80 amino acids total. Duplicate sequences were removed, then codon optimization was performed for human codon usage, removing BsmBI sites and constraining GC content to between 20% and 75% in every 50 nucleotide window (performed with DNA chisel (Zulkower and Rosser, 2020)). 499 random controls of 80 amino acids lacking stop codons were computationally generated as controls. 362 elements tiling the DMD protein in 80 amino acid tiles with a 10 amino acid sliding window were also included as controls because DMD was not thought to be a transcriptional regulator. In total, the library consists of 5,955 elements (Table S1).
Silencer tiling library design
216 proteins involved in transcriptional silencing were curated from a database of transcriptional regulators (Lambert et al., 2018). We manually added 32 proteins that we thought likely to be involved in transcriptional silencing and then generated an unbiased protein tiling library (Table S1). To do this, the canonical transcript for each gene was retrieved from the Ensembl BioMart (Kinsella et al., 2011) using the Python API. If no canonical transcript was found, the longest transcript with a CDS was retrieved. The coding sequences were divided into 80 amino acid tiles with a 10 amino acid sliding window between tiles. For each gene, a final tile was included, spanning from 80 amino acids upstream of the last residue to that last residue, such that the C-terminal region would be included in the library. Duplicate protein sequences were removed, and codon optimization was performed for human codon usage, removing BsmBI sites and constraining GC content to between 20% and 75% in every 50 nucleotide window (performed with DNA chisel (Zulkower and Rosser, 2020)). 361 DMD tiling negative controls were included, as in the previous library design, resulting in 15,737 library elements in total.
KRAB deep mutational scan library design
A deep mutational scan of ZNF10 KRAB domain sequence, as used in CRISPRi (Gilbert et al., 2014), was designed with all possible single substitutions and all consecutive double and triple substitutions of the same amino acid (e.g. substitution with AAA) (Table S1). These amino acid sequences were reverse translated into DNA sequences using a probabilistic codon optimization algorithm, such that each DNA sequence contains some variation beyond the substituted residues, which improves the ability to unambiguously align sequencing reads to unique library members. In addition, all Pfam-annotated KRAB domains from human KRAB genes found on InterPro were included, similarly as in the previous nuclear Pfam domain library. Tiling sequences, as designed in the previous tiling library, were also included for five KRAB Zinc Finger genes. 300 random control sequences and 200 tiles from the DMD gene were included as negative controls. During codon optimization, BsmBI sites were removed and GC content was constrained to be between 30% and 70% in every 80 nucleotide window (performed with DNA chisel (Zulkower and Rosser, 2020)). The total library size was 5,731 elements.
Library cloning
Oligonucleotides with lengths up to 300 nucleotides were synthesized as pooled libraries (Twist Biosciences) and then PCR amplified. 6× 50 ul reactions were set up in a clean PCR hood to avoid amplifying contaminating DNA. For each reaction, we used 5 ng of template, 0.1 μl of each 100 μM primer, 1 μl of Herculase II polymerase (Agilent), 1 μl of DMSO, 1 μl of 10 nM dNTPs, and 10 μl of 5x Herculase buffer. The thermocycling protocol was 3 minutes at 98°C, then cycles of 98°C for 20 seconds, 61°C for 20 seconds, 72°C for 30 seconds, and then a final step of 72°C for 3 minutes. The default cycle number was 29x, and this was optimized for each library to find the lowest cycle that resulted in a clean visible product for gel extraction (in practice, 25 cycles was the minimum). After PCR, the resulting dsDNA libraries were gel extracted by loading ≥4 lanes of a 2% TBE gel, excising the band at the expected length (around 300 bp), and using a QIAgen gel extraction kit. The libraries were cloned into a lentiviral recruitment vector pJT050 (Addgene #161925) or pJT126 (Addgene #161926) (Table S2) with 4×10 μl GoldenGate reactions (75 ng of pre-digested and gel-extracted backbone plasmid, 5 ng of library (2:1 molar ratio of insert:backbone), 0.13 μl of T4 DNA ligase (NEB, 20000 U/μl), 0.75 μl of Esp3I-HF (NEB), and 1 μl of 10x T4 DNA ligase buffer) with 30 cycles of digestion at 37°C and ligation at 16°C for 5 minutes each, followed by a final 5 minute digestion at 37°C and then 20 minutes of heat inactivation at 70°C. The reactions were then pooled and purified with MinElute columns (QIAgen), eluting in 6 ul of ddH2O. 2 μl per tube was transformed into two tubes of 50 μl of Endura™ electrocompetent cells (Lucigen, Cat#60242–2) following the manufacturer’s instructions. After recovery, the cells were plated on 3 – 7 large 10” × 10” LB plates with carbenicillin. After overnight growth at 37°C, the bacterial colonies were scraped into a collection bottle and plasmid pools were extracted with a HiSpeed Plasmid Maxiprep kit (QIAgen). 2 – 3 small plates were prepared in parallel with diluted transformed cells in order to count colonies and confirm the transformation efficiency was sufficient to maintain at least 30x library coverage. To determine the quality of the libraries, the domains were amplified from the plasmid pool and from the original oligo pool by PCR with primers with extensions that include Illumina adapters (Table S3) and sequenced. The PCR and sequencing protocol were the same as described below for sequencing from genomic DNA, except these PCRs use 10 ng of input DNA and 17 cycles. These sequencing datasets were analyzed as described below to determine the uniformity of coverage and synthesis quality of the libraries. In addition, 20 – 30 colonies from the transformations were Sanger sequenced (Quintara) to estimate the cloning efficiency and the proportion of empty backbone plasmids in the pools.
High-throughput recruitment to measure repressor activity
Large scale lentivirus production and spinfection of K562 cells were performed as follows: To generate sufficient lentivirus to infect the libraries into K562 cells, we plated HEK293T cells on four 15-cm tissue culture plates. On each plate, 9×10⁵ HEK293T cells were plated in 30 mL of DMEM, grown overnight, and then transfected with 8 μg of an equimolar mixture of the three third-generation packaging plasmids (pMD2.G, psPAX2, pMDLg/pRRE) and 8 μg of rTetR-domain library vectors using 50 μl of polyethylenimine (PEI, Polysciences #23966). pMD2.G (Addgene plasmid #12259; http://n2t.net/addgene:12259; RRID:Addgene_12259), psPAX2 (Addgene plasmid #12260; http://n2t.net/addgene:12260; RRID:Addgene_12260), and pMDLg/pRRE (Addgene plasmid #12251; http://n2t.net/addgene:12251; RRID:Addgene_12251) were gifts from Didier Trono. After 48 hours and 72 hours of incubation, lentivirus was harvested. We filtered the pooled lentivirus through a 0.45-μm PVDF filter (Millipore) to remove any cellular debris. For the nuclear Pfam domain repressor screen, 4.5×10⁷ K562 reporter cells were infected with the lentiviral library by spinfection for 2 hours, with two separate biological replicates of the infection. Infected cells grew for 3 days and then the cells were selected with blasticidin (10 μg/mL, Sigma). Infection and selection efficiency were monitored each day using flow cytometry to measure mCherry (BD Accuri C6). Cells were maintained in spinner flasks in log growth conditions each day by diluting cell concentrations back to a 5×10⁵ cells/mL, with at least 1.5×10⁸ cells total remaining per replicate such that the lowest maintenance coverage was >25,000× cells per library element (a very high coverage level that compensates for losses from incomplete blasticidin selection, library preparation, and library synthesis errors). On day 6 post-infection, recruitment was induced by treating the cells with 1000 ng/ml doxycycline (Fisher Scientific) for 5 days, then cells were spun down out of doxycycline and blasticidin and maintained in untreated RPMI media for 8 more days, up to Day 13 counting from the addition of doxycycline. 2.5×10⁸ cells were taken for measurements at each timepoint (days 5, 9, and 13). The protocol was similar for the KRAB DMS, but doxycycline was added on day 8 post-infection, >12,500× coverage, and 2×10⁸ - 2.2×10⁸ cells were taken for each timepoint. The protocol was similar for the tiling screen, but 9.6×10⁷ cells were infected, doxycycline was added on day 8 post-infection, at least 2×10⁸ cells were maintained at each passage for >12,500× coverage, and 2×10⁸ - 2.7×10⁸ cells were taken for each timepoint.
High-throughput recruitment to measure transcriptional activation activity
For the nuclear Pfam domain activator screen, lentivirus for the nuclear Pfam library in the rTetR(SE-G72P)-3XFLAG vector (Table S2) was generated as for the repressor screen, and 3.8×10⁷ K562-pDY32 minCMV reporter cells (Table S2) were infected with the lentiviral library by spinfection for 2 hours, with two separate biological replicates of the infection. Infected cells grew for 2 days and then the cells were selected with blasticidin (10 μg/mL, Sigma). Infection and selection efficiency were monitored each day using flow cytometry to measure mCherry (BD Accuri C6). Cells were maintained in spinner flasks in log growth conditions each day by diluting cell concentrations back to a 5×10⁵ cells/mL, with at least 1×10⁸ total cells remaining per replicate such that the lowest maintenance coverage was >18,000× cells per library element. On day 7 post-infection, recruitment was induced by treating the cells with 1000 ng/ml doxycycline (Fisher Scientific, 409050) for 2 days, then cells were spun down out of doxycycline and blasticidin and maintained in untreated RPMI media for 4 more days. 2×10⁸ cells were taken for measurements at the day 2 time point. There was no evidence of activation memory at day 4 post-doxycycline removal, as determined by the absence of citrine positive cells by flow cytometry, so no additional time points were collected.
Magnetic separation of reporter cells
The reporter included a synthetic surface marker, consisting of the human IgG1 Fc region linked to an Igκ leader and PDGFRβ transmembrane domain, to enable magnetic separation of OFF from ON cells. At each timepoint, cells were spun down at 300 × g for 5 minutes and media was aspirated. Cells were then resuspended in the same volume of PBS (Gibco) and the spin down and aspiration was repeated, to wash the cells and remove any IgG from serum. Dynabeads™ M-280 Protein G (ThermoFisher, 10003D) were resuspended by vortexing for 30 seconds. 50 mL of blocking buffer was prepared per 2×10⁸ cells by adding 1 gram of biotin-free BSA (Sigma Aldrich) and 200 μl of 0.5 M pH 8.0 EDTA (ThemoFisher, 15575020) into DPBS (Gibco), vacuum filtering with a 0.22-μm filter (Millipore), and then kept on ice. 60 μl of beads was prepared for every 1×10⁷ cells, by adding 1 mL of buffer per 200 μl of beads, vortexing for 5 seconds, placing on a magnetic tube rack (Eppendorf), waiting one minute, removing supernatant, and finally removing the beads from the magnet and resuspending in 100 – 600 μl of blocking buffer per initial 60 μl of beads. For the KRAB DMS only, 30 μl of beads was prepared for every 1×10⁷ cells, in the same way. Beads were added to cells at no more than 1×10⁷ cells per 100 μl of resuspended beads, and then incubated at room temperature while rocking for 30 minutes. For a sample with 2×10⁸ cells, we used 1.2 mL of beads, resuspended in 12 mL of blocking buffer, in a 15 mL Falcon tube and a large magnetic rack. For a sample with <5×10⁷ cells, we used non-stick Ambion 1.5 mL tubes and a small magnetic rack. After incubation, the bead and cell mixture were placed on the magnetic rack for >2 minutes. The unbound supernatant was transferred to a new tube, placed on the magnet again for >2 minutes to remove any remaining beads, and then the supernatant was transferred and saved as the unbound fraction. Then, the beads were resuspended in the same volume of blocking buffer, magnetically separated again, the supernatant was discarded, and the tube with the beads was kept as the bound fraction. The bound fraction was resuspended in blocking buffer or PBS to dilute the cells (the unbound fraction is already dilute). Flow cytometry (BD Accuri) was performed using a small portion of each fraction to estimate the number of cells in each fraction (to ensure library coverage was maintained) and to confirm separation based on citrine reporter levels (the bound fraction should be >90% citrine positive, while the unbound fraction is more variable depending on the initial distribution of reporter levels). Finally, the samples were spun down and the pellets were frozen at −20°C until genomic DNA extraction.
High-throughput measurement of domain fusion protein expression level
The expression level measurements were made in K562-pDY32 cells (with citrine OFF) infected with the 3XFLAG-tagged nuclear Pfam domain library. 1×10⁸ cells per biological replicate were used after 5 days of blasticidin selection (10 μg/mL, Sigma), which was 7 days post-infection. 1×10⁶ control K562-JT039 cells (citrine ON, no lentiviral infection) were spiked into each replicate. Fix Buffer I (BD Biosciences, BDB557870) was preheated to 37°C for 15 minutes and Permeabilization Buffer III (BD Biosciences, BDB558050) and PBS (Gibco) with 10% FBS (Hyclone) were chilled on ice. The library of cells expressing domains was collected and cell density was counted by flow cytometry (BD Accuri). To fix, cells were resuspended in a volume of Fix Buffer I (BD Biosciences, BDB557870) corresponding to pellet volume, with 20 μl per 1 million cells, at 37°C for 10 – 15 minutes. Cells were washed with 1 mL of cold PBS containing 10% FBS, spun down at 500 × g for 5 minutes and then supernatant was aspirated. Cells were permeabilized for 30 minutes on ice using cold BD Permeabilization Buffer III (BD Biosciences, BDB558050), with 20 μl per 1 million cells, which was added slowly and mixed by vortexing. Cells were then washed twice in 1 ml PBS+10% FBS, as before, and then supernatant was aspirated. Antibody staining was performed for 1 hour at room temperature, protected from light, using 5 μl / 1×10⁶ cells of α-FLAG-Alexa647 (RNDsystems, IC8529R). We then washed the cells and resuspended them at a concentration of 3×10⁷ cells / ml in PBS+10%FBS. Cells were sorted into two bins based on the level of APC-A fluorescence (Sony SH800S) after gating for mCherry positive viable cells. A small number of unstained control cells was also analyzed on the sorter to confirm staining was above background. The spike-in citrine positive cells were used to assess the background level of staining in cells known to lack the 3XFLAG tag, and the gate for sorting was drawn above that level. After sorting, the cellular coverage ranged from 336 – 1,295 cells per library element across samples. The sorted cells were spun down at 500 × g for 5 minutes and then resuspended in PBS. Genomic DNA extraction was performed following the manufacturer’s instructions (QIAgen Blood Maxi kit was used for samples with >1×10⁷ cells, and QIAamp DNA Mini kit with one column per up to 5×10⁶ cells was used for samples with ≤1×10⁷ cells) with one modification: the Proteinase K + AL buffer incubation was performed overnight at 56°C.
Library preparation and sequencing
Genomic DNA was extracted with the QIAgen Blood Maxi Kit following the manufacturer’s instructions with up to 1.25×10⁸ cells per column. DNA was eluted in EB and not AE to avoid subsequence PCR inhibition. The domain sequences were amplified by PCR with primers containing Illumina adapters as extensions (Table S3). A test PCR was performed using 5 μg of genomic DNA in a 50 μl (half-size) reaction to verify if the PCR conditions would result in a visible band at the expected size for each sample. Then, 12 – 24× 100 μl reactions were set up on ice (in a clean PCR hood to avoid amplifying contaminating DNA), with the number of reactions depending on the amount of genomic DNA available in each experiment. 10 μg of genomic DNA, 0.5 μl of each 100 μM primer, and 50 μl of NEBnext 2x Master Mix (NEB) was used in each reaction. The thermocycling protocol was to preheat the thermocycler to 98°C, then add samples for 3 minutes at 98°C, then 32x cycles of 98°C for 10 seconds, 63°C for 30 seconds, 72°C for 30 seconds, and then a final step of 72°C for 2 minutes. All subsequent steps were performed outside the PCR hood. The PCR reactions were pooled and ≥140 μl were run on at least three lanes of a 2% TBE gel alongside a 100-bp ladder for at least one hour, the library band around 395 bp was cut out, and DNA was purified using the QIAquick Gel Extraction kit (QIAgen) with a 30 ul elution into non-stick tubes (Ambion). A confirmatory gel was run to verify that small products were removed. These libraries were then quantified with a Qubit HS kit (Thermo Fisher), pooled with 15% PhiX control (Illumina), and sequenced on an Illumina NextSeq with a High output kit using a single end forward read (266 or 300 cycles) and 8 cycle index reads.
Domain sequencing analysis
Sequencing reads were demultiplexed using bcl2fastq (Illumina). A Bowtie reference was generated using the designed library sequences with the script ‘makeIndices.py’ and reads were aligned with 0 mismatch allowance using the script ‘makeCounts.py’. The enrichments for each domain between OFF and ON (or FLAGhigh and FLAGlow) samples were computed using the script ‘makeRhos.py’. Domains with <5 reads in both samples for a given replicate were dropped from that replicate (assigned 0 counts), whereas domains with <5 reads in one sample would have those reads adjusted to 5 in order to avoid the inflation of enrichment values from low depth. For all of the nuclear domain screens, domains with ≤ 5 counts in both replicates of a given condition were filtered out of downstream analysis. For the nuclear domain expression screen, well-expressed domains were those with a log2(FLAGhigh:FLAGlow) ≥ 1 standard deviation above the median of the random controls. For the nuclear Pfam domain repressor screen, hits were domains with log2(OFF:ON) ≥ 2 standard deviations above the mean of the poorly expressed domains. For the nuclear domain activator screen, hits were domains with log2(OFF:ON) ≤ 2 standard deviations below the mean of the poorly expressed domains. For the silencer tiling screen, tiles with ≤20 counts in both replicates of a given condition were filtered out and hits were tiles with log2(OFF:ON) ≥ 2 standard deviations above the mean of the random and DMD tiling controls.
Gene ontology analysis
Gene ontology analysis enrichments were computed using the PantherDB web tool (www.pantherdb.org). The background sets were all proteins containing domains that were well-expressed and measured in the experiment after count filters were applied. P-values for statistical significance were calculated using Fisher’s exact test, the False Discovery Rate (FDR) was computed, and only the most significant results, all with FDR<10%, were shown.
Western blot
K562 reporter cells were transduced with a lentiviral vector containing an rTetR-3XFLAG-effector-T2A-mCherry-BSD and then selected with blasticidin (10 μg/mL) until >80% of the cells were mCherry positive. 5–10 million cells were lysed in lysis buffer (1% Triton X-100, 150mM NaCl, 50mM Tris pH 7.5, Protease inhibitor cocktail). Protein amounts were quantified using the Pierce BCA Protein Assay kit (Bio-Rad). Equal amounts were loaded onto a gel and transferred to a PVDF membrane. Membrane was probed using FLAG M2 monoclonal antibody (1:1000, mouse, Sigma-Aldrich, F1804) and Histone 3 antibody (1:1000, mouse, Abcam, AB1791) as primary antibodies. Goat anti-mouse IRDye 680 RD and goat anti-rabbit IRDye 800CW (1:20,000 dilution, LI-COR Biosciences, cat nos. 926–68070 and 926–32211, respectively) were used as secondary antibodies. Blots were imaged on a LiCor Odyssey CLx. Band intensities were quantified using ImageJ (Rueden et al., 2017).
Individual repressor recruitment assays
Individual effector domains were cloned as fusions with rTetR or rTetR(SE-G72P) with or without a 3XFLAG tag (see figure legends), upstream of a T2A-mCherry-BSD marker using GoldenGate cloning into backbones pJT050 (Addgene #161925) or pJT126 (Addgene #161926) (Table S2). K562-pJT039-pEF-citrine reporter cells (Table S2) were then transduced with this lentiviral vector and, 3 days later, selected with blasticidin (10 μg/mL) until >80% of the cells were mCherry positive (6–7 days). Cells were split into separate wells of a 24-well plate and either treated with doxycycline (Fisher Scientific) or left untreated. After 5 days of treatment, doxycycline was removed by spinning down the cells, replacing media with DPBS (Gibco) to dilute any remaining doxycycline, and then spinning down the cells again and transferring them to fresh media. Timepoints were measured every 2–3 days by flow cytometry analysis of >7,000 cells (either a BD Accuri C6 or Beckman Coulter CytoFLEX). Data was analyzed using Cytoflow (https://github.com/bpteague/cytoflow) and custom Python scripts. Events were gated for viability and for mCherry as a delivery marker.
To compute a fraction of OFF cells during doxycycline treatment, we fit a 2 component Gaussian mixture model to the untreated rTetR-only negative control cells which fits both the ON peak and the subpopulation of background-silenced OFF cells, and then set a threshold that was 2 standard deviations below the mean of the ON peak in order to label cells that have silenced as OFF. Using the time-matched untreated control, we calculated the background normalized percentage of cells CellsOFF,normalized = CellsOFF,+dox / (1 – CellsOFF,untreated). Two independently transduced biological replicates were used. A gene silencing model, consisting of the increasing form of the exponential decay (i.e. exponential decay subtracted from 1) during the doxycycline treatment phase and an exponential decay during the doxycycline removal phase with additional parameters for lag times before silencing and reactivation initiate, was fit to the normalized data using SciPy.
Individual activator recruitment assays
Domains were cloned as a fusion with rTetR(SE-G72P) upstream of a T2A-mCherry-BSD marker, using GoldenGate cloning in the backbone pJT126 (Addgene #161926) (Table S2). K562 pDY32 minCMV citrine reporter cells (Table S2) were then transduced with each lentiviral vector and, 3 days later, selected with blasticidin (10 μg/mL) until >80% of the cells were mCherry positive (6–7 days). Cells were split into separate wells of a 24-well plate and either treated with doxycycline or left untreated. Timepoints were measured by flow cytometry analysis of >15,000 cells (Biorad ZE5).
To compute a fraction of ON cells during doxycycline treatment, we fit a Gaussian model to the untreated rTetR-only negative control cells which fits the OFF peak, and then set a threshold that was 2 standard deviations above the mean of the OFF peak in order to label cells that have activated as ON. Two independently transduced biological replicates were used.
Analysis of amino acid residue conservation
The ZNF10 KRAB and MGA protein sequences were submitted to the ConSurf web server (Ashkenazy et al., 2010) and analyzed using the ConSeq method (Berezin et al., 2004). Briefly, ConSeq selects up to 150 homologs for a multiple string alignment, by sampling from the list of homologs with 35–95% sequence identity. Then, a phylogenetic tree is re-constructed and conservation is scored using Rate4Site (Pupko et al., 2002). ConSurf provides normalized scores, so that the average score for all residues is zero, and the standard deviation is one. The conservation scores calculated by ConSurf are a relative measure of evolutionary conservation at each residue in the protein and the lowest score represents the most conserved position in the protein. The residues predicted to be functional are highly conserved and predicted to be exposed. The uniqueness of the ZNF10 KRAB N-terminal extension was determined by protein BLAST to all human proteins and searching for other zinc finger protein among the BLAST matches (Johnson et al., 2008).
Phylogenetic and alignment analyses
KRAB and homeodomain sequences were retrieved from Pfam and extended, using surrounding native sequence, to reach 80 AA. Well-expressed domains were selected for alignment. Phylogenetic trees and sequence alignments were obtained using the alignment website Clustal Omega using default parameters (McWilliam et al., 2013; Sievers et al., 2011), and the phylogenetic neighbor-joining tree without distance corrections was built with default parameters in Jalview (Waterhouse et al., 2009). Alignment visualization was performed in Jalview.
ChIP-seq and ChIP-exo analysis
External ChIP datasets (identifiers in Table S5) were retrieved from multiple sources. ENCODE ChIPseq data was processed with the uniform processing pipeline of ENCODE (ENCODE Project Consortium et al., 2020), (https://www.encodeproject.org/data-standards/chip-seq/) and narrow peaks below IDR threshold 0.05 were retrieved. KRAB ZNF ChIP-exo data from tagged KRAB ZNF overexpression in HEK293 cells and KAP1 ChIP-exo data from H1 hESCs was obtained from GEO accession GSE78099 (Imbeault et al., 2017). Reads were trimmed to a uniform length of 36 basepairs and mapped to the hg38 version of the human genome using Bowtie (version 1.0.1; (Langmead et al., 2009)), allowing for up to 2 mismatches and only retaining unique alignments. Peak were called using MACS2 (version 2.1.0) (Feng et al., 2012) with the following settings: “-g hs -f BAM --keep-dup all --shift −75 --extsize 150 -- nomodel”. For some KRAB ZNFs where ChIP-exo data was not available, ChIP-seq data from tagged KRAB ZNF overexpression in HEK293 cells was obtained from GEO accessions GSE76496 (Schmitges et al., 2016) and GSE52523 (Najafabadi et al., 2015). KRAB ZNF peaks were defined as solo binding sites if no other KRAB ZNF in the dataset had a peak less than 250 basepairs away, and only solo binding sites were included in Figure 2D. ENCODE H3K27ac ChIP-seq datasets for H1 cells were processed with the ENCODE pipeline (ENCODE Project Consortium et al., 2020), narrow peaks were called with MACS2, and peaks below IDR threshold 0.05 were retrieved.
Quantification and Statistical Analysis
Statistical analyses were performed in Python using SciPy (Virtanen et al., 2020). The statistical tests used were two-sided (where applicable) and are indicated in the text and/or figure legends. The “n” for each analysis is indicated in the main text or in figure legends of relevant analyses. Significance was set at p < 0.05. No methods were used to determine whether the data met assumptions of the statistical approach.
Supplementary Material
A. Schematic of lentiviral recruitment vector with Golden Gate cloning site for creating fusions of effector domains to the dox-inducible DNA-binding domain rTetR. The constitutive pEF promoter drives expression of the rTetR-effector fusion and mCherry-BSD (Blasticidin S deaminase resistance gene), separated by a T2A self-cleaving peptide.
B. (Top) Schematic of rTetR-KRAB fusion recruitment to the dual reporter gene. The reporter is integrated in the AAVS1 locus by TALEN-mediated homology-directed repair and the PuroR resistance gene is driven by the endogenous AAVS1 promoter. The dual reporter consists of a synthetic surface marker (Igκ-hIgG1-Fc-PDGFRβ) and a citrine fluorescent protein. (Bottom) Pilot test in K562 reporter cells. Reporter cells were generated by TALEN-mediated homology-directed repair to integrate the reporter into the AAVS1 locus and then selected with puromycin. Cells were then spinfected with lentivirus to deliver rTetR-KRAB, and then either left untreated or treated with 1000 ng/ml doxycycline to induce rTetR binding to DNA at the TetO sites. Untreated cell distributions are shown in light grey and doxycycline-treated cells are shown in black or orange, with two independently-transduced biological replicates in each condition. The lentivirus-treated cells are gated on mCherry as the delivery marker. The KRAB domain from human ZNF10 was used.
C. Demonstration of magnetic separation of OFF from ON cells using ProG Dynabeads that bind to the synthetic surface marker. Ten million cells were subjected to magnetic separation using 30 μl of beads, and the citrine reporter expression was measured before and after by flow cytometry. Illustration of mixed ON and OFF cells being subjected to magnetic separation is shown on the right.
D. (Top) Schematic of high-throughput strategy for measuring the expression level of each domain in the library. Domains under 80AA long are extended on both sides, using their native protein sequence, to reach 80AA so all synthesized library elements are the same length. (Middle) The library is cloned into a FLAG-tagged construct and delivered to K562 cells by lentivirus at low multiplicity of infection, such that the majority of cells express a single library member. The mCherry-BSD fusion protein enables blasticidin selection and a fluorescent marker for delivery and selection efficiency, without the use of a second 2A component. (Bottom) Expression is measured by staining the cells with anti-FLAG, sorting high and low expression populations, sequencing the domains, and computing the log2(FLAGhigh:FLAGlow) ratio.
E. Distribution of FLAG staining levels measured by flow cytometry before and after sorting into two bins (N=2 biological replicates of the cell library shown with overlapping shaded areas).
F. Reproducibility of biological replicates from the domain expression screen (r2=0.82). Well-expressed domains, above the threshold (dashed line one standard deviation above the median of the random controls), were selected for further analysis in the transcriptional regulation screens.
G. Validation of expression level for a panel of KRAB domains. Individual rTetR-3XFLAG-KRAB constructs were delivered to K562 cells by lentivirus. Cells were selected with blasticidin and confirmed to be >80% mCherry positive by flow cytometry. Expression level was measured by Western blot with anti-FLAG antibody. Anti-histone H3 was used as a loading control for normalization. Levels were quantified using ImageJ. Superfluous lanes from the gel are cropped out and the relevant lanes are shown consecutively with white lines in between each lane.
H. Comparison of high-throughput measurements of expression with Western blots protein levels. These 6 KRAB domains were cloned individually using the exact 80 AA sequence from the Pfam domain library.
I. Distribution of expression levels for different categories of library members. Random controls are poorly expressed compared to tiles across the DMD protein or Pfam domains (p<1e-5, Mann Whitney test). The Pfam domains and the DMD tiling controls were similarly well-expressed. Dashed line shows the threshold for expression level, as in (F).
A. Flow cytometry shows citrine reporter level distributions in the pool of cells expressing the Pfam domain library, before and after magnetic separation using ProG DynaBeads that bind to the synthetic surface marker. Overlapping histograms are shown for two biological replicates. The average percentage of cells OFF is shown to the left of the vertical line showing the citrine level gate. 1000 ng/ml doxycycline was added on Day 0 and removed on Day 5.
B. PANTHER protein class enrichments for nuclear proteins that contain repressor domains with stronger or weaker memory, when compared to the background set of all nuclear proteins with domains included in our library.
C. rTetR-SUMO validation time courses fit with gene silencing model (Methods). The 80 AA sequence centered around the Rad60-SLD domain of SUMO3 (which has prior evidence for repression (Chupreta et al., 2005)) and the trimmed domain were individually cloned into lentivirus and delivered to the reporter cells. 1000 ng/ml doxycycline was added on day 0 and removed on day 5 (N=2 biological replicates). The fraction of mCherry-positive cells with the citrine reporter OFF was determined by flow cytometry and normalized for background silencing using the untreated, time-matched controls (Methods).
D. The HUSH complex member MPP8 Chromo domain (which has prior evidence for repression (Chang et al., 2011)) was validated with the full 80 AA sequence used in the screen and sequences trimmed to match the Pfam and UniProt annotations.
E. The CBX1 Chromoshadow domain (which has prior evidence for repression (Lechner et al., 2000)) was validated with the 52 AA sequence trimmed to match the Pfam annotation.
F. The Polycomb 1 component SCMH1 SAM1 domain (also known as SPM and which has prior evidence for repression (Frey et al., 2016)) was validated with the 65 AA sequence trimmed to match the Pfam annotation.
G. HERC2 Cyt-b5 domain validation with the full 80 AA sequence used in the screen and a 72 AA sequence trimmed to match the Pfam annotation.
H. BIN1 SH3_9 domain validation.
I. Polycomb 1 component PCGF2 zf-C3HC4_2 domain validation with 39 AA sequence trimmed to match the Pfam annotation.
J. TOX HMG box domain validation with the full 80 AA sequence used in the screen and a 68 AA sequence trimmed to match the Pfam annotation.
K. Validation of a random 80 AA sequence that functions as a repressor. This sequence was weakly expressed, as measured by FLAG (Figure S1F) like most of the other random sequences (Figure S1I), but functioned as a repressor nonetheless.
A. Silencing by rTetR-KRAB fusions, showing leaky silencing without doxycycline treatment for a subset of KRAB domains (high gray bars). Constructs were delivered to reporter cells by lentivirus at day 0, cells were selected with blasticidin between days 3 and 11, cells were split into a doxycycline-treated or untreated condition at day 11, and reporter levels were measured by flow cytometry at day 16. Results are shown after gating for the mCherry positive cells. The KRAB domains were selected from three categories based on their measurements in the screen, labeled on the right. The bar shows the average and the error bar shows the S.D. (N=3 independently transduced biological replicates).
B. Leakiness can be mitigated by using rTetR(SE-G72P) or introducing 3XFLAG between rTetR and the KRAB domain from ZNF823. Constructs were delivered to reporter cells by lentivirus at day 0, cells were split into a doxycycline-treated or untreated condition at day 4, and reporter levels were measured by flow cytometry at day 7. Results are shown after gating for the mCherry positive cells. A non-leaky KRAB domain from ZNF140 was used as a control. The bar shows the average and the error bar shows the S.D. (N=2 independently transduced biological replicates).
C. The K562 reporter cell lines with stable lentiviral expression of either a leaky KRAB domain from ZNF823 or a non-leaky repressor KRAB domain from ZNF140 cloned as fusions with either rTetR or rTetR(SE-G72P) were treated with varied doses of doxycycline. Reporter levels were measured by flow cytometry four days later, and the percentage of mCherry positive cells with the citrine reporter OFF is shown (N=2 independently transduced biological replicates). The dose response was fit by least squares with a nonlinear variable slope sigmoidal curve using PRISM statistical analysis software.
D. Silencing and memory dynamics for all individual validations of KRAB domains, fit with the gene silencing model (Methods). rTetR(SE-G72P)-KRAB fusions were delivered to K562 reporter cells by lentivirus, selected with blasticidin, and then 10 ng/ml doxycycline was added on day 0 and removed on day 5 (N=2 biological replicates). The fraction of mCherry positive cells with the citrine reporter OFF was determined by flow cytometry and normalized for background silencing using the untreated, time-matched controls. We used 10 ng/ml dox to work in a dynamic range where it is easier to measure differences in silencing and memory capabilities between fast KRAB silencing domains. With 1000 ng/ml doxycycline, all of the repressor hit KRAB domains here (greens and oranges) fully silence the reporter within 5 days with indistinguishable dynamics (data not shown). Notably, the KRABs that were leaky on rTetR (oranges), do not show significantly different memory dynamics from the KRABs that were not leaky (greens) when fused to the rTetR(SE-G72P). Importantly, none of the rTetR(SE-G72P)-KRAB fusions showed significant leaky silencing in the untreated condition.
A. Flow cytometry shows citrine reporter levels in the cells with the pooled KRAB library, before and after magnetic separation using ProG DynaBeads that bind to the synthetic surface marker. Overlapping histograms are shown for two biological replicates. The average percentage of cells OFF is shown to the left of the vertical line showing the citrine level gate.
B. OFF:ON enrichments from two biological replicates of the deep mutational library of the ZNF10 KRAB domain at days 5, 9 and 13. Cells were treated with 1000 ng/ml doxycycline for the first 5 days. Grey diagonal lines show where the average log2(OFF:ON) is the median of the WT domains (black dots). The black diagonal lines show the fit linear model.
C. Alignment of human ZNF10 KRAB with mouse KRAB used in the NMR structure (PDB:1v65) and KRAB-O used in the recombinant protein binding assays (Peng et al., 2009). The ordered region (positions 13–54, 55% identity, 69% similarity) is used in Figure 3D and the aligned region containing all 12 necessary residues (positions 12–71, 50% identity, 75% similarity) is used in Figure S4D. The residues necessary for silencing at day 5 are colored in red in the ZNF10 and PDB:1v65 sequences. The residues necessary for binding recombinant KAP1 are colored in red and the residues unnecessary for binding KAP1 are colored in grey in the KRAB-O sequence, summarizing previously published results (Peng et al., 2009). There was significant agreement between the necessary and unnecessary residues from the mutational scan and the binding assay (p<1e-4, Fisher’s exact test). We also inspected the DMS day 5 silencing scores for the specific single, double, and triple alanine substitutions used in the binding assay, and found perfect agreement: mutations that ablated binding also abolished silencing (Z-score<−4 compared to wild-type distribution), and mutations that did not affect binding also did not affect silencing (|Z-score|<0.6) (p<0.01, n=12 mutations, Fisher’s exact test).
D. Ensemble of 20 states of the KRAB NMR structure (PDB:1v65). The residues necessary for silencing at day 5 are colored in red.
E. Silencing and memory dynamics for all individual validations of KRAB ZNF10 mutants, fit with the gene silencing model (Methods). (Top) rTetR-KRAB fusions were delivered to K562 reporter cells by lentivirus, selected with blasticidin, and then 1000 ng/ml doxycycline was added on day 0 and removed on day 5 (N=2 biological replicates. (Bottom) rTetR(SE-G72P)-KRAB fusions were delivered to K562 reporter cells by lentivirus, selected with blasticidin, and then 10 ng/ml doxycycline was added on day 0 and removed on day 5 (N=2 biological replicates). The column labels describe the variant location within the KRAB domain and impact on effector function. The fraction of mCherry positive cells with the citrine reporter OFF was determined by flow cytometry and normalized for background silencing using the untreated, time-matched controls. All of the rTetR(SE-G72P)-KRAB fusions were also measured over 5 days of treatment with 1000 ng/ml doxycycline and the results were indistinguishable from those with rTetR, with all KRAB variants completely silencing the reporter except the EEW25AAA variant that does not silence (data not shown).
F. Correlation of rTetR-KRAB fusion expression level and day 13 silencing score, from the Pfam domain library. Expression is measured by staining the cells with anti-FLAG, sorting high and low expression populations, sequencing the domains, and computing the log2(FLAGhigh:FLAGlow) ratio (shown in Figure S1D) and the silencing score was measured with HT-recruit (shown in Figure 1A). Only KRAB domains that were shown to interact with co-repressor KAP1 by IP/MS (Helleboid et al., 2019) are included.
G. Correlations of amino acid frequency with domain expression level measured by FLAG (shown in Figure S1D), across the library of Pfam domains and controls (Pearson’s r value is shown).
H. Western blot for FLAG-tagged rTetR-KRAB fusions after lentiviral delivery to K562. Cells were selected for delivery with blasticidin and were confirmed to be >80% mCherry positive by flow cytometry. Expression level relative to the H3 loading control was quantified using ImageJ. Superfluous lanes from the gel are cropped out and the relevant lanes are shown consecutively with white lines in between each lane.
A. Flow cytometry for pooled library of Pfam domains in activation reporter cells, before and after magnetic separation. The percentage of cells ON is shown to the right of the citrine level gate, drawn with a vertical line. 1–2 biological replicates are shown with overlapping shaded areas.
B. GO term enrichment of genes containing a hit activation domain, compared to the background set of all proteins containing a well-expressed domain in the library after counts filtering. Raw p-values are shown, and all shown terms are below a 10% false discovery rate.
C. Individual validations of activator domains. rTetR(SE-G72P)-domain fusions were delivered to K562 reporter cells by lentivirus and selected with blasticidin. Cells were treated with 1000 ng/ml doxycycline for 2 days, and then citrine reporter levels were measured by flow cytometry. Untreated cell distributions are shown in light grey and doxycycline-treated cells are shown in colors, with two independently-transduced biological replicates in each condition. The vertical line shows the citrine gate used to determine the fraction of cells ON, and the average fraction ON for the doxycycline-treated cells is shown. VP64 is a positive control. Each domain was tested as both the extended 80 AA sequence from the library or the trimmed Pfam-annotated domain sequence, with the exceptions of Med9 and DUF3446 which had minimal extensions because the Pfam annotated regions are 75 and 69 AA, respectively. The corresponding results for the 80 AA library sequence for the KRAB domains are shown in Figure 5.
A. Flow cytometry shows citrine reporter level distributions in the pool of cells expressing the tiling library, before and after magnetic separation using ProG DynaBeads that bind to the synthetic surface marker. Overlapping histograms are shown for two biological replicates. The average percentage of cells OFF is shown to the left of the vertical line showing the citrine level gate. 1000 ng/ml doxycycline was added on Day 0 and removed on Day 5.
B. High-throughput recruitment measurements from two biological replicates of a nuclear protein tiling library at Day 5 of doxycycline treatment and Day 13, 8 days after doxycycline removal. The hit calling threshold is 2 standard deviations above the mean of the random and DMD tiling controls.
C. Tiling results for KRAB Zinc finger proteins ZNF57 and ZNF461. Each bar is an 80 AA tile and the vertical error bars are the range from 2 biological replicates. Protein annotations are sourced from UniProt.
D. Tiling RYBP. Diagram shows protein annotations, retrieved using the UniProt ID written at top. Vertical error bars show the standard error from two biological replicates.
E. Tiling REST.
F. Tiling CBX7.
G. Tiling DNMT3B.
H. (Left) Tiling DMD. (Right) Dynamics of silencing and memory after recruitment of DMD hit tiles. Cells were treated with 1000 ng/ml dox for the first 5 days and citrine reporter levels were measured by flow cytometry. The percentage of cells OFF was normalized to account for background silencing and the data (dots) were fit with a gene silencing model (curves) (N=2 biological replicates).
The library oligonucleotide designs are attached in an Excel file.
The lentiviral rTetR recruitment vectors and the plasmids for engineering reporter cell lines are attached in an Excel file.
The primers used for oligonucleotide subpool amplification and sequencing library preparation are described in the attached Excel file.
The HT-recruit data for the Pfam domain repressor and activator screens, the tiling repressor screen, and the KRAB repressor deep mutational scan are in the attached Excel file.
The ChIP dataset identifiers are in the attached Excel file.
HT-recruit identifies transcriptional repressors and activators in 600 human proteins.
Evolutionarily young KRAB domains are repressors, while some old ones are activators.
Mutational scan of KRAB from CRISPRi maps binding surface and finds enhanced variants.
Homeodomain repressor strength is colinear with Hox gene organization.
Acknowledgements
We thank David Morgens, Connor Ludwig, Sarah Lensch, Roarke Kamber, William J. Greenleaf, Alistair Boettiger and members of our laboratories for helpful conversations and assistance, and Stanley Qi for allowing us use of the Cytoflex cytometer. We thank Twist Biosciences for oligonucleotide library synthesis. This work was supported by NIH-ENCODE 5UM1HG009436-02 (A.K. and M.C.B.), NIH-NIGMS R35M128947 (L.B.), NIH-NIDDK F99/K00 F99DK126120 (J.T.), NIH T32 Training Grants T32GM007276 (M.V.V.) and 5T32GM007365-45 (A.M), NSF GRFP DGE-1656518 (J.T. and N.D.), Molecular Biophysics Training Program at Stanford GM08294 (P.S.), NIH Director’s New Innovator Award (1DP2HD08406901) (M.C.B.), and BWF-CASI Award (L.B.).
Footnotes
Declaration of interests
Stanford University has filed a provisional patent related to this work.
Publisher's Disclaimer: This is a PDF file of an unedited manuscript that has been accepted for publication. As a service to our customers we are providing this early version of the manuscript. The manuscript will undergo copyediting, typesetting, and review of the resulting proof before it is published in its final form. Please note that during the production process errors may be discovered which could affect the content, and all legal disclaimers that apply to the journal pertain.
References
- Al Chiblak M, Steinbeck F, Thiesen H-J, and Lorenz P. (2019). DUF3669, a “domain of unknown function” within ZNF746 and ZNF777, oligomerizes and contributes to transcriptional repression. BMC Mol Cell Biol 20, 60. [DOI] [PMC free article] [PubMed] [Google Scholar]
- Arnold CD, Nemčko F, Woodfin AR, Wienerroither S, Vlasova A, Schleiffer A, Pagani M, Rath M, and Stark A. (2018). A high-throughput method to identify trans-activation domains within transcription factor sequences. EMBO J. e98896. [DOI] [PMC free article] [PubMed] [Google Scholar]
- Ashkenazy H, Erez E, Martz E, Pupko T, and Ben-Tal N. (2010). ConSurf 2010: calculating evolutionary conservation in sequence and structure of proteins and nucleic acids. Nucleic Acids Res. 38, W529–W533. [DOI] [PMC free article] [PubMed] [Google Scholar]
- Bakan A, Meireles LM, and Bahar I. (2011). ProDy: protein dynamics inferred from theory and experiments. Bioinformatics 27, 1575–1577. [DOI] [PMC free article] [PubMed] [Google Scholar]
- Ballas N, Battaglioli E, Atouf F, Andres ME, Chenoweth J, Anderson ME, Burger C, Moniwa M, Davie JR, Bowers WJ, et al. (2001). Regulation of neuronal traits by a novel transcriptional complex. Neuron 31, 353–365. [DOI] [PubMed] [Google Scholar]
- Berezin C, Glaser F, Rosenberg J, Paz I, Pupko T, Fariselli P, Casadio R, and Ben-Tal N. (2004). ConSeq: the identification of functionally and structurally important residues in protein sequences. Bioinformatics 20, 1322–1324. [DOI] [PubMed] [Google Scholar]
- Bersaglieri C, and Santoro R. (2019). Genome Organization in and around the Nucleolus. Cells 8. [DOI] [PMC free article] [PubMed] [Google Scholar]
- Bintu L, Yong J, Antebi YE, McCue K, Kazuki Y, Uno N, Oshimura M, and Elowitz MB (2016). Dynamics of epigenetic regulation at the single-cell level. Science 351, 720–724. [DOI] [PMC free article] [PubMed] [Google Scholar]
- Birbach A, Bailey ST, Ghosh S, and Schmid JA (2004). Cytosolic, nuclear and nucleolar localization signals determine subcellular distribution and activity of the NF-kappaB inducing kinase NIK. J. Cell Sci. 117, 3615–3624. [DOI] [PubMed] [Google Scholar]
- Birtle Z, and Ponting CP (2006). Meisetz and the birth of the KRAB motif. Bioinformatics 22, 2841–2845. [DOI] [PubMed] [Google Scholar]
- Blackledge NP, Farcas AM, Kondo T, King HW, McGouran JF, Hanssen LLP, Ito S, Cooper S, Kondo K, Koseki Y, et al. (2014). Variant PRC1 complex-dependent H2A ubiquitylation drives PRC2 recruitment and polycomb domain formation. Cell 157, 1445–1459. [DOI] [PMC free article] [PubMed] [Google Scholar]
- Chang Y, Sun L, Kokura K, Horton JR, Fukuda M, Espejo A, Izumi V, Koomen JM, Bedford MT, Zhang X, et al. (2011). MPP8 mediates the interactions between DNA methyltransferase Dnmt3a and H3K9 methyltransferase GLP/G9a. Nat. Commun. 2, 533. [DOI] [PMC free article] [PubMed] [Google Scholar]
- Cheng C-T, Kuo C-Y, and Ann DK (2014). KAPtain in charge of multiple missions: Emerging roles of KAP1. World J. Biol. Chem. 5, 308–320. [DOI] [PMC free article] [PubMed] [Google Scholar]
- Chevron MP, Girard F, Claustres M, and Demaille J. (1994). Expression and subcellular localization of dystrophin in skeletal, cardiac and smooth muscles during the human development. Neuromuscul. Disord. 4, 419–432. [DOI] [PubMed] [Google Scholar]
- Childs KS, and Goodbourn S. (2003). Identification of novel co-repressor molecules for Interferon Regulatory Factor-2. Nucleic Acids Res. 31, 3016–3026. [DOI] [PMC free article] [PubMed] [Google Scholar]
- Chittock EC, Latwiel S, Miller TCR, and Müller CW (2017). Molecular architecture of polycomb repressive complexes. Biochem. Soc. Trans. 45, 193–205. [DOI] [PMC free article] [PubMed] [Google Scholar]
- Chupreta S, Holmstrom S, Subramanian L, and Iñiguez-Lluhí JA (2005). A small conserved surface in SUMO is the critical structural determinant of its transcriptional inhibitory properties. Mol. Cell. Biol. 25, 4272–4282. [DOI] [PMC free article] [PubMed] [Google Scholar]
- Copley RR (2005). The EH1 motif in metazoan transcription factors. BMC Genomics 6, 169. [DOI] [PMC free article] [PubMed] [Google Scholar]
- Corsetti MT, Levi G, Lancia F, Sanseverino L, Ferrini S, Boncinelli E, and Corte G. (1995). Nucleolar localisation of three Hox homeoproteins. J. Cell Sci. 108 ( Pt 1), 187–193. [DOI] [PubMed] [Google Scholar]
- Dorris DR, and Struhl K. (2000). Artificial recruitment of TFIID, but not RNA polymerase II holoenzyme, activates transcription in mammalian cells. Mol. Cell. Biol. 20, 4350–4358. [DOI] [PMC free article] [PubMed] [Google Scholar]
- Drueppel L, Pfleiderer K, Schmidt A, Hillen W, and Berens C. (2004). A short autonomous repression motif is located within the N-terminal domain of CTCF. FEBS Lett. 572, 154–158. [DOI] [PubMed] [Google Scholar]
- Duboule D, and Morata G. (1994). Colinearity and functional hierarchy among genes of the homeotic complexes. Trends in Genetics 10, 358–364. [DOI] [PubMed] [Google Scholar]
- El-Gebali S, Mistry J, Bateman A, Eddy SR, Luciani A, Potter SC, Qureshi M, Richardson LJ, Salazar GA, Smart A, et al. (2019). The Pfam protein families database in 2019. Nucleic Acids Res. 47, D427–D432. [DOI] [PMC free article] [PubMed] [Google Scholar]
- Elliott K, Sakamuro D, Basu A, Du W, Wunner W, Staller P, Gaubatz S, Zhang H, Prochownik E, Eilers M, et al. (1999). Bin1 functionally interacts with Myc and inhibits cell proliferation via multiple mechanisms. Oncogene 18, 3564–3573. [DOI] [PubMed] [Google Scholar]
- ENCODE Project Consortium, Moore JE, Purcaro MJ, Pratt HE, Epstein CB, Shoresh N, Adrian J, Kawli T, Davis CA, Dobin A, et al. (2020). Expanded encyclopaedias of DNA elements in the human and mouse genomes. Nature 583, 699–710. [DOI] [PMC free article] [PubMed] [Google Scholar]
- Erijman A, Kozlowski L, Sohrabi-Jahromi S, Fishburn J, Warfield L, Schreiber J, Noble WS, Söding J, and Hahn S. (2020). A High-Throughput Screen for Transcription Activation Domains Reveals Their Sequence Features and Permits Prediction by Deep Learning. Mol. Cell 78, 890–902.e6. [DOI] [PMC free article] [PubMed] [Google Scholar]
- Feng J, Liu T, Qin B, Zhang Y, and Liu XS (2012). Identifying ChIP-seq enrichment using MACS. Nat. Protoc. 7, 1728–1740. [DOI] [PMC free article] [PubMed] [Google Scholar]
- Fisher AL, Ohsako S, and Caudy M. (1996). The WRPW motif of the hairy-related basic helix-loop-helix repressor proteins acts as a 4-amino-acid transcription repression and protein-protein interaction domain. Mol. Cell. Biol. 16, 2670–2677. [DOI] [PMC free article] [PubMed] [Google Scholar]
- Fowler DM, and Fields S. (2014). Deep mutational scanning: a new style of protein science. Nat. Methods 11, 801–807. [DOI] [PMC free article] [PubMed] [Google Scholar]
- Frey F, Sheahan T, Finkl K, Stoehr G, Mann M, Benda C, and Müller J. (2016). Molecular basis of PRC1 targeting to Polycomb response elements by PhoRC. Genes Dev. 30, 1116–1127. [DOI] [PMC free article] [PubMed] [Google Scholar]
- García E, Marcos-Gutiérrez C, del Mar Lorente M, Moreno JC, and Vidal M. (1999). RYBP, a new repressor protein that interacts with components of the mammalian Polycomb complex, and with the transcription factor YY1. EMBO J. 18, 3404–3418. [DOI] [PMC free article] [PubMed] [Google Scholar]
- Gaudreau L, Keaveney M, Nevado J, Zaman Z, Bryant GO, Struhl K, and Ptashne M. (1999). Transcriptional activation by artificial recruitment in yeast is influenced by promoter architecture and downstream sequences. Proc. Natl. Acad. Sci. U. S. A. 96, 2668–2673. [DOI] [PMC free article] [PubMed] [Google Scholar]
- Gilbert SF (1971). Developmental Biology (Sinauer Associates). [Google Scholar]
- Gilbert LA, Horlbeck MA, Adamson B, Villalta JE, Chen Y, Whitehead EH, Guimaraes C, Panning B, Ploegh HL, Bassik MC, et al. (2014). Genome-Scale CRISPR-Mediated Control of Gene Repression and Activation. Cell 159, 647–661. [DOI] [PMC free article] [PubMed] [Google Scholar]
- Guetg C, Lienemann P, Sirri V, Grummt I, Hernandez-Verdun D, Hottiger MO, Fussenegger M, and Santoro R. (2010). The NoRC complex mediates the heterochromatin formation and stability of silent rRNA genes and centromeric repeats. EMBO J. 29, 2135–2146. [DOI] [PMC free article] [PubMed] [Google Scholar]
- Han K, and Manley JL (1993). Transcriptional repression by the Drosophila even-skipped protein: definition of a minimal repression domain. Genes Dev. 7, 491–503. [DOI] [PubMed] [Google Scholar]
- Haney MS, Bohlen CJ, Morgens DW, Ousey JA, Barkal AA, Tsui CK, Ego BK, Levin R, Kamber RA, Collins H, et al. (2018). Identification of phagocytosis regulators using magnetic genome-wide CRISPR screens. Nat. Genet. 50, 1716–1727. [DOI] [PMC free article] [PubMed] [Google Scholar]
- Helleboid P-Y, Heusel M, Duc J, Piot C, Thorball CW, Coluccio A, Pontis J, Imbeault M, Turelli P, Aebersold R, et al. (2019). The interactome of KRAB zinc finger proteins reveals the evolutionary history of their functional diversification. EMBO J. 38, e101220. [DOI] [PMC free article] [PubMed] [Google Scholar]
- Heredia JD, Park J, Brubaker RJ, Szymanski SK, Gill KS, and Procko E. (2018). Mapping Interaction Sites on Human Chemokine Receptors by Deep Mutational Scanning. J. Immunol. 200, 3825–3839. [DOI] [PMC free article] [PubMed] [Google Scholar]
- Holland PWH, Booth HAF, and Bruford EA (2007). Classification and nomenclature of all human homeobox genes. BMC Biol. 5, 47. [DOI] [PMC free article] [PubMed] [Google Scholar]
- Hueber SD, Weiller GF, Djordjevic MA, and Frickey T. (2010). Improving Hox protein classification across the major model organisms. PLoS One 5, e10820. [DOI] [PMC free article] [PubMed] [Google Scholar]
- Hyun K, Jeon J, Park K, and Kim J. (2017). Writing, erasing and reading histone lysine methylations. Exp. Mol. Med. 49, e324. [DOI] [PMC free article] [PubMed] [Google Scholar]
- Imbeault M, Helleboid P-Y, and Trono D. (2017). KRAB zinc-finger proteins contribute to the evolution of gene regulatory networks. Nature 543, 550–554. [DOI] [PubMed] [Google Scholar]
- Johnson M, Zaretskaya I, Raytselis Y, Merezhuk Y, McGinnis S, and Madden TL (2008). NCBI BLAST: a better web interface. Nucleic Acids Res. 36, W5–W9. [DOI] [PMC free article] [PubMed] [Google Scholar]
- Jolma A, Yan J, Whitington T, Toivonen J, Nitta KR, Rastas P, Morgunova E, Enge M, Taipale M, Wei G, et al. (2013). DNA-binding specificities of human transcription factors. Cell 152, 327–339. [DOI] [PubMed] [Google Scholar]
- Keung AJ, Bashor CJ, Kiriakov S, Collins JJ, and Khalil AS (2014). Using targeted chromatin regulators to engineer combinatorial and spatial transcriptional regulation. Cell 158, 110–120. [DOI] [PMC free article] [PubMed] [Google Scholar]
- Kim G-D, Ni J, Kelesoglu N, Roberts RJ, and Pradhan S. (2002). Co-operation and communication between the human maintenance and de novo DNA (cytosine-5) methyltransferases. EMBO J. 21, 4183–4195. [DOI] [PMC free article] [PubMed] [Google Scholar]
- Kinsella RJ, Kähäri A, Haider S, Zamora J, Proctor G, Spudich G, Almeida-King J, Staines D, Derwent P, Kerhornou A, et al. (2011). Ensembl BioMarts: a hub for data retrieval across taxonomic space. Database 2011, bar030. [DOI] [PMC free article] [PubMed] [Google Scholar]
- Kotler E, Shani O, Goldfeld G, Lotan-Pompan M, Tarcic O, Gershoni A, Hopf TA, Marks DS, Oren M, and Segal E. (2018). A Systematic p53 Mutation Library Links Differential Functional Impact to Cancer Mutation Pattern and Evolutionary Conservation. Mol. Cell 71, 873. [DOI] [PMC free article] [PubMed] [Google Scholar]
- Lambert SA, Jolma A, Campitelli LF, Das PK, Yin Y, Albu M, Chen X, Taipale J, Hughes TR, and Weirauch MT (2018). The Human Transcription Factors. Cell 175, 598–599. [DOI] [PubMed] [Google Scholar]
- Langmead B, Trapnell C, Pop M, and Salzberg SL (2009). Ultrafast and memory-efficient alignment of short DNA sequences to the human genome. Genome Biol. 10, R25. [DOI] [PMC free article] [PubMed] [Google Scholar]
- Lechner MS, Begg GE, Speicher DW, and Rauscher FJ (2000). Molecular Determinants for Targeting Heterochromatin Protein 1-Mediated Gene Silencing: Direct Chromoshadow Domain–KAP-1 Corepressor Interaction Is Essential. Mol. Cell. Biol. 20, 6449–6465. [DOI] [PMC free article] [PubMed] [Google Scholar]
- Li Q, Wang X, Lu Z, Zhang B, Guan Z, Liu Z, Zhong Q, Gu L, Zhou J, Zhu B, et al. (2010). Polycomb CBX7 directly controls trimethylation of histone H3 at lysine 9 at the p16 locus. PLoS One 5, e13732. [DOI] [PMC free article] [PubMed] [Google Scholar]
- Liu J, Perumal NB, Oldfield CJ, Su EW, Uversky VN, and Dunker AK (2006). Intrinsic disorder in transcription factors. Biochemistry 45, 6873–6888. [DOI] [PMC free article] [PubMed] [Google Scholar]
- Losson R, and Nielsen AL (2010). The NIZP1 KRAB and C2HR domains cross-talk for transcriptional regulation. Biochim. Biophys. Acta 1799, 463–468. [DOI] [PubMed] [Google Scholar]
- Lynch VJ, Roth JJ, and Wagner GP (2006). Adaptive evolution of Hox-gene homeodomains after cluster duplications. BMC Evol. Biol. 6, 86. [DOI] [PMC free article] [PubMed] [Google Scholar]
- Mallo M, and Alonso CR (2013). The regulation of Hox gene expression during animal development. Development 140, 3951–3963. [DOI] [PubMed] [Google Scholar]
- Mann RS, and Hogness DS (1990). Functional dissection of Ultrabithorax proteins in D. melanogaster. Cell 60, 597–610. [DOI] [PubMed] [Google Scholar]
- Margolin JF, Friedman JR, Meyer WK, Vissing H, Thiesen HJ, and Rauscher FJ (1994). Krüppel-associated boxes are potent transcriptional repression domains. Proc. Natl. Acad. Sci. U. S. A. 91, 4509–4513. [DOI] [PMC free article] [PubMed] [Google Scholar]
- Martin RM, Ter-Avetisyan G, Herce HD, Ludwig AK, Lättig-Tünnemann G, and Cardoso MC (2015). Principles of protein targeting to the nucleolus. Nucleus 6, 314–325. [DOI] [PMC free article] [PubMed] [Google Scholar]
- McWilliam H, Li W, Uludag M, Squizzato S, Park YM, Buso N, Cowley AP, and Lopez R. (2013). Analysis Tool Web Services from the EMBL-EBI. Nucleic Acids Res. 41, W597–W600. [DOI] [PMC free article] [PubMed] [Google Scholar]
- Mifsud W, and Bateman A. (2002). Membrane-bound progesterone receptors contain a cytochrome b5-like ligand-binding domain. Genome Biol. 3, RESEARCH0068. [DOI] [PMC free article] [PubMed] [Google Scholar]
- Mitchell PJ, and Tjian R. (1989). Transcriptional regulation in mammalian cells by sequence-specific DNA binding proteins. Science 245, 371–378. [DOI] [PubMed] [Google Scholar]
- Mitrea DM, Cika JA, Guy CS, Ban D, Banerjee PR, Stanley CB, Nourse A, Deniz AA, and Kriwacki RW (2016). Nucleophosmin integrates within the nucleolus via multi-modal interactions with proteins displaying R-rich linear motifs and rRNA. Elife 5. [DOI] [PMC free article] [PubMed] [Google Scholar]
- Moussa HF, Bsteh D, Yelagandula R, Pribitzer C, Stecher K, Bartalska K, Michetti L, Wang J, Zepeda-Martinez JA, Elling U, et al. (2019). Canonical PRC1 controls sequence-independent propagation of Polycomb-mediated gene silencing. Nat. Commun. 10, 1931. [DOI] [PMC free article] [PubMed] [Google Scholar]
- Najafabadi HS, Mnaimneh S, Schmitges FW, Garton M, Lam KN, Yang A, Albu M, Weirauch MT, Radovani E, Kim PM, et al. (2015). C2H2 zinc finger proteins greatly expand the human regulatory lexicon. Nat. Biotechnol. 33, 555–562. [DOI] [PubMed] [Google Scholar]
- Nevado J, Gaudreau L, Adam M, and Ptashne M. (1999). Transcriptional activation by artificial recruitment in mammalian cells. Proceedings of the National Academy of Sciences 96, 2674–2677. [DOI] [PMC free article] [PubMed] [Google Scholar]
- Nott A, Holtman IR, Coufal NG, Schlachetzki JCM, Yu M, Hu R, Han CZ, Pena M, Xiao J, Wu Y, et al. (2019). Brain cell type–specific enhancer–promoter interactome maps and disease-risk association. Science 366, 1134–1139. [DOI] [PMC free article] [PubMed] [Google Scholar]
- Paroush Z, Finley RL Jr, Kidd T, Wainwright SM, Ingham PW, Brent R, and Ish-Horowicz D. (1994). Groucho is required for Drosophila neurogenesis, segmentation, and sex determination and interacts directly with hairy-related bHLH proteins. Cell 79, 805–815. [DOI] [PubMed] [Google Scholar]
- Partridge EC, Christopher Partridge E, Chhetri SB, Prokop JW, Ramaker RC, Jansen CS, Goh S-T, Mackiewicz M, Newberry KM, Brandsmeier LA, et al. (2020). Occupancy maps of 208 chromatin-associated proteins in one human cell type. Nature 583, 720–728. [DOI] [PMC free article] [PubMed] [Google Scholar]
- Peng H, Gibson LC, Capili AD, Borden KLB, Osborne MJ, Harper SL, Speicher DW, Zhao K, Marmorstein R, Rock TA, et al. (2007). The Structurally Disordered KRAB Repression Domain Is Incorporated into a Protease Resistant Core upon Binding to KAP-1-RBCC Domain. Journal of Molecular Biology 370, 269–289. [DOI] [PubMed] [Google Scholar]
- Peng H, Ivanov AV, Oh HJ, Lau Y-FC, and Rauscher FJ 3rd (2009). Epigenetic gene silencing by the SRY protein is mediated by a KRAB-O protein that recruits the KAP1 co-repressor machinery. J. Biol. Chem. 284, 35670–35680. [DOI] [PMC free article] [PubMed] [Google Scholar]
- Pupko T, Bell RE, Mayrose I, Glaser F, and Ben-Tal N. (2002). Rate4Site: an algorithmic tool for the identification of functional regions in proteins by surface mapping of evolutionary determinants within their homologues. Bioinformatics 18 Suppl 1, S71–S77. [DOI] [PubMed] [Google Scholar]
- Ramalingam A, and Prendergast GC (2007). Bin1 homolog hob1 supports a Rad6-Set1 pathway of transcriptional repression in fission yeast. Cell Cycle 6, 1655–1662. [DOI] [PubMed] [Google Scholar]
- Ravarani CNJ, Erkina TY, De Baets G, Dudman DC, Erkine AM, and Babu MM (2018). High-throughput discovery of functional disordered regions: investigation of transactivation domains. Mol. Syst. Biol. 14, e8190. [DOI] [PMC free article] [PubMed] [Google Scholar]
- Roney IJ, Rudner AD, Couture J-F, and Kærn M. (2016). Improvement of the reverse tetracycline transactivator by single amino acid substitutions that reduce leaky target gene expression to undetectable levels. Sci. Rep. 6, 27697. [DOI] [PMC free article] [PubMed] [Google Scholar]
- Rueden CT, Schindelin J, Hiner MC, DeZonia BE, Walter AE, Arena ET, and Eliceiri KW (2017). ImageJ2: ImageJ for the next generation of scientific image data. BMC Bioinformatics 18, 529. [DOI] [PMC free article] [PubMed] [Google Scholar]
- Sadowski I, Ma J, Triezenberg S, and Ptashne M. (1988). GAL4-VP16 is an unusually potent transcriptional activator. Nature 335, 563–564. [DOI] [PubMed] [Google Scholar]
- Sanjana NE, Cong L, Zhou Y, Cunniff MM, Feng G, and Zhang F. (2012). A transcription activator-like effector toolbox for genome engineering. Nat. Protoc. 7, 171–192. [DOI] [PMC free article] [PubMed] [Google Scholar]
- Schmitges FW, Radovani E, Najafabadi HS, Barazandeh M, Campitelli LF, Yin Y, Jolma A, Zhong G, Guo H, Kanagalingam T, et al. (2016). Multiparameter functional diversity of human C2H2 zinc finger proteins. Genome Res. 26, 1742–1752. [DOI] [PMC free article] [PubMed] [Google Scholar]
- Schnabel CA, and Abate-Shen C. (1996). Repression by HoxA7 is mediated by the homeodomain and the modulatory action of its N-terminal-arm residues. Mol. Cell. Biol. 16, 2678–2688. [DOI] [PMC free article] [PubMed] [Google Scholar]
- Sidore AM, Plesa C, Samson JA, Lubock NB, and Kosuri S. (2020). DropSynth 2.0: high-fidelity multiplexed gene synthesis in emulsions. Nucleic Acids Res. [DOI] [PMC free article] [PubMed] [Google Scholar]
- Sievers F, Wilm A, Dineen D, Gibson TJ, Karplus K, Li W, Lopez R, McWilliam H, Remmert M, Söding J, et al. (2011). Fast, scalable generation of high-quality protein multiple sequence alignments using Clustal Omega. Mol. Syst. Biol. 7, 539. [DOI] [PMC free article] [PubMed] [Google Scholar]
- Sievers QL, Petzold G, Bunker RD, Renneville A, Słabicki M, Liddicoat BJ, Abdulrahman W, Mikkelsen T, Ebert BL, and Thomä NH (2018). Defining the human C2H2 zinc finger degrome targeted by thalidomide analogs through CRBN. Science 362. [DOI] [PMC free article] [PubMed] [Google Scholar]
- Sims RJ 3rd, Nishioka K, and Reinberg D. (2003). Histone lysine methylation: a signature for chromatin function. Trends Genet. 19, 629–639. [DOI] [PubMed] [Google Scholar]
- Staller MV, Holehouse AS, Swain-Lenz D, Das RK, Pappu RV, and Cohen BA (2018). A High-Throughput Mutational Scan of an Intrinsically Disordered Acidic Transcriptional Activation Domain. Cell Syst 6, 444–455.e6. [DOI] [PMC free article] [PubMed] [Google Scholar]
- Stielow B, Finkernagel F, Stiewe T, Nist A, and Suske G. (2018). MGA, L3MBTL2 and E2F6 determine genomic binding of the non-canonical Polycomb repressive complex PRC1.6. PLoS Genet. 14, e1007193. [DOI] [PMC free article] [PubMed] [Google Scholar]
- Takahashi H, Kasahara K, and Kokubo T. (2009). Saccharomyces cerevisiae Med9 comprises two functionally distinct domains that play different roles in transcriptional regulation. Genes Cells 14, 53–67. [DOI] [PubMed] [Google Scholar]
- Tycko J, Van MV, Elowitz MB, and Bintu L. (2017). Advancing towards a global mammalian gene regulation model through single-cell analysis and synthetic biology. Current Opinion in Biomedical Engineering. [Google Scholar]
- UniProt Consortium (2015). UniProt: a hub for protein information. Nucleic Acids Res. 43, D204–D212. [DOI] [PMC free article] [PubMed] [Google Scholar]
- Virtanen P, Gommers R, Oliphant TE, Haberland M, Reddy T, Cournapeau D, Burovski E, Peterson P, Weckesser W, Bright J, et al. (2020). SciPy 1.0: fundamental algorithms for scientific computing in Python. Nat. Methods 17, 261–272. [DOI] [PMC free article] [PubMed] [Google Scholar]
- Wang R, Taylor AB, and Kim CA (2010). Ring1B C-terminal domain/RYBP C-terminal domain Complex. [Google Scholar]
- Waterhouse AM, Procter JB, Martin DMA, Clamp M, and Barton GJ (2009). Jalview Version 2-a multiple sequence alignment editor and analysis workbench. Bioinformatics 25, 1189–1191. [DOI] [PMC free article] [PubMed] [Google Scholar]
- Wellik DM, and Capecchi MR (2003). Hox10 and Hox11 genes are required to globally pattern the mammalian skeleton. Science 301, 363–367. [DOI] [PubMed] [Google Scholar]
- Witzgall R, O’Leary E, Leaf A, Onaldi D, and Bonventre JV (1994). The Krüppel-associated box-A (KRAB-A) domain of zinc finger proteins mediates transcriptional repression. Proc. Natl. Acad. Sci. U. S. A. 91, 4514–4518. [DOI] [PMC free article] [PubMed] [Google Scholar]
- Zhao Y, and Potter SS (2001). Functional specificity of the Hoxa13 homeobox. Development 128, 3197–3207. [DOI] [PubMed] [Google Scholar]
- Zhao J, Wang M, Chang L, Yu J, Song A, Liu C, Huang W, Zhang T, Wu X, Shen X, et al. (2020). RYBP/YAF2-PRC1 complexes and histone H1-dependent chromatin compaction mediate propagation of H2AK119ub1 during cell division. Nat. Cell Biol. 22, 439–452. [DOI] [PubMed] [Google Scholar]
- Zulkower V, and Rosser S. (2020). DNA Chisel, a versatile sequence optimizer. Bioinformatics. [DOI] [PubMed] [Google Scholar]
Associated Data
This section collects any data citations, data availability statements, or supplementary materials included in this article.
Supplementary Materials
A. Schematic of lentiviral recruitment vector with Golden Gate cloning site for creating fusions of effector domains to the dox-inducible DNA-binding domain rTetR. The constitutive pEF promoter drives expression of the rTetR-effector fusion and mCherry-BSD (Blasticidin S deaminase resistance gene), separated by a T2A self-cleaving peptide.
B. (Top) Schematic of rTetR-KRAB fusion recruitment to the dual reporter gene. The reporter is integrated in the AAVS1 locus by TALEN-mediated homology-directed repair and the PuroR resistance gene is driven by the endogenous AAVS1 promoter. The dual reporter consists of a synthetic surface marker (Igκ-hIgG1-Fc-PDGFRβ) and a citrine fluorescent protein. (Bottom) Pilot test in K562 reporter cells. Reporter cells were generated by TALEN-mediated homology-directed repair to integrate the reporter into the AAVS1 locus and then selected with puromycin. Cells were then spinfected with lentivirus to deliver rTetR-KRAB, and then either left untreated or treated with 1000 ng/ml doxycycline to induce rTetR binding to DNA at the TetO sites. Untreated cell distributions are shown in light grey and doxycycline-treated cells are shown in black or orange, with two independently-transduced biological replicates in each condition. The lentivirus-treated cells are gated on mCherry as the delivery marker. The KRAB domain from human ZNF10 was used.
C. Demonstration of magnetic separation of OFF from ON cells using ProG Dynabeads that bind to the synthetic surface marker. Ten million cells were subjected to magnetic separation using 30 μl of beads, and the citrine reporter expression was measured before and after by flow cytometry. Illustration of mixed ON and OFF cells being subjected to magnetic separation is shown on the right.
D. (Top) Schematic of high-throughput strategy for measuring the expression level of each domain in the library. Domains under 80AA long are extended on both sides, using their native protein sequence, to reach 80AA so all synthesized library elements are the same length. (Middle) The library is cloned into a FLAG-tagged construct and delivered to K562 cells by lentivirus at low multiplicity of infection, such that the majority of cells express a single library member. The mCherry-BSD fusion protein enables blasticidin selection and a fluorescent marker for delivery and selection efficiency, without the use of a second 2A component. (Bottom) Expression is measured by staining the cells with anti-FLAG, sorting high and low expression populations, sequencing the domains, and computing the log2(FLAGhigh:FLAGlow) ratio.
E. Distribution of FLAG staining levels measured by flow cytometry before and after sorting into two bins (N=2 biological replicates of the cell library shown with overlapping shaded areas).
F. Reproducibility of biological replicates from the domain expression screen (r2=0.82). Well-expressed domains, above the threshold (dashed line one standard deviation above the median of the random controls), were selected for further analysis in the transcriptional regulation screens.
G. Validation of expression level for a panel of KRAB domains. Individual rTetR-3XFLAG-KRAB constructs were delivered to K562 cells by lentivirus. Cells were selected with blasticidin and confirmed to be >80% mCherry positive by flow cytometry. Expression level was measured by Western blot with anti-FLAG antibody. Anti-histone H3 was used as a loading control for normalization. Levels were quantified using ImageJ. Superfluous lanes from the gel are cropped out and the relevant lanes are shown consecutively with white lines in between each lane.
H. Comparison of high-throughput measurements of expression with Western blots protein levels. These 6 KRAB domains were cloned individually using the exact 80 AA sequence from the Pfam domain library.
I. Distribution of expression levels for different categories of library members. Random controls are poorly expressed compared to tiles across the DMD protein or Pfam domains (p<1e-5, Mann Whitney test). The Pfam domains and the DMD tiling controls were similarly well-expressed. Dashed line shows the threshold for expression level, as in (F).
A. Flow cytometry shows citrine reporter level distributions in the pool of cells expressing the Pfam domain library, before and after magnetic separation using ProG DynaBeads that bind to the synthetic surface marker. Overlapping histograms are shown for two biological replicates. The average percentage of cells OFF is shown to the left of the vertical line showing the citrine level gate. 1000 ng/ml doxycycline was added on Day 0 and removed on Day 5.
B. PANTHER protein class enrichments for nuclear proteins that contain repressor domains with stronger or weaker memory, when compared to the background set of all nuclear proteins with domains included in our library.
C. rTetR-SUMO validation time courses fit with gene silencing model (Methods). The 80 AA sequence centered around the Rad60-SLD domain of SUMO3 (which has prior evidence for repression (Chupreta et al., 2005)) and the trimmed domain were individually cloned into lentivirus and delivered to the reporter cells. 1000 ng/ml doxycycline was added on day 0 and removed on day 5 (N=2 biological replicates). The fraction of mCherry-positive cells with the citrine reporter OFF was determined by flow cytometry and normalized for background silencing using the untreated, time-matched controls (Methods).
D. The HUSH complex member MPP8 Chromo domain (which has prior evidence for repression (Chang et al., 2011)) was validated with the full 80 AA sequence used in the screen and sequences trimmed to match the Pfam and UniProt annotations.
E. The CBX1 Chromoshadow domain (which has prior evidence for repression (Lechner et al., 2000)) was validated with the 52 AA sequence trimmed to match the Pfam annotation.
F. The Polycomb 1 component SCMH1 SAM1 domain (also known as SPM and which has prior evidence for repression (Frey et al., 2016)) was validated with the 65 AA sequence trimmed to match the Pfam annotation.
G. HERC2 Cyt-b5 domain validation with the full 80 AA sequence used in the screen and a 72 AA sequence trimmed to match the Pfam annotation.
H. BIN1 SH3_9 domain validation.
I. Polycomb 1 component PCGF2 zf-C3HC4_2 domain validation with 39 AA sequence trimmed to match the Pfam annotation.
J. TOX HMG box domain validation with the full 80 AA sequence used in the screen and a 68 AA sequence trimmed to match the Pfam annotation.
K. Validation of a random 80 AA sequence that functions as a repressor. This sequence was weakly expressed, as measured by FLAG (Figure S1F) like most of the other random sequences (Figure S1I), but functioned as a repressor nonetheless.
A. Silencing by rTetR-KRAB fusions, showing leaky silencing without doxycycline treatment for a subset of KRAB domains (high gray bars). Constructs were delivered to reporter cells by lentivirus at day 0, cells were selected with blasticidin between days 3 and 11, cells were split into a doxycycline-treated or untreated condition at day 11, and reporter levels were measured by flow cytometry at day 16. Results are shown after gating for the mCherry positive cells. The KRAB domains were selected from three categories based on their measurements in the screen, labeled on the right. The bar shows the average and the error bar shows the S.D. (N=3 independently transduced biological replicates).
B. Leakiness can be mitigated by using rTetR(SE-G72P) or introducing 3XFLAG between rTetR and the KRAB domain from ZNF823. Constructs were delivered to reporter cells by lentivirus at day 0, cells were split into a doxycycline-treated or untreated condition at day 4, and reporter levels were measured by flow cytometry at day 7. Results are shown after gating for the mCherry positive cells. A non-leaky KRAB domain from ZNF140 was used as a control. The bar shows the average and the error bar shows the S.D. (N=2 independently transduced biological replicates).
C. The K562 reporter cell lines with stable lentiviral expression of either a leaky KRAB domain from ZNF823 or a non-leaky repressor KRAB domain from ZNF140 cloned as fusions with either rTetR or rTetR(SE-G72P) were treated with varied doses of doxycycline. Reporter levels were measured by flow cytometry four days later, and the percentage of mCherry positive cells with the citrine reporter OFF is shown (N=2 independently transduced biological replicates). The dose response was fit by least squares with a nonlinear variable slope sigmoidal curve using PRISM statistical analysis software.
D. Silencing and memory dynamics for all individual validations of KRAB domains, fit with the gene silencing model (Methods). rTetR(SE-G72P)-KRAB fusions were delivered to K562 reporter cells by lentivirus, selected with blasticidin, and then 10 ng/ml doxycycline was added on day 0 and removed on day 5 (N=2 biological replicates). The fraction of mCherry positive cells with the citrine reporter OFF was determined by flow cytometry and normalized for background silencing using the untreated, time-matched controls. We used 10 ng/ml dox to work in a dynamic range where it is easier to measure differences in silencing and memory capabilities between fast KRAB silencing domains. With 1000 ng/ml doxycycline, all of the repressor hit KRAB domains here (greens and oranges) fully silence the reporter within 5 days with indistinguishable dynamics (data not shown). Notably, the KRABs that were leaky on rTetR (oranges), do not show significantly different memory dynamics from the KRABs that were not leaky (greens) when fused to the rTetR(SE-G72P). Importantly, none of the rTetR(SE-G72P)-KRAB fusions showed significant leaky silencing in the untreated condition.
A. Flow cytometry shows citrine reporter levels in the cells with the pooled KRAB library, before and after magnetic separation using ProG DynaBeads that bind to the synthetic surface marker. Overlapping histograms are shown for two biological replicates. The average percentage of cells OFF is shown to the left of the vertical line showing the citrine level gate.
B. OFF:ON enrichments from two biological replicates of the deep mutational library of the ZNF10 KRAB domain at days 5, 9 and 13. Cells were treated with 1000 ng/ml doxycycline for the first 5 days. Grey diagonal lines show where the average log2(OFF:ON) is the median of the WT domains (black dots). The black diagonal lines show the fit linear model.
C. Alignment of human ZNF10 KRAB with mouse KRAB used in the NMR structure (PDB:1v65) and KRAB-O used in the recombinant protein binding assays (Peng et al., 2009). The ordered region (positions 13–54, 55% identity, 69% similarity) is used in Figure 3D and the aligned region containing all 12 necessary residues (positions 12–71, 50% identity, 75% similarity) is used in Figure S4D. The residues necessary for silencing at day 5 are colored in red in the ZNF10 and PDB:1v65 sequences. The residues necessary for binding recombinant KAP1 are colored in red and the residues unnecessary for binding KAP1 are colored in grey in the KRAB-O sequence, summarizing previously published results (Peng et al., 2009). There was significant agreement between the necessary and unnecessary residues from the mutational scan and the binding assay (p<1e-4, Fisher’s exact test). We also inspected the DMS day 5 silencing scores for the specific single, double, and triple alanine substitutions used in the binding assay, and found perfect agreement: mutations that ablated binding also abolished silencing (Z-score<−4 compared to wild-type distribution), and mutations that did not affect binding also did not affect silencing (|Z-score|<0.6) (p<0.01, n=12 mutations, Fisher’s exact test).
D. Ensemble of 20 states of the KRAB NMR structure (PDB:1v65). The residues necessary for silencing at day 5 are colored in red.
E. Silencing and memory dynamics for all individual validations of KRAB ZNF10 mutants, fit with the gene silencing model (Methods). (Top) rTetR-KRAB fusions were delivered to K562 reporter cells by lentivirus, selected with blasticidin, and then 1000 ng/ml doxycycline was added on day 0 and removed on day 5 (N=2 biological replicates. (Bottom) rTetR(SE-G72P)-KRAB fusions were delivered to K562 reporter cells by lentivirus, selected with blasticidin, and then 10 ng/ml doxycycline was added on day 0 and removed on day 5 (N=2 biological replicates). The column labels describe the variant location within the KRAB domain and impact on effector function. The fraction of mCherry positive cells with the citrine reporter OFF was determined by flow cytometry and normalized for background silencing using the untreated, time-matched controls. All of the rTetR(SE-G72P)-KRAB fusions were also measured over 5 days of treatment with 1000 ng/ml doxycycline and the results were indistinguishable from those with rTetR, with all KRAB variants completely silencing the reporter except the EEW25AAA variant that does not silence (data not shown).
F. Correlation of rTetR-KRAB fusion expression level and day 13 silencing score, from the Pfam domain library. Expression is measured by staining the cells with anti-FLAG, sorting high and low expression populations, sequencing the domains, and computing the log2(FLAGhigh:FLAGlow) ratio (shown in Figure S1D) and the silencing score was measured with HT-recruit (shown in Figure 1A). Only KRAB domains that were shown to interact with co-repressor KAP1 by IP/MS (Helleboid et al., 2019) are included.
G. Correlations of amino acid frequency with domain expression level measured by FLAG (shown in Figure S1D), across the library of Pfam domains and controls (Pearson’s r value is shown).
H. Western blot for FLAG-tagged rTetR-KRAB fusions after lentiviral delivery to K562. Cells were selected for delivery with blasticidin and were confirmed to be >80% mCherry positive by flow cytometry. Expression level relative to the H3 loading control was quantified using ImageJ. Superfluous lanes from the gel are cropped out and the relevant lanes are shown consecutively with white lines in between each lane.
A. Flow cytometry for pooled library of Pfam domains in activation reporter cells, before and after magnetic separation. The percentage of cells ON is shown to the right of the citrine level gate, drawn with a vertical line. 1–2 biological replicates are shown with overlapping shaded areas.
B. GO term enrichment of genes containing a hit activation domain, compared to the background set of all proteins containing a well-expressed domain in the library after counts filtering. Raw p-values are shown, and all shown terms are below a 10% false discovery rate.
C. Individual validations of activator domains. rTetR(SE-G72P)-domain fusions were delivered to K562 reporter cells by lentivirus and selected with blasticidin. Cells were treated with 1000 ng/ml doxycycline for 2 days, and then citrine reporter levels were measured by flow cytometry. Untreated cell distributions are shown in light grey and doxycycline-treated cells are shown in colors, with two independently-transduced biological replicates in each condition. The vertical line shows the citrine gate used to determine the fraction of cells ON, and the average fraction ON for the doxycycline-treated cells is shown. VP64 is a positive control. Each domain was tested as both the extended 80 AA sequence from the library or the trimmed Pfam-annotated domain sequence, with the exceptions of Med9 and DUF3446 which had minimal extensions because the Pfam annotated regions are 75 and 69 AA, respectively. The corresponding results for the 80 AA library sequence for the KRAB domains are shown in Figure 5.
A. Flow cytometry shows citrine reporter level distributions in the pool of cells expressing the tiling library, before and after magnetic separation using ProG DynaBeads that bind to the synthetic surface marker. Overlapping histograms are shown for two biological replicates. The average percentage of cells OFF is shown to the left of the vertical line showing the citrine level gate. 1000 ng/ml doxycycline was added on Day 0 and removed on Day 5.
B. High-throughput recruitment measurements from two biological replicates of a nuclear protein tiling library at Day 5 of doxycycline treatment and Day 13, 8 days after doxycycline removal. The hit calling threshold is 2 standard deviations above the mean of the random and DMD tiling controls.
C. Tiling results for KRAB Zinc finger proteins ZNF57 and ZNF461. Each bar is an 80 AA tile and the vertical error bars are the range from 2 biological replicates. Protein annotations are sourced from UniProt.
D. Tiling RYBP. Diagram shows protein annotations, retrieved using the UniProt ID written at top. Vertical error bars show the standard error from two biological replicates.
E. Tiling REST.
F. Tiling CBX7.
G. Tiling DNMT3B.
H. (Left) Tiling DMD. (Right) Dynamics of silencing and memory after recruitment of DMD hit tiles. Cells were treated with 1000 ng/ml dox for the first 5 days and citrine reporter levels were measured by flow cytometry. The percentage of cells OFF was normalized to account for background silencing and the data (dots) were fit with a gene silencing model (curves) (N=2 biological replicates).
The library oligonucleotide designs are attached in an Excel file.
The lentiviral rTetR recruitment vectors and the plasmids for engineering reporter cell lines are attached in an Excel file.
The primers used for oligonucleotide subpool amplification and sequencing library preparation are described in the attached Excel file.
The HT-recruit data for the Pfam domain repressor and activator screens, the tiling repressor screen, and the KRAB repressor deep mutational scan are in the attached Excel file.
The ChIP dataset identifiers are in the attached Excel file.
Data Availability Statement
The Illumina sequencing datasets generated in this study are available from the Sequencing Read Archive (SRA BioProject PRJNA668427, http://www.ncbi.nlm.nih.gov/bioproject/668427).
External ChIP-seq and ChIP-exo data for KRAB ZNF, KAP1, and H3K27ac (ENCODE Project Consortium et al., 2020; Imbeault et al., 2017; Najafabadi et al., 2015; Schmitges et al., 2016), KRAB ZNF gene evolutionary age (Imbeault et al., 2017), KRAB ZNF protein co-immunoprecipitation/mass-spectrometry data (Helleboid et al., 2019), and CAT assays for KRAB repressor activity (Margolin et al., 1994; Witzgall et al., 1994) were retrieved from previously published studies. The ChIP dataset identifiers are listed in Table S5.
The HT-recruit Analyze software for processing high-throughput recruitment assay and high-throughput stability assays are available on GitHub (https://github.com/bintulab/HT-recruit-Analyze).