Abstract
Proline–arginine (PR) dipeptide repeats have been shown to undergo liquid–liquid phase separation and are an example of a growing number of intrinsically disordered proteins that can assemble into membraneless organelles. These structures have been posited as nucleation sites for pathogenic protein aggregation. As such, a better understanding of the effects that the increased local concentration and volumetric crowding within droplets have on peptide secondary structure is necessary. Herein we use Fourier transform infrared (FTIR) and two-dimensional infrared (2DIR) spectroscopy to show that formation of droplets by PR20 accompanies changes in the amide-I spectra consistent with folding into poly-proline helical structures.
Two-dimensional infrared spectroscopy reveals folding of an intrinsically disordered peptide when sequestered into a model “membrane-less” organelle.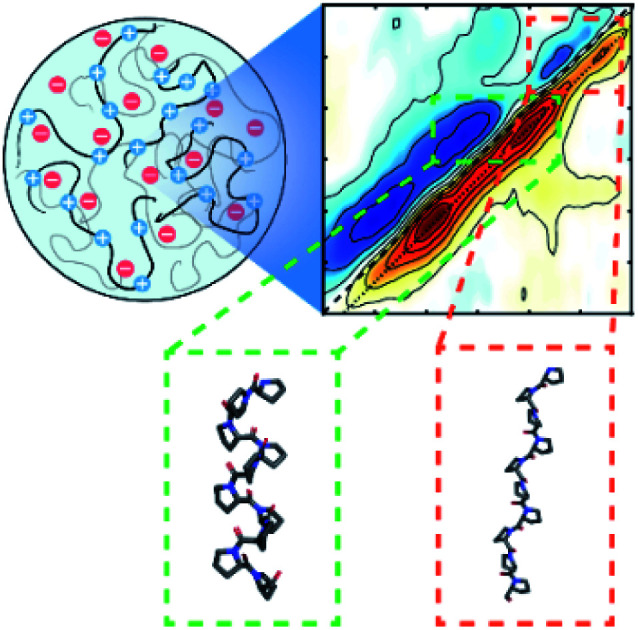
Introduction
Roughly 44% of human proteins contain disordered segments of >30 amino acids.1 As protein folding often buries hydrophobic segments prone to self-association, some intrinsically disordered proteins and peptides (IDPs) are susceptible to aggregation.2,3 More recently, many IDPs have been found to spontaneously organize into phase separated liquid droplets through coacervation.1,4,5 While liquid–liquid phase separation (LLPS) is often driven by charge–charge interactions,6–8 weak intermolecular interactions, such as pi stacking9,10 or volumetric crowding,7,11,12 can also provide the necessary driving force. This results in a peptide assembly mechanism that is distinct from amyloid formation. Functional forms of LLPS are responsible for producing membraneless organelles, especially within the nucleus of the cell.9,13 Aberrant LLPS has been proposed as a cause for cellular dysfunction.14 Upon droplet formation, local protein concentrations can increase by a factor of 50.15 As protein aggregation into potentially toxic amyloids is a highly nonlinear kinetic process, such an increase in local concentration could have a drastic effect on the stability of soluble protein.16,17 To begin to address this question, a better understanding of the effects that the increased local concentration and volumetric crowding within droplets has on peptide secondary structure is necessary. As such, a more elementary question of interest is whether liquid droplets promote protein folding of any kind for the otherwise unstructured IDPs. As high polymer volume fractions are known to stabilize protein folds,18 measurable secondary structure formation may accompany LLPS. Herein we present an approach to determine whether droplet formation promotes secondary structure folding for a model IDP using Fourier transform infrared (FTIR) and two-dimensional infrared (2DIR) spectroscopy.
Prior work on structure determination within droplets have been limited to circular dichroism (CD) spectroscopy and nuclear magnetic resonance (NMR) spectroscopy on gravimetrically isolated bulk phases.19 However, experiments where the phases no longer interact may not exhibit the same dynamics and structural changes that occur when both phases are present, due to the absence of an interface. In this respect 2DIR has an advantage. For example, CD measurements of protein secondary structure are optimized for optical densities (OD) below 1,20 while the turbidity of a solution of LLPS droplets can easily reach a 1 mm OD250 of greater than 1. 2DIR spectroscopy however, when implemented using a 4-frame phase cycling pulse sequence, can eliminate the largest scattering artifacts, allowing us to directly measure LLPS droplets in situ.21,22 Similarly, many powerful NMR structural techniques rely on fast rotational correlation times, a limitation that 2DIR does not share.
We chose, as a model system, the dipeptide repeat (DPR) PR20 (i.e. twenty repeats of proline–arginine). Our choice of this model system is partially motivated by the role of PR DRPs in Amyotrophic Lateral Sclerosis (ALS), where the length of the PR repeat correlates with cytotoxicity.23 Boeynaems and coworkers have shown that PR DPRs can phase separate with RNA.24 Past studies have also shown that PR DPRs co-localize with proteins and RNAs into liquid droplets in the nucleus of cells.25,26 Furthermore, PR repeats can undergo phase separation without a polyanionic polymer in buffered solution in the presence of 30% v/v polyethylene glycol (PEG).24 PEG acts as a molecular crowder, reducing the intermolecular interaction strength needed to drive phase separation.12
Results and discussion
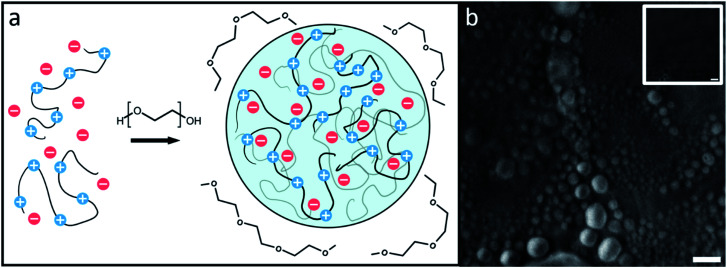
The droplets, shown in cartoon form in Fig. 1a, are likely to be composed solely of PR20, water, and buffer ions while PEG supplies the necessary depletion force for the droplets to form.11,27–29Fig. 1b shows droplets formed by PR20 in the presence of PEG using phase contrast microscopy.
Fig. 1. (a) A cartoon of flexible protein segments undergoing phase separation through volumetric exclusion induced by a crowding agent, polyethylene glycol (PEG). (b) PR20 phase separated droplets can be seen after the addition of PEG 300 using phase contrast microscopy. Inset shows a PR20 sample before addition of PEG 300. Scale bars represent 10 μm.
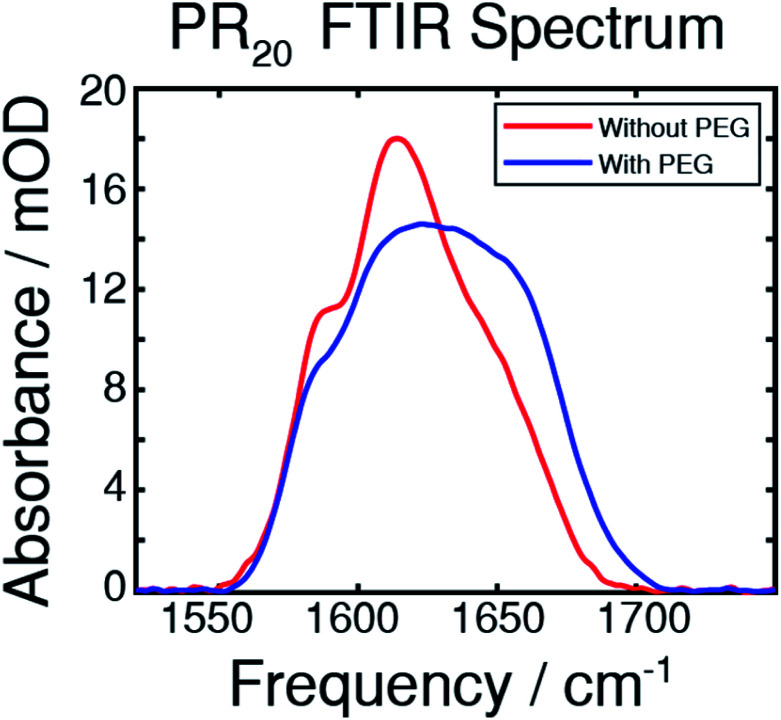
An FTIR spectrum of the peptide in buffer shows peaks at around 1585 and 1610 cm−1 corresponding to the near-degenerate vibrational modes of the arginine sidechain C N stretches (Fig. 2).30 A shoulder at around 1650 cm−1 corresponds to random-coil amide-I.31 The FTIR spectrum after adding PEG shows more absorption from 1620 to 1680 cm−1 which results from new peaks in the amide-I region which we attribute to new backbone structures.
Fig. 2. The FTIR spectra of the PR20 peptide taken in deuterated potassium phosphate buffer, with and without 30% PEG, as indicated. Peaks at 1585 and 1610 cm−1 comprise the arginine side-chains while a peak near 1650 cm−1 originates from the amide-I stretch of randomly coiled peptide. Upon addition of PEG, the peak in the amide-I region undergoes a change corresponding to folding from a random coil state.
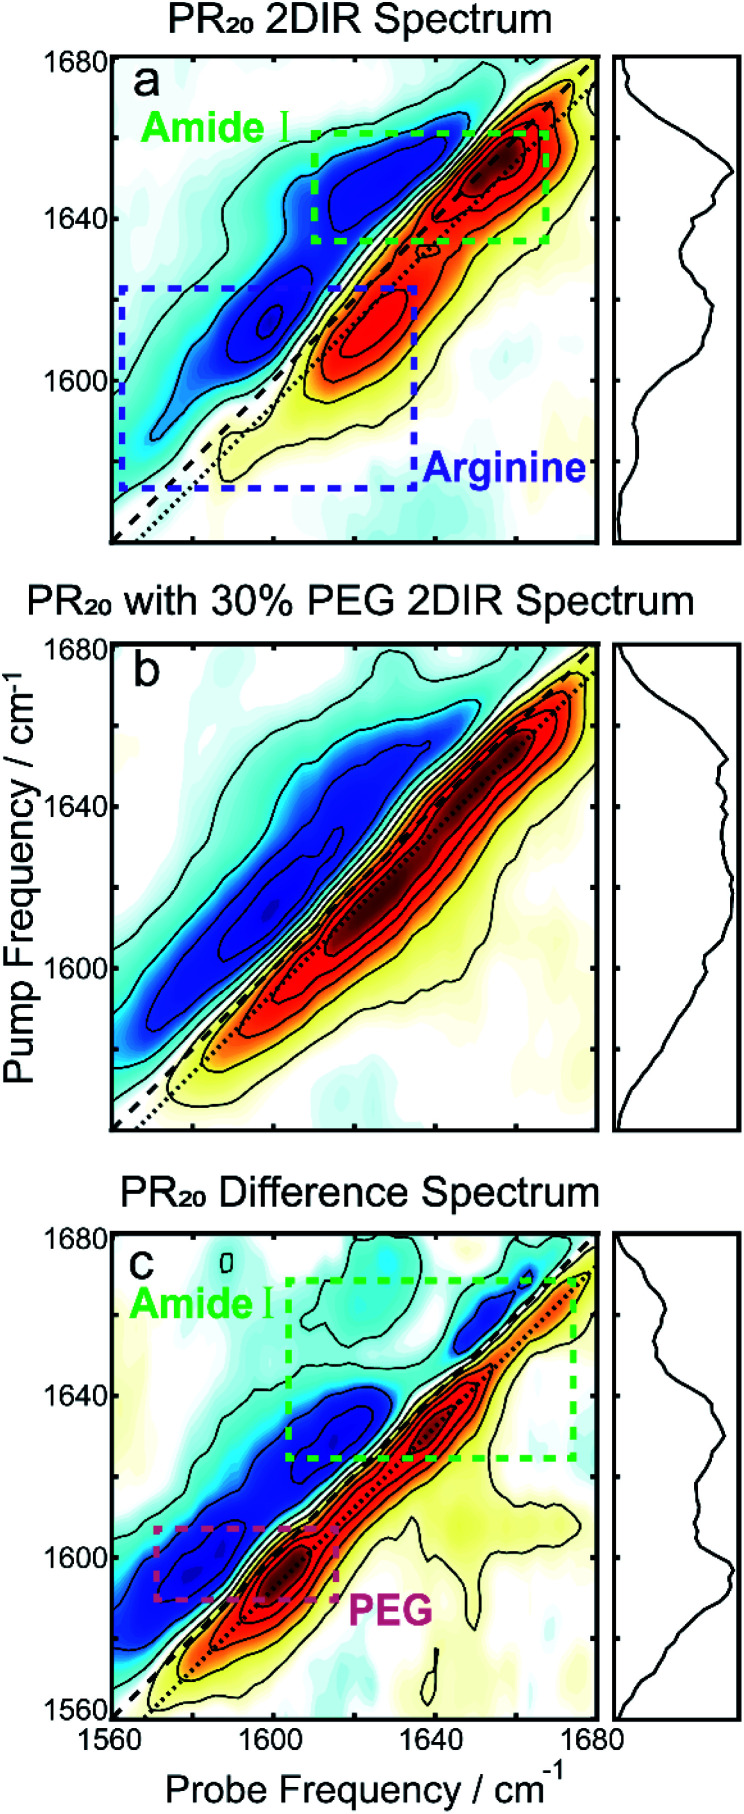
To further resolve features in the FTIR spectrum, we collected 2DIR spectra. The 2D spectrum of the PR20 before the addition of PEG (Fig. 3a) shows a set of distinct peak pairs. Every FTIR transition corresponds to a red and blue peak pair in the 2D spectrum (red for ground state bleach/stimulated emission and blue for excited state absorption). As indicated in the 2DIR spectrum in Fig. 3a, the peak centered at 1650 cm−1 corresponds to amide-I signal. This peak is characteristic of random coil peptide,31,32 which is consistent with past secondary structure characterization of native PR repeats.33 Upon addition of PEG (Fig. 3b) the spectrum broadens along the diagonal. A difference spectrum can be used to separate the contributions of the free peptide from the peptide sequestered into droplets,34 which is shown in Fig. 3c. In the difference spectrum, a prominent new peak pair appears at pump frequency 1600 cm−1 which originates from PEG itself (see Fig. S1 in the ESI†), as well as two new peak pairs at pump frequencies of 1630 and 1665 cm−1. There are no prominent blue peaks along the diagonal of the difference spectrum which one would expect from subtracting the random coil signatures in Fig. 3a. This can occur if the new signatures in the Fig. 3b were significantly larger, per molecule, than those in Fig. 3a.
Fig. 3. (a) The 2DIR spectrum of PR20 without PEG shows a prominent peak corresponding to random-coils as well as the two arginine peaks. (b) After adding PEG, the spectrum broadens along the diagonal. (c) The difference spectrum of the first two spectra. The large peak at 1600 cm−1 originates from PEG. The two peaks at pump frequencies 1630 and 1665 cm−1 of the amide-I region matches the peak locations for polyproline helices.39,40 For all spectra, the dotted line indicates where the diagonal cuts (panels to the right) are taken.
The previous observation can best be explained if the transition dipole moments, μ10, for the new signatures are larger than those of random coil transitions, as 2DIR signals have a μ104 dependence. This is often the case for peptide secondary structures, where coupling of alighted backbone modes form extended vibrational excitons.35,36 The near even split of the two new transitions, 1630 and 1665 cm−1, around the random coil frequency, 1650 cm−1, might suggest that these transitions arise from exciton splitting within a single structure. A possible candidate for such a species would be an extended beta sheet structure.31,32 We believe this is unlikely to be the case for this peptide, as the alternating prolines reduce the number of possible H-bonds across strands of the sheet. An alternative explanation is that the two new peaks correspond to two new species that are more favorably formed in the presence of prolines. In the following, we examine whether the peaks at 1630 and 1665 cm−1 can be explained by polyproline helices.
The two varieties of polyproline helical structures are polyproline I (PPI) and polyproline II (PPII). Both are left-handed with no hydrogen bonding along the backbone. The PPII helix is long and extended with trans peptide bonds whereas the rarer PPI helix is compacted with cis peptide bonds which are allowed by the conformational strain imparted by the proline residue.37,38 Past FTIR studies for the structures demonstrate low frequency peaks at 1628 cm−1 for PPI and 1637 cm−1 for PPII, with PPII also having a high frequency peak around 1660 cm−1.39,40 Comparing to our 2DIR spectra, this suggests PR20 may take on a mixture of PPI and PPII structure within the droplet phase.
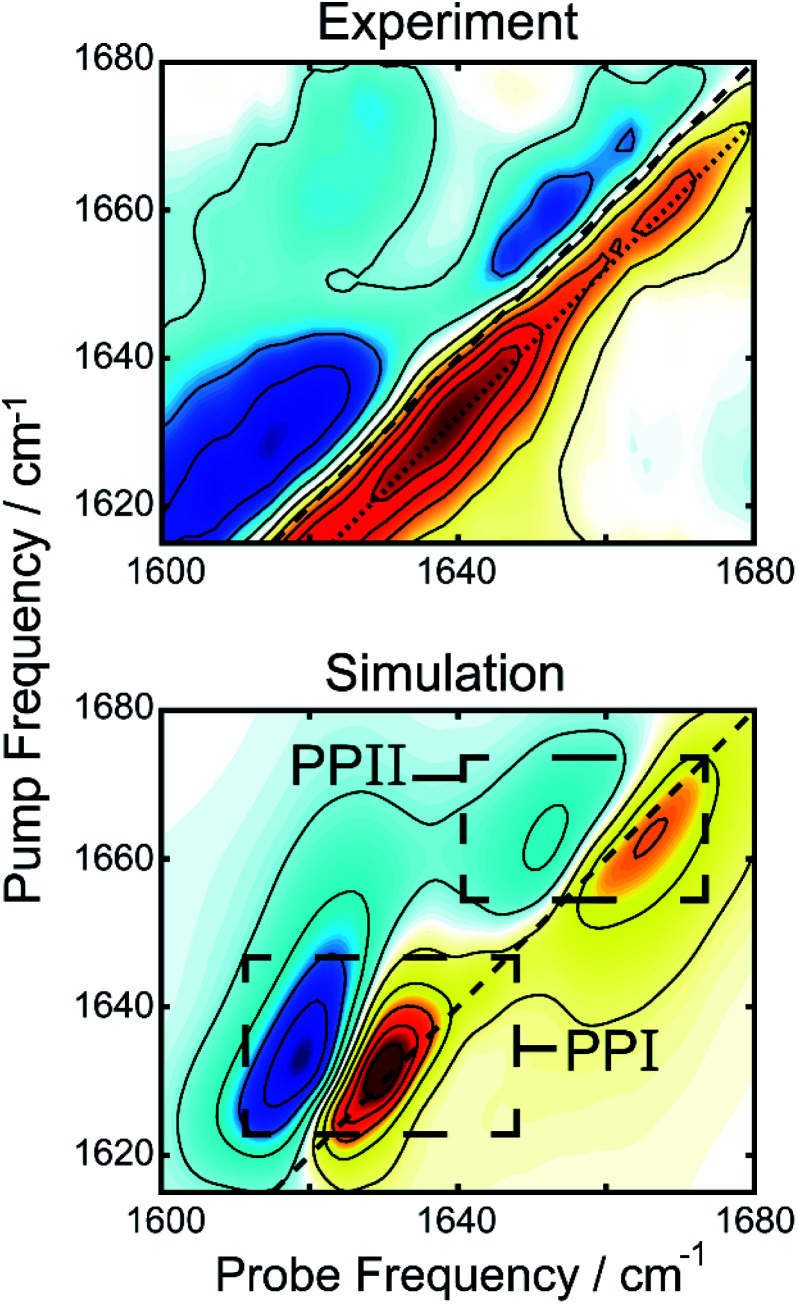
We simulated 2D spectra of both polyproline structures to compare with experiment. The simulations were performed using a transition dipole coupling, floating oscillator model on idealized poly-proline structures, using homogenous line-widths and diagonal disorders typical of hydrated peptides (see ESI for details†).41 A comparison between the experimental 2DIR difference spectrum and the simulations can be found in Fig. 4. The bottom panel shows the one to one sum of the calculated 2DIR spectra of PPI and PPII (individual spectra can be found in Fig. S2†). The peak positions (1637 and 1659 cm−1) and lineshapes in the simulation agree well, overall, with the amide-I region of the experimental spectrum, considering the simplicity of the model. A potential complication in interpretation of the spectra are past observations that intramolecular backbone hydrogen bonds can redshift the proline amide-I stretch by 25 cm−1.42 Such hydrogen bonds are not present in the polyproline structures simulated here, and yet we observe a good match with experiments, suggesting that this phenomenon is unlikely to be occurring in the droplets. To determine the intensity of the polyproline peaks relative to random coil, we also simulated the 2D spectrum of a forty residue random coil (not shown). The intensities of the PPI and PPII peaks were, respectively, about 3.5 and 2 times more intense than that of the random coil peak. This is consistent with our observation that the new features upon droplet formation dominate the 2DIR difference spectra. We also performed an analysis of the inverse participation ratios (IPR) for the simulated spectra (see ESI for details†).43 The calculated IPR spectra (Fig. S9†) indicate that amide-I vibrational excitons for PPI and PPII can delocalized over 2–3 amide subunits, which can explain their greater prominence in the difference spectrum over random coil features. The simulated spectrum in Fig. 4 is simply a linear combination of the simulated 2DIR spectra for a PPI and a PPII peptide. It can be compared to the experimental 2DIR spectrum so long as the experimental difference spectrum can faithfully extract the spectra of the new folded species. In the ESI,† we detail control experiments to verify that the measured peaks in the difference spectrum are not experimental artifacts. Finally, the intensities from the simulations were used to estimate the relative population of the two species using the peak intensities in the experiment, yielding a ratio of 1.09 to 1.00 (PPI to PPII).
Fig. 4. Comparison of the experimental difference 2DIR spectrum (top) and the sum of simulated 2DIR spectra for PPI and PPII helices (bottom), demonstrating the amide-I region of the former is well described by the latter.
Though previous evidence has shown that droplets can drive amyloid aggregation,44,45 these findings suggest that droplet formation can also promote single domain protein folding, which may serve as an early stage of the amyloid assembly process. The PR DPRs serve as a model system for studying this process as they phase separate and undergo folding without also inducing amyloid formation. Isolating the effect on monomeric folding will allow researchers to begin to ask more detailed mechanistic questions about how droplets affect each step of the amyloid aggregation process. While we believe that volumetric self-crowding, whereby the high local concentration of PR20 peptide within droplets destabilizes extended structures, is likely the driving force for the folding of peptides into helices in the peptide dense phase, another contributing factor to stabilization may be inter-molecular pi stacking of the arginine sidechains, though any changes this may have induced it the guanidinium transitions in the 2DIR spectra are masked by the presence of the PEG signal near 1600 cm−1.
Conclusions
In conclusion, by performing FTIR, 2DIR and spectroscopic simulation on a model peptide, we have found, to our knowledge, the first evidence of LLPS driven peptide folding. These results could have great implications on the physical properties and functionality of liquid droplets.
Methods
Peptide synthesis and purification
The PR20 peptide was synthesized on a CEM Liberty Lite peptide synthesizer using conventional FMOC synthesis on a rink-amide resin. The peptide was cleaved using trifluoro-acetic acid (TFA) and precipitated with diethyl ether to retrieve the crude peptide. Crude peptide was purified using a Jasco LC-4000 HPLC system with a RP-C18 column. The HPLC fraction containing peptide was confirmed using MALDI-TOF mass spectrometry. The lyophilized peptide was resuspended in hexafluoroisopropanol with 10% v/v HCl to exchange out TFA. The peptide was then lyophilized overnight and stored as a powder. To prepare samples for IR experiments, we resuspended our lyophilized peptide in deuterated hexafluoroisopropanol (HFIP-d) to exchange amide hydrogens with deuterium. The sample was incubated for at least 30 minutes and lyophilized to remove HFIP-d. This was repeated twice and, after the final step, the sample was lyophilized overnight to remove trace solvent.
Sample preparation
To induce phase separation, we adapted a method described by Boeynaems and coworkers.46 Lyophilized pure peptide was resuspended in D2O to a concentration of 1 mM. A 10× potassium phosphate buffer was made by combining 61.5 mL of 1 M K2HPO4 with 38.5 mL of 1 M KH2PO4. The sample was brought to a concentration of 250 μM in 100 mM pH 7* potassium phosphate buffer with 30% v/v PEG 300 (MW 300). The sample solution was placed on ice to induce droplet formation. Droplet formation was assessed by measuring turbidity at 600 nm.
Phase contrast microscopy
A sample slide with a fluid reservoir formed by strips of double-sided tape was used to image droplets. The sample was placed in the reservoir and sealed with a coverslip. Images were taken using a Nikon TE2000-U microscope in phase contrast mode with a 40× objective.
FTIR
10 μl of sample solution was placed between two 2 mm thick CaF2 windows (Crystran Lmt.) with a Teflon spacer and tightly sealed to reduce atmospheric water exchange. Single beam spectra for sample and reference were collected using a Thermo Fischer Nicolet iS50R FTIR at 2 cm−1 resolution. Data was processed in MATLAB to produce the absorbance spectrum.
2DIR
Details for the 2DIR laser system are described elsewhere.47 Briefly, 3.5 mJ, 30 fs, 800 nm pulses from a 1 kHz repetition rate Astrella laser system (Coherent) are directed into a TOPAS prime OPA (Light Conversion) followed by a homebuilt AgGaS2 based DFG to produce our broadband mid-IR beam. The pump beam is sent through an AOM based mid-IR pulse shaper (PhaseTech Spectroscopy) in order to generate the pulse sequences necessary to perform 2DIR. The waiting time delay between the pump and probe pulses was set to 100 fs. Beam waists were measured to be approximately 30 μm, using the 80/20 knife-edge method. This is larger than all observed droplets in phase contrast images taken. Furthermore, we targeted a region of the sample with high and homogenous turbidly, as determined by scattered light amplitude, ensuring that we were studying a region replete with droplets. The probe was directed through a sample and into a homebuilt monochromator where the spectrum was detected with a MCT focal plane array camera (Teledyne Catalina). The reference beam spectrum was detected simultaneously on the same camera. Data was processed using custom MATLAB code.
Conflicts of interest
There are no conflicts to declare.
Supplementary Material
Acknowledgments
ALS gratefully acknowledges support from the College of Science at the University of Notre Dame. We thank Prof. Lin Guo of Jefferson University for helpful advice on droplet preparation protocols. We thank Prof. Anthony Serriani for access to the peptide synthesizer, and Prof. Holly Goodson for access to the Nikon TE2000-U microscope. DNE would like to thank the Notre Dame IBMS program and the Dana Wilson Quintero Memorial Graduate Fellowship for their support in this project. We would also like to thank Claire Nelmark for her help in assembling the manuscript.
Electronic supplementary information (ESI) available: 2DIR spectrum of PEG 300, details on simulation methods, inverse participation ratio analysis of simulations, reproduction of Fig. 3 data, error analysis of difference spectra, and concentration dependent FTIR data. See DOI: 10.1039/d0sc04993j
Notes and references
- Van Der Lee R. Buljan M. Lang B. Weatheritt R. J. Daughdrill G. W. Dunker A. K. Fuxreiter M. Gough J. Gsponer J. Jones D. T. Kim P. M. Kriwacki R. W. Oldfield C. J. Pappu R. V. Tompa P. Uversky V. N. Wright P. E. Babu M. M. Chem. Rev. 2014;114:6589–6631. doi: 10.1021/cr400525m. [DOI] [PMC free article] [PubMed] [Google Scholar]
- Linding R. Schymkowitz J. Rousseau F. Diella F. Serrano L. J. Mol. Biol. 2004;342:345–353. doi: 10.1016/j.jmb.2004.06.088. [DOI] [PubMed] [Google Scholar]
- Pytowski L. Lee C. F. Foley A. C. Vaux D. J. Jean L. Proc. Natl. Acad. Sci. U. S. A. 2020;117:12050–12061. doi: 10.1073/pnas.1916716117. [DOI] [PMC free article] [PubMed] [Google Scholar]
- Hyman A. A. Weber C. A. Jülicher F. Annu. Rev. Cell Dev. Biol. 2014;30:39–58. doi: 10.1146/annurev-cellbio-100913-013325. [DOI] [PubMed] [Google Scholar]
- De Kruif C. G. Weinbreck F. De Vries R. Curr. Opin. Colloid Interface Sci. 2004;9:340–349. doi: 10.1016/j.cocis.2004.09.006. [DOI] [Google Scholar]
- Das R. K. Pappu R. V. Proc. Natl. Acad. Sci. U. S. A. 2013;110:13392–13397. doi: 10.1073/pnas.1304749110. [DOI] [PMC free article] [PubMed] [Google Scholar]
- Danielsen S. P. O. McCarty J. Shea J.-E. Delaney K. T. Fredrickson G. H. Proc. Natl. Acad. Sci. U. S. A. 2019;116:8224–8232. doi: 10.1073/pnas.1900435116. [DOI] [PMC free article] [PubMed] [Google Scholar]
- McCarty J. Delaney K. T. Danielsen S. P. O. Fredrickson G. H. Shea J.-E. J. Phys. Chem. Lett. 2019;10:1644–1652. doi: 10.1021/acs.jpclett.9b00099. [DOI] [PMC free article] [PubMed] [Google Scholar]
- Shin Y. Brangwynne C. P. Science. 2017;357:eaaf4382. doi: 10.1126/science.aaf4382. [DOI] [PubMed] [Google Scholar]
- Brangwynne C. P. Tompa P. Pappu R. V. Nat. Phys. 2015;11:899–904. [Google Scholar]
- Wang Y. Annunziata O. J. Phys. Chem. B. 2007;111:1222–1230. doi: 10.1021/jp065608u. [DOI] [PubMed] [Google Scholar]
- Marianelli A. M. Miller B. M. Keating C. D. Soft Matter. 2018;14:368–378. doi: 10.1039/C7SM02146A. [DOI] [PubMed] [Google Scholar]
- Courchaine E. M. Lu A. Neugebauer K. M. EMBO J. 2016;35:1603–1612. doi: 10.15252/embj.201593517. [DOI] [PMC free article] [PubMed] [Google Scholar]
- Patel A. Lee H. O. Jawerth L. Maharana S. Jahnel M. Hein M. Y. Stoynov S. Mahamid J. Saha S. Franzmann T. M. Pozniakovski A. Poser I. Maghelli N. Royer L. A. Weigert M. Myers E. W. Grill S. Drechsel D. Hyman A. A. Alberti S. Cell. 2015;162:1066–1077. doi: 10.1016/j.cell.2015.07.047. [DOI] [PubMed] [Google Scholar]
- Aumiller W. M. Keating C. D. Nat. Chem. 2016;8:129–137. doi: 10.1038/nchem.2414. [DOI] [PubMed] [Google Scholar]
- Ciryam P. Tartaglia G. G. Morimoto R. I. Dobson C. M. Vendruscolo M. Cell Rep. 2013;5:781–790. doi: 10.1016/j.celrep.2013.09.043. [DOI] [PMC free article] [PubMed] [Google Scholar]
- Cellmer T. Ferrone F. A. Eaton W. A. Nat. Struct. Mol. Biol. 2016;23:459–461. doi: 10.1038/nsmb.3197. [DOI] [PMC free article] [PubMed] [Google Scholar]
- Mukherjee S. Waegele M. M. Chowdhury P. Guo L. Gai F. J. Mol. Biol. 2009;393:227–236. doi: 10.1016/j.jmb.2009.08.016. [DOI] [PMC free article] [PubMed] [Google Scholar]
- Brady J. P. Farber P. J. Sekhar A. Lin Y.-H. Huang R. Bah A. Nott T. J. Chan H. S. Baldwin A. J. Forman-Kay J. D. Kay L. E. Proc. Natl. Acad. Sci. U. S. A. 2017;114:E8194–E8203. doi: 10.1073/pnas.1706197114. [DOI] [PMC free article] [PubMed] [Google Scholar]
- Johnson W. C. Proteins: Struct., Funct., Genet. 1990;7:205–214. doi: 10.1002/prot.340070302. [DOI] [PubMed] [Google Scholar]
- Shim S.-H. Zanni M. T. Phys. Chem. Chem. Phys. 2009;11:748–761. doi: 10.1039/B813817F. [DOI] [PMC free article] [PubMed] [Google Scholar]
- Bloem R. Garrett-Roe S. Strzalka H. Hamm P. Donaldson P. Opt. Express. 2010;18:27067. doi: 10.1364/OE.18.027067. [DOI] [PubMed] [Google Scholar]
- Freibaum B. D. Lu Y. Lopez-Gonzalez R. Kim N. C. Almeida S. Lee K. H. Badders N. Valentine M. Miller B. L. Wong P. C. Petrucelli L. Kim H. J. Gao F. B. Taylor J. P. Nature. 2015;525:129–133. doi: 10.1038/nature14974. [DOI] [PMC free article] [PubMed] [Google Scholar]
- Boeynaems S. Bogaert E. Kovacs D. Konijnenberg A. Timmerman E. Volkov A. Guharoy M. De Decker M. Jaspers T. Ryan V. H. Janke A. M. Baatsen P. Vercruysse T. Kolaitis R. M. Daelemans D. Taylor J. P. Kedersha N. Anderson P. Impens F. Sobott F. Schymkowitz J. Rousseau F. Fawzi N. L. Robberecht W. Van Damme P. Tompa P. Van Den Bosch L. Mol. Cell. 2017;65:1044–1055. doi: 10.1016/j.molcel.2017.02.013. [DOI] [PMC free article] [PubMed] [Google Scholar]
- Wen X. Tan W. Westergard T. Krishnamurthy K. Markandaiah S. S. Shi Y. Lin S. Shneider N. A. Monaghan J. Pandey U. B. Pasinelli P. Ichida J. K. Trotti D. Neuron. 2014;84:1213–1225. doi: 10.1016/j.neuron.2014.12.010. [DOI] [PMC free article] [PubMed] [Google Scholar]
- White M. R. Mitrea D. M. Zhang P. Stanley C. B. Cassidy D. E. Nourse A. Phillips A. H. Tolbert M. Taylor J. P. Kriwacki R. W. Mol. Cell. 2019;74:713–728. doi: 10.1016/j.molcel.2019.03.019. [DOI] [PMC free article] [PubMed] [Google Scholar]
- Thompson R. W. Latypov R. F. Wang Y. Lomakin A. Meyer J. A. Vunnum S. Benedek G. B. J. Chem. Phys. 2016;145:185101. doi: 10.1063/1.4966708. [DOI] [PubMed] [Google Scholar]
- Cohen J. A. Podgornik R. Hansen P. L. Parsegian V. A. J. Phys. Chem. B. 2009;113:3709–3714. doi: 10.1021/jp806893a. [DOI] [PMC free article] [PubMed] [Google Scholar]
- Vivarès D. Belloni L. Tardieu A. Bonneté F. Eur. Phys. J. E: Soft Matter Biol. Phys. 2002;9:15–25. doi: 10.1140/epje/i2002-10047-7. [DOI] [PubMed] [Google Scholar]
- Ghosh A. Tucker M. J. Hochstrasser R. M. J. Phys. Chem. A. 2011;115:9731–9738. doi: 10.1021/jp201794n. [DOI] [PMC free article] [PubMed] [Google Scholar]
- Barth A. Zscherp C. Q. Rev. Biophys. 2002;35:369–430. doi: 10.1017/S0033583502003815. [DOI] [PubMed] [Google Scholar]
- Demirdöven N. Cheatum C. M. Chung H. S. Khalil M. Knoester J. Tokmakoff A. J. Am. Chem. Soc. 2004;126:7981–7990. doi: 10.1021/ja049811j. [DOI] [PubMed] [Google Scholar]
- Darling A. L. Breydo L. Rivas E. G. Gebru N. T. Zheng D. Baker J. D. Blair L. J. Dickey C. A. Koren J. Uversky V. N. Int. J. Biol. Macromol. 2019;127:136–145. doi: 10.1016/j.ijbiomac.2019.01.035. [DOI] [PubMed] [Google Scholar]
- Fields C. R. Dicke S. S. Petti M. K. Zanni M. T. Lomont J. P. J. Phys. Chem. Lett. 2020:6382–6388. doi: 10.1021/acs.jpclett.0c01345. [DOI] [PMC free article] [PubMed] [Google Scholar]
- Hayashi T. Mukamel S. J. Phys. Chem. B. 2007;111:11032–11046. doi: 10.1021/jp070369b. [DOI] [PubMed] [Google Scholar]
- Hamm P. and Zanni M., Concepts and Methods of 2D Infrared Spectroscopy, Cambridge University Press, Cambridge, 2011 [Google Scholar]
- Adzhubei A. A. Sternberg M. J. E. Makarov A. A. J. Mol. Biol. 2013;425:2100–2132. doi: 10.1016/j.jmb.2013.03.018. [DOI] [PubMed] [Google Scholar]
- Kang Y. K. Jhon J. S. Han S. J. J. Pept. Res. 1999;53:30–40. doi: 10.1111/j.1399-3011.1999.tb01614.x. [DOI] [PubMed] [Google Scholar]
- Dukor R. K. Keiderling T. A. Biospectroscopy. 1998;2:83–100. doi: 10.1002/(SICI)1520-6343(1996)2:2<83::AID-BSPY2>3.0.CO;2-T. [DOI] [PubMed] [Google Scholar]
- Doyle B. B. Bendit E. G. Blout E. R. Biopolymers. 1975;14:937–957. doi: 10.1002/bip.1975.360140505. [DOI] [PubMed] [Google Scholar]
- Ganim Z. Tokmakoff A. Biophys. J. 2006;91:2636–2646. doi: 10.1529/biophysj.106.088070. [DOI] [PMC free article] [PubMed] [Google Scholar]
- Lessing J. Roy S. Reppert M. Baer M. Marx D. Jansen T. L. C. Knoester J. Tokmakoff A. J. Am. Chem. Soc. 2012;134:5032–5035. doi: 10.1021/ja2114135. [DOI] [PubMed] [Google Scholar]
- Hahn S. Ham S. Cho M. J. Phys. Chem. B. 2005;109:11789–11801. doi: 10.1021/jp050450j. [DOI] [PubMed] [Google Scholar]
- Li Y. R. King O. D. Shorter J. Gitler A. D. J. Cell Biol. 2013;201:361–372. doi: 10.1083/jcb.201302044. [DOI] [PMC free article] [PubMed] [Google Scholar]
- Wegmann S. Eftekharzadeh B. Tepper K. Zoltowska K. M. Bennett R. E. Dujardin S. Laskowski P. R. MacKenzie D. Kamath T. Commins C. Vanderburg C. Roe A. D. Fan Z. Molliex A. M. Hernandez-Vega A. Muller D. Hyman A. A. Mandelkow E. Taylor J. P. Hyman B. T. EMBO J. 2018;37(7):e98049. doi: 10.15252/embj.201798049. [DOI] [PMC free article] [PubMed] [Google Scholar]
- Boeynaems S. De Decker M. Tompa P. Van Den Bosch L. Bio-Protoc. 2017;7(17):e2525. doi: 10.21769/BioProtoc.2525. [DOI] [PMC free article] [PubMed] [Google Scholar]
- Cracchiolo O. M. Geremia D. K. Corcelli S. A. Serrano A. L. J. Phys. Chem. B. 2020:0c02444. doi: 10.1021/acs.jpcb.0c02444. [DOI] [PubMed] [Google Scholar]
Associated Data
This section collects any data citations, data availability statements, or supplementary materials included in this article.


