Abstract
The catalytic mechanism of [NiFe]-hydrogenases is a subject of extensive research. Apart from at least four reaction intermediates of H2/H+ cycling, there are also a number of resting states, which are formed under oxidizing conditions. Although not directly involved in the catalytic cycle, the knowledge of their molecular structures and reactivity is important, because these states usually accumulate in the course of hydrogenase purification and may also play a role in vivo during hydrogenase maturation. Here, we applied low-temperature infrared (cryo-IR) and nuclear resonance vibrational spectroscopy (NRVS) to the isolated catalytic subunit (HoxC) of the heterodimeric regulatory [NiFe]-hydrogenase (RH) from Ralstonia eutropha. Cryo-IR spectroscopy revealed that the HoxC protein can be enriched in almost pure resting redox states suitable for NRVS investigation. NRVS analysis of the hydrogenase catalytic center is usually hampered by strong spectral contributions of the FeS clusters of the small, electron-transferring subunit. Therefore, our approach to investigate the FeS cluster-free, 57Fe-labeled HoxC provided an unprecedented insight into the [NiFe] site modes, revealing their contributions in a spectral range otherwise superimposed by FeS cluster-derived bands. Rationalized by density functional theory (DFT) calculations, our data provide structural descriptions of the previously uncharacterized hydroxy- and water-containing resting states. Our work highlights the relevance of cryogenic vibrational spectroscopy and DFT to elucidate the structure of barely defined redox states of the [NiFe]-hydrogenase active site.
Active site vibrations of a [NiFe]-hydrogenase catalytic subunit are selectively probed by IR and NRV spectroscopy in two NiIIFeII and NiIIIFeII resting states, contributing in combination with DFT modeling to rationalized structural candidates.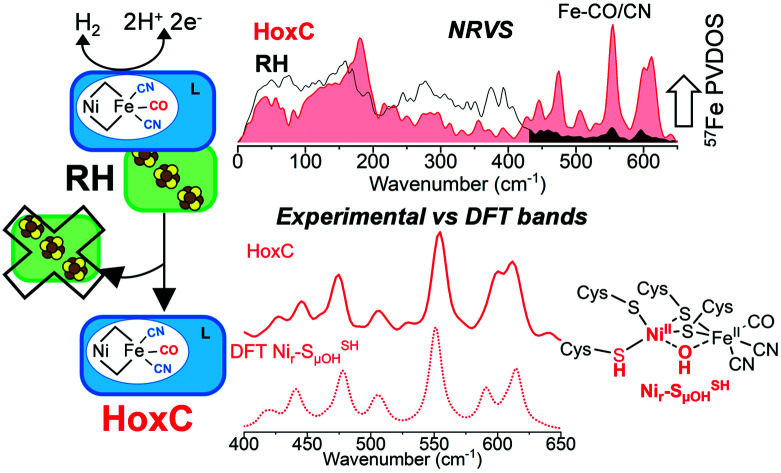
Introduction
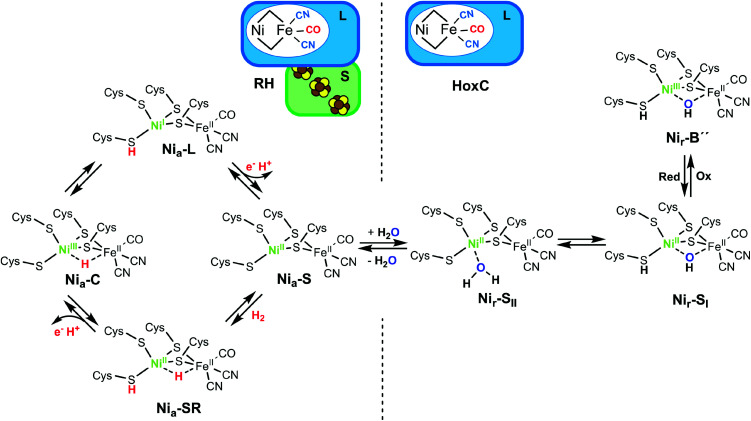
Hydrogenases catalyze the reversible cleavage of dihydrogen, thereby making use of earth–abundant transition metals. Among them, O2-tolerant [NiFe]-hydrogenases are particularly attractive in view of a remarkable catalytic performance under usually inhibiting oxic conditions.1,2 Buried deeply in the large subunit of the heterodimeric functional unit, the [NiFe] active site contains a Ni and an Fe ion bridged by two cysteine (Cys) residues; two additional terminal Cys bind exclusively to the Ni, while two CN− and one CO ligands participate in the coordination of the Fe (Fig. 1). H2 splitting releases two protons that are transferred to nearby proteinaceous H+ acceptors. The concomitantly released electrons are channeled through an FeS cluster chain located in the small subunit to the hydrogenase's redox partner.3–5 Although [NiFe]-hydrogenases have been the subject of intensive research for decades, many questions remained open regarding the nature of some resting states as well as catalytically relevant intermediates. Infrared (IR) spectroscopy represents a valuable technique to monitor the redox-sensitive CO and CN− ligands of the active site, and electron paramagnetic resonance (EPR) spectroscopy provides important electronic and structural information on the active site redox states.6–8 During catalysis, nickel serves as a redox-active metal center, while iron retains an FeII low-spin configuration throughout the entire catalytic cycle (Fig. 1, left panel).1,9 However, some redox states are EPR-silent, and direct IR spectroscopic detection of possible hydride H− and hydroxy OH− bridging ligands at the active site is hindered by strong spectral contributions of the protein and/or the solvent. Furthermore, resonance Raman (RR) spectroscopy has also been applied for the analysis of metal–ligand vibrations of [NiFe]-hydrogenase intermediate states characterized by a vacant bridging position between Ni and Fe (i.e. Nia–S and Nia–L, Fig. 1).10,11
Fig. 1. (Left) Schematic representation of the subunit composition of the RH and the proposed catalytic cycle of [NiFe]-hydrogenases. The states involved in the H2 transformation include the Nia–S intermediate that presumably binds H2 in the bridging position between the nickel and the iron ions. H2 splitting results in a two-electron reduced Nia–SR state characterized by a bridging hydride. Release of one electron and one proton results in a hydride-carrying Nia–C species, which is a tautomeric form of the Nia–L state. Release of another electron and a further proton restores the Nia–S intermediate.1,4 Protonation of a terminal cysteine as well as the bridging hydride are highlighted in red. The Ni and its oxidation state are depicted in green. (Right) Schematic representation of the [NiFe]-hydrogenase large subunit HoxC and proposed structures of its resting states. The as-isolated HoxC protein occurs in a mixture of the Nir–SI and Nir–SII species. One-electron oxidation results in the formation of the Nir–B′′ species. Protonation of the terminal cysteine, as found for the Nia–SR and the light-induced Nia–L intermediates (left panel), and the OH−/H2O active site ligands assigned in this work are depicted in bold case letters.
Nuclear resonance vibrational spectroscopy (NRVS) is a synchrotron-based technique that allows selective observation of vibrational modes of Mössbauer-active nuclei. Using the 57Fe nuclear resonance at 14.4 keV, NRVS has provided valuable structural information about [NiFe]-,12–14 [FeFe]-,15,16 and [Fe]-hydrogenases.17 A typical NRV spectrum of [NiFe]-hydrogenase comprises dominant bands of Fe–S(–Fe) stretching and bending modes in the region between 100 and 420 cm−1, which are mostly related to the FeS clusters of the electron transport chain, as well as Fe–CO/CN stretching and bending modes of the [NiFe] active site in the 400–650 cm−1 spectral region. Most of the iron atoms in the enzyme are located in the FeS clusters; therefore their spectral contributions surpass the signals of the single active site iron. This results often in poorly resolved signals of the Fe–CO/CN modes, which have a relatively low intensity. Furthermore, certain bands related to the FeS clusters and the [NiFe] active site are superimposed, hindering their unambiguous assignment.12,14,18 Nevertheless, a combined approach of NRVS and density functional theory (DFT) has provided significant structural details of the [NiFe] active site in catalytic intermediates, revealing the existence of a hydride-containing Nia–SR intermediate.13
Apart from H2-cycling intermediates, several resting states are formed under non-turnover conditions.1 Although these states are not directly involved in the catalysis, the knowledge of their molecular structure is important, because they accumulate in the course of hydrogenase purification and often require extensive reactivation procedures. Additionally, they may also play a role in vivo during hydrogenase maturation protecting the active site from redox inactivation.19
Recently, we isolated the catalytic subunit HoxC from the O2-tolerant regulatory [NiFe]-hydrogenase (RH) of Ralstonia eutropha. HoxC hosts exclusively the [NiFe] active site and exhibits little activity due to the predominance of inhibited resting states.19 Therefore, the HoxC protein is an ideal target for a selective and detailed spectroscopic investigation of the catalytic center in its resting states (Fig. 1) without interference from the auxiliary FeS clusters. In this work, we applied low-temperature IR and NRVS techniques together with DFT calculations on the 57Fe-labeled HoxC protein to gain structural information of these so-far poorly characterized [NiFe]-hydrogenase states. We uncovered the vibrational bands of the active site in a broad spectral range, previously superimposed by the Fe–S vibrations. This enabled us to define new structural determinants of the catalytic center, namely a bridging hydroxy-ligand and a protonated Ni-bound cysteine residue, as key elements of the two resting states. These new finding may represent benchmarks for future NRVS studies on site-selectively labeled hydrogenases as well as biomimetic [NiFe] compounds.
Results and discussion
IR detection of CO and CN− ligands of the [NiFe] active site at ambient and cryogenic temperatures
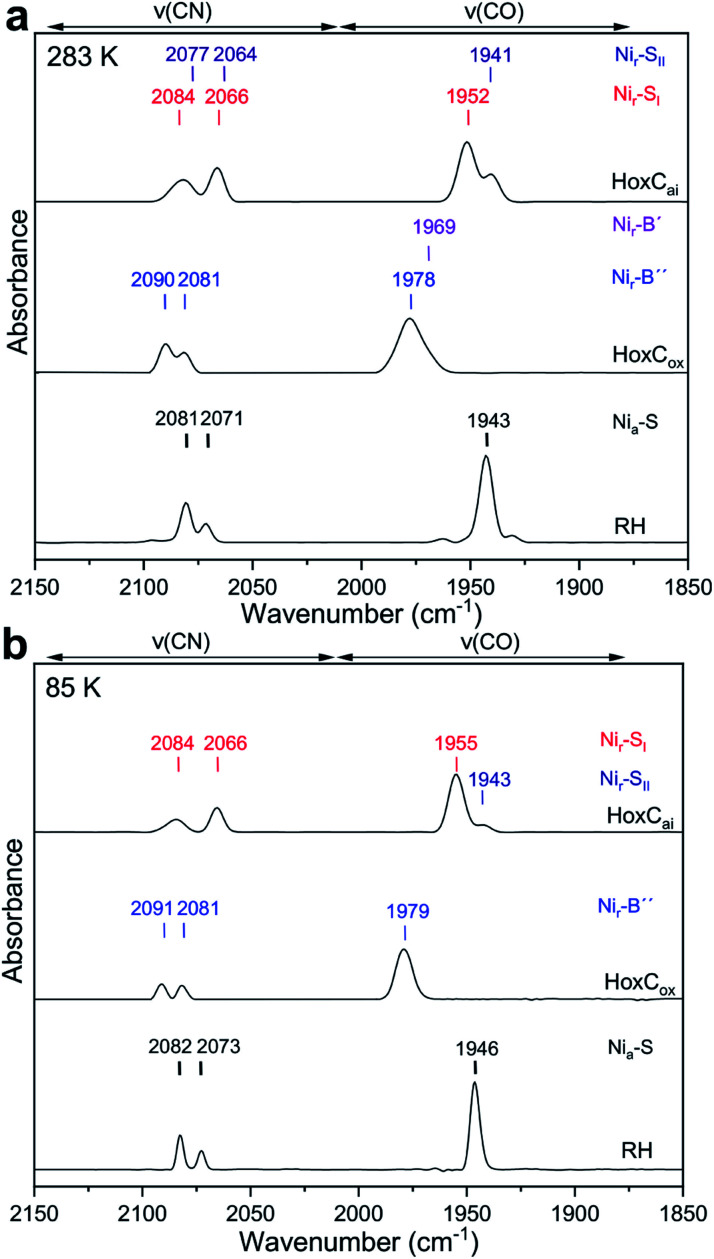
The as-isolated HoxC protein (HoxCai) contains a stoichiometric amount of the [NiFe] active site, which resided in the diamagnetic and isoelectronic Nir–SI and Nir–SII states at ambient temperature (Fig. 1 and 2a).1,19 A previous study showed that these states can be partially interconverted by shifting the pH of the buffer.19 This has been interpreted with the presence of a protonatable bridging ligand at the active site, attributed to a hydroxy (OH−) group (Fig. 1).20–22 Native RH, for comparison, resided preferentially in the Nia–S state characterized by a vacant bridging position and a CO absorption in the IR spectrum at 1943 cm−1, which remains stable over a broad pH range (Fig. S1†).19,23 As NRVS is conducted under cryogenic conditions (estimated sample temperature of 40–80 K), it is advisable to record the corresponding IR spectra of the HoxC and RH proteins at similarly low temperatures to allow a direct comparison of the two spectroscopic techniques. In fact, the mixture of the Nir–SI and Nir–SII states, observed for HoxCai at 283 K, converted into an almost pure Nir–SI species at 85 K characterized by a CO absorption at 1955 cm−1 (Fig. 2b). According to our previous interpretation,19 the Nir–SI and Nir–SII species just differ in the protonation state of the bridging ligand (OH−vs. H2O). Thus, cryogenic temperatures seem to stabilize the hydroxy ligand (Fig. 1), which is presumably related to the temperature-dependent changes of the active site surrounding. The enrichment of the Nir–SI state turns out to be reversible. Indeed, setting the temperature of the HoxC sample to 298 K (RT) restored the original Nir–SI/Nir–SII ratio (Fig. S2†). Native RH, by contrast, retained a single CO absorption at 1946 cm−1 in the IR spectrum, i.e. it maintained the Nia–S state at 85 K (Fig. 2b). Thus, HoxC and RH exhibit different IR spectra both at room temperature and under cryogenic conditions, reflecting at least slightly divergent active site structures.
Fig. 2. IR spectra of HoxCai, HoxCox and RH (top to bottom) taken at 283 K and 85 K. (a) IR spectral region characteristic of CO and CN stretching modes recorded at 283 K. The spectrum of HoxCai exhibits spectral contributions of the Nir–SI (red) and Nir–SII (dark blue) resting states, respectively. The spectrum of RH is dominated by signals attributed to the Nia–S state (labeled in black). The IR data of HoxCox comprise contributions from two paramagnetic oxidized Nir–B′ (minor species) and Nir–B′′ states labeled in purple and blue, respectively. (b) IR spectral region characteristic of CO and CN stretching modes recorded at 85 K for the same samples. Contributions from the corresponding CN absorptions of Fe(CN)63− and Fe(CN)62− present in the chemically oxidized HoxCox were subtracted for the sake of clarity.19.
In our previous work, we showed that HoxCai can be oxidized by ferricyanide, revealing a species denoted as HoxCox.19 According to X-ray, EPR and DFT studies, standard [NiFe]-hydrogenases form paramagnetic NiIII species such as the Nir–B state upon oxidation (Fig. 1).1,24–26 The IR spectrum of HoxCox, recorded at room temperature, displayed bands assigned to Nir–B-like species termed Nir–B′ and Nir–B′′, respectively.19 Low-temperature IR measurements performed on HoxCox revealed the Nir–B′′ state, characterized by a CO absorption at 1979 cm−1, as the predominant species at 85 K (Fig. 2b). The oxidation of the nickel site was confirmed by EPR measurements (Fig. S3†).19 The fact that almost pure Nir–SI and Nir–B′′ states were observed in HoxCai and HoxCox, respectively, allowed for establishing DFT models, which were subsequently used to interpret the low-temperature IR and NRV spectra.
DFT modeling of the HoxC active site in the Nir–S- and Nir–B-like states
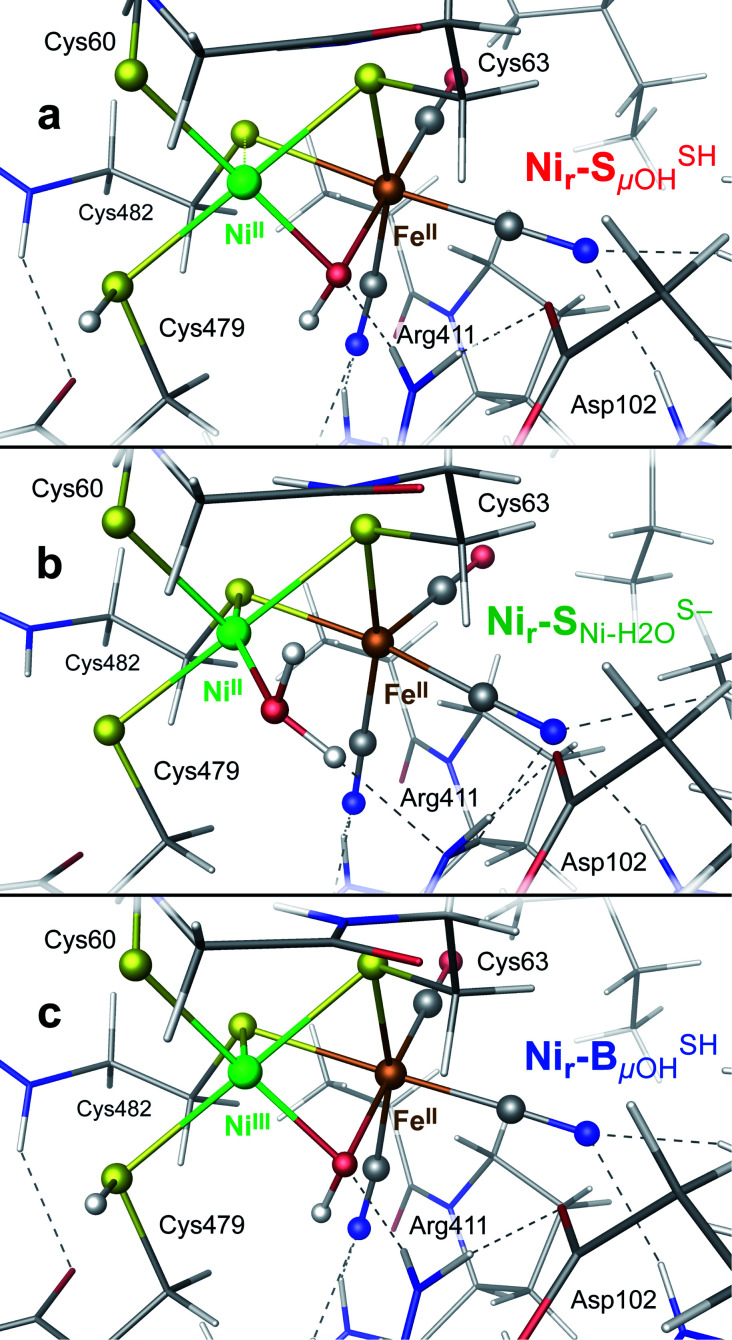
DFT calculations were used to model the structural details and vibrational spectra of the [NiFe] active site in the HoxCai/HoxCox proteins. In the absence of experimentally resolved crystallographic structures of either HoxC or native RH, the DFT modeling was based on the corresponding X-ray structure of the membrane-bound hydrogenase (MBH) from the same organism.27 The model setup is described in detail in the ESI† Materials and methods. In comparison to the large subunit of MBH, our HoxC homology model revealed a larger active site pocket with a lower number of contacts between the protein side chains and the metal ligands (Fig. S4†). The DFT calculations were performed for the reduced, diamagnetic Nir–S-like [NiIIFeII] species with an overall spin of zero and for the oxidized, paramagnetic Nir–B-like [NiIIIFeII] state with a spin of 1/2. According to previous structural predictions for the reversibly inhibited ready-states of [NiFe]-hydrogenases,1,28,29 our models contained a bridging hydroxy (μOH subscript in the model notations) ligand at the active site (Fig. S5–S7†). For the Nir–S species, local energy minima were also obtained with a water molecule serving as either a metal-bridging (μH2O), a Ni-terminal (Ni–H2O),28,29 or an Fe-terminal (Fe–H2O) ligand (Fig. S8–S10†). All models revealed a hydrogen bonding between the guanidinium group of the conserved arginine residue and the alternative metal-bound μOH/H2O species (Fig. S6–S10†). The DFT model set was further extended by considering the Ni-bound terminal cysteine Cys479 with either a protonated thiol (SH superscript in the model notations), as, e.g., in the Nir–SSHμOH model shown in Fig. 3a, or a deprotonated thiolate (S−, as shown in Fig. 3b and S6–S10†). This is in line with the proposed protonation of the corresponding cysteine residue in the catalytically relevant Nia–SR and Nia–L states of [NiFe]-hydrogenases.30–34 We also examined the second Ni-bound terminal cysteine Cys60 as a possible protonation site. The corresponding Nir–SCys60-SHμOH model is shown in Fig. S6.†
Fig. 3. DFT models: (a) Nir–SSHμOH of the reduced Nir–SI state, (b)  of the reduced Nir–SII state, and (c) Nir–BSHμOH of the oxidized Nir–B′′ state, displaying the [NiFe] cofactor metal ligands and their contacts with the nearby side chains in HoxC. For alternative models and the entire HoxC homology model employed, see Fig. S4–S10.†.
Notably, the structural optimization of the Nir–SμOH models revealed an over-elongated bond between the NiII ion and the bridging sulfur ligand of Cys482,19,28,35 whose length depended on the protonation state of the Ni-terminal cysteines. The Nir–SSHμOH, Nir–SCys60-SHμOH and Nir–SS−μOH models yielded NiII⋯S(Cys482) distances of 2.7, 2.8 and 3.0 Å, respectively, consistent with an essentially lost coordination. All other Ni/Fe–S (Cys ≠ Cys482) distances remained within a narrow bonding range of ∼2.2–2.4 Å across the entire model set. No bond elongation or lost coordination between the NiIII ion and the bridging sulfur ligand of Cys482 was found for the Nir–BμOH models, as, e.g., in the Nir–BSHμOH model (Fig. 3c), in line with available crystallographic data.24 To account for the flexibility of the Ni coordination sphere, the present DFT models included explicitly the two short CXXC protein sequence spacers spanning the two cysteine pairs ligating the nickel (Fig. S4†).
DFT reproduces the experimental IR spectra of the Nir–SI and Nir–B′′ states of HoxC
DFT calculations based on the Nir–SSHμOH and Nir–BSHμOH models (Fig. 3a and c, or S6 and S7†) predict CO and CN stretching frequencies as well as relative IR intensities close to those detected in the low-temperature IR measurements (Fig. 2b, S11a and b†). While the absolute positions of the DFT-simulated CO and CN bands in proteins commonly rely on a linear fit procedure (described in the ESI† Materials and methods), the corresponding direction of band shifts is independent of the fitting procedure and reflects a polarization of the Fe-bound CO/CN− ligands. Thus, a charge increase of 1+ per active site unit results in a predicted blue-shift of the CO stretching frequency of ∼20–30 cm−1. This is reflected by the simulated IR bands from a series of models at three levels of charge, i.e. (i) Nir–SS−μOH, (ii) Nir–BS−μOH/Nir–SSHμOH and (iii) Nir–BSHμOH (Fig. S11†). The blue shift of ∼20–30 cm−1 is in a good agreement with the experimentally monitored spectral shift of 24 cm−1 observed for the Nir–SI (HoxCai) and Nir–B′′ (HoxCox) states (Fig. S11a and b†). This is consistent with the oxidation of the nickel ion from NiII to NiIII for the Nir–SI to Nir–B′′ conversion (Fig. S3†),22,36,37 assuming that the protonation status of Cys479 was unchanged. Altogether, the experimental and theoretical data are consistent with a total charge increase of 1+ at the [NiFe] active site when moving from HoxCai to HoxCox. Thus, the comparison of the experimental and DFT-computed IR spectra does not allow a conclusive statement whether or not Cys479 is protonated.
The low-temperature IR spectrum of HoxCai also revealed traces of the Nir–SII species, identified through the CO band at 1943 cm−1, which is shifted just by 12 cm−1 compared to the CO band at 1955 cm−1 of Nir–SI (Fig. 2b). Therefore, the Nir–SI and Nir–SII states carry rather an identical charge. Among the different Nir–S models explored, a red-shifted CO band with the same active site charge was computed assuming a terminal H2O ligand at the Ni ion and a deprotonated Cys479 (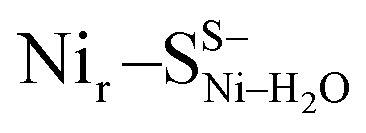 , Fig. 3b, S12† and 1). The relative energy difference between the
  and Nir–SSHμOH models is just 2.0 kcal mol−1. Thus, the corresponding Nir–SII and Nir–SI species may coexist in a temperature-dependent dynamic equilibrium with a slight preference for Nir–SI (Fig. S2†). Yet, an alternative rationalization of the minor red-shifted Nir–SII is that it represents a species singly deprotonated with regard to the Nir–SI state, still carrying the bridging hydroxy ligand (Nir–SS−μOHvs. Nir–SSHμOH, Fig. S11a†). A recent computational study supported the Nir–SSHμOH and
 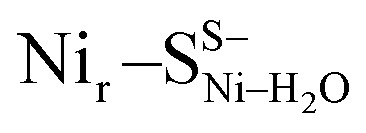 active site assignment for the Nir–SI/II states.35
Experimental and DFT-computed NRV spectra of the active site in HoxCai and HoxCox proteins
The NRV spectra of 57Fe-enriched HoxCai and RH are shown in Fig. 4. As native RH has three [4Fe4S] clusters, bands originating from the FeS clusters dominate the corresponding spectrum. The spectral contributions of the [NiFe] site are relatively weak and visible only in the high-frequency region of 420–600 cm−1 (Fig. 4).12 Further details about the NRVS characterization of RH are provided in the ESI Supplementary results and Fig. S13 and S14.† The most intense active site bands in RH are detected at 553 cm−1 and 596 cm−1 and are attributed mainly to Fe–CO stretching and bending modes.12 Bands below 530 cm−1, which are due to Fe–CN and mixed Fe–CO/CN modes, could not be properly resolved due to their relatively low intensity.
Fig. 4. NRVS partial vibrational density of states (PVDOS) of 57Fe-labeled RH (bottom) and its large subunit HoxC (top), in their isolated forms, normalized to an integrated PVDOS of 3. Different spectral regions are indicated with arrows using the following color code: red, bands related to Fe–CO/CN of the [NiFe] active site; orange, bands related to [NiFe] site/protein modes; blue, bands related to Fe–μS modes involving bridging cysteines; olive, bands related to the Fe–S modes of the [4Fe4S]-clusters. Representative bands in the RH and HoxC spectra are labeled with numbers in black. The corresponding NRVS data including the error bars are presented in Fig. S20.†.
NRV spectra for the HoxCai and HoxCox samples were obtained under conditions identical to those applied for the cryogenic IR measurements. The NRV spectrum of the HoxCai sample, which mostly resided in the Nir–SI state (Fig. 2b), comprises main bands at 554, 600 and 612 cm−1 in addition to features at 507, 474, 445 and 427 cm−1 (Fig. 4). The corresponding spectrum of HoxCox, which mostly resided in the Nir–B′′ state (Fig. 2b), is shown in Fig. S15.† Due to the absence of the FeS clusters, the observed bands could be attributed exclusively to the [NiFe] center. This also led to a notable increase of the intensity of the characteristic Fe–CO/CN vibrations in the ∼400–600 cm−1 region compared to the RH spectrum (Fig. 4, red shaded rectangle). Moreover, we also observed the spectral contributions of the active site in the low-frequency region with a main band at 180 cm−1. This spectral region of the HoxC NRV spectrum (Fig. 4, 5 and S15†) is shaped by the (i) torsional/‘breathing’ modes of the cofactor (∼150–220 cm−1), (ii) [NiFe] core displacements relative to the protein framework (∼50–150 cm−1), and (iii) displacements of the cofactor in phase with the nearby side chains or ‘acoustic’ modes (below ∼50 cm−1). The intermediate-frequency region (∼250 to 400 cm−1), containing high-intensity FeS cluster bands in the uniformly 57Fe-labeled RH spectrum, is largely free of distinct bands of HoxC. The only vibrations of a similar type in the active site are Fe–μS(Cys) stretching modes of the two bridging cysteines, detectable in the region of 270–380 cm−1 (Fig. S19g†). These contributions cannot be detected in the presence of (NRV-active) FeS clusters (Fig. 4). Consistent with low-temperature IR spectroscopic measurements (Fig. 2b), the spectral differences of the NRVS data indicate that the catalytic centers of RH (Nia–S) and HoxCai (Nir–SI) reside in different states (Fig. 1).
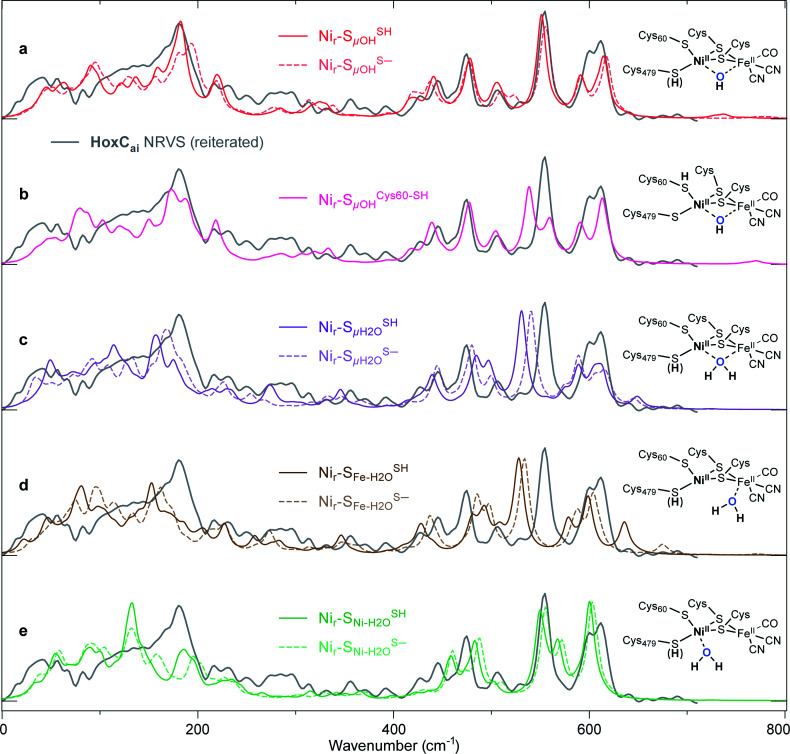
Fig. 5. Comparison of the experimental NRV spectrum of the HoxCai sample (Nir–SI, grey trace reiterated in (a–e)) overlaid with the corresponding DFT-calculated 57Fe-PVDOS bands using alternative [NiIIFeII] models, schematically shown on the right side of the spectra. The DFT spectra derived using either protonated (solid lines) or deprotonated (broken lines) Cys479 are shown for the following models: (a) best-fit Nir–SSHμOH and Nir–SS−μOH (Fig. S6†); (c)  and
and 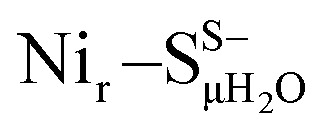 (Fig. S8†); (d)
 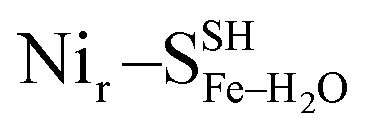 and
and 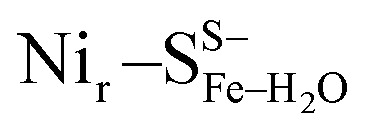 (Fig. S9†); (e)
  and
and  (Fig. S10†). The DFT spectrum derived from the alternative hydroxy model with protonated Cys60, Nir–SCys60-SHμOH, is highlighted in (b). Both μOH− models in (a) reproduce the experimental data in the Fe–CO/CN region above 400 cm−1. Minor differences in the low-frequency spectral region around 180 cm−1 (Fig. S16†) strengthen the Nir–SSHμOH model, in line with the better prediction of the experimental IR absorptions for the CO and CN stretching modes (Fig. S11a†).
The DFT models described above (Fig. S6–S10†) were used to generate the 57Fe-PVDOS profiles of the HoxCai and HoxCox proteins in the Nir–SI and Nir–B′′ states, respectively (Fig. S16 and S17†). Fig. 5 shows a comparison of the HoxCai experimental spectrum (0–700 cm−1 region) with the DFT-calculated spectra based on the Nir–S models. The computed data based on the Nir–SS−μOH and Nir–SSHμOH models – both carrying a bridging hydroxy group – reproduce the experimental spectrum very well (Fig. 5a, S16 and S18†).
Yet, an alternative hydroxy-bridged Nir–S model in which Cys60 is protonated (Nir–SCys60-SHμOH) revealed a distinct ∼20 cm−1 splitting of the high-intensity ∼550 cm−1 band and is therefore rather incompatible with the experimental spectrum (Fig. 5b). All the other models, carrying either bridging H2O (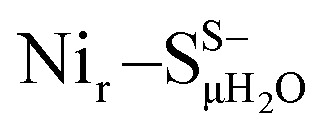 and
and  , Fig. 5c), a terminal, Fe-bound water molecule (
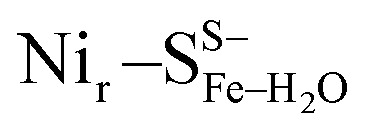 and
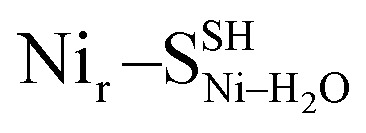
and 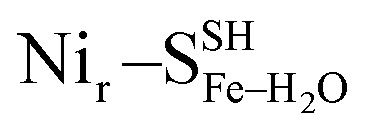 , Fig. 5d) or a terminal, Ni-bound water molecule (
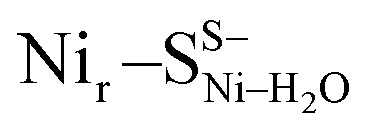 and
and 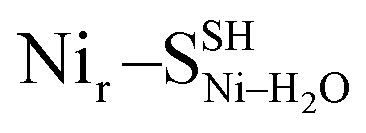 , Fig. 5e), led to 57Fe-PVDOS signatures with an inferior match to the experimental spectrum of HoxCai. A closer examination of the low-frequency region (0–200 cm−1) revealed that the Nir–SSHμOH model, which carries a protonated Cys479, provides a more accurate fit (solid line in Fig. 5a) to the experimental spectrum than the unprotonated form (Nir–SS−μOH, dotted line in Fig. 5a, see also Fig. S16†). In this respect, the shape and position of the high-intensity band at ∼180 cm−1 in the calculated HoxC spectrum were found remarkably sensitive to the specific μOH−/(μ/Ni-/Fe-)H2O ligand coordination as well as to the protonation of the Ni-bound terminal cysteine(s) (Fig. 5 and S16†).
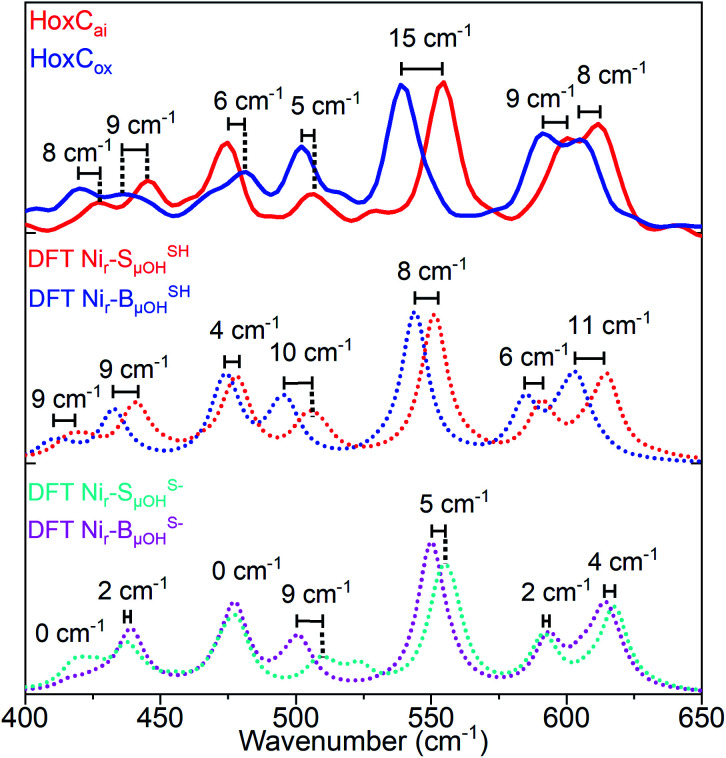
Analogously to low-energy NRVS maxima in the spectral region characteristic of FeS clusters, preferentially attributed to S–Fe–S bending vibrations (Fig. S13 and S14a†),14,38 the active site normal modes forming the ∼180 cm−1 band comprise ‘delocalized’ Cys(S)–Ni/Fe–(S)Cys bending modes involving entire side chain motions of the four cysteines. Additional details on the effects influencing the 57Fe-PVDOS profiles are provided in the ESI† Supplementary results. The experimental spectrum of HoxCox was best reproduced by DFT-computed data based on the Nir–BSHμOH model, which contains a protonated Cys479 cysteine (Fig. S17†). Thus, the Nir–SI and Nir–B′′ states differ only in the oxidation level of the Ni ion, and the Nir–SI to Nir–B′′ transition represents a one-electron oxidation of NiII to NiIII.20,22,36 This is fully consistent with our DFT-supported IR analysis (Fig. 2b and S11†) and the EPR measurements (Fig. S3†). Accordingly, the NRVS data of the HoxCox sample revealed red-shifts of 8–15 cm−1 of bands in the region above 500 cm−1 dominated by the Fe–CO stretching vibrations compared to the HoxCai sample (Fig. 6), thereby reflecting the oxidation of the active site.
Fig. 6. Comparison of the experimentally observed and DFT-calculated 57Fe-PVDOS bands in the 400–650 cm−1 spectral region for HoxCai and HoxCox. Experimental spectra (top: red trace, HoxCai; blue trace, HoxCox) are compared to their DFT-calculated counterparts based on the corresponding models that contain either protonated (middle: Nir–SSHμOH and Nir–BSHμOH states) or deprotonated Ni-bound terminal cysteine (bottom: Nir–SS−μOH and Nir–BS−μOH states). Bands calculated using Nir–SSHμOH and Nir–BSHμOH models are in better agreement with the NRVS data, including their shift magnitudes marked in the figure. The corresponding NRVS data including the error bars are presented in Fig. S20.†.
The red-shifts of this magnitude are predicted by the corresponding DFT models with protonated Cys479 (Nir–SSHμOH → Nir–BSHμOH). The related models without terminal cysteine protonation (Nir–SS−μOH → Nir–BS−μOH) revealed smaller band shifts, which do not reflect the experimental data (Fig. 6). Notably, while the oxidation of the active site led to a red-shift of the Fe–CO/CN vibrations in NRVS (Fig. 6), a blue-shift was observed for the IR stretching frequencies of the active site CO/CN− ligands (Fig. 2b). This can be rationalized by charge polarization effects at the Fe site. Stronger bonds within the diatomic ligands, reflected by the blue-shifted IR bands related to the CO and CN stretching vibrations, imply, in turn, weaker Fe–CO/CN bonds, resulting in a red-shift of the corresponding NRVS bands. The accurate prediction of this redox-dependent vibrational shift relies on the inclusion of explicit interactions between the HoxC protein environment and the [NiFe]-cofactor, as confirmed by our computational test using an alternative minimal model omitting all the residues except the four cysteines directly coordinating the two metals (ESI Supplementary results and Fig. S18c†).
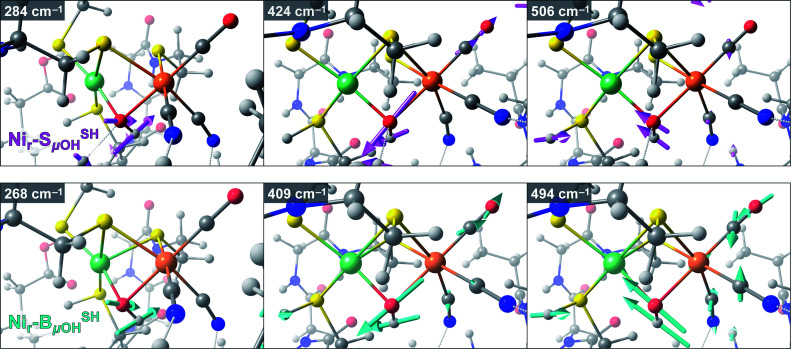
Taking advantage of the good agreement between the experimental and computed vibrational spectra, we were able to unveil the most prominent bridging hydroxy μOH− displacements in the active site of HoxC (Fig. S19†). The largest μOH− displacements were correlated with the μO(H)-PVDOS profile (Fig. S19b†). In the corresponding Nir–SSHμOH/Nir–BSHμOH models, we deduced Ni–μOH stretches at 506/494 cm−1 (Fig. S19c†), Fe–μOH stretches at 424/409 cm−1 (Fig. S19d†), and Ni–μOH–Fe wagging modes at 284/268 cm−1, in which the μOH− ligand moves perpendicularly to the Ni–Fe axis of the active site. The most relevant Fe/Ni–μOH modes are depicted in Fig. 7. In spite of their inherently low 57Fe-PVDOS intensities, the Ni–μOH and Fe–μOH stretches gain intensity via vibrational coupling to the Fe–CO/CN coordinates. They are associated with the experimental NRVS features at 507/502 (Ni–μOH) and 427/420 cm−1 (Fe–μOH) of Nir–SI/Nir–B′′, respectively (Fig. S16a/S17a†). Because of their relatively low intensities, no specific bands in the experimental NRV spectra could be confidently associated with the essentially pure Ni–μOH–Fe wagging modes.
Fig. 7. Arrow-style representation of important Fe/Ni–μOH vibrational modes from representative DFT models for the Nir–SI (model Nir–SSHμOH, top) and Nir–B′′ (model Nir–BSHμOH, bottom) states. The corresponding vibrational energies (cm−1) are indicated in the top left of each panel. Left to right: Ni–μOH–Fe wagging, Fe–μOH stretching, and Ni–μOH stretching modes. The stick-style mode intensities relevant to the interpretation of the 57Fe-PVDOS spectra are marked in Fig. S18b and S19b–d.† Animations of these and other normal modes are available as part of the ESI.†.
Conclusions
With the present study, we provide insight into the active site structure of two interconvertible redox states of a [NiFe]-hydrogenase active site by means of vibrational spectroscopy and concomitant DFT calculations. Specific 57Fe enrichment of the catalytic subunit HoxC of the regulatory [NiFe]-hydrogenase from R. eutropha resulted in a strong enhancement of the active site spectral features, as revealed by NRVS analysis. The absence of FeS clusters enabled the observation of low-intensity Fe–CO/CN modes as well as active site bands usually superimposed by the strong spectral contribution of FeS cluster signals. By combining NRVS with cryo-IR spectroscopy, we targeted the two hydroxy-bridged Nir–SI and Nir–B′′ states of the [NiFe] active site, which turned out to differ just in the oxidation state of the Ni ion. In fact, the two DFT-based homology models of the catalytic center Nir–SSHμOH and Nir–BSHμOH, comprising a bridging OH− ligand and a protonated terminal cysteine, reproduced accurately the active site bands obtained by NRV and cryo-IR spectroscopy.
Previous studies suggested a protonatable bridging hydroxy ligand between Ni and Fe ions in the Nir–S state(s),21,22,39,40 whose removal produces a catalytically competent Nia–S intermediate.30,41 Our results provide structural details for these states, including a protonated terminal cysteine, which is consistent with previous studies supporting a conserved protonation state in the Nir–B and Nir–SI resting states.22,36,37,42 Additionally, the presence of an acid-base couple (OH− and H+) at a close distance in the HoxC active site suggests that water removal might be a crucial step of hydrogenase maturation. This step might be mediated by the attachment of the FeS-carrying small subunit, enabling the formation of H2-metabolizing catalytic intermediates. Recent results on the in vitro assembly of large and small subunits of RH from R. eutropha seem to corroborate this mechanism.43
Another important outcome of the present work is that temperature has a strong impact on the equilibrium distribution of the enzymes' redox states. Therefore, samples measured at ambient temperature by, e.g., IR spectroscopy, should be used with care as a reference for experiments performed at cryogenic temperatures. This conclusion proved to be valid also for [FeFe]-hydrogenases.44,45 It can probably be extended to the structural characterization of other biological and synthetic catalysts, where spectroscopic measurements at room temperature, e.g. IR, UV-visible, are used to interpret data collected using cryogenic techniques, including EPR and synchrotron-related X-ray crystallography, NRVS and XAS.
In summary, our study demonstrated the power of advanced vibrational spectroscopic techniques at cryogenic temperatures in combination with DFT calculations to elucidate the molecular active site structure of metalloenzymes. Here, we enriched and studied two hydroxy-containing redox states of [NiFe]-hydrogenases. In case catalytic intermediates can be trapped in a similar manner, this strategy will be useful to unravel their corresponding active site architectures.
Conflicts of interest
There are no conflicts to declare.
Supplementary Material
Acknowledgments
G. C., O. L., I. Z., P. H. and S. P. C. are grateful to the Einstein Foundation Berlin for funding (EVF-2016-277 and Einstein Center of Catalysis). This work was also funded by the Deutsche Forschungsgemeinschaft (DFG, German Research Foundation) under Germany's Excellence Strategy – EXC 2008 – 390540038 – UniSysCat. The authors are indebted for EU financial support (Article 38.1.2, GA) within the European Union's Horizon 2020 research and innovation program under grant agreement No 810856. S. P. C. acknowledges funding for his work through NIH GM-65440. NRVS data collection was supported by the [2017B1321], [2016B1316] and [2017A1115] SPring-8 proposals.
Electronic supplementary information (ESI) available: Materials and methods and supplementary results including Fig. S1–S20 (PDF). Selected DFT normal mode animations (GIF format) relevant to NRVS bands (ZIP archive). Optimized structures (XYZ format) for all DFT-computed models (ZIP archive). See DOI: 10.1039/d0sc05022a
References
- Lubitz W. Ogata H. Rüdiger O. Reijerse E. Chem. Rev. 2014;114:4081–4148. doi: 10.1021/cr4005814. [DOI] [PubMed] [Google Scholar]
- Shafaat H. S. Rüdiger O. Ogata H. Lubitz W. Biochim. Biophys. Acta Bioenerg. 2013;1827:986–1002. doi: 10.1016/j.bbabio.2013.01.015. [DOI] [PubMed] [Google Scholar]
- Tombolelli D. Mroginski M. A. J. Phys. Chem. B. 2019;123:3409–3420. doi: 10.1021/acs.jpcb.9b00617. [DOI] [PubMed] [Google Scholar]
- Ash P. A. Hidalgo R. Vincent K. A. ACS Catal. 2017;7:2471–2485. doi: 10.1021/acscatal.6b03182. [DOI] [PMC free article] [PubMed] [Google Scholar]
- Evans R. M. Brooke E. J. Wehlin S. A. M. Nomerotskaia E. Sargent F. Carr S. B. Phillips S. E. V. Armstrong F. A. Nat. Chem. Biol. 2016;12:46–50. doi: 10.1038/nchembio.1976. [DOI] [PubMed] [Google Scholar]
- Lubitz W. Reijerse E. van Gastel M. Chem. Rev. 2007;107:4331–4365. doi: 10.1021/cr050186q. [DOI] [PubMed] [Google Scholar]
- Pandelia M.-E. Ogata H. Lubitz W. ChemPhysChem. 2010;11:1127–1140. doi: 10.1002/cphc.200900950. [DOI] [PubMed] [Google Scholar]
- Happe R. P. Roseboom W. Pierik A. J. Albracht S. P. J. Bagley K. A. Nature. 1997;385:126. doi: 10.1038/385126a0. [DOI] [PubMed] [Google Scholar]
- Huyett J. E. Carepo M. Pamplona A. Franco R. Moura I. Moura J. J. G. Hoffman B. M. J. Am. Chem. Soc. 1997;119:9291–9292. doi: 10.1021/ja9700919. [DOI] [Google Scholar]
- Horch M. Schoknecht J. Mroginski M. A. Lenz O. Hildebrandt P. Zebger I. J. Am. Chem. Soc. 2014;136:9870–9873. doi: 10.1021/ja505119q. [DOI] [PubMed] [Google Scholar]
- Siebert E. Horch M. Rippers Y. Fritsch J. Frielingsdorf S. Lenz O. Velazquez Escobar F. Siebert F. Paasche L. Kuhlmann U. Lendzian F. Mroginski M.-A. Zebger I. Hildebrandt P. Angew. Chem., Int. Ed. 2013;52:5162–5165. doi: 10.1002/anie.201209732. [DOI] [PubMed] [Google Scholar]
- Kamali S. Wang H. Mitra D. Ogata H. Lubitz W. Manor B. C. Rauchfuss T. B. Byrne D. Bonnefoy V. Jenney F. E. Adams M. W. W. Yoda Y. Alp E. Zhao J. Cramer S. P. Angew. Chem., Int. Ed. 2013;52:724–728. doi: 10.1002/anie.201204616. [DOI] [PMC free article] [PubMed] [Google Scholar]
- Ogata H. Krämer T. Wang H. Schilter D. Pelmenschikov V. van Gastel M. Neese F. Rauchfuss T. B. Gee L. B. Scott A. D. Yoda Y. Tanaka Y. Lubitz W. Cramer S. P. Nat. Commun. 2015;6(1):7890. doi: 10.1038/ncomms8890. [DOI] [PMC free article] [PubMed] [Google Scholar]
- Lauterbach L. Wang H. Horch M. Gee L. B. Yoda Y. Tanaka Y. Zebger I. Lenz O. Cramer S. P. Chem. Sci. 2015;6:1055–1060. doi: 10.1039/C4SC02982H. [DOI] [PMC free article] [PubMed] [Google Scholar]
- Gilbert-Wilson R. Siebel J. F. Adamska-Venkatesh A. Pham C. C. Reijerse E. Wang H. Cramer S. P. Lubitz W. Rauchfuss T. B. J. Am. Chem. Soc. 2015;137:8998–9005. doi: 10.1021/jacs.5b03270. [DOI] [PMC free article] [PubMed] [Google Scholar]
- Reijerse E. J. Pham C. C. Pelmenschikov V. Gilbert-Wilson R. Adamska-Venkatesh A. Siebel J. F. Gee L. B. Yoda Y. Tamasaku K. Lubitz W. Rauchfuss T. B. Cramer S. P. J. Am. Chem. Soc. 2017;139:4306–4309. doi: 10.1021/jacs.7b00686. [DOI] [PMC free article] [PubMed] [Google Scholar]
- Guo Y. Wang H. Xiao Y. Vogt S. Thauer R. K. Shima S. Volkers P. I. Rauchfuss T. B. Pelmenschikov V. Case D. A. Alp E. E. Sturhahn W. Yoda Y. Cramer S. P. Inorg. Chem. 2008;47:3969–3977. doi: 10.1021/ic701251j. [DOI] [PMC free article] [PubMed] [Google Scholar]
- Preissler J. Wahlefeld S. Lorent C. Teutloff C. Horch M. Lauterbach L. Cramer S. P. Zebger I. Lenz O. Biochim. Biophys. Acta Bioenerg. 2018;1859:8–18. doi: 10.1016/j.bbabio.2017.09.006. [DOI] [PMC free article] [PubMed] [Google Scholar]
- Caserta G. Lorent C. Ciaccafava A. Keck M. Breglia R. Greco C. Limberg C. Hildebrandt P. Cramer S. P. Zebger I. Lenz O. Chem. Sci. 2020;11:5453–5465. doi: 10.1039/D0SC01369B. [DOI] [PMC free article] [PubMed] [Google Scholar]
- Tai H. Higuchi Y. Hirota S. Dalton Trans. 2018;47:4408–4423. doi: 10.1039/C7DT04910B. [DOI] [PubMed] [Google Scholar]
- Kurkin S. George S. J. Thorneley R. N. F. Albracht S. P. J. Biochemistry. 2004;43:6820–6831. doi: 10.1021/bi049854c. [DOI] [PubMed] [Google Scholar]
- Bleijlevens B. van Broekhuizen F. A. De Lacey A. L. Roseboom W. Fernandez V. M. Albracht S. P. J. J. Biol. Inorg Chem. 2004;9:743–752. doi: 10.1007/s00775-004-0570-z. [DOI] [PubMed] [Google Scholar]
- Roncaroli F. Bill E. Friedrich B. Lenz O. Lubitz W. Pandelia M.-E. Chem. Sci. 2015;6:4495–4507. doi: 10.1039/C5SC01560J. [DOI] [PMC free article] [PubMed] [Google Scholar]
- Frielingsdorf S. Fritsch J. Schmidt A. Hammer M. Löwenstein J. Siebert E. Pelmenschikov V. Jaenicke T. Kalms J. Rippers Y. Lendzian F. Zebger I. Teutloff C. Kaupp M. Bittl R. Hildebrandt P. Friedrich B. Lenz O. Scheerer P. Nat. Chem. Biol. 2014;10:378–385. doi: 10.1038/nchembio.1500. [DOI] [PubMed] [Google Scholar]
- van Gastel M. Stein M. Brecht M. Schröder O. Lendzian F. Bittl R. Ogata H. Higuchi Y. Lubitz W. J. Biol. Inorg Chem. 2006;11:41–51. doi: 10.1007/s00775-005-0048-7. [DOI] [PubMed] [Google Scholar]
- Geßner Ch. Trofanchuk O. Kawagoe K. Higuchi Y. Yasuoka N. Lubitz W. Chem. Phys. Lett. 1996;256:518–524. doi: 10.1016/0009-2614(96)00473-3. [DOI] [Google Scholar]
- Fritsch J. Scheerer P. Frielingsdorf S. Kroschinsky S. Friedrich B. Lenz O. Spahn C. M. T. Nature. 2011;479:249–252. doi: 10.1038/nature10505. [DOI] [PubMed] [Google Scholar]
- Krämer T. Kampa M. Lubitz W. van Gastel M. Neese F. ChemBioChem. 2013;14:1898–1905. doi: 10.1002/cbic.201300104. [DOI] [PubMed] [Google Scholar]
- Siegbahn P. E. M. Tye J. W. Hall M. B. Chem. Rev. 2007;107:4414–4435. doi: 10.1021/cr050185y. [DOI] [PubMed] [Google Scholar]
- Tai H. Nishikawa K. Higuchi Y. Mao Z. Hirota S. Angew. Chem., Int. Ed. 2019;58:13285–13290. doi: 10.1002/anie.201904472. [DOI] [PubMed] [Google Scholar]
- Ogata H. Nishikawa K. Lubitz W. Nature. 2015;520:571–574. doi: 10.1038/nature14110. [DOI] [PubMed] [Google Scholar]
- Escorcia A. M. Stein M. Front. Chem. 2018;6:164. doi: 10.3389/fchem.2018.00164. [DOI] [PMC free article] [PubMed] [Google Scholar]
- Dong G. Ryde U. J. Biol. Inorg Chem. 2016;21:383–394. doi: 10.1007/s00775-016-1348-9. [DOI] [PubMed] [Google Scholar]
- Siegbahn P. E. M. Liao R.-Z. ACS Catal. 2020;10:5603–5613. doi: 10.1021/acscatal.0c00396. [DOI] [Google Scholar]
- Breglia R. Greco C. Fantucci P. De Gioia L. Bruschi M. Inorg. Chem. 2019;58:279–293. doi: 10.1021/acs.inorgchem.8b02348. [DOI] [PubMed] [Google Scholar]
- De Lacey A. L. Pardo A. Fernández V. M. Dementin S. Adryanczyk-Perrier G. Hatchikian E. C. Rousset M. J. Biol. Inorg Chem. 2004;9:636–642. doi: 10.1007/s00775-004-0559-7. [DOI] [PubMed] [Google Scholar]
- Fichtner C. Laurich C. Bothe E. Lubitz W. Biochemistry. 2006;45:9706–9716. doi: 10.1021/bi0602462. [DOI] [PubMed] [Google Scholar]
- Lauterbach L. Gee L. B. Pelmenschikov V. Jenney F. E. Kamali S. Yoda Y. Adams M. W. W. Cramer S. P. Dalton Trans. 2016;45:7215–7219. doi: 10.1039/C5DT04760A. [DOI] [PMC free article] [PubMed] [Google Scholar]
- Tai H. Xu L. Inoue S. Nishikawa K. Higuchi Y. Hirota S. Phys. Chem. Chem. Phys. 2016;18:22025–22030. doi: 10.1039/C6CP04628B. [DOI] [PubMed] [Google Scholar]
- Tai H. Xu L. Nishikawa K. Higuchi Y. Hirota S. Chem. Commun. 2017;53:10444–10447. doi: 10.1039/C7CC06061K. [DOI] [PubMed] [Google Scholar]
- Ilina Y. Lorent C. Katz S. Jeoung J. Shima S. Horch M. Zebger I. Dobbek H. Angew. Chem., Int. Ed. 2019;58:18710–18714. doi: 10.1002/anie.201908258. [DOI] [PMC free article] [PubMed] [Google Scholar]
- Stadler C. de Lacey A. L. Montet Y. Volbeda A. Fontecilla-Camps J. C. Conesa J. C. Fernández V. M. Inorg. Chem. 2002;41:4424–4434. doi: 10.1021/ic020016l. [DOI] [PubMed] [Google Scholar]
- Caserta G. Lorent C. Pelmenschikov V. Schoknecht J. Yoda Y. Hildebrandt P. Cramer S. P. Zebger I. Lenz O. ACS Catal. 2020;10:13890–13894. doi: 10.1021/acscatal.0c04079. [DOI] [PMC free article] [PubMed] [Google Scholar]
- Birrell J. A. Pelmenschikov V. Mishra N. Wang H. Yoda Y. Tamasaku K. Rauchfuss T. B. Cramer S. P. Lubitz W. DeBeer S. J. Am. Chem. Soc. 2020;142:222–232. doi: 10.1021/jacs.9b09745. [DOI] [PMC free article] [PubMed] [Google Scholar]
- Lorent C. Katz S. Duan J. Kulka C. J. Caserta G. Teutloff C. Yadav S. Apfel U.-P. Winkler M. Happe T. Horch M. Zebger I. J. Am. Chem. Soc. 2020;142:5493–5497. doi: 10.1021/jacs.9b13075. [DOI] [PubMed] [Google Scholar]
Associated Data
This section collects any data citations, data availability statements, or supplementary materials included in this article.


