

Abstract
The association between socioeconomic disadvantage and increased risk of depressive symptoms in adulthood is well established. We tested 1) the contribution of early exposure to neighborhood socioeconomic disadvantage to later depressive symptoms throughout life, 2) the persistence of the potential association between early exposure and depressive symptoms, and 3) the contributions of other known risk factors to the association. Data were collected from the Young Finns Study, a prospective, population-based 32-year follow-up study that included participants aged 3–18 years at baseline in 1980. Participants were followed up with repeated measurements of depressive symptoms between 1992 and 2012 (n = 2,788) and linked to national grid data on neighborhood disadvantage via residential addresses. We examined the associations in mixed models separately for the 5-, 10-, 15-, and 20-year follow-ups. Living in a disadvantaged neighborhood during childhood and adolescence was associated with a higher level of depressive symptoms in adulthood during all follow-up periods (β = 0.07, P = 0.001) than living in a nondisadvantaged area. Individual adulthood socioeconomic status mediated the associations. These findings suggest that living in a socioeconomically disadvantaged area during childhood and adolescence has a long-lasting negative association with mental health irrespective of family-related risks, partially due to socioeconomic adversity later in life.
Keywords: depression, geographical area, mediation, neighborhood, population-based studies, risk factors
Abbreviations
- CI
confidence interval
- SD
standard deviation
- SES
socioeconomic status
Although the etiology of depression and depressive symptoms is multifactorial (1), adverse environmental exposures in early life are known to play a role (1–4). It is unclear whether early-life experiences predict depression because they are linked to accumulation of risks over a lifetime. Alternatively, childhood and adolescence may be critical periods in life that have irreversible effects on mental health. One psychosocial risk factor that may have long-term effects on mental health outcomes is growing up in a disadvantaged residential neighborhood characterized by poverty, lack of employment opportunities, a high percentage of renters, and reduced economic prospects (5), which, in turn, is related to marginalization (6, 7) and low neighborhood integration (7).
Although many (7–22) but not all (23) previous studies have shown an association between neighborhood socioeconomic factors and depression, a recent meta-analysis did not reveal consistent support for such an association (24). In that meta-analysis, Richardson et al. (24) found an association between neighborhood socioeconomic disadvantage and later depression only in studies with short (<5 years) follow-up times, not in those with longer ones. Most of the studies included in the meta-analysis comprised older adults, and only 1 study was based on participants aged <16 years at baseline (24).
Additionally, there are multiple other family-related psychosocial risk factors in childhood that potentially affect the development of depressive symptoms, including low parental socioeconomic status (SES), parental mental health problems (16–20), parental alcohol use or antisocial behavior (20, 25), unhealthy parental diet (14, 26, 27), a low-quality emotional environment (the degree of acceptance and nurturance) (28), and stressful life events (14, 29). Studies suggest that these family-related psychosocial risk factors confer increased risk of mental or physical health problems (16–22, 25–28), particularly when multiple risk factors accumulate (14, 30, 31).
Depressive symptoms and major depressive disorder have a high risk of recurrence. Recurring episodes have been shown to predict a progressively increasing risk of subsequent episodes, particularly with onset in adolescence (32–35). Furthermore, although the initial onset of a depressive episode may be preceded by stressful life events, later recurrent episodes may be less closely related to such distal stressors due to an individual’s heightened sensitivity to environmental stressors of daily life (36, 37). Thus, factors that increase the risk of early depressive episodes may dramatically increase the risk of developing depression later in life (38, 39). Few studies using prospective data have examined the associations of childhood and adolescent neighborhood disadvantage with the development of later mental health problems (14, 15). Similarly, very few studies have considered the associations of other family-level risk factors with the development of depressive symptoms (12, 13) in addition to individual SES. Understanding how childhood and adolescent risk factors predict change in risk factors over a lifetime is thus of growing scientific and public health relevance, potentially facilitating focused and timely prevention.
We used data from the Young Finns Study, a prospective cohort study, to examine the associations of long-term neighborhood disadvantage during childhood and adolescence with the development of depressive symptoms in adulthood, using multiple follow-up times ranging from 5 years to 20 years. We also considered the associations of accumulated psychosocial adversities in childhood from multiple domains. We also tested the potentially mediating effect of adulthood socioeconomic adversity using causal mediation models (40).
METHODS
Study design and participants
The Young Finns Study (n = 3,596) is an ongoing 5-center population-based cohort study of cardiometabolic risk factors and endpoints in Finnish children and adolescents aged 3–18 years (41). The first data-collection phase was September 15–December 5, 1980. Subsequent data collections were conducted in 1983, 1986, 1989, 1992, 1997, 2001, 2007, and 2012.
In this analysis, we included participants with data on neighborhood socioeconomic disadvantage who attended the first examination in 1980 and provided data on depressive symptoms in at least 1 follow-up examination in 1992, 1997, 2001, 2007, and 2012 (n = 2,354). All participants provided written informed consent, and the study was approved by the local ethics committees.
Measures
Exposure to multiple, not only individual, risk factors has been shown to have more serious developmental consequences, and the use of cumulative risk scores has recently become commonplace in research on childhood psychosocial risk factors (42–46). Such models define binary risk factors as risk versus no risk, which are then summed to form a cumulative score. This approach has the advantage of being parsimonious, making no assumptions about the relative strengths of multiple risk factors or their collinearity, and enables testing of additive associations over a range of exposures (47). In the current study, we built both a neighborhood socioeconomic disadvantage score and a childhood psychosocial risk score in a similar way, based on previous studies (14, 30, 31, 48, 49).
Annual data on neighborhood socioeconomic disadvantage were obtained from Statistics Finland. This national database assigns a neighborhood socioeconomic disadvantage score to each Finnish resident in 250-m grids with 10 or more residents. The score for each grid is derived from the proportion of adults with only a primary education, the unemployment rate, and the proportion of people living in rented housing. Each of the 3 variables was standardized as a z score with a mean of 0 and a standard deviation of 1 (48). The overall socioeconomic disadvantage score for each neighborhood was the mean value across all 3 z scores, with the national mean being 0 and the standard deviation being 1. A higher score indicates greater neighborhood socioeconomic disadvantage. Thus, each participant in our study was assigned a “neighborhood disadvantage” score based on the overall socioeconomic disadvantage score of his or her place of residence. We calculated the participants’ exposure to neighborhood socioeconomic disadvantage in childhood and adolescence (ages 3–18 years) by summing the annual residential time-weighted disadvantage z scores at each address between the ages of 3 and 18 years. Thus, each participant in our study was assigned a “neighborhood disadvantage” score based on the cumulative socioeconomic disadvantage score over the course of his or her residential history in childhood. We used the national mean of 0 as the cutoff for the distribution of the z scores to create 2 groups: low neighborhood disadvantage (≤0) and high neighborhood disadvantage (>0). We additionally used recent neighborhood socioeconomic disadvantage scores, which were calculated using a 5-year time-dependent cumulative disadvantage score prior to each measurement of depressive symptoms in adulthood.
Family-related psychosocial risks in childhood
As in previous studies (14, 30), we created 4 separate childhood risk clusters pertaining to 1) socioeconomic factors, 2) psychoemotional factors, 3) life events, and 4) parental lifestyle. These were all measured as parental reports in 1980. Scores for the risk domain components (0 = no risk, 1 = risk) were summed. The cutoff points were defined on the basis of theoretical and empirical knowledge, since there are no clinically established thresholds for some of the risk factors (14). We calculated a total cumulative risk score by summing scores for the separate risk domains.
Socioeconomic risk cluster.
The following 4 familial components were included in the socioeconomic risk cluster (both parents): low education, manual occupation, low income (lowest 25%), and unsteady employment history (any of the following: periods of unemployment, long-term sickness absence, or receipt of disability benefits) (30). The cutoff point for the overall socioeconomic risk domain was ≥3.
Psychoemotional risk factors.
Psychoemotional factors (both parents) were mental health status, child-rearing style, life satisfaction, and alcohol abuse. Mental health status was inquired about as, “Have you ever been diagnosed by a health professional as having a mental health problem?”. A response of “yes” was assigned 1 point and “no” was assigned 0 points. Child-rearing style and life satisfaction were measured using a 5-point scale derived from the Operation Family Study (50); a response indicating dissatisfaction (i.e., 4 or 5 on a 5-point scale) with any of the 3 life roles was classified as high risk. Parental heavy alcohol use was measured as the frequency of heavy drinking (number of occasions per year), and the response “once a week” indicated high risk. The cutoff point for high risk in the psychoemotional domain was ≥1.
Stressful life events.
Stressful life events included moving to a new home, changing schools, a divorce in the family, the death of a significant person (parents, siblings), and hospitalization, serious illness, or both in the family. The presence of each event was assigned 1 point. The cutoff point for high risk was ≥1 events.
Parental lifestyle.
Parental lifestyle behaviors included body mass index (weight (kg)/height (m)2), level of regular physical activity, and smoking status. The following cutoff points were used to indicate a high risk level for each category: mother, father, or both was obese (body mass index ≥30); mother, father, or both was a current smoker; and mother, father, or both reported no regular physical activity. The cutoff point for high risk was ≥3 risk factors.
Cumulative risk score.
A cumulative risk score was created by adding together scores for all of the individual risk domains (range, 0–4). A detailed description of the construction of the childhood psychosocial risk score, including information based on the cutoff points and the composition of the risk domains, has been published previously (14). Details are also presented in the Web Appendix (available at https://academic.oup.com/aje) and Web Table 1.
Depressive symptoms
Depressive symptoms were assessed in 1992 at ages 15–30 years and in 1997, 2001, 2007, and 2012 using a modified version of the Beck Depression Inventory (50, 51). The participants were asked to rate 21 items (e.g., “I often feel sad”) on a 5-point scale ranging from “totally disagree” (1) to “totally agree” (5). Cronbach’s α values for the scale ranged from 0.89 to 0.92. In the original version of the Beck Depression Inventory, subjects were asked to choose between 4 alternative descriptions of 21 items—for instance, 0 (“I do not feel sad”), 1 (“I often feel sad”), 2 (“I am sad all the time and I cannot snap out of it”), or 3 (“I am so sad or unhappy that I cannot stand it”). In the present study, the participants were asked to rate the second original response option (e.g., “I often feel sad”) on a 5-point Likert scale ranging from “totally disagree” (1) to “totally agree” (5). These second response options were selected because they more accurately measure depressive symptoms in the general population (52). The mean values of the scores from the 21 items measured at each wave were used as the outcome in the analyses (range, 1–5).
Individual socioeconomic adversity in adulthood
Indicators of individual socioeconomic adversity in adulthood were the participant’s highest attained level of education (in years), mean annual income (continuous variable), and unemployment during follow-up from 1992 to 2012 (yes or no). Each indicator was standardized (mean = 0, standard deviation = 1). The only exception was unemployment, which was coded as 1 for a history of unemployment and 0 otherwise. The overall score for adulthood individual SES was the mean of the 3 indicators; a lower score indicates less individual socioeconomic adversity.
Statistical analyses
The data for the main analyses were structured such that each participant contributed 1–5 person-observations to the data set, depending on the number of study phases available for that individual. This study design allowed us to use all available data and permitted consideration of the nonindependence of repeated measurements (person-observations) in the same individual. The data were analyzed using multilevel linear regression, specifically the random-intercept model (i.e., a mixed-effects model) (53).
The analyses were conducted in 2 stages. First, we examined how depressive symptoms changed over time and whether the trajectories of depressive symptoms differed according to childhood neighborhood socioeconomic disadvantage group using 4 different follow-up time intervals. We conducted 4 identical series of repeated mixed-model analyses with 2, 3, 4, and finally all 5 measurement points: first, baseline (T0) and the 5-year follow-up (T5); second, 3 time points (T0, T5, and the 10-year follow-up (T10)); third, 4 time points (T0, T5, T10, and the 15-year follow-up (T15)); and fourth, 5 time points (T0, T5, T10, T15, and the 20-year follow-up (T20)). These models adjusted for age, sex, and family-related psychosocial risk in childhood. We also examined the associations when results were adjusted for the most recent neighborhood disadvantage score (the previous 5-year period in each data collection phase of depressive symptoms in adulthood).
Second, we examined the potentially causal mediating effect of adulthood socioeconomic adversity in the association between childhood neighborhood disadvantage and adulthood depressive symptoms using the approach developed by Imai et al. (40, 54). This was based on the counterfactual framework and nonparametric identification based on the sequential ignorability assumption (40, 54–57). The effects were separated into natural direct effects, natural indirect effects, and total effects. The natural direct effect provides an estimate for the association between childhood neighborhood disadvantage and depressive symptoms in a scenario where levels of exposure to the mediator are similar among persons exposed to high childhood neighborhood disadvantage and those not exposed. The natural indirect effect refers to the excess risk of depressive symptoms among persons exposed to high childhood neighborhood disadvantage due to their neighborhood disadvantage in adulthood. For total effects, both natural direct and indirect effects are considered to estimate the association between childhood neighborhood disadvantage and depressive symptoms. The proportion of the total effect mediated is given as a percentage for the mediator.
Data analysis was performed with R 3.5.1 (R Foundation for Statistical Computing, Vienna, Austria), the “lme4” package for the multilevel regression procedure, and the “mediation” package for mediation analyses following the procedure for implementing the mediation function in multilevel data (57, 58). We used linear mixed modeling, since we used the continuous mean depressive symptoms score as an outcome.
RESULTS
Characteristics of the study participants (Table 1) show that, on average, the level of depressive symptoms declined during follow-up (Figure 1). There were no differences in these trends between the neighborhood disadvantage groups (test of time interaction: P = 0.381). In the model that adjusted for age and sex (Table 2), exposure to childhood neighborhood disadvantage was associated with a higher level of depressive symptoms at the 5-, 10-, 15-, and 20-year follow-ups (β = 0.07, β = 0.08, β = 0.08, and β = 0.08 (P = 0.009, P = 0.001, P < 0.001, and P < 0.001), respectively) (Figure 1). The associations between neighborhood area disadvantage and depressive symptoms (Tables 2 and 3) were somewhat attenuated when the models additionally adjusted for family-related psychosocial risk factors in childhood. The attenuation was most evident at the first follow-up. When the models adjusted for neighborhood disadvantage in adulthood during the 5 years preceding each measurement of depressive symptoms, the associations between childhood neighborhood disadvantage and depressive symptoms remained essentially the same (Table 2).
Table 1.
Baseline Characteristics of a Sample of Participants (n = 1,974–2,788) From the Young Finns Study, 1980
| Level of Neighborhood Disadvantage a During Childhoodb | |||||||
|---|---|---|---|---|---|---|---|
| Low | High | ||||||
| Variable | Mean (SD) | No. | % | Mean (SD) | No. | % | P Value |
| Sex | |||||||
| Female | 816 | 51.3 | 614 | 51.3 | 0.966 | ||
| Male | 776 | 48.7 | 582 | 48.7 | |||
| Age at baseline (1992), years | 21.9 (5.0) | 22.0 (4.8) | 0.595 | ||||
| Neighborhood disadvantage during last 5 years at baseline (1992) (high = 1, low = 0) | −0.4 (0.5) | 0.4 (0.7) | <0.001 | ||||
| Depressive symptoms score at baseline (1992) | 2.1 (0.6) | 2.2 (0.6) | 0.018 | ||||
| No. of childhood psychosocial risk factors | |||||||
| 0 | 735 | 60.8 | 397 | 52.0 | <0.001 | ||
| 1 | 377 | 31.2 | 255 | 33.3 | |||
| 2 | 77 | 6.4 | 98 | 12.8 | |||
| 3 | 20 | 1.6 | 15 | 1.9 | |||
| Adulthood socioeconomic adversity | <0.001 | ||||||
| Low | 1,387 | 91.4 | 819 | 77.0 | |||
| High | 131 | 8.6 | 244 | 23.0 | |||
Abbreviation: SD, standard deviation.
a Neighborhood disadvantage higher (>0) or lower (≤0) than the national average (see text).
b Ages 3–18 years.
Figure 1.
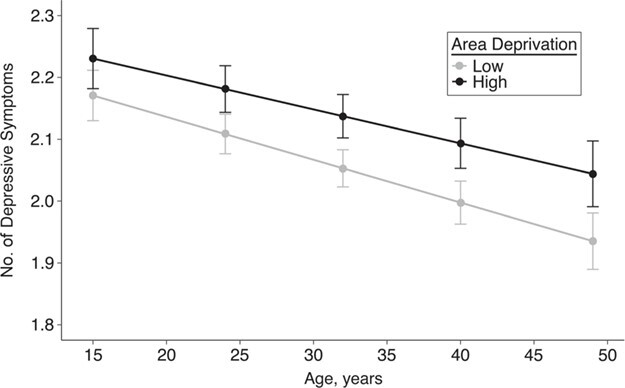
Reported numbers of depressive symptoms at different ages, by childhood neighborhood disadvantage, Young Finns Study, 1980–2012. Area deprivation was measured as a level of neighborhood disadvantage higher (>0) or lower (≤0) than the national average (see text). Bars, 95% confidence intervals (CIs).
Table 2.
Association Between Childhood Neighborhood Disadvantage and Development of Depressive Symptoms, by Follow-up Time (Mixed-Effects Models), Young Finns Study, 1980–2012
| Model and Predictor | 5-Year Follow-up | 10-Year Follow-up | 15-Year Follow-up | 20-Year Follow-up | ||||||||
|---|---|---|---|---|---|---|---|---|---|---|---|---|
| β | 95% CI | P Value | β | 95% CI | P Value | β | 95% CI | P Value | β | 95% CI | P Value | |
| Model 1a | ||||||||||||
| Neighborhood disadvantage during childhood (yes = 1, no = 0) | 0.07 | 0.02, 0.12 | 0.009 | 0.08 | 0.03, 0.13 | 0.001 | 0.08 | 0.04, 0.13 | <0.001 | 0.08 | 0.03, 0.12 | 0.001 |
| Age (per year) | −0.01 | −0.01, 0.00 | 0.002 | −0.01 | −0.01, −0.01 | <0.001 | −0.01 | −0.01, −0.01 | <0.001 | −0.01 | −0.01, −0.01 | <0.001 |
| Male sex (male = 1, female = 0) | −0.19 | −0.24, −0.14 | <0.001 | −0.19 | −0.23, −0.14 | <0.001 | −0.17 | −0.21, −0.12 | <0.001 | −0.15 | −0.19, −0.10 | <0.001 |
| Model 2b | ||||||||||||
| Neighborhood disadvantage during childhood (yes = 1, no = 0) | 0.05 | −0.01, 0.11 | 0.100 | 0.06 | 0.00, 0.11 | 0.049 | 0.06 | 0.01, 0.12 | 0.026 | 0.06 | 0.00, 0.11 | 0.044 |
| Age (per year) | −0.01 | −0.01, 0.00 | <0.001 | −0.01 | −0.01, −0.01 | <0.001 | −0.01 | −0.01, −0.01 | <0.001 | −0.01 | −0.01, −0.01 | <0.001 |
| Male sex (male = 1, female = 0) | −0.19 | −0.25, −0.13 | <0.001 | −0.19 | −0.25, −0.14 | <0.001 | −0.17 | −0.23, −0.12 | <0.001 | −0.15 | −0.21, −0.10 | <0.001 |
| No. of childhood psychosocial risk factors | 0.07 | 0.03, 0.11 | 0.001 | 0.07 | 0.03, 0.11 | <0.001 | 0.06 | 0.02, 0.10 | 0.001 | 0.06 | 0.03, 0.10 | 0.001 |
| Model 3c | ||||||||||||
| Neighborhood disadvantage during childhood (yes = 1, no = 0) | 0.04 | −0.01, 0.10 | 0.135 | 0.07 | 0.02, 0.12 | 0.010 | 0.08 | 0.03, 0.12 | 0.002 | 0.07 | 0.03, 0.12 | 0.002 |
| Age (per year) | −0.01 | −0.01, 0.00 | 0.001 | −0.01 | −0.01, −0.01 | <0.001 | −0.01 | −0.01, 0.00 | <0.001 | −0.01 | −0.01, 0.00 | <0.001 |
| Male sex (male = 1, female =0) | −0.19 | −0.24, −0.14 | <0.001 | −0.18 | −0.23, −0.13 | <0.001 | −0.17 | −0.21, −0.12 | <0.001 | −0.15 | −0.19, −0.10 | <0.001 |
| Neighborhood disadvantage during last 5 years (yes = 1, no = 0) | 0.05 | 0.01, 0.08 | 0.016 | 0.03 | 0.00, 0.06 | 0.044 | 0.02 | 0.00, 0.05 | 0.053 | 0.02 | 0.00, 0.04 | 0.061 |
Abbreviation: CI, confidence interval.
a Results were adjusted for age and sex.
b Results were adjusted for age, sex, and number of childhood psychosocial risk factors.
c Results were adjusted for age, sex, and neighborhood disadvantage during the last 5 years.
Table 3.
Characteristics of Models Used to Analyze the Association Between Neighborhood Disadvantage in Childhood and Depressive Symptoms, Young Finns Study, 1980–2012
|
Model and Follow-up
Time, years |

|
Τ 00 | ICC |
No. of Observations |
Marginal R2 |
Conditional R2 |
|---|---|---|---|---|---|---|
| Model 1a | ||||||
| 5 | 0.16 | 0.24 | 0.61 | 3,423 | 0.027 | 0.618 |
| 10 | 0.17 | 0.24 | 0.59 | 5,010 | 0.030 | 0.599 |
| 15 | 0.18 | 0.25 | 0.58 | 6,570 | 0.026 | 0.591 |
| 20 | 0.18 | 0.25 | 0.58 | 7,897 | 0.022 | 0.590 |
| Model 2b | ||||||
| 5 | 0.16 | 0.23 | 0.59 | 2,481 | 0.034 | 0.603 |
| 10 | 0.17 | 0.23 | 0.57 | 3,623 | 0.038 | 0.590 |
| 15 | 0.18 | 0.23 | 0.57 | 4,748 | 0.030 | 0.585 |
| 20 | 0.18 | 0.24 | 0.57 | 5,712 | 0.026 | 0.580 |
| Model 3c | ||||||
| 5 | 0.16 | 0.24 | 0.61 | 3,299 | 0.028 | 0.622 |
| 10 | 0.17 | 0.24 | 0.59 | 4,817 | 0.030 | 0.598 |
| 15 | 0.18 | 0.25 | 0.58 | 6,272 | 0.026 | 0.591 |
| 20 | 0.18 | 0.25 | 0.58 | 7,493 | 0.022 | 0.589 |
Abbreviation: ICC, intraclass correlation coefficient.
a Results were adjusted for age and sex.
b Results were adjusted for age, sex, and number of childhood psychosocial risk factors.
c Results were adjusted for age, sex, and neighborhood disadvantage during the last 5 years.
To detect whether the relatively large age range in our cohort would affect our results, we divided the participants into 2 age groups (3–9 years and 12–18 years; there were no participants aged 10–11 years at that time) and tested the effect of the area disadvantage × age group interaction on depressive symptoms in each follow-up phase. No interaction effects were statistically significant (P = 0.13–0.26).
About one-third (39%) of the association between childhood neighborhood disadvantage and depressive symptoms was mediated through adulthood socioeconomic adversity (Figure 2). There was no interaction between adulthood socioeconomic adversity (the mediator) and childhood neighborhood disadvantage (the exposure) in predicting depressive symptoms (P = 0.38).
Figure 2.
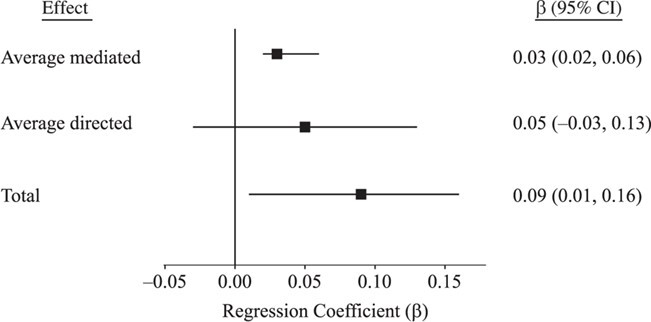
Mediation effect of socioeconomic position in adulthood in the association between childhood neighborhood disadvantage and depressive symptoms, Young Finns Study, 1980–2012. Bars, 95% confidence intervals (CIs).
In additional analyses, we first imputed 5 different data sets using predictive mean matching as our imputation method and repeating the age- and sex-adjusted analyses in the model with the longest possible follow-up time. The results were very similar to those obtained using complete-case data (β = 0.06–0.08; all P values <0.001) (Web Table 2). We also examined the association between neighborhood disadvantage and depressive symptoms over the whole follow-up period including all measurement points, using inverse probability of censoring weights to weight the models for missingness. This analysis included all confounders; results are shown in Web Table 3. Overall, the results remained very similar, with a slight attenuation when results were adjusted for neighborhood disadvantage during the past 5 years. We also conducted the analyses using continuous neighborhood socioeconomic disadvantage score. Compared with the dichotomous score, the regression coefficients were slightly smaller (β = 0.05–0.06) but nevertheless significant (P = 0.006–0.001). Finally, we repeated the analyses using continuous childhood cumulative psychosocial risk score (i.e., standardized sum score). These results were hardly different from those based on the sum score of dichotomized individual risk factors (Web Table 4).
DISCUSSION
In this prospective nationwide cohort study, we evaluated the associations of cumulative neighborhood disadvantage in childhood and adolescence with the occurrence of depressive symptoms over a 20-year period from young adulthood to middle age. We observed that participants who lived in disadvantaged areas during childhood and adolescence were at increased risk of experiencing depressive symptoms in adulthood. This association was independent of the childhood family’s socioeconomic position and other risk factors and more recent neighborhood disadvantage. This finding is in line with previous studies suggesting that childhood and adolescence may be critical periods for later development of depressive symptoms (16–22, 25–28). This finding points to a need for prevention efforts focusing on children’s living circumstances as part of strategies to reduce the burden of depression in the population.
We also observed that the association between neighborhood disadvantage in early years and later depressive symptoms was mediated through the participants’ own socioeconomic position in adulthood. Thus, it seems that neighborhood disadvantage in childhood has an impact on obtained SES in adulthood that in turn associates with long-term development of depressive symptoms, suggesting that adulthood SES is probably one of the more immediate causal factors for depressive symptoms.
Previous studies have yielded mixed evidence on whether growing up in a disadvantaged residential neighborhood is associated with an increased risk of later depression. After performing a meta-analysis, Richardson et al. (24) concluded that only studies with less than 5 years of follow-up showed an association between disadvantaged neighborhoods and depression; studies with longer follow-up times did not. To the best of our knowledge, the present study is one of the first to have used neighborhood information collected over a lifetime, from early childhood to adolescence, to assess the association of neighborhood disadvantage with multiple measures of depressive symptoms spanning 20 years.
The causality between neighborhood factors and health-related outcomes such as depression has recently been questioned (59), as the associations are not expected to be strong. However, most previous studies used shorter follow-up times or larger geographical areas when measuring neighborhood disadvantage than this study (60, 61). A recent twin study which demonstrated that neighborhood disadvantage increases the genetic risk of depression also supports this notion (62).
Our results offer insights into the role of environmental exposures in the development of depressive symptoms. The findings suggest that there may be an association of childhood physical and social environment with depression that is mediated not only through the close family environment and social relationships but also through other pathways. These include proximal and distal environments that increase the risk of depressive symptoms.
The strengths of our study are its prospective design and its exceptionally long follow-up period (41). We also used an objective measurement of neighborhood socioeconomic disadvantage that was categorized on the basis of national means, repeat data (5 data collection phases) on depressive symptoms, and various other risk factors. This was based on a denser 250-m estimation of disadvantage than was used in most previous studies. We were also able to use multiple repeated measurements of neighborhood disadvantage in respondents’ childhood and adolescent phases.
There are some limitations that should be considered. This was an observational study, and although we used a longitudinal study design, the possibility of making causal inferences based on the associations is limited. The sample size was acceptable but did not allow for an analysis of the effect of possible subgroup differences on the associations with neighborhood socioeconomic disadvantage, such as differences by sex, age group, or size of area unit. The measurement of neighborhood socioeconomic disadvantage included education, unemployment, and home ownership but did not consider other potentially important characteristics such as income and single-parent households.
Sample attrition between baseline and the last measurement of depressive symptoms, taken 32 years later, was almost 40%. This is a relatively minor limitation because we used repeated-measures mixed modeling, which takes information from any data collection phase. Furthermore, although the differences between the baseline population and those reporting depressive symptoms in the last phase of data collection were small in terms of demographic characteristics and neighborhood disadvantage, sample attrition may have led to under- or overestimation of associations. The study was performed in a single country with a racially homogenous population; this may restrict the generalizability of the findings. Finland has relatively low levels of income inequality and wealth inequality, and thus studies in less socioeconomically egalitarian societies are warranted.
Depressive symptoms were measured using self-reports; diagnoses made by professionals using clinical interviews would have been preferable. However, the validity of the Beck Depression Inventory–Revised has been shown to be good (52, 63, 64), and self-reported mental health problems have been shown to have similar developmental patterns as clinical measures (65). In our analyses, we did not consider clustering of individuals within neighborhoods. Before adulthood, the participants with data on neighborhood disadvantage had lived in 3,060 different neighborhood grids and had moved, on average, 1.81 times (range, 1–15); the average total population per grid was 207, and there were 0.91 participants per grid, on average. In adulthood, they had lived in 9,540 different grids and had moved, on average, 7.03 times (range, 1–29); the average total population per grid was 175, and there were 0.29 participants per grid, on average. Because individuals’ moving histories were independent of the moving histories of the other participants, clustering of individuals within neighborhoods was extremely rare; thus, spatial autocorrelation is an unlikely source of bias in these data. We were unable to calculate age-related neighborhood risk scores, but we do not consider that a serious limitation. The neighborhood disadvantage measure represents a general marker of environmental risk factors for all of the residents in that neighborhood.
Although there are multiple advantages in combining individual familial psychosocial risk factors into composites (parsimony and lack of assumptions about relative strengths or collinearity), it is possible that different risk factors may be differentially important, and some may be collinear. Thus, in future studies, researchers may additionally analyze the associations of multiple individual risk factors separately when analyzing associations between childhood psychosocial risks and health outcomes.
Further research using interventions or natural experiments is needed to examine whether improvements in both neighborhood and familial risk factors would decrease levels of depressive symptoms and other mental health problems. For example, it would be important to examine whether active interventions could prevent any area from becoming disadvantaged. Implementing such policies may be difficult, but one example is the spatial social mixing policy applied in some larger cities in Nordic countries, which have been shown to be effective in preventing spatial social segregation (66). This means scattering municipal rental housing among other types of housing, thereby preventing the formation of large areas with primarily rented flats. It would be important to examine whether such a mixing policy in neighborhood facilities might help prevent stress and a negative atmosphere in disadvantaged neighborhoods.
Our results suggest that neighborhood socioeconomic disadvantage is associated with later depressive symptoms and that the association is mediated through SES later in life. Thus, long-term political decisions aimed at preventing large differences in disadvantage between residential areas may be important to prevent long-term mental health problems.
Supplementary Material
ACKNOWLEDGMENTS
Author affiliations: Department of Psychology and Logopedics, Faculty of Medicine, University of Helsinki, Helsinki, Finland (Marko Elovainio, Christian Hakulinen, Laura Pulkki-Råback, Jari Lipsanen, Liisa Keltikangas-Järvinen); National Institute for Health and Welfare, Helsinki, Finland (Marko Elovainio); Centre for Population Health Research, University of Turku and Turku University Hospital, Turku, Finland (Jussi Vahtera, Jaana Pentti, Jorma Viikari, Olli Raitakari); Department of Public Health, Faculty of Medicine, University of Turku, Turku, Finland (Jussi Vahtera, Jaana Pentti); Research Centre of Applied and Preventive Cardiovascular Medicine, University of Turku, Turku, Finland (Jorma Viikari, Olli Raitakari); Department of Clinical Physiology and Nuclear Medicine, Turku University Hospital, Turku, Finland (Jorma Viikari, Olli Raitakari); School of Educational Sciences and Psychology, University of Eastern Finland, Joensuu, Finland (Marianna Virtanen); Department of Epidemiology and Public Health, Faculty of Population Health Sciences, University College London, London, United Kingdom (Mika Kivimäki); Clinicum Unit, Faculty of Medicine, University of Helsinki, Helsinki, Finland (Mika Kivimäki); Department of Clinical Physiology, Tampere University Hospital, Tampere, Finland (Mika Kähönen); Finnish Cardiovascular Research Center–Tampere, Faculty of Medicine and Health Technology, Tampere University, Tampere, Finland (Mika Kähönen, Terho Lehtimäki); and Department of Clinical Chemistry, Fimlab Laboratories, Tampere, Finland (Terho Lehtimäki).
This work was funded by the Academy of Finland (grants 329224 (M.E., M.V.), 310591 (C.H.), 311492 (M.Ki.), and 329240 (Ju.V.)), NordForsk (grant 75021 (M.Ki.)), the Medical Research Council (grant S011676/1 (M.Ki.)), the US National Institute on Aging (grants R01AG056477 and R01AG062553 (M.Ki.)), and the Helsinki Institute of Life Science (grant H970 (M.Ki.)). The Young Finns Study has been financially supported by the Academy of Finland (grants 322098, 286284, 134309 Eye, 126925, 121584, 124282, 129378 Salve, 117787 Gendi, and 41071 Skidi); the Social Insurance Institution of Finland; Competitive State Research Financing of the Expert Responsibility Area of Kuopio, Tampere, and Turku University Hospitals (grant X51001); the Juho Vainio Foundation; the Paavo Nurmi Foundation; the Finnish Foundation for Cardiovascular Research; the Finnish Cultural Foundation; the Sigrid Juselius Foundation; the Tampere Tuberculosis Foundation; the Emil Aaltonen Foundation; the Yrjö Jahnsson Foundation; the Signe and Ane Gyllenberg Foundation; the Diabetes Research Foundation of the Finnish Diabetes Association; the European Commission (European Union Horizon 2020 grant 755320 for TAXINOMISIS); the European Research Council (grant 742927 for the MULTIEPIGEN Project); and the Tampere University Hospital Supporting Foundation.
Conflict of interest: none declared.
REFERENCES
- 1. Kendler KS, Kessler RC, Walters EE, et al. Stressful life events, genetic liability, and onset of an episode of major depression in women. Am J Psychiatry. 1995;152(6):833–842. [DOI] [PubMed] [Google Scholar]
- 2. Kendler KS, Gatz M, Gardner CO, et al. Personality and major depression: a Swedish longitudinal, population-based twin study. Arch Gen Psychiatry. 2006;63(10):1113–1120. [DOI] [PubMed] [Google Scholar]
- 3. Kendler KS, Neale MC, Kessler RC, et al. Major depression and phobias: the genetic and environmental sources of comorbidity. Psychol Med. 1993;23(2):361–371. [DOI] [PubMed] [Google Scholar]
- 4. Kendler KS, Gardner CO, Prescott CA. Toward a comprehensive developmental model for major depression in women. Am J Psychiatry. 2002;159(7):1133–1145. [DOI] [PubMed] [Google Scholar]
- 5. Browning CR, Cagney KA. Neighborhood structural disadvantage, collective efficacy, and self-rated physical health in an urban setting. J Health Soc Behav. 2002;43(4):383–399. [PubMed] [Google Scholar]
- 6. Ross CE, Jang SJ. Neighborhood disorder, fear, and mistrust: the buffering role of social ties with neighbors. Am J Community Psychol. 2000;28(4):401–420. [DOI] [PubMed] [Google Scholar]
- 7. Ross CE, Mirowsky J. Neighborhood disadvantage, disorder, and health. J Health Soc Behav. 2001;42(3):258–276. [PubMed] [Google Scholar]
- 8. Mair C, Diez Roux AV, Galea S. Are neighbourhood characteristics associated with depressive symptoms? A review of evidence. J Epidemiol Community Health. 2008;62(11):940–U21. [DOI] [PubMed] [Google Scholar]
- 9. Silver E, Mulvey EP, Swanson JW. Neighborhood structural characteristics and mental disorder: Faris and Dunham revisited. Soc Sci Med. 2002;55(8):1457–1470. [DOI] [PubMed] [Google Scholar]
- 10. Schneiders J, Drukker M, van der Ende J, et al. Neighbourhood socioeconomic disadvantage and behavioural problems from late childhood into early adolescence. J Epidemiol Community Health. 2003;57(9):699–703. [DOI] [PMC free article] [PubMed] [Google Scholar]
- 11. Haines VA, Beggs JJ, Hurlbert JS. Neighborhood disadvantage, network social capital, and depressive symptoms. J Health Soc Behav. 2011;52(1):58–73. [DOI] [PubMed] [Google Scholar]
- 12. Ross CE. Neighborhood disadvantage and adult depression. J Health Soc Behav. 2000;41(2):177–187. [Google Scholar]
- 13. Hybels CF, Blazer DG, Pieper CF, et al. Sociodemographic characteristics of the neighborhood and depressive symptoms in older adults: using multilevel modeling in geriatric psychiatry. Am J Ger Psychiatry. 2006;14(6):498–506. [DOI] [PubMed] [Google Scholar]
- 14. Elovainio M, Pulkki-Råback L, Hakulinen C, et al. Childhood and adolescence risk factors and development of depressive symptoms: the 32-year prospective Young Finns Follow-up Study. J Epidemiol Community Health. 2015;69(11):1109–1117. [DOI] [PubMed] [Google Scholar]
- 15. Lemstra M, Neudorf C, D’Arcy C, et al. A systematic review of depressed mood and anxiety by SES in youth aged 10–15 years. Can J Public Health. 2008;99(2):125–129. [DOI] [PMC free article] [PubMed] [Google Scholar]
- 16. Ramchandani PG, Murphy SE. Parental depression and the challenge of preventing mental illness in children. Br J Psychiatry. 2013;202(2):84–85. [DOI] [PubMed] [Google Scholar]
- 17. Hay DF, Pawlby S, Waters CS, et al. Antepartum and postpartum exposure to maternal depression: different effects on different adolescent outcomes. J Child Psychol Psychiatry. 2008;49(10):1079–1088. [DOI] [PubMed] [Google Scholar]
- 18. Pawlby S, Hay D, Sharp D, et al. Antenatal depression and offspring psychopathology: the influence of childhood maltreatment. Br J Psychiatry. 2011;199(2):106–112. [DOI] [PubMed] [Google Scholar]
- 19. Pawlby S, Sharp D, Hay D, et al. Postnatal depression and child outcome at 11 years: the importance of accurate diagnosis. J Affect Disord. 2008;107(1–3):241–245. [DOI] [PubMed] [Google Scholar]
- 20. Sellers R, Collishaw S, Rice F, et al. Risk of psychopathology in adolescent offspring of mothers with psychopathology and recurrent depression. Br J Psychiatry. 2013;202(2):108–114. [DOI] [PubMed] [Google Scholar]
- 21. Gluckman PD, Hanson MA, Spencer HG, et al. Environmental influences during development and their later consequences for health and disease: implications for the interpretation of empirical studies. Proc Biol Sci. 2005;272(1564):671–677. [DOI] [PMC free article] [PubMed] [Google Scholar]
- 22. Gluckman PD, Hanson MA, Beedle AS. Early life events and their consequences for later disease: a life history and evolutionary perspective. Am J Hum Biol. 2007;19(1):1–19. [DOI] [PubMed] [Google Scholar]
- 23. Goldstein RB, Lee AK, Haynie DL, et al. Neighbourhood disadvantage and depressive symptoms among adolescents followed into emerging adulthood. J Epidemiol Community Health. 2019;73(7):590–597. [DOI] [PMC free article] [PubMed] [Google Scholar]
- 24. Richardson R, Westley T, Gariépy G, et al. Neighborhood socioeconomic conditions and depression: a systematic review and meta-analysis. Soc Psychiatry Psychiatr Epidemiol. 2015;50(11):1641–1656. [DOI] [PubMed] [Google Scholar]
- 25. Mars B, Collishaw S, Smith D, et al. Offspring of parents with recurrent depression: which features of parent depression index risk for offspring psychopathology? J Affect Disord. 2012;136(1-2):44–53. [DOI] [PubMed] [Google Scholar]
- 26. Gale CR, Jiang B, Robinson SA, et al. Maternal diet during pregnancy and carotid intima-media thickness in children. Arterioscler Thromb Vasc Biol. 2006;26(8):1877–1882. [DOI] [PubMed] [Google Scholar]
- 27. Gale CR, Robinson SM, Godfrey KM, et al. Oily fish intake during pregnancy—association with lower hyperactivity but not with higher full-scale IQ in offspring. J Child Psychol Psychiatry. 2008;49(10):1061–1068. [DOI] [PubMed] [Google Scholar]
- 28. Rutter M. Nature, nurture, and development: from evangelism through science toward policy and practice. Child Dev. 2002;73(1):1–21. [DOI] [PubMed] [Google Scholar]
- 29. Kendler KS, Hettema JM, Butera F, et al. Life event dimensions of loss, humiliation, entrapment, and danger in the prediction of onsets of major depression and generalized anxiety. Arch Gen Psychiatry. 2003;60(8):789–796. [DOI] [PubMed] [Google Scholar]
- 30. Hakulinen C, Pulkki-Råback L, Elovainio M, et al. Childhood psychosocial cumulative risks and carotid intima-media thickness in adulthood: the Cardiovascular Risk in Young Finns Study. Psychosom Med. 2016;78(2):171–181. [DOI] [PMC free article] [PubMed] [Google Scholar]
- 31. Pulkki-Råback L, Elovainio M, Hakulinen C, et al. Cumulative effect of psychosocial factors in youth on ideal cardiovascular health in adulthood. The Cardiovascular Risk in Young Finns Study. Circulation. 2015;131(3):245–253. [DOI] [PubMed] [Google Scholar]
- 32. American Psychiatric Association . Diagnostic and Statistical Manual of Mental Disorders. 4th ed. Washington, DC: American Psychiatric Association; 2000. [Google Scholar]
- 33. Hermens ML, van Hout HP, Terluin B, et al. The prognosis of minor depression in the general population: a systematic review. Gen Hosp Psychiatry. 2004;26(6):453–462. [DOI] [PubMed] [Google Scholar]
- 34. Kessler RC, Zhao S, Blazer DG, et al. Prevalence, correlates, and course of minor depression and major depression in the National Comorbidity Survey. J Affect Disord. 1997;45(1-2):19–30. [DOI] [PubMed] [Google Scholar]
- 35. Burcusa SL, Iacono WG. Risk for recurrence in depression. Clin Psychol Rev. 2007;27(8):959–985. [DOI] [PMC free article] [PubMed] [Google Scholar]
- 36. Monroe SM, Harkness KL. Life stress, the “kindling” hypothesis, and the recurrence of depression: considerations from a life stress perspective. Psychol Rev. 2005;112(2):417–445. [DOI] [PubMed] [Google Scholar]
- 37. Kim-Cohen J, Caspi A, Moffitt TE, et al. Prior juvenile diagnoses in adults with mental disorder: developmental follow-back of a prospective-longitudinal cohort. Arch Gen Psychiatry. 2003;60(7):709–717. [DOI] [PubMed] [Google Scholar]
- 38. Colman I, Ataullahjan A. Life course perspectives on the epidemiology of depression. Can J Psychiatry. 2010;55(10):622–632. [DOI] [PubMed] [Google Scholar]
- 39. Messer LC, Boone-Heinonen J, Mponwane L, et al. Developmental programming: priming disease susceptibility for subsequent generations. Curr Epidemiol Rep. 2015;2(1):37–51. [DOI] [PMC free article] [PubMed] [Google Scholar]
- 40. Imai K, Keele L, Tingley D. A general approach to causal mediation analysis. Psychol Methods. 2010;15(4):309–334. [DOI] [PubMed] [Google Scholar]
- 41. Raitakari OT, Juonala M, Rönnemaa T, et al. Cohort profile: the Cardiovascular Risk in Young Finns Study. Int J Epidemiol. 2008;37(6):1–7. [DOI] [PubMed] [Google Scholar]
- 42. Dannefer D. Cumulative advantage/disadvantage and the life course: cross-fertilizing age and social science theory. J Gerontol B Psychol Sci Soc Sci. 2003;58(6):S327–S337. [DOI] [PubMed] [Google Scholar]
- 43. DiPrete TA, Eirich GM. Cumulative advantage as a mechanism for inequality: a review of theoretical and empirical developments. Ann Rev Sociol. 2006;32(1):271–297. [Google Scholar]
- 44. Schafer MH, Ferraro KF, Mustillo SA. Children of misfortune: early adversity and cumulative inequality in perceived life trajectories. Am J Sociol. 2011;116(4):1053–1091. [DOI] [PMC free article] [PubMed] [Google Scholar]
- 45. Willson AE, Shuey KM, Elder GH. Cumulative advantage processes as mechanisms of inequality in life course health. Am J Sociol. 2007;112(6):1886–1924. [Google Scholar]
- 46. Evans GW, Li DP, Whipple SS. Cumulative risk and child development. Psychol Bull. 2013;139(6):1342–1396. [DOI] [PubMed] [Google Scholar]
- 47. Brody GH, Yu TY, Chen YF, et al. Cumulative socioeconomic status risk, allostatic load, and adjustment: a prospective latent profile analysis with contextual and genetic protective factors. Dev Psychol. 2013;49(5):913–927. [DOI] [PMC free article] [PubMed] [Google Scholar]
- 48. Kivimäki M, Vahtera J, Tabák AG, et al. Neighbourhood socioeconomic disadvantage, risk factors, and diabetes from childhood to middle age in the Young Finns Study: a cohort study. Lancet Public Health. 2018;3(8):e365–e373. [DOI] [PMC free article] [PubMed] [Google Scholar]
- 49. Elovainio M, Pulkki-Råback L, Hakulinen C, et al. Psychosocial environment in childhood and body mass index growth over 32 years. Prev Med. 2017;97(2):50–55. [DOI] [PubMed] [Google Scholar]
- 50. Katainen S, Räikkönen K, Keskivaara P, et al. Maternal child-rearing attitudes and role satisfaction and children’s temperament as antecedents of adolescent depressive tendencies: follow-up study of 6- to 15-year-olds. J Youth Adolesc. 1999;28(2):139–163. [Google Scholar]
- 51. Beck AT, Steer RA. Internal consistencies of the original and revised Beck Depression Inventory. J Clin Psychol. 1984;40(6):1365–1367. [DOI] [PubMed] [Google Scholar]
- 52. Rosenström T, Jokela M, Hintsanen M, et al. Longitudinal course of depressive symptoms in adulthood: linear stochastic differential equation modeling. Psychol Med. 2013;43(5):933–944. [DOI] [PubMed] [Google Scholar]
- 53. Rabe-Hesketh S, Skrondal A. Multilevel and Longitudinal Modeling Using STATA. New York, NY: Stata Press; 2012. [Google Scholar]
- 54. Imai K, Keele L, Yamamoto T. Identification, inference and sensitivity analysis for causal mediation effects. Stat Sci. 2010;25(1):51–71. [Google Scholar]
- 55. Imai K, Yamamoto T. Causal inference with differential measurement error: nonparametric identification and sensitivity analysis. Am J Polit Sci. 2010;54(2):543–560. [Google Scholar]
- 56. Imai K, Keele L, Tingley D, et al. Unpacking the black box of causality: learning about causal mechanisms from experimental and observational studies. Am Polit Sci Rev. 2011;105(4):765–789. [Google Scholar]
- 57. Tingley D, Yamamoto T, Hirose K, et al. Mediation: R package for causal mediation analysis. J Stat Softw. 2014;59(5):1–38.26917999 [Google Scholar]
- 58. Tingley D, Yamamoto T, Hirose K, et al. Package ‘mediation’. (Version 4.5.0). https://cran.r-project.org/web/packages/mediation/mediation.pdf. Published October 9, 2019. Accessed April 7, 2020.
- 59. Oakes JM. Invited commentary: repeated measures, selection bias, and effect identification in neighborhood effect studies. Am J Epidemiol. 2014;180(8):785–787. [DOI] [PubMed] [Google Scholar]
- 60. Airaksinen J, Hakulinen C, Elovainio M, et al. Neighborhood effects in depressive symptoms, social support, and mistrust: longitudinal analysis with repeated measurements. Soc Sci Med. 2015;136-137:10–16. [DOI] [PubMed] [Google Scholar]
- 61. Jokela M. Are neighborhood health associations causal? A 10-year prospective cohort study with repeated measurements. Am J Epidemiol. 2014;180(8):776–784. [DOI] [PubMed] [Google Scholar]
- 62. Strachan E, Duncan G, Horn E, et al. Neighborhood deprivation and depression in adult twins: genetics and gene×environment interaction. Psychol Med. 2017;47(4):627–638. [DOI] [PMC free article] [PubMed] [Google Scholar]
- 63. Rosenström T, Jokela M, Hintsanen M, et al. Body-image dissatisfaction is strongly associated with chronic dysphoria. J Affect Disord. 2013;150(2):253–260. [DOI] [PubMed] [Google Scholar]
- 64. Katainen S, Räikkönen K, Keltikangas-Järvinen L. Adolescent temperament, perceived social support, and depressive tendencies as predictors of depressive tendencies in young adulthood. Eur J Pers. 1999;13(3):183–207. [Google Scholar]
- 65. Jokela M, Singh-Manoux A, Shipley MJ, et al. Natural course of recurrent psychological distress in adulthood. J Affect Disord. 2011;130(3):454–461. [DOI] [PMC free article] [PubMed] [Google Scholar]
- 66. Vaattovaara M, Joutsiniemi A, Kortteinen M, et al. Experience of a preventive experiment: spatial social mixing in post-World War II housing estates in Helsinki, Finland. In: Hess DB, Tammaru T, van Ham M, eds. Housing Estates in Europe: Poverty, Ethnic Segregation and Policy Challenges. New York, NY: Springer International Publishing; 2018:215–240. [Google Scholar]
Associated Data
This section collects any data citations, data availability statements, or supplementary materials included in this article.