Abstract
In vivo imaging is a powerful approach to study biological processes. Beyond cellular methods, in vivo studies allow for biological stimuli (small molecules or proteins) to be studied in their native environment. This has the potential to aid in the discovery of new biology and guide the development of diagnostics and therapies for diseases. To ensure selectivity and an observable readout, the probe development field is shifting towards activity-based sensing (ABS) approaches and near-infrared (NIR) imaging modalities. This perspective will highlight recent in vivo ABS applications that utilize NIR imaging platforms.
In vivo imaging is a powerful approach to study biological processes.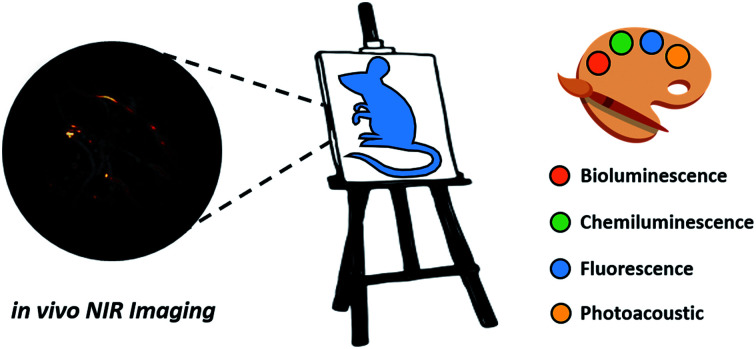
Introduction
A major focus of chemical biology research is to develop and apply methods for monitoring complex biological processes. Significant progress toward this goal has been made over the past decade, particularly in the context of molecular imaging probes.1,2 Although most chemical tools are designed for use in cell culture, in vivo imaging can paint a more complete picture of biological stimuli (small molecules or proteins). This is especially important in the context of studying complex disease states, such as cancer. A molecular imaging probe for in vivo use must satisfy the following criteria: (1) exhibit good selectivity to minimize interference from competing processes, (2) be non-toxic to the specimen, (3) be able to reach its target within the body, (4) enable real-time monitoring, and (5) produce a sufficiently strong signal for accurate sensing. Activity-based sensing (ABS) is a powerful design strategy that has the potential to satisfy these criteria when coupled with an appropriate modality for live animal imaging. Traditional design strategies are based on molecular recognition, in which a specific, binding interaction between the imaging agent and target results in an optical change. In contrast, ABS probes can leverage the unique chemical reactivity of a target to achieve the requisite selectivity and sensitivity, resulting in a permanent change of the probe to provide a readout (Fig. 1). The reaction kinetics of an ABS probe can be increased to intercept a fleeting biological species with a short half-life, and conversely, the reactivity can be attenuated if the target being studied is highly abundant. Traditional, binding-based designs where an enzyme is the target, typically feature a ligand appended to an imaging agent. The resulting stoichiometric binding event only reports on protein concentration and does not reveal its activity. However, ABS probes can report on enzymatic activity by serving as a substrate.3 Regardless of what is being detected, ABS is a versatile and robust approach to monitor biological stimuli.
Fig. 1. General scheme of an ABS probe interacting with the biological stimulus to produce a measurable readout.
Historically, ABS probes designed for in vivo applications prioritized NIR wavelengths (650 to 900 nm) over UV or visible light because there is less interference by endogenous optical absorbers (e.g. haemoglobin, melanin, and water) in addition to less autofluorescence and light scattering. These result in deeper tissue penetration and lower background from surrounding tissues.4 Recently, ABS probe designs for in vivo use have been trending toward the use of light at even longer wavelengths. Light in the NIR-II window (1000–1700 nm) improves upon imaging depths and signal-to-background ratios through decreased light scattering and attenuation. Many fluorescent dye platforms have been developed using excitation/emission wavelengths within the NIR-I or -II ranges.5,6
While fluorescence modalities can be best described as “light in, light out” processes, photoacoustic (PA) imaging (also referred to as optoacoustic imaging) is a “light in, sound out” technique that has gained significant momentum over the past five years. Because the incident light does not need to be focused, probes can be excited at depths up to 10 cm within the body. Additionally, sound is ∼103-fold less likely to scatter as it passes through tissue, which results in images with submicron resolution.7 Other NIR imaging modalities are available for the development of ABS probes that eliminate the need for an initial light excitation event. Specifically, chemiluminescence (CL) and bioluminescence (BL) release photons as a result of chemical or enzyme-catalysed reactions, respectively. In both cases, one only has to be concerned with the detection of photons as they are being emitted.
Herein, we will highlight recent ABS probes that have been developed for five NIR imaging modalities (BL, CL, NIR-I fluorescence, NIR-II fluorescence, and PA imaging). In each section, we will briefly cover background and design considerations before focusing on key examples that have been employed in living systems. Lastly, we will discuss outstanding challenges and future directions in this exciting field of research in the Outlook.
Bioluminescence
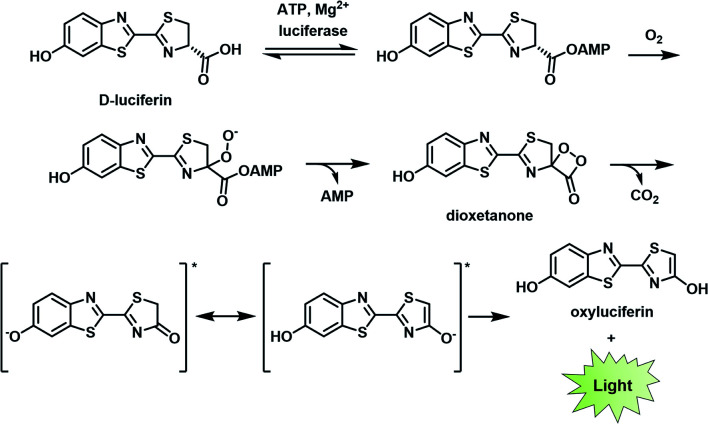
BL describes the process in which light is generated as the result of a biochemical reaction. For instance, fireflies and certain marine organisms can produce a class of small molecules known as luciferins, which react with luciferase enzymes to generate a high-energy intermediate that decomposes to emit light. The first step of this process involves the attachment of an adenosine monophosphate group to a luciferin (e.g., d-luciferin). Molecular oxygen is then introduced to produce the corresponding dioxetanone, which decomposes to generate an excited state oxyluciferin. This intermediate relaxes to its ground state through the emission of a photon at 560 nm (Fig. 2).8,9 Other than d-luciferin, other luciferins such as coelenterazine and fungal luciferin have been used for BL applications.10,11 Scientists have harnessed this technology to track cells,12,13 monitor cell–cell interactions,14,15 and serve as a reporter gene.16
Fig. 2. Bioluminescence mechanism of d-luciferin. Reproduced from ref. 9 with permission from The Royal Society of Chemistry, Copyright 2016.
Beyond d-luciferin, a variety of NIR-light emitting luciferins have been developed,13,17,18 which can be adapted for ABS applications. The most common design is to chemically modify the luciferin with a trigger such that luciferase does not recognize the luciferin until it is unmasked. Using this approach, a luciferin variant that partially emits in the NIR range was utilized to establish an ABS system for fatty acid amide hydrolase (FAAH).19
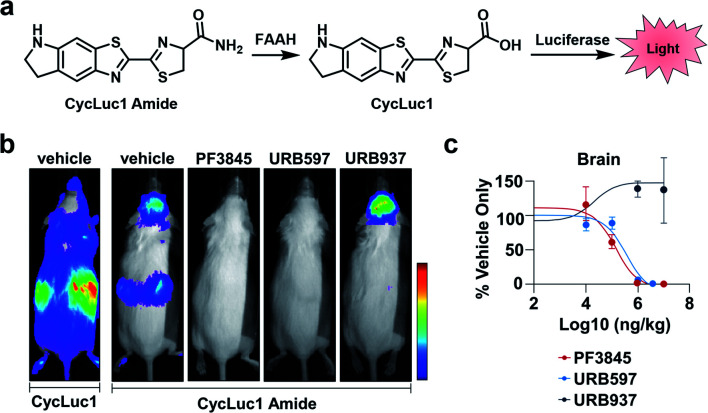
FAAH is a serine hydrolase that catalyses the hydrolysis of fatty acid amides to their corresponding acid products.20 FAAH has been shown to decrease the therapeutic lifetime of drugs acting on the cannabinoid receptor pathway (involved in pain sensation).21 Thus, inhibiting FAAH can be used as a means to modulate pain. Previous methods to assess FAAH inhibitors in vivo involve sacrificing the animal, use of radioactive substrates, and/or HPLC analysis.22,23 As an alternative to these low-throughput methods, Miller and co-workers developed CycLuc1 amide, an ABS probe for BL imaging of FAAH activity.19 Prior to reacting with FAAH, CycLuc1 amide is not recognized as a substrate by luciferase. However, upon FAAH-catalysed hydrolysis to CycLuc1, a robust BL signal can be observed following interaction with luciferase (Fig. 3a). CycLuc1 amide was used to assess FAAH activity within mice. Luciferase was expressed within the brains of mice using adeno-associated virus 9 gene delivery. Following initial in vivo validation to ensure CycLuc1 amide could penetrate the blood–brain-barrier (BBB), the authors sought to determine if CycLuc1 amide could be used to assess the efficacy and tissue distribution of known FAAH inhibitors, PF3845, URB597, and URB937 (Fig. 3b). As expected, URB937 is BBB impermeable and non-active within the brain, while the other inhibitors were able to inhibit FAAH activity, as determined by a lack of BL signal. The authors were able to determine the IC50 of each inhibitor within the brain and kidneys (Fig. 3c). The values obtained with this in vivo assay were comparable to those previously reported, highlighting the utility of this approach for quantitative imaging.24,25 Further, the developed technology enables facile validation of FAAH inhibitor BBB penetration, which is difficult to recapitulate in vitro.
Fig. 3. BL ABS probe for FAAH activity. (a) Scheme of CycLuc1 amide hydrolysis by FAAH to CycLuc1 and interaction with luciferase to produce BL signal. (b) BL imaging with CycLuc1 and CycLuc1 amide in mice treated with vehicle or a FAAH inhibitor. (c) Total photon flux from the brain quantified as a function of inhibitor concentration and BL signal normalized to vehicle signal. Error bars = SEM (n = 3). Adapted with permission from ref. 19, Copyright 2015 American Chemical Society. Future permissions related to the adapted figure should be directed to the American Chemical Society.
Chemiluminescence
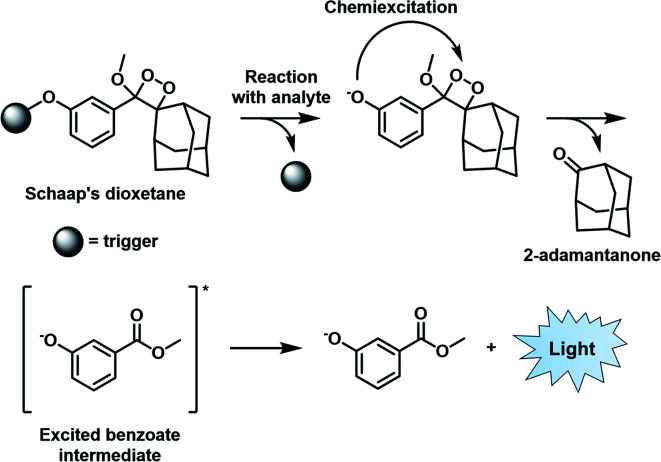
Similar to BL imaging, CL is not limited by the need of light excitation to generate a readout; however, in contrast, the approach does not require co-development and transfection of a luciferase enzyme. Although oxalate and luminol derivatives have been used for a variety of CL applications,26,27 recently, 1,2-dioxetanes that feature a bulky adamantane moiety and a capped phenol group have emerged as the favoured platform to design ABS probes for CL imaging.28 Unlike its predecessors that require a prior oxidation step to generate light, the so-called Schaap's dioxetane can be modified with various target responsive triggers (Fig. 4). When a target reacts with the corresponding trigger, the resulting phenolate intermediate undergoes an electron transfer event and decomposition through a chemically initiated electron exchange chemiluminescence (CIEEL) mechanism to afford 2-adamantanone and a singlet excited-state benzoate intermediate. Relaxation to the ground state is accompanied by the emission of light at 470 nm.29 Although, the CL signal of Schaap's dioxetane is typically very weak due to quenching by water, Shabat and co-workers improved its emissive character through the installation of an electron withdrawing acceptor in conjugation with the phenolate, leading to a marked 3000-fold improvement in CL emission under physiological conditions.30 This significant advancement set the stage for the development of ABS probes with improved CL emission for reactive species,31,32 hypoxia,33 and enzymes34,35 within the visible range.
Fig. 4. CIEEL mechanism of Schaap's dioxetane. Reproduced from ref. 29 with permission from The Royal Society of Chemistry, Copyright 2018.
In addition to improving aqueous performance, the field sought to enhance the signal output by shifting the luminophore emission to the NIR region. Shabat and co-workers achieved this by extending the conjugation through the addition of a dicyanomethylchromone acceptor in the para position and an acrylate unit in the ortho position of the luminophore.36 With this new design, they were able to develop CL ABS probes for β-galactosidase (β-gal) and hydrogen peroxide that emit in the NIR range (λem = 690 nm). To examine their hydrogen peroxide probe in vivo, the authors used lipopolysaccharide (LPS) to induce inflammation in a murine model. They observed a 44-fold higher CL signal enhancement compared to a non-responsive control probe bearing a methyl ether group rather than the boronate ester trigger.
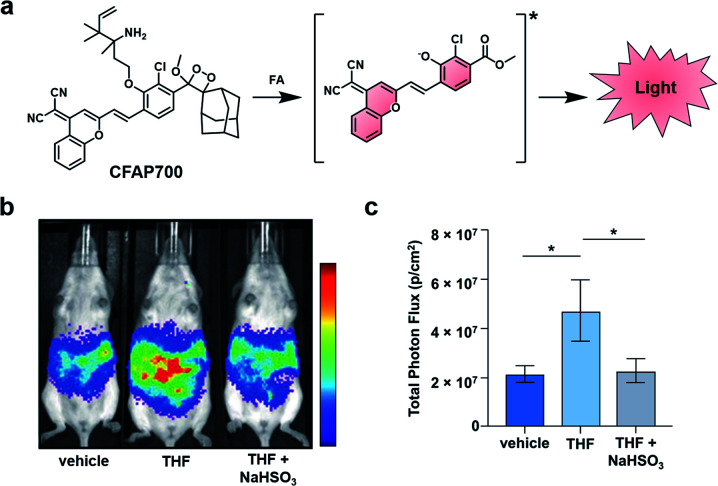
Beyond this initial work, the groups of Chang and Shabat developed CFAP700, an ABS probe for CL imaging, to detect formaldehyde.37 Although formaldehyde is best known as a tissue fixative, due to its potent ability to cross-link DNA, it is also produced endogenously (20–100 μM in blood),38,39 playing a role in metabolism and functioning as a signalling molecule.40 Recently, it has also been shown to inhibit wound healing when perturbing cellular concentrations at the micromolar level.41 To study this reactive molecule, the probe design features a formaldehyde-responsive trigger that is based on 2-aza-Cope chemistry42,43 and the NIR luminophore previously described (Fig. 5a).30,36 CFAP700 was first evaluated in vivo using exogenous formaldehyde. The corresponding turn-on response could be attenuated by scavenging formaldehyde with sodium bisulfite (NaHSO3). Next, the authors employed the probe to detect formaldehyde produced endogenously by the folate cycle (Fig. 5b and c). Mice treated with tetrahydrofolate (THF) produced a 2.5-fold turn-on response as compared to a group that received vehicle treatment. THF was used because it can spontaneously decompose under physiological conditions to afford formaldehyde, or it can enter the one-carbon cycle to produce purines and formaldehyde.44 When animals were co-treated with THF and NaHSO3, the signal was attenuated, demonstrating the turn-on was due to formaldehyde. To probe if folinate, another important metabolite in the folate cycle, is also able to generate formaldehyde, the authors administered calcium folinate to mice. Unlike THF, they were unable to see a significant CL signal compared to the control. The authors postulate that the two important components of the folate cycle, THF and folinate, have drastically different metabolic profiles in vivo. The development of CFAP700 provides a new tool to monitor the production, metabolism, and signalling of formaldehyde.
Fig. 5. Chemiluminescent Formaldehyde Activity Probe 700 (CFAP700). (a) CFAP700 reaction with formaldehyde (FA) to produce a CL signal. (b) CL imaging with CFAP in mice treated with vehicle, THF, and THF with NaHSO3. (c) Total photon flux from mice over the course of 0–25 min. Error bars = SEM (n = 4–5). Reproduced from ref. 37 with permission from Wiley-VCH Verlag GmbH & Co. KGaA, Weinheim, Copyright 2018.
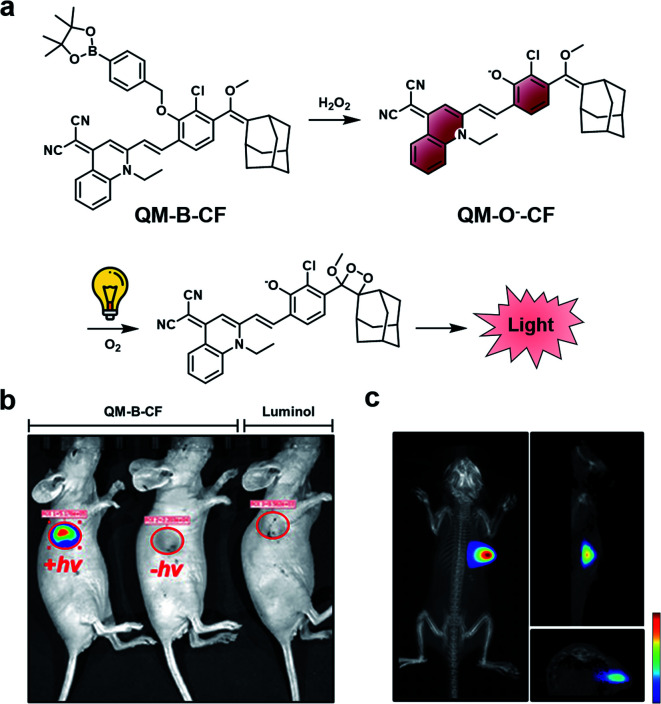
A limitation of CL ABS probes is that they generate a sustained but weak CL signal when uncapped because photon production is tied to probe turnover. To address this outstanding challenge, Guo and co-workers developed a dual-lock strategy for hydrogen peroxide to achieve a stronger burst of light on demand.45 First, a target reacts with the probe (QM-B-CF), leading to the generation of a stable fluorophore intermediate (QM-O−-CF). Following accumulation of QM-O−-CF, an enriched CL signal can be produced through irradiation with white LED light (Fig. 6a). QM-O−-CF is proposed to turnover via photooxidation in which light initiates the generation of a radical. The radical can react with molecular oxygen to generate the 1,2-dioxetane, and the subsequent decomposition releases light via the CIEEL mechanism. The authors installed hydrogen peroxide and β-gal triggers onto their platform for initial in vitro testing. In the β-gal example, the authors saw a 9.5-fold enhanced signal in Skov-3 human ovarian cancer cells with the dual-lock design compared to the one-lock version, in which a CL signal was generated immediately after reaction with the biological stimulus. Next, the hydrogen peroxide dual-lock probe was evaluated in a 4T1 tumour model, which is expected to have elevated hydrogen peroxide. Following intratumoural injection, the authors saw a 66-fold higher CL signal intensity of their probe compared to luminol, a standard CL hydrogen peroxide probe (Fig. 6b). The authors showed that probe turnover was diminished in the presence of N-acetylcysteine (NAC), a hydrogen peroxide scavenger. An impressive 3D rendering of the tumour could be generated to map the origin of the CL signal (Fig. 6c). This technology could be applied for targets with either a low activity or concentrations, and resultantly, a more definitive signal can be detected. Although, a possible limitation of this technology is that it is currently restricted by the tissue penetration of the excitation source (non-NIR white LEDs). One would expect that red-shifting the activation of the stable fluorophore to emit a CL signal would enhance the utility of this technology to non-invasively image deeper tissue.
Fig. 6. Dual-lock strategy for CL emission enhancement. (a) Reaction scheme of QM-B-CF reacting with hydrogen peroxide to generate a stable fluorescent intermediate (QM-O−-CF), and following irradiation with light, the generation of a CL signal. (b) Comparison of CL signal from QM-B-CF with and without white light irradiation and Luminol (c) 3D image of QM-B-CF CL signal. Reproduced from ref. 45 with permission from Wiley-VCH Verlag GmbH & Co. KGaA, Weinheim, Copyright 2020.
Near infrared-I fluorescence
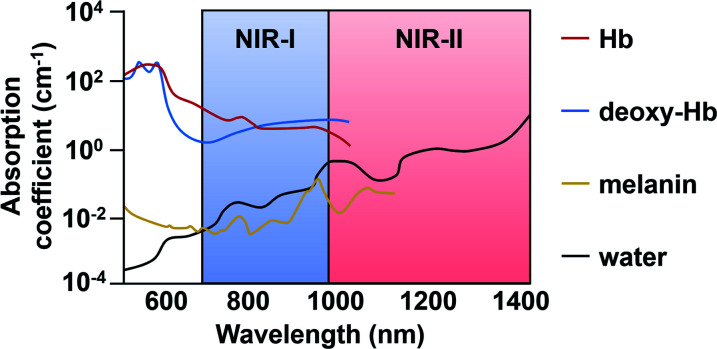
As mentioned previously, in vivo fluorescence imaging utilizes longer wavelengths of light (650 nm to 900 nm), rather than UV or visible, to minimize interference from biological optical absorbers (Fig. 7). ABS probes for NIR-I imaging have been developed for diverse targets such as metal ions,46 reactive oxygen species (ROS),47 reactive nitrogen species (RNS),48 thiols,49 carbonyls,50 and proteins.51–53 ABS probes have been developed on a variety of dye platforms including but not limited to cyanine,54 hemicyanine,55 xanthene,56 and donor-two-acceptor dyes.57,58 Several excellent review articles that cover this in detail are available.59–61 In this section, we focus on recent examples with an emphasis on disease marker detection in vivo.
Fig. 7. Endogenous absorbers in the body within the NIR-I and -II regions. Adapted with permission from ref. 89, Copyright 2018 American Chemical Society.
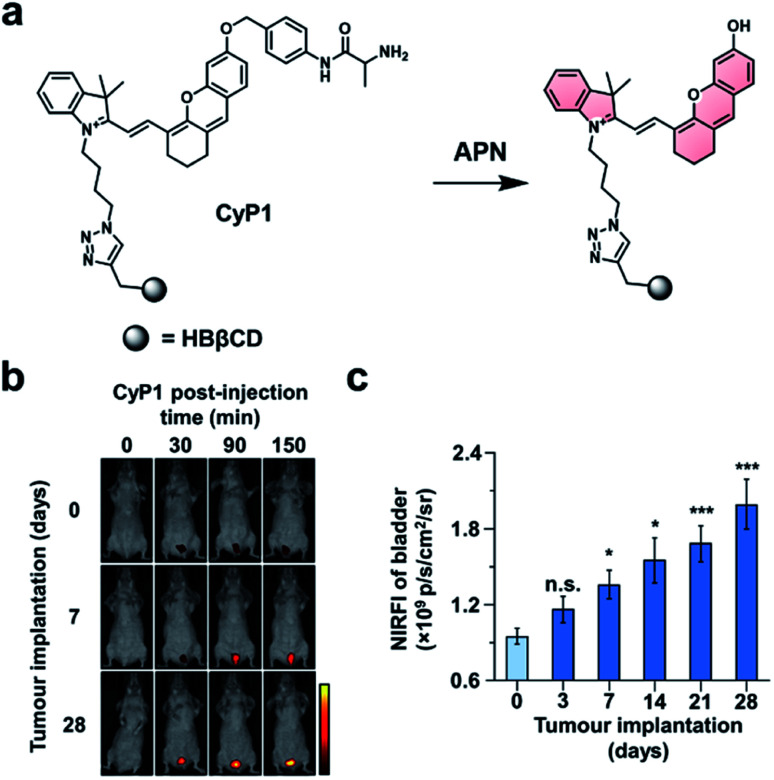
In the first example, Pu and co-workers developed an ABS probe for NIR-I imaging of aminopeptidase N (APN) activity.62 APN is a cell membrane protein that is responsible for digesting peptides generated by gastric and pancreatic proteases.63 Due to its extracellular localization and overexpression in bladder cancer (BC),64,65 APN activity is an attractive target for the diagnosis and staging of BC. Other NIR-I dyes have been reported for APN,66,67 but in addition to the APN trigger and a NIR-I dye, the probe developed by the authors (CyP1) is also equipped with a renal clearance moiety (Fig. 8a). To demonstrate selectivity, the authors stained human 5637 BC cells and murine 4T1 breast cancer cells with CyP1. A significant fluorescent response was only observed in the 5637 BC cells owing to the overexpression of APN. The pharmacokinetics of the probe were assessed by monitoring CyP1 concentration in the blood and urine of mice via HPLC. The renal clearance efficiency was determined to be 94 ± 2.0% of the injected dose (ID) after 24 hours. In contrast, only 3.8 ± 1.6% of the probe without the renal clearance moiety was eliminated 24 hours post-injection. The authors then assessed CyP1's ability to detect BC in a murine orthotopic bladder tumour model. CyP1 was administered at varying time points post BC cell implantation. The probe could be detected 30 minutes post-injection, and a statistically significant fluorescence signal was observed 7 days after tumour implantation relative to the control mice (Fig. 8b and c). Immunofluorescence staining of the BC tissue showed overlap between the probe signal and APN staining. The authors assert that CyP1 signal correlates well with APN activity, making CyP1 a prognostic tool for early BC detection and staging.
Fig. 8. Prognostic probe for bladder cancer (CyP1). (a) Reaction scheme of CyP1 with APN. (b) Representative images of mice at 0, 30, 90, and 150 min post-injection of CyP1 for different tumour implantation time points. (c) Quantified NIR fluorescent intensities relative to control at 150 min post-injection of CyP1. Error bars = S.D. (n = 6). Reproduced from ref. 62 with permission from Wiley-VCH Verlag GmbH & Co. KGaA, Weinheim, Copyright 2019.
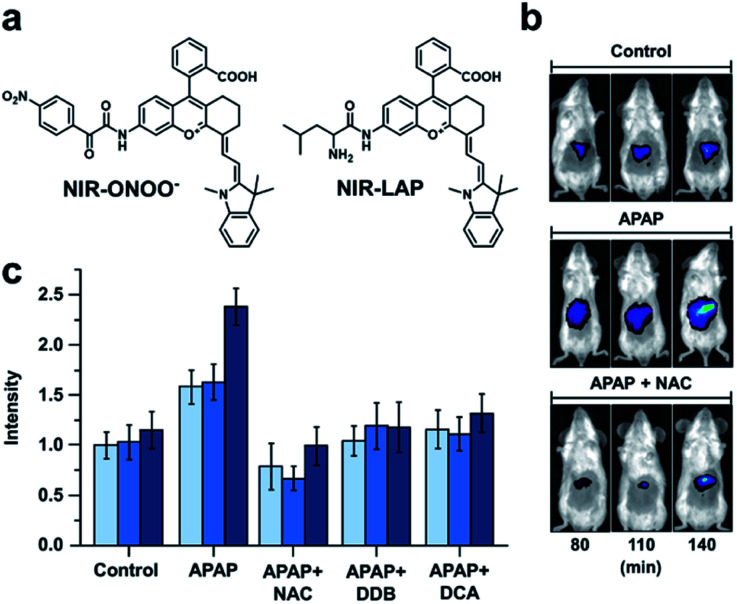
Many imaging agents can be oxidized by ROS/RNS, resulting in off-target effects and false positive readouts.68,69 This is especially problematic when an ABS probe is developed for a disease such as drug-induced liver injury (DILI) in which ROS/RNS are generated in large quantities.70,71 Many diagnostic agents for DILI suffer from cross-reactivity with ROS/RNS and therefore, do not accurately represent the disease state. To address this limitation, Yuan and co-workers designed two probes for sensing peroxynitrite and leucine aminopeptidase (LAP), an enzyme overexpressed in DILI.72 To develop these probes, the authors initially screened 23 NIR-I dyes to assess their stability toward peroxynitrite and other ROS/RNS. From this panel, two suitable candidates featuring a pendent benzoic acid moiety were identified. The authors postulated that this group imparts chemostability by blocking a common oxidation site. Triggers for peroxynitrite and LAP were installed to the more red-shifted platform to afford NIR-ONOO− and NIR-LAP, respectively (Fig. 9a). The authors observed 7- and 13-fold turn-on responses in vitro for the peroxynitrite and LAP probes, respectively. Importantly, both probes were non-reactive to other ROS/RNS, biological analytes (e.g. metabolites and metal ions), and enzymes (e.g. ALP, NTR, MAO-A). Next, the authors sought to monitor the protective effects of a variety of therapeutics in an acetaminophen (APAP)-induced hepatotoxicity model. Hepatotoxicity could be observed 140 minutes post injection with the LAP probe (Fig. 9b and c). However, if mice were pretreated with a hepatoprotective therapeutic such as NAC, biphenyldicarboxylate (DDB), or ursodeoxycholic acid (UDCA) before APAP was administered, no hepatotoxic indications were observed. The authors state that this ROS/RNS stable probe can be used for in vivo screening to assess a drug candidate's hepatotoxicity or screen for new hepatoprotective medicines, as well as assess the pathology of hepatotoxicity. This study highlights the utility of prescreening dye analogues and understanding dye decomposition pathways. This can aid in the development of ABS probes, especially for ones that will be used in high ROS/RNS environments.
Fig. 9. Probe for detecting peroxynitrite and LAP activity in DILI. (a) Structures of NIR-ONOO− and NIR-LAP. (b) Representative images of in vivo LAP activity in an APAP-induced hepatotoxicity model. (c) Quantified hepatoprotective effects of NAC, DDB, and DCA in an APAP-induced hepatotoxicity mouse model. Error bars = S.D. (n = 3). Adapted with permission from ref. 72, Copyright 2019 American Chemical Society.
Near infrared-II fluorescence
Because there is still significant attenuation and scattering of light in the NIR-I region, the development of ABS probes for NIR-II imaging has become a growing area of research. Light within the NIR-II window (1000–1700 nm) is absorbed less within biological tissue, which reduces autofluorescence and improves the signal to background ratio.4 However, NIR-II fluorescence imaging is a relatively new area of research, and improvements are still needed. For instance, while several NIR-II platforms have been reported,73–77 there have been only a few examples of NIR-II ABS probes.78–81 One of the major challenges of NIR-II dyes is their limited aqueous solubility, a consequence of their extensive π-conjugation. This has the potential to cause unproductive aggregation induced quenching or blue-shifting the fluorescent properties. Further, extensive π-conjugation makes these dye platforms more susceptible to oxidation compared to their NIR-I counterparts. Although some groups have harnessed this characteristic to design NIR-II FRET pairs for sensing ROS (e.g., peroxynitrite),82,83 this design strategy is not currently broadly applicable to other biological targets. Due to their inherent instability, many of the reported ABS probes for NIR-II imaging must be encapsulated into particles to have sufficient solubility and stability.
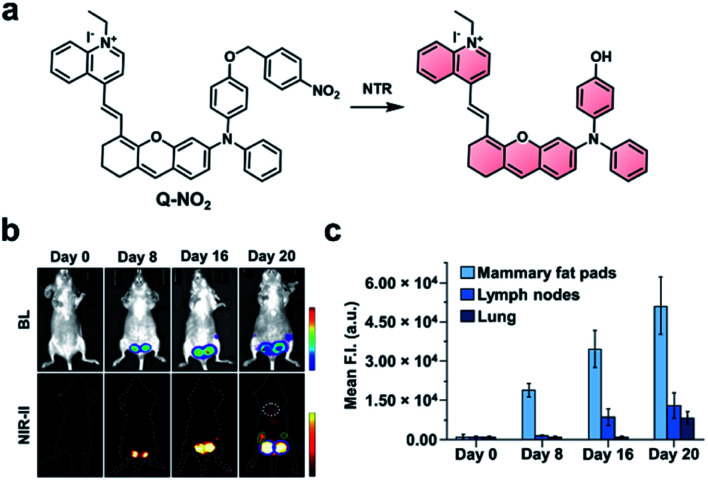
The groups of Wu and Zeng recently developed a dual-modal NIR-I/II and multispectral optoacoustic tomography (MSOT) probe for detection of breast cancer metastasis through nitroreductase (NTR) activity.79 Breast cancer affects 1 in 8 women worldwide and has a poor survival rate following metastasis. The probe (NP-Q-NO2) consists of a NTR-reactive trigger installed on a hemicyanine dye (Fig. 10a). Upon reacting with NTR, the product exhibits aggregation-induced emission (AIE) behaviour and generates NIR signals at 780 and 922 nm, with emission stretching into the NIR-II window. To evaluate NP-Q-NO2, 4T1 breast cancer cells expressing luciferase were injected into the mammary fat pads of mice. The resulting tumours were visualized via NIR-II imaging at 0, 8, 16, and 20 days post-implantation. Following treatment with d-luciferin, a bioluminescent signal could be detected after 8 days, indicating the formation of a tumour. Moreover, the authors imaged the subiliac lymph nodes and lungs, which are common metastatic sites for breast cancer. A weak BL signal was observed in the subiliac lymph nodes, but not the lungs (Fig. 10b). However, metastatic sites in both the lymph nodes and lungs could be detected using NP-Q-NO2via NIR-II fluorescence imaging (Fig. 10c). Additionally, the probe was used to assess the therapeutic efficiency of cyclophosphamide (CPA). Four days following tumour implantation, mice were treated with CPA once every other day. No metastases were observed using NP-Q-NO2 in mice treated with CPA, but they were observable in the control mice. Then, the authors performed the same studies using NP-Q-NO2 as a MSOT probe and observed similar results. Signals from endogenous absorbers such as haemoglobin, deoxyhaemoglobin, and melanin could be subtracted from the image of the probe using MSOT technology. This dual-modal platform has the potential to be used with other biomarkers for the detection of cancer.
Fig. 10. NIR-II probe (Q-NO2) for NTR activity in metastatic breast cancer model. (a) Reaction scheme of Q-NO2 reaction with NTR. (b) Representative images of BL and NIR-II fluorescence signals in luciferase-expressing breast cancer tumours at 0, 8, 16, and 20 days post-implantation. (c) Relative NIR-II fluorescent intensity in mammary fat pads, lymph nodes, and lungs at 0, 8, 16, and 20 days post-implantation normalized to the control. Error bars = S.D. (n = 5). Reproduced from ref. 79 with permission from Wiley-VCH Verlag GmbH & Co. KGaA, Weinheim, Copyright 2019.
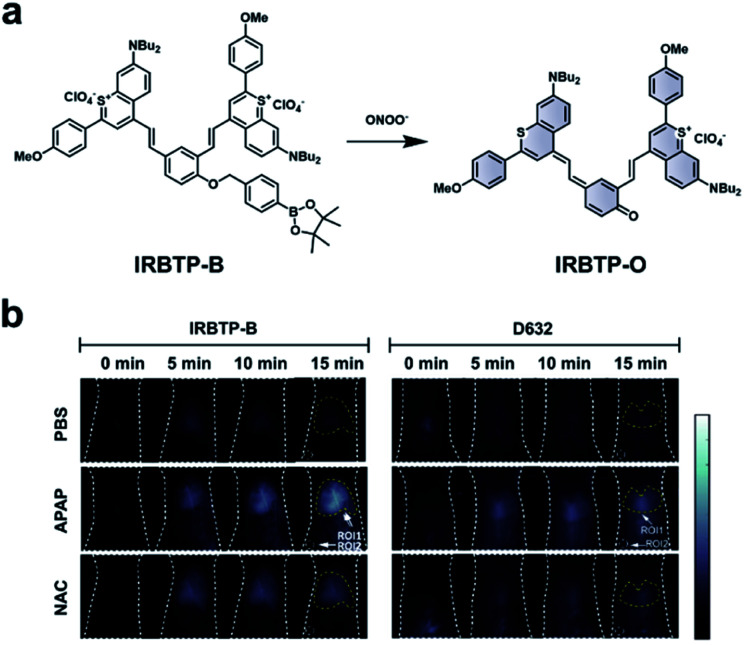
As discussed previously, the overproduction of ROS/RNS is characteristic of many inflammatory diseases. Thus, imaging these species may be important to track disease progression. Zhang and co-workers developed an ABS probe, IRBTP-B, for the detection of peroxynitrite in DILI.80 IRBTP-B contains a phenyl boronate trigger, which upon reaction with peroxynitrite unmasks a novel NIR-II benzothiopyrylium cyanine fluorescent dye (IRBTP-O). IRBTP-O exhibits large extinction coefficients at 575 and 905 nm (Fig. 11a). Inclusion of the two terminal benzothiopyrylium groups was critical in extending the emission peak beyond 1000 nm.84 When tested against a panel of ROS/RNS, the probe was shown to be selective for peroxynitrite and had a limit of detection (LOD) of 55.9 nM in vitro. An APAP-induced hepatotoxicity model was used to evaluate IRBTP-B in vivo (Fig. 11b). A NIR-II fluorescence signal was observed in mice treated with APAP, but it was reduced in PBS vehicle control mice and those pre-treated with NAC. The authors compared their new probe with D632, a commercial probe for peroxynitrite that exhibits fluorescence within the visible region. They found that IRBTP-B was more sensitive than D632, which they attribute to their probe's emission within the NIR-II range.
Fig. 11. ABS probe for NIR-II imaging of peroxynitrite. (a) Reaction scheme of IRBTP-B reacting with peroxynitrite to produce a NIR-II fluorescent product, IRBTP-O. (b) Representative images of peroxynitrite in an APAP-induced hepatotoxicity model using IRBTP-B and a commercial dye, D632. Adapted with permission from ref. 80, Copyright 2019 American Chemical Society.
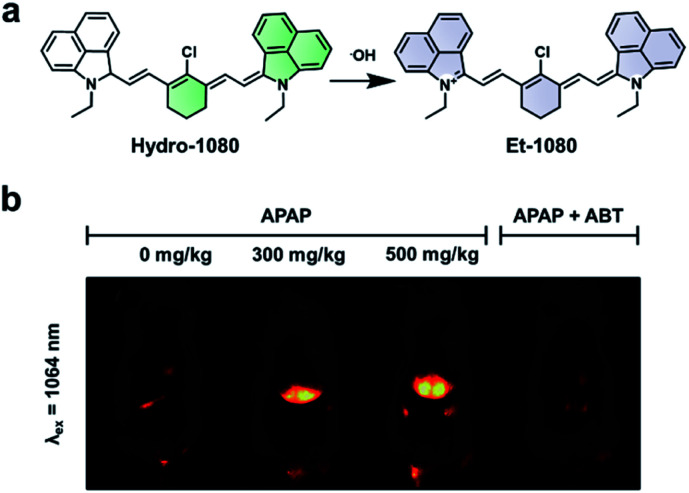
Hydroxy radicals (˙OH) are highly reactive ROS generated in vivo and are known to cause oxidative damage in a variety of inflammatory diseases.85–87 To image this ROS, Liu and co-workers recently developed Hydro-1080, an ABS probe for NIR-II imaging of ˙OH (Fig. 12a).81 Initially, the probe is not fully conjugated between the two benzoindole groups and does not fluoresce in the NIR-II window. However, the oxidation of Hydro-1080 triggered by ˙OH extends the conjugated system, and the resultant product, Et-1080, emits at 1080 nm with a quantum yield of 0.45%. The LOD was determined to be 0.5 nM in vitro, which is competent in detecting basal levels of ˙OH. The authors used Hydro-1080 for imaging ˙OH in APAP-induced hepatotoxicity and LPS induced inflammation models (Fig. 12b). The ˙OH response in the APAP model was attenuated when mice were pretreated with 1-aminobenzotriazole (ABT). ABT inhibits cytochrome P450 activity and prevents the metabolism of APAP into a hepatotoxic agent. This study is the first small-molecule sensor for ˙OH that gives a NIR-II readout.
Fig. 12. ABS probe for NIR-II imaging of ˙OH. (a) Reaction scheme of Hydro-1080 reacting with ˙OH to form Et-1080. (b) Representative images of the ABS probe imaged at 808 and 1064 nm within an APAP-induced hepatotoxicity model and the hepatoprotective effects of ABT. Adapted with permission from ref. 81, Copyright 2019 American Chemical Society.
Photoacoustic imaging
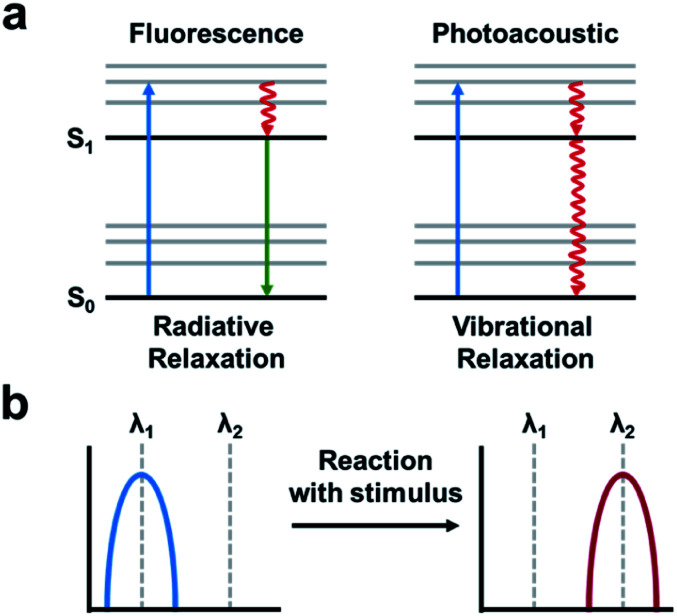
The PA effect converts absorbed light into acoustic signals. Upon irradiation and excitation, a PA agent can undergo non-radiative relaxation thereby releasing heat (Fig. 13a). The rapid release of heat causes a local temperature change and thermoelastic expansion within the tissue. Excitation using a pulsed laser generates cyclic pressure changes which propagate as acoustic waves. Ultimately, these acoustic waves can be detected by ultrasound transducers and reconstructed to yield high resolution images (1/200th of the imaging depth) in the centimetre range (up to 10 cm depending on the instrument).7 ABS PA agents typically utilize either a “turn-on” or ratiometric design. A “turn-on” design refers to a quenched probe that upon reaction with a target produces a PA signal. Ratiometric probes have differing absorbance profiles compared to their turned over product (Fig. 13b). As a result, both species can be monitored by selective irradiation at the appropriate wavelength of maximum absorbance (λabs). Although, it should be noted that irradiation at the maximum absorbance is not essential. If the probe and turnover product have overlapping absorbance profiles, they can be selectively irradiated to provide the best ratio between the two. Ratiometric imaging is desirable because it can account for tissue heterogeneity, differences in imaging depth, local probe concentration, and clearance.88 Important criteria to consider in the design of an ABS probe for PA imaging are the following: a λabs in the NIR window, high extinction coefficient, low fluorescent quantum yield, and for ratiometric probes, minimal overlap between the absorbance profiles.89–91 Using these criteria, a variety of ABS probes have been developed for Cu2+,92 hypoxia,93,94 nitric oxide,95,96 and a variety of enzyme targets.97–100 This is in addition to many excellent non-ABS PA probes that have been reviewed elsewhere.101–103
Fig. 13. Photoacoustic imaging. (a) A fluorescence signal is produced by absorbance (blue arrow) followed by relaxation to the ground-state via radiative relaxation. A photoacoustic signal arises from absorbance followed by vibrational relaxation via non-radiative relaxation pathways (red arrow). Adapted with permission from ref. 89, Copyright 2018 American Chemical Society. (b) Schematic of ratiometric imaging in which the starting material produces a PA signal at a particular wavelength (λ1) following reaction with the stimulus of interest produces a wavelength shift (λ2). Adapted with permission from ref. 90, Copyright 2018 American Chemical Society.
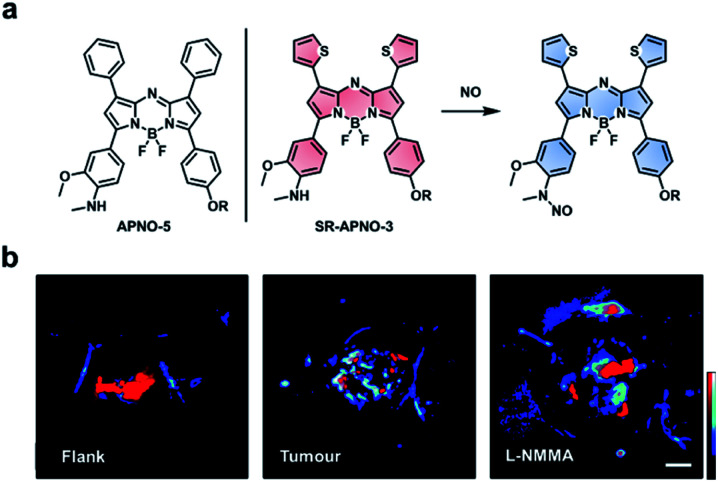
Nitric oxide (NO) is another RNS upregulated in inflammatory diseases and cancer. Due to its roles in pathology (and physiology), it is essential to be able to image NO in an in vivo context. A variety of methods have been developed to detect NO in vivo (e.g. MRI, fluorescence, and luminescence);104–106 however, these methods are limited by poor resolution, sensitivity, and/or depth penetration. Through rational tuning, our group developed the first ABS probe for in vivo PA imaging of NO, APNO-5 (Fig. 14a).95 APNO-5 features a PA compatible aza-BODIPY dye. When NO reacts with the aniline trigger of APNO-5, the resultant N-nitrosated product is blue-shifted by 91 nm (from 764 nm to 673 nm). As mentioned previously, selective irradiation of each species enables ratiometric imaging. To demonstrate the ability of APNO-5 to image endogenous NO production, an LPS-induced inflammation model was used. A signal enhancement was compared to a saline vehicle control. To improve the sensitivity toward NO, we developed a second-generation ABS probe for PA imaging named SR-APNO-3 (Fig. 14a).96 By replacing two of the pendant phenyl groups with smaller thiophenes, we were able to planarize the probe by relaxing the steric clash. This modification led to a theoretical 4.4-fold increase in ratiometric turn-on response in vitro. In addition to using an intramuscular inflammation model, we also challenged the sensitivity of SR-APNO-3 by imaging lower concentrations of NO in a 4T1 breast cancer model, and to confirm that turn on was the result of SR-APNO-3 interacting with NO, we pre-treated mice with l-NG-monomethyl-arginine (l-NMMA), a pan-selective NO synthase inhibitor (Fig. 14b). Since our initial work, others have also developed PA ABS probes for NO using a donor–acceptor–donor dye platform.107
Fig. 14. ABS probe for PA imaging of NO in inflammation and cancer. (a) Structures of APNO-5 and SR-APNO-3. Reaction scheme of SR-APNO-3 reacting with NO to produce the N-nitrosated product. (b) Representative images of SR-APNO-3 within the mouse flank, tumour, and tumour pre-treated with l-NMMA. Scale bar represents 2.0 mm. Reproduced from ref. 96 with permission from the Royal Society of Chemistry, Copyright 2020.
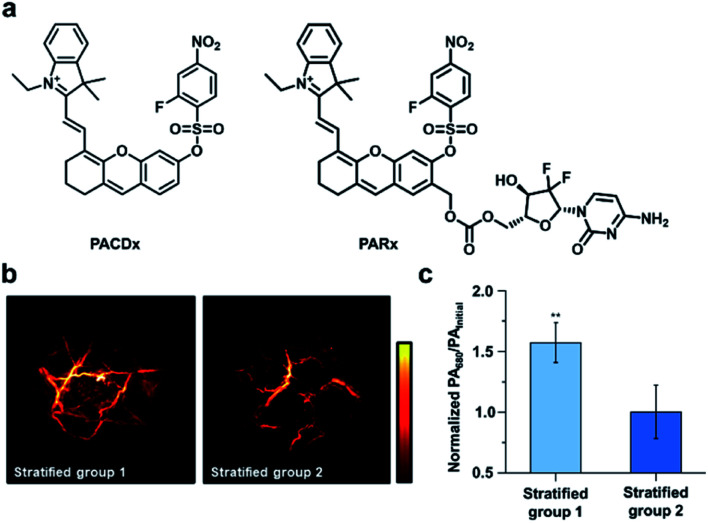
Beyond RNS, our group has recently developed an ABS probe for PA imaging of glutathione (GSH), which is the most abundant biological thiol. GSH plays important roles in maintaining redox homeostasis and xenobiotic detoxification. However, elevated levels of GSH have been associated with various cancer types and chemotherapeutic resistance, and yet, targeting GSH as a cancer biomarker is challenging because it is abundant throughout the body in mM concentrations.108 To address this, our group developed PACDx, an ABS probe that can distinguish GSH levels in healthy and tumour tissue, as well as across different cancer types (Fig. 15a).109 PACDx features two key elements, a dye capable of producing a PA signal in the NIR-I region upon irradiation and a nucleophilic aromatic substitution (SNAr)-based GSH trigger. By tuning the SNAr reactivity via physical organic approaches, we designed a probe that can respond to GSH in a dose-dependent manner within the 0.1–10 mM range. After demonstrating that PACDx can report on GSH levels in various cell lines (A549, HEK 293, and U87 cells), PACDx was used in a A549 lung cancer xenograft model. PACDx accumulated in tumours after systemic injection, where it generated a strong PA signal in vivo. In a blind study, PACDx was used to stratify a group of mice bearing A549 tumours (high GSH) from animals with U87 tumours (low GSH) via PA imaging (Fig. 15b and c). Inspired by the lack of off-target activation, we leveraged our new trigger to develop a prodrug (PARx) for treating lung cancer (Fig. 15a). PARx exhibits the same reactivity and selectivity capabilities as PACDx, enabling the release of a chemotherapeutic and a PA imaging dye exclusively in lung tumours. The selective release of the drug was demonstrated via a tumour inhibition study in which we observed significant tumour attenuation in A549 xenografts compared to U87 xenograft tumours. The development of PACDx provides a new strategy for designing ABS probes for PA imaging that can be exploited for various in vivo applications.
Fig. 15. GSH-responsive companion-diagnostic for lung cancer. (a) Structures of GSH-responsive companion diagnostic (PACDx) and prodrug (PARx). (b) Representative images of stratified groups. (c) Normalized PA intensities of stratified groups. Error bars = S.D.
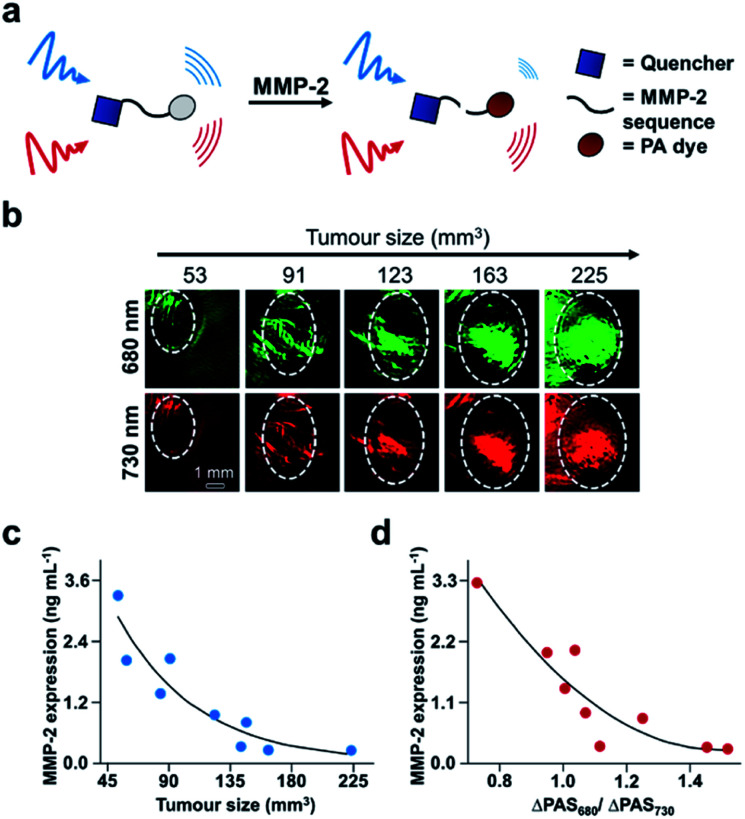
Finally, another biomarker for cancer is upregulation of matrix metalloproteinases (MMPs), which are calcium-dependant endopeptidases responsible for degrading extracellular matrix proteins. MMP-2 overexpression is common in most solid tumours, and therefore its activity can be used for cancer diagnosis and evaluating therapeutic efficacy.110 A number of MMP-2 probes for PA imaging have been developed;111–114 however, existing technologies do not provide real-time acquisition of MMP expression in vivo. Gao, Shi, Ji, and co-workers report a dual-modal activatable probe for MMP-2 expression in cancer.115 The probe (QC) consists of a MMP-2 cleavable peptide sequence, a Cy5.5 dye, and a QSY21 quencher (Fig. 16a). Due to the hydrophobicity of the quencher and hydrophilicity of the Cy5.5 dye, the probe spontaneously forms nanoparticles in aqueous solution. Interaction with MMP-2 cleaves the recognition sequence, resulting in an altered aggregation state and efficiency of luminescence energy transfer between the dye and quencher. Subsequently, the PA signal at 680 nm decreases, while the signal at 730 nm remains constant. The PA signal at 680 nm (PA680) could be used to assess MMP-2 activity, while the signal at 730 nm (PA730) served as an internal standard. The authors were able to correlate the change in ratiometric signal (PA680/PA730) to MMP-2 concentration, and a linear relationship was determined in vitro for concentrations between 10–640 ng mL−1. However, when testing their probe against other relevant enzymes, QC was not selective for MMP-2 as MMP-9 also turned over the probe. Nevertheless, the authors applied QC for in vivo MMP detection in a 4T1 breast cancer model. Following intravenous injection, QC accumulation in tumours was monitored via PA imaging. Using this probe, the authors measured MMP activity as a function of tumour size (Fig. 16b). The PA signals at each wavelength increase against tumour volume. These imaging results were confirmed using western blot analysis of MMP-2 ex vivo (Fig. 16c). The relationship between tumour size and MMP-2 expression allowed the authors to correlate the ratiometric readout to MMP-2 activity in vivo (Fig. 16d). The authors found that MMP-2 activity decreased with increasing tumour size, which has previously been observed.116 This proof-of-principle study demonstrates the utility of using real-time monitoring to semi-quantitatively measure enzyme activity in the complexity of the tumour environment, and this developed system has the potential to be used for other biological stimuli.
Fig. 16. ABS probe for PA imaging MMP-2 activity in cancer. (a) Schematic of QC reacting with MMP-2. (b) Representative images of QC irradiated at 680 and 730 nm in different tumour sizes. (c) MMP-2 expression within different tumour sizes determined by western blotting. (d) MMP-2 expression determined by the ratio of PA signal at 680 and 730 nm. Adapted with permission from ref. 115, Copyright 2019 American Chemical Society.
Outlook
We have highlighted recent key examples of ABS probes for NIR BL, CL, NIR-I fluorescence, NIR-II fluorescence, and PA imaging (Table 1). An emphasis was placed on in vivo applications because it provides a complementary approach to cellular studies by capturing a biological stimuli's role in complex environments such as cancer and other diseases.117–119 BL imaging is particularly advantageous for tracking a particular cell population in vivo by encoding the luciferase machinery into the target cells. The use of NIR-I emitting luciferins will enable the tracking of cells within deeper tissue. Unlike BL, CL eliminates the need for transfection and implantation of cells in vivo. Only the reactivity between the CL probe and biological stimulus needs to be tuned unlike the additional concern of evolving a competent luciferase/luciferin pair. This is particularly attractive for the low cost of diagnosis or screening of diseases. However, CL is currently limited by poor resolution due to uncontrolled release of photons after reaction with a target. This limitation is starting to be addressed by the highlighted CL dual-lock probe, where a CL signal could be released in an enriched burst.45 Future iterations of this strategy can make use of other non-light mediated triggers to induce a CL response, or the excitation wavelength can be red-shifted into the NIR region to enable deep-tissue penetration. Recently, the ABS probe development field is shifting its focus towards the use of longer wavelengths within the NIR-II window. This emerging technology can be paired with NIR-I ABS probes to potentially reveal cross-talk between different biological species. However, issues of solubility and stability must be addressed for using NIR-II dye platforms as ABS probes. Addition of solubilizing groups or encapsulation of these probes can be used to enhance their fluorescent properties,120–122 and a similar approach, as in the highlighted NIR-I example,72 can be used to screen for ROS/RNS stability for NIR-II dye platforms. Another promising imaging modality within the ABS field is that of PA imaging. Sub-micron resolution can be achieved at 7–10 cm depths. Moving forward, improvements in both depth penetration and resolution in vivo can be made by developing PA probes that absorb and emit within the NIR-II region. The tuning of excited state lifetimes and aggregation induced emission of these probes opens the door for the development of exciting new dye platforms. Furthermore, the imaging field is still relatively new with regards to instrumentation and image processing. Improvements made in these areas will undoubtedly further the field complementary to probe development.
Reported photophysical properties of NIR ABS probes.
| ABS probe | λ abs (nm) | λ em (nm) | Φ | ε (×104 M−1 cm−1) | |
|---|---|---|---|---|---|
| Bioluminescence | CyLuc1 | — | 604 | — | — |
| Chemiluminescence | CFAP700 | — | 700 | — | — |
| QM-B-CF | — | 700 | — | — | |
| NIR-I fluorescence | CyP1 | 695 | 720 | 0.22 | — |
| NIR-LAP | 622/670 | 703 | 0.28 | — | |
| NIR-II fluorescence | Q-NO2 | 664/808 | 780/922 | — | — |
| IRBTP-O | 855 | 950 | 0.04 | 5.999 | |
| Hydro-1080 | 525 | — | — | 2.43 | |
| Et-1080 | 1021 | 1054 | 0.08 | 9.37 | |
| Photoacoustic | SR-APNO-3 | 790 | — | 0.002 | 7.24 |
| t-SR-APNO-3 | 704 | — | 0.10 | 5.31 | |
| PACDx | 690 | — | — | — | |
| QC | 680/730 | — | — | — |
A variety of probes have been developed for these different modalities, and the highlighted proof-of-principle studies demonstrate the utility of ABS for in vivo, especially in the example of semi-quantification of MMP-2 activity.115 The probe development field will likely shift towards the use of ABS probes for quantification or semi-quantification of an biological stimulus rather than just a binary answer of its presence. By leveraging the sensitivity and selectivity of ABS probes, we are now in a position to make new discoveries in biology in addition to moving towards precision medicine and diagnostics. Significant advancements will be made once these developed probes are adopted and used by scientists in other fields.
Conflicts of interest
There are no conflicts to declare.
Supplementary Material
Acknowledgments
A. K. E. acknowledges the Beckman Institute Graduate Fellowship for financial support. M. Y. L acknowledges the Alfred P. Sloan Foundation for financial support. The authors acknowledge the National Science Foundation (CHE 1752879 to J. C.) and the National Institutes of Health (R35GM133581 to J. C.) for funding.
Biographies
Biography
Amanda K. East.

Amanda East graduated from DePaul University in 2018 with a B.S. in Chemistry. She performed research with Prof. Caitlin Karver, where she worked to develop inhibitors for inflammatory caspases. Amanda is currently a Beckman Institute Graduate Fellow at UIUC where she is pursuing a PhD in Chemistry with Prof. Jeff Chan. Her research interests include the development of activatable 19F-MRSI contrast agents, and the development and evaluation of novel NIR-II dye platforms used in the context of cancer.
Biography
Melissa Y. Lucero.

Melissa Lucero graduated from University of Maryland in Baltimore County in 2017 with a major in Biochemistry and Molecular Biology. Prior to beginning graduate school, she worked in the Ptaszek Lab as a MARC U*STAR Scholar and at Stanford University in the McConnell Lab as an Amgen Scholar. Melissa is currently a Sloan Graduate Fellow and is pursuing her PhD in Chemistry with Prof. Jeff Chan. Her research interests include the development of PA probes for metal ion imaging and PA imaging-based companion diagnostics for lung cancer.
Biography
Jefferson Chan.

Prof. Jeff Chan completed his PhD at SFU with Prof. Andrew Bennet and postdoctoral training at UC Berkeley with Prof. Chris Chang. He began his independent career in 2014 at UIUC where he is currently an Assistant Professor of Chemistry. In 2015, he joined the Beckman Institute for Advanced Science and Technology as a faculty member. His research interests include developing acoustic-based imaging agents, chemical tools to study the role of reactive aldehydes in aging, and ABS probes for various sensing applications.
References
- Kikuchi K. Chem. Soc. Rev. 2010;39:2048–2053. doi: 10.1039/B819316A. [DOI] [PubMed] [Google Scholar]
- Kobayashi H. Longmire M. R. Ogawa M. Choyke P. L. Chem. Soc. Rev. 2011;40:4626–4648. doi: 10.1039/C1CS15077D. [DOI] [PMC free article] [PubMed] [Google Scholar]
- Gardner S. H. Reinhardt C. J. Chan J. Angew. Chem., Int. Ed. 2020 doi: 10.1002/anie.202003687. [DOI] [Google Scholar]
- Smith A. M. Mancini M. C. Nie S. Nat. Nanotechnol. 2009;4:710–711. doi: 10.1038/nnano.2009.326. [DOI] [PMC free article] [PubMed] [Google Scholar]
- Pansare V. J. Hejazi S. Faenza W. J. Prud'homme R. K. Chem. Mater. 2012;24:812–827. doi: 10.1021/cm2028367. [DOI] [PMC free article] [PubMed] [Google Scholar]
- Zhu S. Yung B. C. Chandra S. Niu G. Antaris A. L. Chen X. Theranostics. 2018;8:4141–4151. doi: 10.7150/thno.27995. [DOI] [PMC free article] [PubMed] [Google Scholar]
- Wang L. V. Hu S. Science. 2012;335:1458. doi: 10.1126/science.1216210. [DOI] [PMC free article] [PubMed] [Google Scholar]
- Vieira J. Pinto da Silva L. Esteves da Silva J. C. G. J. Photochem. Photobiol., B. 2012;117:33–39. doi: 10.1016/j.jphotobiol.2012.08.017. [DOI] [PubMed] [Google Scholar]
- Kaskova Z. M. Tsarkova A. S. Yampolsky I. V. Chem. Soc. Rev. 2016;45:6048–6077. doi: 10.1039/C6CS00296J. [DOI] [PubMed] [Google Scholar]
- Strack R. Nat. Methods. 2019;16:140. doi: 10.1038/s41592-019-0311-4. [DOI] [PubMed] [Google Scholar]
- Nomura N. Nishihara R. Nakajima T. Kim S. B. Iwasawa N. Hiruta Y. Nishiyama S. Sato M. Citterio D. Suzuki K. Anal. Chem. 2019;91:9546–9553. doi: 10.1021/acs.analchem.9b00694. [DOI] [PubMed] [Google Scholar]
- Gupta G. P. Nguyen D. X. Chiang A. C. Bos P. D. Kim J. Y. Nadal C. Gomis R. R. Manova-Todorova K. Massagué J. Nature. 2007;446:765–770. doi: 10.1038/nature05760. [DOI] [PubMed] [Google Scholar]
- Iwano S. Sugiyama M. Hama H. Watakabe A. Hasegawa N. Kuchimaru T. Tanaka K. Z. Takahashi M. Ishida Y. Hata J. Shimozono S. Namiki K. Fukano T. Kiyama M. Okano H. Kizaka-Kondoh S. McHugh T. J. Yamamori T. Hioki H. Maki S. Miyawaki A. Science. 2018;359:935. doi: 10.1126/science.aaq1067. [DOI] [PubMed] [Google Scholar]
- Jones K. A. Li D. J. Hui E. Sellmyer M. A. Prescher J. A. ACS Chem. Biol. 2015;10:933–938. doi: 10.1021/cb5007773. [DOI] [PubMed] [Google Scholar]
- Porterfield W. B. Jones K. A. McCutcheon D. C. Prescher J. A. J. Am. Chem. Soc. 2015;137:8656–8659. doi: 10.1021/jacs.5b02774. [DOI] [PubMed] [Google Scholar]
- Hansen T. B. Jensen T. I. Clausen B. H. Bramsen J. B. Finsen B. Damgaard C. K. Kjems J. Nature. 2013;495:384–388. doi: 10.1038/nature11993. [DOI] [PubMed] [Google Scholar]
- Ikeda Y. Nomoto T. Hiruta Y. Nishiyama N. Citterio D. Anal. Chem. 2020;92:4235–4243. doi: 10.1021/acs.analchem.9b04562. [DOI] [PubMed] [Google Scholar]
- Kuchimaru T. Iwano S. Kiyama M. Mitsumata S. Kadonosono T. Niwa H. Maki S. Kizaka-Kondoh S. Nat. Commun. 2016;7:11856. doi: 10.1038/ncomms11856. [DOI] [PMC free article] [PubMed] [Google Scholar]
- Mofford D. M. Adams S. T. Reddy G. S. K. K. Reddy G. R. Miller S. C. J. Am. Chem. Soc. 2015;137:8684–8687. doi: 10.1021/jacs.5b04357. doi: 10.1021/jacs.5b04357. [DOI] [PMC free article] [PubMed] [Google Scholar]
- Cravatt B. F. Giang D. K. Mayfield S. P. Boger D. L. Lerner R. A. Gilula N. B. Nature. 1996;384:83–87. doi: 10.1038/384083a0. [DOI] [PubMed] [Google Scholar]
- Ahn K. Johnson D. S. Cravatt B. F. Expert Opin. Drug Discovery. 2009;4:763–784. doi: 10.1517/17460440903018857. [DOI] [PMC free article] [PubMed] [Google Scholar]
- Long J. Z. LaCava M. Jin X. Cravatt B. F. J. Lipid Res. 2011;52:337–344. doi: 10.1194/jlr.M012153. [DOI] [PMC free article] [PubMed] [Google Scholar]
- Yapa U. Prusakiewicz J. J. Wrightstone A. D. Christine L. J. Palandra J. Groeber E. Wittwer A. J. Anal. Biochem. 2012;421:556–565. doi: 10.1016/j.ab.2011.10.042. [DOI] [PubMed] [Google Scholar]
- Ahn K. Johnson D. S. Mileni M. Beidler D. Long J. Z. McKinney M. K. Weerapana E. Sadagopan N. Liimatta M. Smith S. E. Lazerwith S. Stiff C. Kamtekar S. Bhattacharya K. Zhang Y. Swaney S. Van Becelaere K. Stevens R. C. Cravatt B. F. Chem. Biol. 2009;16:411–420. doi: 10.1016/j.chembiol.2009.02.013. [DOI] [PMC free article] [PubMed] [Google Scholar]
- Clapper J. R. Moreno-Sanz G. Russo R. Guijarro A. Vacondio F. Duranti A. Tontini A. Sanchini S. Sciolino N. R. Spradley J. M. Hohmann A. G. Calignano A. Mor M. Tarzia G. Piomelli D. Nat. Neurosci. 2010;13:1265–1270. doi: 10.1038/nn.2632. [DOI] [PMC free article] [PubMed] [Google Scholar]
- Mao D. Wu W. Ji S. Chen C. Hu F. Kong D. Ding D. Liu B. Chem. 2017;3:991–1007. [Google Scholar]
- Khan P. Idrees D. Moxley M. A. Corbett J. A. Ahmad F. von Figura G. Sly W. S. Waheed A. Hassan M. I. Appl. Biochem. Biotechnol. 2014;173:333–355. doi: 10.1007/s12010-014-0850-1. [DOI] [PMC free article] [PubMed] [Google Scholar]
- Gnaim S. Green O. Shabat D. Chem. Commun. 2018;54:2073–2085. doi: 10.1039/C8CC00428E. [DOI] [PubMed] [Google Scholar]
- Hananya N. Shabat D. ACS Cent. Sci. 2019;5:949–959. doi: 10.1021/acscentsci.9b00372. [DOI] [PMC free article] [PubMed] [Google Scholar]
- Green O. Eilon T. Hananya N. Gutkin S. Bauer C. R. Shabat D. ACS Cent. Sci. 2017;3:349–358. doi: 10.1021/acscentsci.7b00058. [DOI] [PMC free article] [PubMed] [Google Scholar]
- An W. Ryan L. S. Reeves A. G. Bruemmer K. J. Mouhaffel L. Gerberich J. L. Winters A. Mason R. P. Lippert A. R. Angew. Chem., Int. Ed. 2019;58:1361–1365. doi: 10.1002/anie.201811257. [DOI] [PMC free article] [PubMed] [Google Scholar]
- Cao J. Lopez R. Thacker J. M. Moon J. Y. Jiang C. Morris S. N. S. Bauer J. H. Tao P. Mason R. P. Lippert A. R. Chem. Sci. 2015;6:1979–1985. doi: 10.1039/C4SC03516J. [DOI] [PMC free article] [PubMed] [Google Scholar]
- Cao J. Campbell J. Liu L. Mason R. P. Lippert A. R. Anal. Chem. 2016;88:4995–5002. doi: 10.1021/acs.analchem.6b01096. [DOI] [PMC free article] [PubMed] [Google Scholar]
- Son S. Won M. Green O. Hananya N. Sharma A. Jeon Y. Kwak J. H. Sessler J. L. Shabat D. Kim J. S. Angew. Chem., Int. Ed. 2019;58:1739–1743. doi: 10.1002/anie.201813032. [DOI] [PubMed] [Google Scholar]
- Eilon-Shaffer T. Roth-Konforti M. Eldar-Boock A. Satchi-Fainaro R. Shabat D. Org. Biomol. Chem. 2018;16:1708–1712. doi: 10.1039/C8OB00087E. [DOI] [PubMed] [Google Scholar]
- Green O. Gnaim S. Blau R. Eldar-Boock A. Satchi-Fainaro R. Shabat D. J. Am. Chem. Soc. 2017;139:13243–13248. doi: 10.1021/jacs.7b08446. [DOI] [PubMed] [Google Scholar]
- Bruemmer K. J. Green O. Su T. A. Shabat D. Chang C. J. Angew. Chem., Int. Ed. 2018;57:7508–7512. doi: 10.1002/anie.201802143. [DOI] [PMC free article] [PubMed] [Google Scholar]
- Heck H. d. A. Casanova-Schm1Tz M. Dodd P. B. Schachter E. N. Witek T. J. Tosun T. Am. Ind. Hyg. Assoc. J. 1985;46:1–3. doi: 10.1080/15298668591394275. [DOI] [PubMed] [Google Scholar]
- Luo W. Li H. Zhang Y. Ang C. Y. W. J. Chromatogr. B: Biomed. Sci. Appl. 2001;753:253–257. doi: 10.1016/S0378-4347(00)00552-1. [DOI] [PubMed] [Google Scholar]
- Shi Y. Lan F. Matson C. Mulligan P. Whetstine J. R. Cole P. A. Casero R. A. Shi Y. Cell. 2004;119:941–953. doi: 10.1016/j.cell.2004.12.012. [DOI] [PubMed] [Google Scholar]
- Smaga L. P. Pino N. W. Ibarra G. E. Krishnamurthy V. Chan J. J. Am. Chem. Soc. 2020;142:680–684. doi: 10.1021/jacs.9b11899. [DOI] [PMC free article] [PubMed] [Google Scholar]
- Brewer T. F. Chang C. J. J. Am. Chem. Soc. 2015;137:10886–10889. doi: 10.1021/jacs.5b05340. [DOI] [PubMed] [Google Scholar]
- Roth A. Li H. Anorma C. Chan J. J. Am. Chem. Soc. 2015;137:10890–10893. doi: 10.1021/jacs.5b05339. [DOI] [PubMed] [Google Scholar]
- Burgos-Barragan G. Wit N. Meiser J. Dingler F. A. Pietzke M. Mulderrig L. Pontel L. B. Rosado I. V. Brewer T. F. Cordell R. L. Monks P. S. Chang C. J. Vazquez A. Patel K. J. Nature. 2017;548:549–554. doi: 10.1038/nature23481. [DOI] [PMC free article] [PubMed] [Google Scholar]
- Zhang Y. Yan C. Wang C. Guo Z. Liu X. Zhu W.-H. Angew. Chem., Int. Ed. 2020;59:9059–9066. doi: 10.1002/anie.202000165. [DOI] [PubMed] [Google Scholar]
- Carter K. P. Young A. M. Palmer A. E. Chem. Rev. 2014;114:4564–4601. doi: 10.1021/cr400546e. [DOI] [PMC free article] [PubMed] [Google Scholar]
- Lou Z. Li P. Han K. Acc. Chem. Res. 2015;48:1358–1368. doi: 10.1021/acs.accounts.5b00009. [DOI] [PubMed] [Google Scholar]
- Hou J.-T. Yu K.-K. Sunwoo K. Kim W. Y. Koo S. Wang J. Ren W. X. Wang S. Yu X.-Q. Kim J. S. Chem. 2020;6:832–866. [Google Scholar]
- Jiao X. Li Y. Niu J. Xie X. Wang X. Tang B. Anal. Chem. 2018;90:533–555. doi: 10.1021/acs.analchem.7b04234. [DOI] [PubMed] [Google Scholar]
- Ohata J. Bruemmer K. J. Chang C. J. Acc. Chem. Res. 2019;52:2841–2848. doi: 10.1021/acs.accounts.9b00386. [DOI] [PMC free article] [PubMed] [Google Scholar]
- Weissleder R. Tung C.-H. Mahmood U. Bogdanov A. Nat. Biotechnol. 1999;17:375–378. doi: 10.1038/7933. [DOI] [PubMed] [Google Scholar]
- Zhang J. Cheng P. Pu K. Bioconjugate Chem. 2019;30:2089–2101. doi: 10.1021/acs.bioconjchem.9b00391. [DOI] [PubMed] [Google Scholar]
- Yang C. Wang Q. Ding W. RSC Adv. 2019;9:25285–25302. doi: 10.1039/C9RA04508B. [DOI] [PMC free article] [PubMed] [Google Scholar]
- Sun C. Du W. Wang B. Dong B. Wang B. BMC Chem. 2020;14:21. doi: 10.1186/s13065-020-00677-3. [DOI] [PMC free article] [PubMed] [Google Scholar]
- Yuan L. Lin W. Zhao S. Gao W. Chen B. He L. Zhu S. J. Am. Chem. Soc. 2012;134:13510–13523. doi: 10.1021/ja305802v. [DOI] [PubMed] [Google Scholar]
- Zhao M. Guo Y.-S. Xu W.-N. Zhao Y.-F. Xie H.-Y. Li H.-J. Chen X.-F. Zhao R.-S. Guo D.-S. TrAC, Trends Anal. Chem. 2020;122:115704. doi: 10.1016/j.trac.2019.115704. [DOI] [Google Scholar]
- Karton-Lifshin N. Albertazzi L. Bendikov M. Baran P. S. Shabat D. J. Am. Chem. Soc. 2012;134:20412–20420. doi: 10.1021/ja308124q. [DOI] [PubMed] [Google Scholar]
- Karton-Lifshin N. Segal E. Omer L. Portnoy M. Satchi-Fainaro R. Shabat D. J. Am. Chem. Soc. 2011;133:10960–10965. doi: 10.1021/ja203145v. [DOI] [PubMed] [Google Scholar]
- Kobayashi H. Ogawa M. Alford R. Choyke P. L. Urano Y. Chem. Rev. 2010;110:2620–2640. doi: 10.1021/cr900263j. [DOI] [PMC free article] [PubMed] [Google Scholar]
- Li X. Gao X. Shi W. Ma H. Chem. Rev. 2014;114:590–659. doi: 10.1021/cr300508p. [DOI] [PubMed] [Google Scholar]
- Hong G. Antaris A. L. Dai H. Nat. Biomed. Eng. 2017;1:0010. doi: 10.1038/s41551-016-0010. [DOI] [Google Scholar]
- Huang J. Jiang Y. Li J. He S. Huang J. Pu K. Angew. Chem., Int. Ed. 2020;59:4415–4420. doi: 10.1002/anie.201911859. [DOI] [PubMed] [Google Scholar]
- Bauvois B. Dauzonne D. Med. Res. Rev. 2006;26:88–130. doi: 10.1002/med.20044. [DOI] [PMC free article] [PubMed] [Google Scholar]
- Taylor J. M. Yaneva M. Velasco K. Philip J. Erdjument-Bromage H. Ostrovnaya I. Lilja H. G. Bochner B. H. Tempst P. Proteomics: Clin. Appl. 2014;8:317–326. doi: 10.1002/prca.201300118. [DOI] [PMC free article] [PubMed] [Google Scholar]
- Wang X. Liu Y. Liu W. Zhang Y. Guo F. Zhang L. Cui M. Liu S. Wu R. Mol. Med. Rep. 2018;17:4531–4539. doi: 10.3892/mmr.2018.8402. [DOI] [PMC free article] [PubMed] [Google Scholar]
- He X. Hu Y. Shi W. Li X. Ma H. Chem. Commun. 2017;53:9438–9441. doi: 10.1039/C7CC05142E. [DOI] [PubMed] [Google Scholar]
- He X. Xu Y. Shi W. Ma H. Anal. Chem. 2017;89:3217–3221. doi: 10.1021/acs.analchem.7b00021. [DOI] [PubMed] [Google Scholar]
- Nani R. R. Kelley J. A. Ivanic J. Schnermann M. J. Chem. Sci. 2015;6:6556–6563. doi: 10.1039/C5SC02396C. [DOI] [PMC free article] [PubMed] [Google Scholar]
- Oushiki D. Kojima H. Terai T. Arita M. Hanaoka K. Urano Y. Nagano T. J. Am. Chem. Soc. 2010;132:2795–2801. doi: 10.1021/ja910090v. [DOI] [PubMed] [Google Scholar]
- Walsh J. S. Miwa G. T. Annu. Rev. Pharmacol. Toxicol. 2011;51:145–167. doi: 10.1146/annurev-pharmtox-010510-100514. [DOI] [PubMed] [Google Scholar]
- Shuhendler A. J. Pu K. Cui L. Uetrecht J. P. Rao J. Nat. Biotechnol. 2014;32:373–380. doi: 10.1038/nbt.2838. [DOI] [PMC free article] [PubMed] [Google Scholar]
- Cheng D. Peng J. Lv Y. Su D. Liu D. Chen M. Yuan L. Zhang X. J. Am. Chem. Soc. 2019;141:6352–6361. doi: 10.1021/jacs.9b01374. [DOI] [PubMed] [Google Scholar]
- Tao Z. Hong G. Shinji C. Chen C. Diao S. Antaris A. L. Zhang B. Zou Y. Dai H. Angew. Chem., Int. Ed. 2013;52:13002–13006. doi: 10.1002/anie.201307346. [DOI] [PubMed] [Google Scholar]
- Cosco E. D. Caram J. R. Bruns O. T. Franke D. Day R. A. Farr E. P. Bawendi M. G. Sletten E. M. Angew. Chem., Int. Ed. 2017;56:13126–13129. doi: 10.1002/anie.201706974. [DOI] [PubMed] [Google Scholar]
- Antaris A. L. Chen H. Cheng K. Sun Y. Hong G. Qu C. Diao S. Deng Z. Hu X. Zhang B. Zhang X. Yaghi O. K. Alamparambil Z. R. Hong X. Cheng Z. Dai H. Nat. Mater. 2016;15:235–242. doi: 10.1038/nmat4476. [DOI] [PubMed] [Google Scholar]
- Ding F. Fan Y. Sun Y. Zhang F. Adv. Healthcare Mater. 2019;8:1900260. doi: 10.1002/adhm.201900260. [DOI] [PubMed] [Google Scholar]
- Li J. Liu Y. Xu Y. Li L. Sun Y. Huang W. Coord. Chem. Rev. 2020;415:213318. doi: 10.1016/j.ccr.2020.213318. [DOI] [Google Scholar]
- Teng L. Song G. Liu Y. Han X. Li Z. Wang Y. Huan S. Zhang X.-B. Tan W. J. Am. Chem. Soc. 2019;141:13572–13581. doi: 10.1021/jacs.9b05901. [DOI] [PubMed] [Google Scholar]
- Ouyang J. Sun L. Zeng Z. Zeng C. Zeng F. Wu S. Angew. Chem., Int. Ed. 2020;59:10111–10121. doi: 10.1002/anie.201913149. [DOI] [PubMed] [Google Scholar]
- Li D. Wang S. Lei Z. Sun C. El-Toni A. M. Alhoshan M. S. Fan Y. Zhang F. Anal. Chem. 2019;91:4771–4779. doi: 10.1021/acs.analchem.9b00317. [DOI] [PubMed] [Google Scholar]
- Feng W. Zhang Y. Li Z. Zhai S. Lv W. Liu Z. Anal. Chem. 2019;91:15757–15762. doi: 10.1021/acs.analchem.9b04002. [DOI] [PubMed] [Google Scholar]
- Lei Z. Sun C. Pei P. Wang S. Li D. Zhang X. Zhang F. Angew. Chem., Int. Ed. 2019;58:8166–8171. doi: 10.1002/anie.201904182. [DOI] [PubMed] [Google Scholar]
- Li C. Li W. Liu H. Zhang Y. Chen G. Li Z. Wang Q. Angew. Chem., Int. Ed. 2020;59:247–252. doi: 10.1002/anie.201911803. [DOI] [PubMed] [Google Scholar]
- Wang S. Fan Y. Li D. Sun C. Lei Z. Lu L. Wang T. Zhang F. Nat. Commun. 2019;10:1058. doi: 10.1038/s41467-019-09043-x. [DOI] [PMC free article] [PubMed] [Google Scholar]
- Chen S.-x. Schopfer P. Eur. J. Biochem. 1999;260:726–735. doi: 10.1046/j.1432-1327.1999.00199.x. [DOI] [PubMed] [Google Scholar]
- Khojah H. M. Ahmed S. Abdel-Rahman M. S. Hamza A.-B. Free Radicals Biol. Med. 2016;97:285–291. doi: 10.1016/j.freeradbiomed.2016.06.020. [DOI] [PubMed] [Google Scholar]
- Santanam N. Ramachandran S. Parthasarathy S. Semin. Reprod. Med. 1998;16:275–280. doi: 10.1055/s-2007-1016287. [DOI] [PubMed] [Google Scholar]
- Weber J. Beard P. C. Bohndiek S. E. Nat. Methods. 2016;13:639–650. doi: 10.1038/nmeth.3929. [DOI] [PubMed] [Google Scholar]
- Reinhardt C. J. Chan J. Biochemistry. 2018;57:194–199. doi: 10.1021/acs.biochem.7b00888. [DOI] [PMC free article] [PubMed] [Google Scholar]
- Knox H. J. Chan J. Acc. Chem. Res. 2018;51:2897–2905. doi: 10.1021/acs.accounts.8b00351. [DOI] [PMC free article] [PubMed] [Google Scholar]
- Zhou E. Y. Knox H. J. Liu C. Zhao W. Chan J. J. Am. Chem. Soc. 2019;141:17601–17609. doi: 10.1021/jacs.9b06694. [DOI] [PMC free article] [PubMed] [Google Scholar]
- Li H. Zhang P. Smaga L. P. Hoffman R. A. Chan J. J. Am. Chem. Soc. 2015;137:15628–15631. doi: 10.1021/jacs.5b10504. [DOI] [PubMed] [Google Scholar]
- Knox H. J. Hedhli J. Kim T. W. Khalili K. Dobrucki L. W. Chan J. Nat. Commun. 2017;8:1794. doi: 10.1038/s41467-017-01951-0. [DOI] [PMC free article] [PubMed] [Google Scholar]
- Knox H. J. Kim T. W. Zhu Z. Chan J. ACS Chem. Biol. 2018;13:1838–1843. doi: 10.1021/acschembio.8b00099. [DOI] [PubMed] [Google Scholar]
- Reinhardt C. J. Zhou E. Y. Jorgensen M. D. Partipilo G. Chan J. J. Am. Chem. Soc. 2018;140:1011–1018. doi: 10.1021/jacs.7b10783. [DOI] [PMC free article] [PubMed] [Google Scholar]
- Reinhardt C. J. Xu R. Chan J. Chem. Sci. 2020;11:1587–1592. doi: 10.1039/C9SC05600A. [DOI] [Google Scholar]
- Zhang D. Qi G.-B. Zhao Y.-X. Qiao S.-L. Yang C. Wang H. Adv. Mater. 2015;27:6125–6130. doi: 10.1002/adma.201502598. [DOI] [PubMed] [Google Scholar]
- Qin H. Zhao Y. Zhang J. Pan X. Yang S. Xing D. Nanomedicine. 2016;12:1765–1774. doi: 10.1016/j.nano.2016.02.016. [DOI] [PubMed] [Google Scholar]
- Yang K. Zhu L. Nie L. Sun X. Cheng L. Wu C. Niu G. Chen X. Liu Z. Theranostics. 2014;4:134–141. doi: 10.7150/thno.7217. [DOI] [PMC free article] [PubMed] [Google Scholar]
- Dragulescu-Andrasi A. Kothapalli S.-R. Tikhomirov G. A. Rao J. Gambhir S. S. J. Am. Chem. Soc. 2013;135:11015–11022. doi: 10.1021/ja4010078. [DOI] [PMC free article] [PubMed] [Google Scholar]
- Zackrisson S. Van De Ven S. Gambhir S. Cancer Res. 2014;74:979–1004. doi: 10.1158/0008-5472.CAN-13-2387. [DOI] [PMC free article] [PubMed] [Google Scholar]
- Luke G. P. Yeager D. Emelianov S. Y. Ann. Biomed. Eng. 2012;40:422–437. doi: 10.1007/s10439-011-0449-4. [DOI] [PubMed] [Google Scholar]
- Upputuri P. K. Pramanik M. WIREs Nanomedicine and Nanobiotechnology. 2020:e1618. doi: 10.1002/wnan.1618. [DOI] [PubMed] [Google Scholar]; , in press
- Nagano T. Yoshimura T. Chem. Rev. 2002;102:1235–1270. doi: 10.1021/cr010152s. [DOI] [PubMed] [Google Scholar]
- Sharma R. Seo J.-W. Kwon S. J. Nanomater. 2014;2014:523646. [Google Scholar]
- Li H. Wan A. Analyst. 2015;140:7129–7141. doi: 10.1039/C5AN01628B. [DOI] [PubMed] [Google Scholar]
- Wang S. Li Z. Liu Y. Feng G. Zheng J. Yuan Z. Zhang X. Sens. Actuators, B. 2018;267:403–411. doi: 10.1016/j.snb.2018.04.052. [DOI] [Google Scholar]
- Giustarini D. Galvagni F. Tesei A. Farolfi A. Zanoni M. Pignatta S. Milzani A. Marone I. M. Dalle-Donne I. Nassini R. Rossi R. Free Radicals Biol. Med. 2015;89:972–981. doi: 10.1016/j.freeradbiomed.2015.10.410. [DOI] [PubMed] [Google Scholar]
- Lucero M. Chan J. ChemRxiv. 2020 doi: 10.26434/chemrxiv.11888214.v1. [DOI] [Google Scholar]
- Turpeenniemi-Hujanen T. Biochimie. 2005;87:287–297. doi: 10.1016/j.biochi.2005.01.014. [DOI] [PubMed] [Google Scholar]
- Levi J. Kothapalli S. R. Ma T.-J. Hartman K. Khuri-Yakub B. T. Gambhir S. S. J. Am. Chem. Soc. 2010;132:11264–11269. doi: 10.1021/ja104000a. [DOI] [PMC free article] [PubMed] [Google Scholar]
- Razansky D. Harlaar N. J. Hillebrands J. L. Taruttis A. Herzog E. Zeebregts C. J. van Dam G. M. Ntziachristos V. Mol. Imaging Biol. 2012;14:277–285. doi: 10.1007/s11307-011-0502-6. [DOI] [PMC free article] [PubMed] [Google Scholar]
- Levi J. Kothapalli S.-R. Bohndiek S. Yoon J.-K. Dragulescu-Andrasi A. Nielsen C. Tisma A. Bodapati S. Gowrishankar G. Yan X. Clin. Cancer Res. 2013;19:1494–1502. doi: 10.1158/1078-0432.CCR-12-3061. [DOI] [PMC free article] [PubMed] [Google Scholar]
- Yang K. Zhu L. Nie L. Sun X. Cheng L. Wu C. Niu G. Chen X. Liu Z. Theranostics. 2014;4:134. doi: 10.7150/thno.7217. [DOI] [PMC free article] [PubMed] [Google Scholar]
- Yin L. Sun H. Zhang H. He L. Qiu L. Lin J. Xia H. Zhang Y. Ji S. Shi H. Gao M. J. Am. Chem. Soc. 2019;141:3265–3273. doi: 10.1021/jacs.8b13628. [DOI] [PubMed] [Google Scholar]
- Ma T. Hou Y. Zeng J. Liu C. Zhang P. Jing L. Shangguan D. Gao M. J. Am. Chem. Soc. 2018;140:211–218. doi: 10.1021/jacs.7b08900. [DOI] [PubMed] [Google Scholar]
- Maeda H. Khatami M. Clin. Transl. Med. 2018;7:11. doi: 10.1186/s40169-018-0185-6. [DOI] [PMC free article] [PubMed] [Google Scholar]
- Day C.-P. Merlino G. Van Dyke T. Cell. 2015;163:39–53. doi: 10.1016/j.cell.2015.08.068. [DOI] [PMC free article] [PubMed] [Google Scholar]
- Zon L. I. Peterson R. T. Nat. Rev. Drug Discovery. 2005;4:35–44. doi: 10.1038/nrd1606. [DOI] [PubMed] [Google Scholar]
- Sun C. Li B. Zhao M. Wang S. Lei Z. Lu L. Zhang H. Feng L. Dou C. Yin D. Xu H. Cheng Y. Zhang F. J. Am. Chem. Soc. 2019;141:19221–19225. doi: 10.1021/jacs.9b10043. [DOI] [PubMed] [Google Scholar]
- Chen W. Cheng C.-A. Cosco E. D. Ramakrishnan S. Lingg J. G. P. Bruns O. T. Zink J. I. Sletten E. M. J. Am. Chem. Soc. 2019;141:12475–12480. doi: 10.1021/jacs.9b05195. [DOI] [PMC free article] [PubMed] [Google Scholar]
- Li B. Lu L. Zhao M. Lei Z. Zhang F. Angew. Chem., Int. Ed. 2018;57:7483–7487. doi: 10.1002/anie.201801226. [DOI] [PubMed] [Google Scholar]


