

Abstract
Heparin/heparan sulfates (H/HS) are ubiquitous biopolymers that interact with many proteins to induce a range of biological functions. Unfortunately, how these biopolymers recognize their preferred protein targets remain poorly understood. It is suggested that computational simulations offer attractive avenues but a number of challenges, e.g., difficulty of selecting a comprehensive force field, few simple tools to interpret data, among others, remain. This work addresses several such challenges so as to help ease the implementation and analysis of computational experiments. First, this work presents a rigorous comparison of two different recent force fields, CHARMM36 and GLYCAM06, for H/HS studies. Second, it introduces two new straightforward parameters, i.e., end-to-end distance and minimum volume enclosing ellipsoid, to understand the myriad conformational forms of oligosaccharides that evolve over time in water. Third, it presents an application to elucidate the number and nature of inter and intramolecular, nondirect bridging water molecules, which help stabilize unique forms of H/HS. The results show that nonspecialists can use either CHARMM36 or GLYCAM06 force fields because both gave comparable results, albeit with small differences. The comparative study shows that the HS hexasaccharide samples a range of conformations with nearly equivalent energies, which could be the reason for its recognition by different proteins. Finally, analysis of the nondirect water bridges across the dynamics trajectory shows their importance in stabilization of certain conformational forms, which may become important for protein recognition. Overall, the work aids nonspecialists employ computational studies for understanding the solution behavior of H/HS.
Keywords: carbohydrates, conformational analysis, energy landscape, heparan sulfate, molecular dynamics
Introduction
Heparin/heparan sulfate (H/HS) are linear polysaccharides that bind many proteins and induce important biological functions such as growth, differentiation, inflammation, adhesion, and many more (Meneghetti et al. 2015; Monneau et al. 2016; Mulloy et al. 2015; Sankaranarayanan and Desai 2014; Xu and Esko 2014). The affinity and specificity of these highly anionic biopolymers for their protein targets appear to arise from their different microstructures, especially in the constituent tetra- and hexa saccharide blocks consisting of sulfated and nonsulfated iduronic acid (IdoA)/glucuronic acid (GlcA) and glucosamine (GlcN) residues (Figure 1) (Esko and Linhardt 2009; Mosier et al. 2012). In fact, the number of sequence variations possible for these oligosaccharides is high, which introduces challenges in studying individual sequences (Powell et al. 2004).
Fig. 1.

Structure of heparin/heparan sulfate (H/HS) sequences: Two-dimensional representation of (A) the H/HS polymer and (B) the of H/HS hexasaccharide sequence with possible variations. Three-dimensional representations of (C) the disaccharide unit of 1HPN and (D) the hexasaccharide sequence extracted from 1HPN for studies reported in this work. The IdoA2S in position a, c and e can take either 2SO or 1C4 puckering. The GlcNS6S at b, d and f will always be in 4C1 puckering. The definitions of phi and psi torsions are listed in (C).
Theoretically, in silico techniques such as molecular modeling (MM) and molecular dynamics (MD) are very attractive for understanding how sequence and conformational variations dictate protein-binding properties. Both MM and MD are relatively inexpensive techniques and can help screen large number of sequences for desired properties, especially the propensity to recognize a site of binding on a target protein (Samsonov et al. 2014a; Sankaranarayanan et al. 2017). Both MM and MD can deduce atomistic information, which helps predict the affinity of an oligosaccharide for the target protein (Gandhi and Mancera 2009; Gehrcke and Pisabarro 2015; Sapay et al. 2011; Sepuru et al. 2016), a key parameter for understanding structure–function relationships. Of these, MD is especially suited for determining contributions of various conformational forms of an oligosaccharide, which turns out to be difficult to deduce using other biophysical techniques (Childers and Daggett 2017; Sattelle et al. 2010; Sattelle et al. 2013).
Both MM and MD require the use of a force field, which is a set of equations and parameters that define the state and movement of individual atoms of a molecule in either vacuum or water (McDaniel and Schmidt 2016; Monticelli and Tieleman 2013). The development of force fields tailored to glycans has lagged behind that for proteins and nucleic acids (Foley et al. 2012) and only recently has reached a level of maturity that enables a comprehensive study on all possible functional groups of GAGs including N- and O-sulfonates and unsaturated uronic acids (Singh et al. 2016). This has been achieved following decades of work, which has helped fine tune force field parameters (Ferro et al. 1997; Huige and Altona 1995; Mulloy et al. 1993; Oborský et al. 2013; Ragazzi et al. 1986). These studies include oligosaccharides in both free and protein-bound forms (Ballut et al. 2013; Becker et al. 2005; Gandhi and Mancera 2010; Muñoz-García et al. 2013a; Muñoz-García et al. 2012; Pol-Fachin and Verli 2008; Samsonov et al. 2011; Samsonov et al. 2014b; Sapay et al. 2011; Sattelle et al. 2010; Sattelle et al. 2013; Verli and Guimarães 2004). Although further developments are to be expected, a major culmination of this effort for nonspecialists is the development of three preferred force fields—GLYCAM, CHARMM and GROMOS—that purport to offer insight into the behavior of GAGs in solution (Guvench et al. 2011; Kirschner et al. 2008; Lins and Hunenberger 2005; Pol-Fachin et al. 2012).
Yet, MD remains a forte of few. The problem is compounded further because H/HS sequences are deceptively simple. In addition to large number of sequence possibilities, an even larger number of conformational forms are possible owing to the flexibility of IdoA residues (Casu et al. 1988; Soares et al. 2017), the inter-glycosidic bond and the intrachain water-mediated interactions (Muñoz-García et al. 2013b; Muñoz-García et al. 2012; Pol-Fachin and Verli 2008). Unfortunately, appropriate tools that help decipher the importance of these structural variations are not available, which introduces major challenges.
We undertook this work to help ease the implementation and analysis of 1 μs long MD simulations on heparan sulfate hexasaccharide (HS06) sequences carrying IdoA2S residues in either 2SO or 1C4 forms. To enable a rigorous comparison of two recent force fields, CHARMM36 and GLYCAM06, we introduce two new straightforward parameters, i.e., end-to-end distance (EED) and minimum volume enclosing ellipsoid (MVEE), for parsing conformational forms. We also present an application to elucidate the number and nature of intramolecular, nondirect, bridging water molecules, which help stabilize unique forms of H/HS. The results show that nonspecialists can use either CHARMM36 or GLYCAM06 force fields because both gave comparable results, albeit with small differences. The comparative study shows that the HS hexasaccharide samples a range of conformations with nearly equivalent energies, which could be the reason for its recognition of by different proteins. Finally, analysis of the nondirect water bridges across the dynamics trajectory shows their importance in stabilization of certain conformational forms, which may become important for protein recognition. Overall, the work aids nonspecialists employ computational studies for understanding the solution behavior of H/HS.
Materials and methods
Selection of force fields
Of the three major force fields, we selected GLYCAM06 and CHARMM36 for the current study because of recent additions of parameters, e.g., N-sulfamate (CHARMM) (Sarkar et al. 2016) and Δ4,5 unsaturated uronic acid (GLYCAM) (Singh et al. 2016). MD simulations were performed using NAMD program 2.9 employing CHARMM36 force field (Phillips et al. 2005), whereas simulations employing GLYCAM06 were performed using the AMBER simulation package (Case et al. 2005).
GLYCAM06/AMBER preparation step
AMBER18 (Case et al. 2018) with GLYCAM06 force field parameters (Kirschner et al. 2008) were used for MD studies of HS06 in explicit water. The initial structural coordinates were extracted from the experimental nuclear magnetic resonance imaging (NMR) structure (ID: 1HPN) reported in the protein data bank (PDB) (Mulloy et al. 1993). The structure has a repeating disaccharide units of (IdoA2S-GlcNS6S)3 with IdoA2S in skew boat 2SO conformation (Figure 1). The building blocks for this sequence were identified from the library in GLYCAM and appropriate residue/atom labels were renamed to match the parameter files (refer to http://glycam.org/docs/forcefield/glycam-naming-2/). The HS06 structure was loaded in xleap and analyzed for the glycosidic linkage connectivity as well as preferred atom- and residue-types using the ‘edit’ function in xleap (see http://ambermd.org/tutorials/). This was followed by ensuring that the overall charge of HS06 is −12 using the “charge” command and adding 12 Na+ counter ions to ensure an overall net charge of zero. The system was then solvated using TIP3P water molecules using the “solvatebox” function, wherein the distance between any atom of HS06 and the nearest box wall was 10 Å (Case et al. 2018). The initial parameter and topology for the system were saved for future steps. These details are presented as a flow chart in Supplementary Material Figure S1. This procedure was repeated for the HS06 sequence carrying IdoA2S in 1C4 form starting from the NMR-derived (ID: 1HPN) to the generation of the parameter and topology in a 10 Å solvated box.
GLYCAM06/AMBER minimization step
Following setup of initial parameters and coordinate files, a two-step minimization procedure was implemented. In the first step, the solute and the Na+ ions were restrained using a harmonic potential of 100 kcal/(mol Å2). The water molecules were relaxed using 500 cycles of steepest descent and 1500 cycles of conjugate gradient method. In the second step, the whole system was relaxed to 2500 cycles of conjugate gradient minimization. The system was then brought to a constant temperature of 300 K using the temperature coupling with a time constant of 2 fs followed by achievement of a constant pressure of 1 atm. Finally, the system was equilibrated to NPT. These phases were implemented for a total time period of 1 ns with 2 fs of integration time step.
GLYCAM06/AMBER MD run
Following minimization, MD simulations were initiated for a total time period of one microsecond (integration time step = 2 fs) during which ensemble coordinates were collected every 10 ps. During this simulation, the periodic boundary condition, particle-mesh Ewald method and a nonbonded cutoff of 12 Å were employed. The covalent bonds involving hydrogen atoms were constrained using SHAKE algorithm available in Amber throughout the simulation. A weak torsional restrain was applied to maintain 2SO and 1C4 puckering of IdoA2S throughout the simulation for the respective HS06 sequence, as implemented earlier (Hsieh et al. 2016; Verli and Guimarães 2004).
CHARMM36/NAMD preparation step
The initial HS06 structure used in CHARMM36/NAMD experiments was the same as that for GLYCAM06/AMBER studies (Figure 1), except that residue and atom labeling corresponds to the CHARMM36 program (see http://mackerell.umaryland.edu/charmm_ff.shtml). The structure of HS06 was loaded in VMD using the ‘Tk’ console with par_all36_carb.prm topology file (http://mackerell.umaryland.edu/charmm_ff.shtml) (Humphrey et al. 1996). The patches for sulfate groups were introduced and the structure validated to ensure absence of errors. The total charge on the system was then ascertained using the protein structure file (psf), the coordinate file (pdb) and the ‘get_total_charge’ script from VMD archive library (http://www.ks.uiuc.edu/Research/vmd/script_library/scripts/total_charge), which gave an integral value of −12, as expected. HS06 was then solvated using the ‘solvate’ package using TIP3P box measuring at least 10 Å from an HS06 atom to the nearest box wall. Finally, 12 Na+ cations were added using the ‘autoionize’ function to neutralize the system. The initial protein structure (psf) and the coordinate (pdb) files of HS06 in water were saved for further procedures (see Supplementary Figure S1).
CHARMM36/NAMD minimization step
CHARMM36/NAMD minimization was performed in two steps, as described for minimization in GLYCAM06/AMBER (above). Briefly, each step involved a total of 2000 conjugate gradient steps. The system was equilibrated in three steps to constant temperature 300 K and pressure of 1 atm in an NPT ensemble for a total of 1 ns, with integration time step being 1 fs.
CHARMM36/NAMD MD run
Following equilibration, an unrestrained MD simulation was performed for one microsecond and the MD trajectory stored for every 10 ps with 1 fs integration time step. A weak torsional restrain was applied to maintain the 2SO and 1C4 puckers for IdoA2S residue throughout the simulation, as described earlier (Hsieh et al. 2016; Verli and Guimarães 2004). Periodic boundary conditions, particle-mesh Ewald method and a nonbonded cutoff 12 Å with a switch distance of 8.5 Å were employed in MD runs. The covalent bonds involving hydrogen atoms were constrained using the SHAKE algorithm throughout the simulation. The simulation procedure was implemented for HS06 with IdoA2S in either skew boat 2SO or chair 1C4 conformations.
Analysis of MD data from CHARMM36/NAMD and GLYCAM06/AMBER14 runs
Standard protocols from AMBER and NAMD were used for analyzing MD runs. We studied conformations of HS06 using two tools, namely EED (Figure 2A) and MVEE (Figure 2C). In-house scripts were developed for automated extraction of EED and MVEE from the conformers generated in the MD runs (Nagarajan et al. 2017). We also analyzed backbone torsional angles and inter- and intramolecular hydrogen bonds for every conformer that arose during MD run for both the force fields. In addition, we analyzed inter and intramolecular bridged water molecules identified in MD simulations to reflect upon the role of solvent stability in conformers of HS06. We also developed a user interface application to understand the structured water molecules around two atoms of interest. We utilized ‘VMD’ and ‘cpptraj’ programs for analysis (Humphrey et al. 1996; Roe and Cheatham 2013) and finally the potential energy landscape (PEL) of HS06 across the MD trajectory was generated based on EED and MVEE parameters.
Fig. 2.

Two parameters end-to-end distance (EED) and minimum volume enclosing ellipsoid (MVEE) used extensively to evaluate conformational dynamics from 1 μs MD simulation. (A) The definition of the EED between terminal oxygen atoms of HS06. (B) Box plot of EED (in Å) for GLYCAM06 and CHARMM36 force fields. (C) The MVEE for HS06 (shown as sticks). (D) Box plot of MVEE (in Å3) for GLYCAM06 and CHARMM36 force fields. The simulations were performed for HS06 with IdoA2S in either 2SO or 1C4 forms.
Results and discussion
Developing simple tools to assess global shape and form of oligosaccharides
We reasoned that simple tools that assess the overall shape would greatly help nonspecialists in understanding structural and conformational aspects of H/HS oligosaccharides. For this purpose, we considered two simple parameters, EED (Figure 2A) and MVEE (Figure 2C).
EED approximates the linear length of a sequence and primarily reflects on its bendability, or lack thereof. Generally, H/HS chains exhibit a helical structure, which can carry kinks and bends, if appropriate substitution pattern is present. Although the 4C1 and 1C4 forms of GlcA/GlcN and IdoA residues, respectively, introduce a more rod-like helical structure, the 2SO form of IdoA induces significant probability of kinks and bends (Guglier et al. 2008; Jin et al. 1997; Raman et al. 2003; Stancanelli et al. 2018). In fact, IdoA is thought to be the key residue that enables attainment of a wider conformational space. Thus, EED could represent a quick measure of the ‘bendability’ of an H/HS, or GAG, sequence. For example, a rigid rod-like form will display an average EED of 100%, whereas the EED of a “hairpin bend” form, which is possible only theoretically, would correspond to a ~20% or less.
Another parameter we introduce is MVEE, which corresponds to the volume sampled by a given sequence when tumbling in solution. Alternatively, MVEE conveys information on whether the sequence exhibits an average of tubular, oval or spheroidal form in solution. For example, HS06 in a rigid rod-like form would have MVEE of ~674 Å3; in contrast, the theoretical hairpin form would display a MVEE of ~643 Å3 (see Supplementary Figure S2 and Table S1). Although simple, the two, physically-relatable, parameters carry rigorous information on the length and shape of an oligosaccharide, especially when applied to MD trajectories over long simulations (1 μs) that involve thousands of conformational forms (see Supplementary Figures S3–S5).
Although it may appear that EED and MVEE are correlated parameters that present similar information, they are not. To exemplify, several HS06 conformations with IdoA in the 2SO form present EEDs of 25.5 Å but their MVEEs were significantly different (631.9 Å3 and 713.8 Å3) (see Supplementary Figure S6). In contrast, a HS06(2SO) form with EED of 23.0 Å3 actually displays MVEE of 986.0 Å3 (Supplementary Figure S6). Likewise, the 1 μs MD trajectories from HS06 (1C4) displayed forms with nearly equal EEDs (16.2–16.4 Å) but a wide range of MVEEs (667.2–840.9 Å3) (see Supplementary Figure S6). The reason for this originates from their definitions. EED refers to the distance between reducing-end and nonreducing end oxygen atoms, whereas MVEE takes into consideration all the atoms and substituents that can be occupied within the smallest size ellipsoid. This implies that MVEE offers insight into globular shape, whereas EED relates to linear length of the GAG sequence. It turns out that a number of H/HS sequences display equal EED but significantly different MVEE (see below). We predict that optimal recognition would only arise if both EED and MVEE of a GAG sequence would complement that of the binding pocket on a protein surface.
CHARMM36 and GLYCAM06 provide comparable, but not identical, results
The conformational space explored by HS06 sequences carrying IdoA2S in either 2SO or 1C4 forms were studied in MD simulations with both CHARMM36 and GLYCAM06 force fields (see Supplementary Figure S3). Each form sampled through the 1 μs trajectory was analyzed by calculating both EED and MVEE. Figure 2B and D shows the distribution of EED and MVEE, respectively, across the trajectory for the two force fields. For both parameters, the box plots were fairly similar irrespective of the corresponding ring puckering of IdoA2S. The average EED for HS06 with IdoA2S in either 1C4 or 2SO forms using GLYCAM06 differed from that using CHARMM36 by only about 0.4 to 0.6 Å (Supplementary Table S1). These values are different by nearly 0.5 to 2.8 Å from that calculated using the NMR-derived structure (1HPN) (Supplementary Table S1). Interestingly, the EED difference between the chair and skew boat forms is a substantial ~2.2 Å suggesting that the latter form exhibit more bent conformations.
In terms of the MVEE parameter, the two force fields differ by 6 Å3 for the 2SO form containing HS06 and 24 Å3 for the HS06(1C4) (Supplementary Table S1), which come about from rather similar average values of the three radii (r1, r2, r3) defining the ellipsoids. In the manner of EED, the difference between chair and skew boat forms is 30–48 Å3. Comparison of MD-derived MVEE with those derived from the NMR structure (1HPN) shows a substantial difference of 108–134 Å3 (Supplementary Table S1). The NMR-derived MVEE calculation pertains to just one form and does not reflect the average, as do MD-derived values. Further, the protons correlations used in NMR better define glycan backbone, thereby not defining the dynamics of the substituents (e.g., sulfate groups) as well. Thus, these differences are to be expected in the use of two different techniques.
More importantly, the distribution of conformers was found to be fairly symmetrical from the EED median for both force fields (not shown). The overall statistics indicated that HS06 sampled ~10% bent conformers in which the EED was less than 24 Å. Alternatively, 85% of conformers were either rod-type or rod-like in shape, which corresponded to EED of 25 to 28 Å. Likewise, a fairly similar Gaussian distribution was observed for MVEE for both force fields (Supplementary Figure S5).
Yet, there were some interesting differences between the two force fields. (1) The conformations sampled using CHARMM36 were found to fit well within the range of GLYCAM. Alternatively, the range of conformations sampled using CHARM36 force field was slightly lower than that using GLYCAM06. (2) The interquartile range for CHARMM36 was also less than that for GLYCAM06. This implies that CHARMM36 predicts a slightly more rigid HS06 structure irrespective of IdoA2S puckering in comparison to that predicted by GLYCAM06. The apparent reason for this difference is described in section on intermolecular hydrogen bonding interactions. (3) For IdoA2S in the skew boat form, HS06 samples conformations with larger MVEE in comparison to that in the 1C4 chair form (Supplementary Figure S5A and B). This is found to be the case for both force fields, although CHARMM36 predicts a more stringent distribution of conformers for the 2SO form.
CHARMM36- and GLYCAM06-derived torsions are similar
To gain more specific information, each conformer of HS06 along the MD trajectory was analyzed for phi (Φ) and psi (Ψ) values for each glycosidic bond (Supplementary Figures S7 and S8). CHARMM36 and GLYCAM06 predicted rather similar preferences for both Φ and Ψ of either IdoA2S(2SO)—GlcNS6S or GlcNS6S—IdoA2S(2SO) glycosidic torsions. A difference of only 2°to 30° was noted across the entire MD run, which is relatively small considering the full range of dynamical motion possible for the HS06 sequence. In fact, for the IdoA2S(2SO)—GlcNS6S glycosidic bond, the average values were −73.21° (Φ) and −68.11° (Φ) and −117.28°(Ψ) and −117.41° (Ψ) for GLYCAM06 and CHARMM36, respectively. For the GlcNS6S—IdoA2S(2SO) bond, the corresponding average values were 76.0° and 64.51° and −155.24° and −166.15°, respectively.
Supplementary Figures S9 and S10 show Φ and Ψ for HS06 with IdoA2S in the 1C4 chair pucker. The average Φ values were −80.44°/−89.40°and 85.74°/89.75° (GLYCAM06/CHARMM36) for IdoA2S(1C4)—GlcNS6S and GlcNS6S—IdoA2S(1C4) bond, respectively. The respective average Ψ values were −135.24°/−126.30°and −140.29°/−132.50° (GLYCAM06/CHARMM36). These values compare well with the Φ and Ψ values suggested in the literature (Verli and Guimarães 2004). These values are also acceptable based on the solution NMR results on HS06 (Mikhailov et al. 1997; Mulloy and Forster 2000; Mulloy et al. 1993). It is important to note that extended MD simulations offer a much more detailed view of different conformations sampled by a sequence (shown below), which would be particularly important for understanding the phenomenon of protein recognition.
Intramolecular hydrogen bonds predicted by the two force fields are similar, but not identical
The stability of global HS06 form is not only dependent on the glycosidic torsions but also dependent on the formation of intramolecular hydrogen bonds (H-bonds) within and between residues (Almond and Sheehan 2000; Pol-Fachin and Verli 2008; Remko et al. 2010). The intramolecular H-bonds for the MD trajectory were calculated using the cpptraj tool available in Amber Tools18. Herein, the donor and acceptor atoms are defined as forming a H-bond if the distance between them is <3.5 Å and donor–hydrogen–acceptor angle is within 180 ± 60° range (Roe and Cheatham 2013). Figure 3A and B show the occurrence of the number of H-bonds for each frame captured along the MD trajectory (for the last 200 ns of the microsecond trajectory) for the HS06 sequence in skew boat conformation derived from GLYCAM06 and CHARMM36, respectively. GLYCAM06 predicted an average of 3.4 intramolecular H-bonds, while CHARMM36 gave an average of 3.2. The difference of 0.2 H-bonds between the two force fields is not high but worth noting. This difference is also maintained if only those H-bonds that persist in solution (>90% of the time) are taken into consideration. This suggests a measurable difference between the two force fields. Yet, several intramolecular H-bonds that are thought to be specific and important for folding were identical for both force fields (Figure 3C). This indicates excellent correspondence between CHARMM36 and GLYCAM06. It is important to note that these specific H-bonds are identical to those reported earlier in the literature (IdoA2S O5 GlcNS6S@H3O and IdoA2S O61 GlcNS6S@H3O) (Pol-Fachin and Verli 2008; Remko et al. 2010) (Figure 3C). Figure 3E and F shows the intramolecular hydrogen bond interactions for the HS06 sequence containing chair form of IdoA2S. The average value of these H-bonds was 4.0 irrespective of both the force fields and this was approximately one H-bond more than the HS06 in skew boat form. Both the force fields identified specific H-bonds shown in Figure 3G and their percentage of occurrence in Figure 3H. Irrespective of the puckering and force fields, H-bond interactions were observed between the glycosidic oxygens and neighboring oxygen atoms essentially at times (see also Supplementary Figure S11).
Fig. 3.
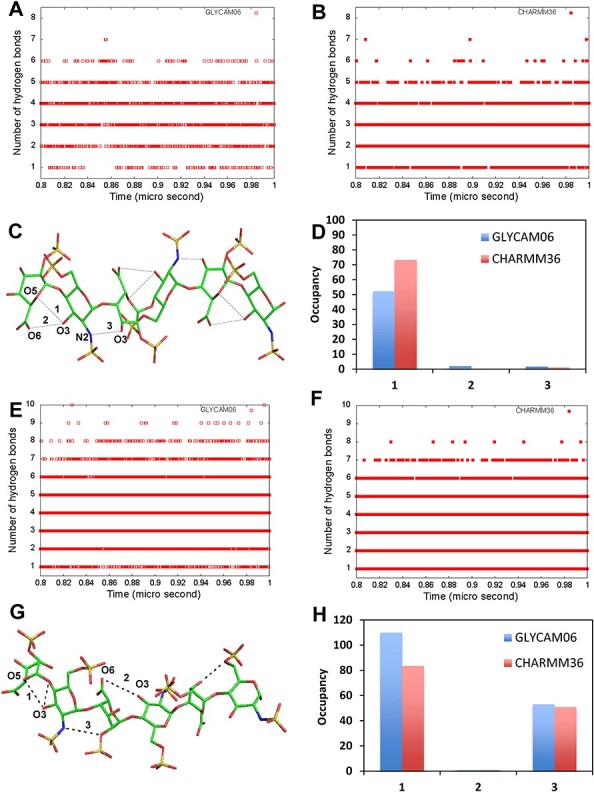
Intramolecular H-bonds using GLYCAM06 and CHARMM36 force fields. The total number of intramolecular H-bond formed during the last 200 ns between all possible donor and acceptor atoms of HS06 with IdoA2S in 2SO are shown for (A) GLYCAM06 and (B) CHARMM36. (C) Stick representation of HS06 showing all possible intramolecular H-bonds (dotted lines) between the donor and acceptor atoms. (D) The percentage occupancy of the three significant H-bonds including (1) IdoA2S@O5••••H-GlcNS6S@O3, (2) IdoA2S@O6••••H-GlcNS6S@O3, and (3) GlcNS6S@N2••••H-IdoA2S@O3. The total number of intramolecular H-bond formed during the last 200 ns between all possible donor and acceptor atoms of HS06 with IdoA2S in 1C4 form are shown for (E) GLYCAM06 and (F) CHARMM36. (G) Stick representation of HS06 showing all possible intramolecular H-bonds (dotted lines) between the respective donor and acceptor atoms. (H) The percentage occupancy of the three significant H-bonds including (1) IdoA2S@O5••••H-GlcNS6S@O3, (2) IdoA2S@O6••••H-GlcNS6S@O3 and (3) GlcNS6S@N2••••H-IdoA2S@O2.
Intermolecular H-bonds predicted by the two force fields also show similarities
The presence of multiple sulfate groups on a H/HS sequence introduces strong interactions with multiple water molecules (Almond 2005; Kirschner and Woods 2001; Pol-Fachin and Verli 2008; Verli and Guimarães 2004). In fact, the local conformation and flexibility (or rigidity) of a H/HS chain also depend on intermolecular H-bonds with solvent molecules. Earlier, the number of water molecules bound to a chain was found to vary with IdoA puckering (Samsonov et al. 2014a). Studies have also shown radial distribution of water around the polar groups and have confirmed that the skew boat form of IdoA is more solvated than the chair form (Pol-Fachin and Verli 2008; Verli and Guimarães 2004).
Figure 4A and B show representative frames from simulations of HS06 using GLYCAM06 and CHARMM36, respectively. The snapshots display a rich swarm of water molecules around HS06 involved in the formation of a large number of intermolecular H-bonds. Both force fields show an equivalent number of water molecules around the polar groups of HS06. As predicted, the intermolecular interactions stabilize the global HS06 form by bridging polar groups in two distinct ways: (a) one water molecule forms a bridge between a donor–acceptor atom pair of HS06 (Figure 4C) and (b) two or more water molecules form a bridge between a donor and acceptor atom pair (Figure 4D). The bridging water molecules are expected to play a critical role in protein binding in the form of overall desolvation energy and stabilization of the native state (Samsonov et al. 2011).
Fig. 4.

Intermolecular H-bonds using GLYCAM06 and CHARMM36 force fields. The water molecules distributed around HS06 (within 5 Å) inferred from (A) GLYCAM06 and (B) CHARMM36 studies. The bridging water molecules that connect residues of HS06 inferred from MD simulation using (C) GLYCAM06 and (D) CHARMM36 force field. (E) Distribution of bridging water molecules for HS06 sequences with IdoA2S in 2SO (blue) and 1C4 (orange) forms across MD trajectory for the GLYCAM06 force field. (F) Distribution of bridging water molecules HS06 sequences with IdoA2S in 2SO (blue) and 1C4 (orange) forms across MD trajectory for the CHARMM36 force field.
Calculations using cpptraj tool show that both GLYCAM06 and CHARMM36 identify a rather identical set of bridging waters belonging to the above two categories (Figure 4C and D). More quantitatively, HS06 sequence with IdoA2S in skew boat form displays more distributed bridging water molecules in comparison to that in the chair form (Figure 4E and F). The distribution for skew boat contained sequence tends to the right of the sequence with chair form. The average number of bridging water molecules across the entire MD trajectories of GLYCAM06 and CHARMM36 was found to be 9 and 7, respectively, for the skew boat sequence. These numbers drop to 6.5 and 6, respectively, for the chair sequence. Thus, the two force fields are very similar with regard to the difference in intermolecular H-bonds. Calculations also show that over the MD trajectories, the number of bridging water molecules ranged from 1 to 20 (see Supplementary Figure S12) for both GLYCAM06 and CHARMM36, which supports the overall similarity of the two.
A tool for quantifying intramolecular, nondirect bridging waters
Besides the contribution of intermolecular H-bonds formed by H/HS atoms with water molecules, those from intramolecular, nondirect bridging water molecules also contribute to stability of the overall shape of HS06. We developed a user interface application that identifies and quantifies ordered, nondirect, and bridging water around GAG. Figure S13 shows the schematic representation of this application and offers documentation for implementation of this tool. This application is platform independent and can be used for both NAMD and AMBER generated trajectory files.
The application provides rich information on the role of bridging water around a GAG sequence and its potential importance in protein recognition (see Supplementary Movie S1, S2 and Figure S14). For example, if the atoms IdoA2S(O61) and GlcNS6S(O3) of the middle disaccharide unit are considered, it shows 3 to 11 hydrogen-bonded water molecules within 3.5 Å distance, which form a network to stabilize ring forms. In fact, such interactions could extend to nearest neighboring residues (Supplementary Figures S14 and S17). When such an analysis was performed across different segments of the MD trajectory, for the HS06 with IdoA2S in 2SO puckering the average number of hydrogen bonds in CHARMM36 varied from 6.2 to 6.9, while it was 6.6 to 7.3 for GLYCAM06 (Supplementary Figure S15). This average number reduced by one for the HS06 with IdoA2S in 1C4 puckering (Supplementary Figure S16). This shows that both force fields have nearly equal distribution of nondirect, intermolecular, water molecules within hydrogen bond distance. Such solvent interactions contribute to conformational rigidity/flexibility of GAGs, which in turn dictate the shape of the oligosaccharide.
Developing energy landscape of HS06 based on EED and MVEE parameters
In general, the PEL of a molecule is typically developed through a systematic evolution of two principal coordinates, e.g., torsions (Φ and Ψ) and others (Levy and Becker 2001; Qin et al. 2011; Song et al. 2015; Wales 2018) and calculating potential energy. To gain insight into overall H/HS structure, a PEL will have to be developed for multiple torsions. We reasoned that our two parameters—EED and MVEE—offer easy opportunity to visualize the dynamics of the overall shape of H/HS. Thus, we calculated the potential energy of HS06 conformations at equal intervals of time from microsecond simulation (of total 2500 frames) as a function of EED and MVEE. Figure 5 shows the PELs for the HS06 computed using the two force fields, GLYCAM06 and CHARMM36. An overall comparison of the PELs indicates that the former predicts slightly higher conformational entropy than the latter (Figure 5).
Fig. 5.
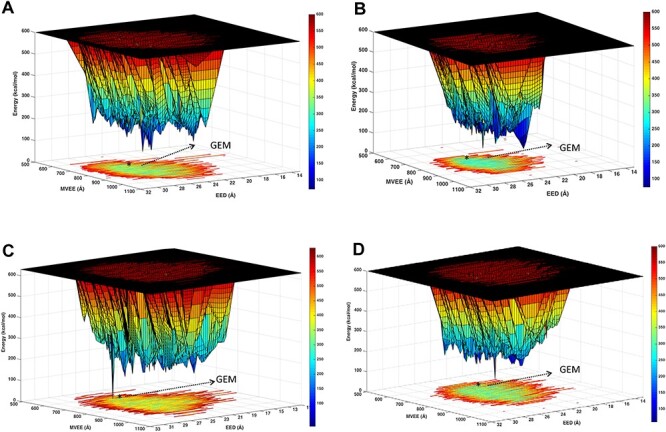
Potential energy landscape (PEL) of HS06 derived from long (1 μs) MD simulations. The PEL obtained by conformational sampling of HS06 sequences with IdoA2S residues in 2SO using GLYCAM06 (A and C) and CHARMM36 (B and D) force fields. EED and MVEE are used as the two coordinates. The potential energy (z-axis) in kcal/mol is presented as color bars. The native 1HPN structure correspond to the forms marked as *, whereas the global energy minimum (GEM) is shown by arrows.
The striking aspect of this analysis is the both force fields for the HS06 in 2SO puckering predict multiple minima on a rugged landscape. Of the multiple minima, one unique global energy minimum (GEM) form could be identified for both force fields. Whereas GLYCAM06 predicts this form to have EED and MVEE of 24.7 Å and 771.5 Å3, respectively, CHARMM36 presents it as the (25.1 Å, 811.4 Å3) conformer (Figure 5A and B). Figure 5C and D shows the landscape of HS06 with IdoA2S in 1C4 puckering for the GLYCAM06 and CHARMM36 generated conformations, respectively. Similar to 2SO puckered landscape, the 1C4 sequence also has a rough energy landscape with a unique GEM for both GLYCAM06 and CHARMM36. The EEDs and MVEEs for the two force fields were 26.2 Å and 22.3 Å and 744.8 Å3 and 704.6 Å3, respectively. A more in-depth comparison of the two landscapes shows that the 2SO sequence, irrespective of the force field, displays moderately more ruggedness and more multiple minima than the 1C4 sequence (compare the blue regions in Figure 5). Another striking observation was that both force fields displayed a much better defined GEM for the 1C4 puckered sequence. In retrospect, this is probably because the water network around the atoms of the 2SO sequence affords more interactions favoring multiple lower energy forms. Overall, the results imply that the two force fields predict similar, but not identical, GEMs. Another conclusion of importance for protein recognition is that the landscape around both GEMs is canyon-like. Yet, the energy difference between the ridges and valleys is not high (<5 kcal/mol). This suggests that several local minima in the vicinity of the two GEMs could be readily populated by HS06 at room temperature.
Conclusions
GAGs abound in nature. They are present in extracellular milieu, are part of cell surface proteins and are also found within cells. This widespread distribution accords them important roles in a number of biological responses. For example, HS facilitates complexation of two proteins to contribute to growth and differentiation (Faham et al. 1996; Schlessinger et al. 2000). It has been difficult to deduce the basis of how GAGs mediate these responses because of the difficulty of working with large number of GAG sequences. Our approach has focused on understanding dynamical properties of GAGs to help deduce mechanistic details on GAG recognition and modulation of proteins. In fact, our earlier work on computational analysis of H/HS recognition of fibroblast growth factor and its receptor (Nagarajan et al. 2017) yielded significant foundational understanding into recognition of common oligosaccharides (Patel et al. 2016). Yet, computational studies on GAGs are difficult to perform for most researchers because simple tools are not available to help visualize structural and dynamical properties.
Here we have shown that using two simple tools (parameters), EED and MVEE, it is possible to visualize how a GAG sequence may behave in solution. In the process, we have performed rigorous comparison of two recent force fields GLYCAM06 and CHARMM36. Interestingly, both force fields yielded rather similar conformational properties, which were comparable to earlier results from NMR experiments (Mikhailov et al. 1997; Mulloy and Forster 2000; Mulloy et al. 1993). More specifically, both gave essentially equivalent overall conformation, inter-glycosidic torsional angles, intermolecular H-bonds and intramolecular solvent interactions. It is important to note that this work utilized long MD simulations (1 μs), which allowed us to rigorously test each of the above parameters at a much higher level of precision. Thus, nonspecialists should be able to use the two force fields fairly interchangeably, as long as the experiments are performed in a rigorous manner.
We expect that EED and MVEE will significantly help in understanding GAG recognition of targeting proteins. In connection with this, we utilized EED and MVEE to understand the conformational dynamism. Rather than the nonphysical principal components or difficult to simultaneously visualize many torsional angles, EED and MVEE offer a physical correlation with the form of the preferred oligosaccharide. Whereas the EED approximates the linear length, the MVEE refers to the dynamical volume of the oligosaccharide. As one would expect, both EED and MVEE are important from the perspective of binding into a pocket on protein surface. More specifically, MD-derived EED and MVEE would for the first time afford the probability of binding into a pocket because it would take into consideration all possible conformational forms and the variations in the orientation of substituents. Thus, we predict that evaluating the corresponding features of the binding pocket through rigorous MD studies would present a major opportunity of calculating probabilities of complementary features that engineer binding affinity and selectivity.
This work also defined the PEL of HS06 in a highly rigorous manner. The long MD simulations showed that HS06 exhibits multiple energy minima that can be sampled at room temperature, which is in contrast to the common understanding that HS06 displays single form based on the 1HPN structure (Mulloy et al. 1993). The obvious major significance of such a mobile conformational equilibrium is in the phenomenon of protein recognition. The affinity of a protein that binds to HS06 will intricately depend on the nature of this conformational equilibrium, which determines the population of the particular form of HS06 recognized. By the same token, cross-reactivity (or promiscuity) of HS06 for other proteins would also arise from this equilibrium. This implies that researchers would have to factor these equilibria in their MM studies to truly gain insight into measurable quantities, such as binding affinity. It is important to note that predicting affinity of a particular GAG sequence binding to a distinct site on the target protein has been a major challenge (Kjellén and Lindahl 2018; Sankaranarayanan et al. 2018).
We also project that the application of EED and MVEE to libraries of GAG sequences will help parse inter- and intramolecular interactions that lead to ‘specific’ and/or ‘plastic’ recognition. Of special note here is the occurrence of a specific intramolecular H-bond from the 3OH group of IdoA2S, which was not affected by the solvent molecules, resulting in a drive to the 2SO pucker (Pol-Fachin and Verli 2008). Likewise, application of these tools could be useful in understanding kinks and bends in HS sequences, which appear to play major roles in recognition of proteins (Guglier et al. 2008; Jin et al. 1997; Raman et al. 2003; Stancanelli et al. 2018) and also to develop and understand heparin mimetic analog to target specific protein of interest (Muñoz-García et al. 2013a).
Supplementary Material
Acknowledgments
We thank Prof. Glen Kellogg and Prof. Neel Scarsdale of Virginia Commonwealth University (VCU) for their initial computational resource support, Umma F Tajammal of DGS-ISS, Richmond for her constant guidance in making our solvent interaction application. We also thank the availability of research resources from National Center for Research Resources (S10 RR027411 to VCU). We also thank GLYCAM06 and CHARMM36 force field developers and their users, who offered numerous suggestions throughout this study.
Conflicts of interest statement
The authors declare no conflict of interest related to the work presented in the paper.
Funding
This work was supported in part by grants from the National Heart, Lung and Blood Institute including HL107152, HL090586, HL128639.
Abbreviations
- EED
end-to-end distance
- GlcA
glucuronic acid residue
- GlcN
glucosamine residue
- H/HS
heparin/heparan sulfate
- H-bonds
hydrogen bonds
- HS06
heparan sulfate hexasaccharide
- IdoA
iduronic acid residue
- MD
molecular dynamics
- MM
Molecular modeling
- MVEE
minimum volume enclosing ellipsoid
- PEL
potential energy landscape.
References
- Almond A. 2005. Towards understanding the interaction between oligosaccharides and water molecules. Carbohydr Res. 340:907–920. [DOI] [PubMed] [Google Scholar]
- Almond A, Sheehan JK. 2000. Glycosaminoglycan conformation: Do aqueous molecular dynamics simulations agree with x-ray fiber diffraction? Glycobiology. 10:329–338. [DOI] [PubMed] [Google Scholar]
- Ballut L, Sapay N, Chautard É, Imberty A, Ricard-Blum S. 2013. Mapping of heparin/heparan sulfate binding sites on αvβ3 integrin by molecular docking. J Mol Recognit. 26:76–85. [DOI] [PubMed] [Google Scholar]
- Becker CF, Guimarães JA, Verli H. 2005. Molecular dynamics and atomic charge calculations in the study of heparin conformation in aqueous solution. Carbohydr Res. 340:1499–1507. [DOI] [PubMed] [Google Scholar]
- Case DA, Cheatham TE 3rd, Darden T, Gohlke H, Luo R, Merz KM Jr, Onufriev A, Simmerling C, Wang B, Woods RJ. 2005. The Amber biomolecular simulation programs. J Comput Chem. 26:1668–1688. [DOI] [PMC free article] [PubMed] [Google Scholar]
- Case DA, IY IB-S, Brozel SR, Cerutti DS, Cheatham TE, VWD C, Darden TA, Duke RE, Gohlke H, Goetz AW, et al.. 2018. Amber. 18. [Google Scholar]
- Casu B, Petitou M, Provasoli M, Sinaÿ P. 1988. Conformational flexibility: A new concept for explaining binding and biological properties of iduronic acid-containing glycosaminoglycans. Trends Biochem Sci. 13:221–225. [DOI] [PubMed] [Google Scholar]
- Childers MC, Daggett V. 2017. Insights from molecular dynamics simulations for computational protein design. Mol Sys Des Eng. 2:9–33. [DOI] [PMC free article] [PubMed] [Google Scholar]
- Esko JD, Linhardt RJ. 2009. Proteins that bind sulfated glycosaminoglycans. In: Varki A, Cummings RD, Esko JD, Freeze HH, Stanley P, Bertozzi CR, Hart GW, Etzler ME, editors. Essentials of glycobiology. La Jolla, California: Cold Spring Harbor NY: The Consortium of Glycobiology Editors. [PubMed] [Google Scholar]
- Faham S, Hileman RE, Fromm JR, Linhardt RJ, Rees DC. 1996. Heparin structure and interactions with basic fibroblast growth factor. Science. 271:1116. [DOI] [PubMed] [Google Scholar]
- Ferro DR, Pumilia P, Ragazzi M. 1997. An improved force field for conformational analysis of sulfated polysaccharides. J Comput Chem. 18:351–367. [Google Scholar]
- Foley BL, Tessier MB, Woods RJ. 2012. Carbohydrate force fields. Wiley Interdiscip Rev: Comput Mol Sci. 2:652–697. [DOI] [PMC free article] [PubMed] [Google Scholar]
- Gandhi NS, Mancera RL. 2009. Free energy calculations of glycosaminoglycan–protein interactions. Glycobiology. 19:1103–1115. [DOI] [PubMed] [Google Scholar]
- Gandhi NS, Mancera RL. 2010. Can current force fields reproduce ring puckering in 2-O-sulfo-α-l-iduronic acid? A molecular dynamics simulation study. Carbohydr Res. 345:689–695. [DOI] [PubMed] [Google Scholar]
- Gehrcke J-P, Pisabarro MT. 2015. Identification and characterization of a glycosaminoglycan binding site on interleukin-10 via molecular simulation methods. J Mol Graph Model. 62:97–104. [DOI] [PubMed] [Google Scholar]
- Guglier S, Hricovini M, Raman R, Polito L, Torri G, Casu B, Sasisekharan R, Guerrini M. 2008. Minimum FGF2 binding structural requirements of heparin and heparan sulfate oligosaccharides as determined by NMR spectroscopy. Biochemistry. 47:13862–13869. [DOI] [PubMed] [Google Scholar]
- Guvench O, Mallajosyula SS, Raman EP, Hatcher E, Vanommeslaeghe K, Foster TJ, Jamison FW, MacKerell AD. 2011. CHARMM additive all-atom force field for carbohydrate derivatives and its utility in polysaccharide and carbohydrate–protein modeling. J Chem Theory Comput. 7:3162–3180. [DOI] [PMC free article] [PubMed] [Google Scholar]
- Hsieh P-H, Thieker DF, Guerrini M, Woods RJ, Liu J. 2016. Uncovering the relationship between sulphation patterns and conformation of iduronic acid in heparan sulphate. Sci Rep. 6:29602. [DOI] [PMC free article] [PubMed] [Google Scholar]
- Huige CJM, Altona C. 1995. Force field parameters for sulfates and sulfamates based on ab initio calculations: Extensions of AMBER and CHARMm fields. J Comput Chem. 16:56–79. [Google Scholar]
- Humphrey W, Dalke A, Schulten K. 1996. VMD: Visual molecular dynamics. J Mol Graph. 14:33–38. [DOI] [PubMed] [Google Scholar]
- Jin L, Abrahams JP, Skinner R, Petitou M, Pike RN, Carrell RW. 1997. The anticoagulant activation of antithrombin by heparin. Proc Natl Acad Sci U S A. 94:14683–14688. [DOI] [PMC free article] [PubMed] [Google Scholar]
- Kirschner KN, Woods RJ. 2001. Solvent interactions determine carbohydrate conformation. Proc Natl Acad Sci. 98:10541–10545. [DOI] [PMC free article] [PubMed] [Google Scholar]
- Kirschner KN, Yongye AB, Tschampel SM, GonzÁLez-OuteiriÑO J, Daniels CR, Foley BL, Woods RJ. 2008. GLYCAM06: A generalizable biomolecular force field. Carbohydrates. J Comput Chem. 29:622–655. [DOI] [PMC free article] [PubMed] [Google Scholar]
- Kjellén L, Lindahl U. 2018. Specificity of glycosaminoglycan–protein interactions. Curr Opin Struct Biol. 50:101–108. [DOI] [PubMed] [Google Scholar]
- Levy Y, Becker OM. 2001. Energy landscapes of conformationally constrained peptides. J Chem Phys. 114:993–1009. [Google Scholar]
- Lins RD, Hunenberger PH. 2005. A new GROMOS force field for hexopyranose-based carbohydrates. J Comput Chem. 26:1400–1412. [DOI] [PubMed] [Google Scholar]
- McDaniel JG, Schmidt JR. 2016. Next-generation force fields from symmetry-adapted perturbation theory. Annu Rev Phys Chem. 67:467–488. [DOI] [PubMed] [Google Scholar]
- Meneghetti MCZ, Hughes AJ, Rudd TR, Nader HB, Powell AK, Yates EA, Lima MA. 2015. Heparan sulfate and heparin interactions with proteins. J Royal Soc Interface. 12:20150589. [DOI] [PMC free article] [PubMed] [Google Scholar]
- Mikhailov D, Linhardt RJ, Mayo KH. 1997. NMR solution conformation of heparin-derived hexasaccharide. Biochem J. 328(Pt 1):51–61. [DOI] [PMC free article] [PubMed] [Google Scholar]
- Monneau Y, Arenzana-Seisdedos F, Lortat-Jacob H. 2016. The sweet spot: How GAGs help chemokines guide migrating cells. J Leukoc Biol. 99:935–953. [DOI] [PubMed] [Google Scholar]
- Monticelli L, Tieleman DP. 2013. Force fields for classical molecular dynamics. In: Monticelli L, Salonen E, editors. Biomolecular simulations: methods and protocols. Totowa, NJ: Humana Press. p. 197–213. [DOI] [PubMed] [Google Scholar]
- Mosier PD, Krishnasamy C, Kellogg GE, Desai UR. 2012. On the specificity of heparin/heparan sulfate binding to proteins. Anion-binding sites on Antithrombin and thrombin are fundamentally different. PLoS One. 7:e48632. [DOI] [PMC free article] [PubMed] [Google Scholar]
- Mulloy B, Forster MJ. 2000. Conformation and dynamics of heparin and heparan sulfate. Glycobiology. 10:1147–1156. [DOI] [PubMed] [Google Scholar]
- Mulloy B, Forster MJ, Jones C, Davies DB. 1993. N.m.r. and molecular-modelling studies of the solution conformation of heparin. Biochem J. 293:849–858. [DOI] [PMC free article] [PubMed] [Google Scholar]
- Mulloy B, Hogwood J, Gray E, Lever R, Page CP. 2015. Pharmacology of heparin and related drugs. Pharmacol Rev. 68:76. [DOI] [PubMed] [Google Scholar]
- Muñoz-García JC, Corzana F, Paz JL, Angulo J, Nieto PM. 2013a. Conformations of the iduronate ring in short heparin fragments described by time-averaged distance restrained molecular dynamics. Glycobiology. 23:1220–1229. [DOI] [PubMed] [Google Scholar]
- Muñoz-García JC, López-Prados J, Angulo J, Díaz-Contreras I, Reichardt N, Paz JL, Martín-Lomas M, Nieto PM. 2012. Effect of the substituents of the neighboring ring in the conformational equilibrium of Iduronate in heparin-like Trisaccharides. Chem A Eur J. 18:16319–16331. [DOI] [PubMed] [Google Scholar]
- Muñoz-García JC, Solera C, Carrero P, Paz JL, Angulo J, Nieto PM. 2013b. 3D structure of a heparin mimetic analogue of a FGF-1 activator. A NMR and molecular modelling study. Org Biomol Chem. 11:8269–8275. [DOI] [PubMed] [Google Scholar]
- Nagarajan B, Sankaranarayanan NV, Patel BB, Desai UR. 2017. A molecular dynamics-based algorithm for evaluating the glycosaminoglycan mimicking potential of synthetic, homogenous, sulfated small molecules. PLoS One. 12:e0171619. [DOI] [PMC free article] [PubMed] [Google Scholar]
- Oborský P, Tvaroška I, Králová B, Spiwok V. 2013. Toward an accurate conformational modeling of Iduronic acid. J Phys Chem B. 117:1003–1009. [DOI] [PubMed] [Google Scholar]
- Patel NJ, Sharon C, Baranwal S, Boothello RS, Desai UR, Patel BB. 2016. Heparan sulfate hexasaccharide selectively inhibits cancer stem cells self-renewal by activating p38 MAP kinase. Oncotarget. 7:84608–84622. [DOI] [PMC free article] [PubMed] [Google Scholar]
- Phillips JC, Braun R, Wang W, Gumbart J, Tajkhorshid E, Villa E, Chipot C, Skeel RD, Kalé L, Schulten K. 2005. Scalable molecular dynamics with NAMD. J Comput Chem. 26:1781–1802. [DOI] [PMC free article] [PubMed] [Google Scholar]
- Pol-Fachin L, Rusu VH, Verli H, Lins RD. 2012. GROMOS 53A6GLYC, an improved GROMOS force field for Hexopyranose-based carbohydrates. J Chem Theory Comput. 8:4681–4690. [DOI] [PubMed] [Google Scholar]
- Pol-Fachin L, Verli H. 2008. Depiction of the forces participating in the 2-O-sulfo-α-l-iduronic acid conformational preference in heparin sequences in aqueous solutions. Carbohydr Res. 343:1435–1445. [DOI] [PubMed] [Google Scholar]
- Powell AK, Yates EA, Fernig DG, Turnbull JE. 2004. Interactions of heparin/heparan sulfate with proteins: Appraisal of structural factors and experimental approaches. Glycobiology. 14:17R–30R. [DOI] [PubMed] [Google Scholar]
- Qin F, Jiang Y, Chen Y, Wu M, Yan G, Ye W, Li Y, Zhang J, Chen H-F. 2011. Conformational selection or induced fit for Brinker and DNA recognition. Phys Chem Chem Phys. 13:1407–1412. [DOI] [PubMed] [Google Scholar]
- Ragazzi M, Ferro DR, Provasoli A. 1986. A force-field study of the conformational characteristics of the iduronate ring. J Comput Chem. 7:105–112. [DOI] [PubMed] [Google Scholar]
- Raman R, Venkataraman G, Ernst S, Sasisekharan V, Sasisekharan R. 2003. Structural specificity of heparin binding in the fibroblast growth factor family of proteins. Proc Natl Acad Sci U S A. 100:2357–2362. [DOI] [PMC free article] [PubMed] [Google Scholar]
- Remko M, Van Duijnen PT, Broer R. 2010. Molecular structure of basic oligomeric building units of heparan-sulfate glycosaminoglycans. Struct Chem. 21:965–976. [Google Scholar]
- Roe DR, Cheatham TE. 2013. PTRAJ and CPPTRAJ: Software for processing and analysis of molecular dynamics trajectory data. J Chem Theory Comput. 9:3084–3095. [DOI] [PubMed] [Google Scholar]
- Samsonov SA, Gehrcke J-P, Pisabarro MT. 2014a. Flexibility and explicit solvent in molecular-dynamics-based docking of protein–glycosaminoglycan systems. J Chem Inf Model. 54:582–592. [DOI] [PubMed] [Google Scholar]
- Samsonov SA, Teyra J, Pisabarro MT. 2011. Docking glycosaminoglycans to proteins: Analysis of solvent inclusion. J Comput Aided Mol Des. 25:477–489. [DOI] [PMC free article] [PubMed] [Google Scholar]
- Samsonov SA, Theisgen S, Riemer T, Huster D, Pisabarro MT. 2014b. Glycosaminoglycan monosaccharide blocks analysis by quantum mechanics, molecular dynamics, and nuclear magnetic resonance. Biomed Res Int. 2014:808071. [DOI] [PMC free article] [PubMed] [Google Scholar]
- Sankaranarayanan NV, Desai UR. 2014. Toward a robust computational screening strategy for identifying glycosaminoglycan sequences that display high specificity for target proteins. Glycobiology. 24:1323–1333. [DOI] [PMC free article] [PubMed] [Google Scholar]
- Sankaranarayanan NV, Nagarajan B, Desai UR. 2018. So you think computational approaches to understanding glycosaminoglycan–protein interactions are too dry and too rigid? Think again! Curr Opin Struct Biol. 50:91–100. [DOI] [PMC free article] [PubMed] [Google Scholar]
- Sankaranarayanan NV, Strebel TR, Boothello RS, Sheerin K, Raghuraman A, Sallas F, Mosier PD, Watermeyer ND, Oscarson S, Desai UR. 2017. A Hexasaccharide containing rare 2-O-sulfate-Glucuronic acid residues selectively activates heparin cofactor II. Angew Chem Int Ed. 56:2312–2317. [DOI] [PMC free article] [PubMed] [Google Scholar]
- Sapay N, Cabannes E, Petitou M, Imberty A. 2011. Molecular modeling of the interaction between heparan sulfate and cellular growth factors: Bringing pieces together. Glycobiology. 21:1181–1193. [DOI] [PubMed] [Google Scholar]
- Sarkar A, Yu W, Desai UR, MacKerell AD, Mosier PD. 2016. Estimating glycosaminoglycan–protein interaction affinity: Water dominates the specific antithrombin–heparin interaction. Glycobiology. 26:1041–1047. [DOI] [PMC free article] [PubMed] [Google Scholar]
- Sattelle BM, Hansen SU, Gardiner J, Almond A. 2010. Free energy landscapes of iduronic acid and related monosaccharides. J Am Chem Soc. 132:13132–13134. [DOI] [PubMed] [Google Scholar]
- Sattelle BM, Shakeri J, Almond A. 2013. Does microsecond sugar ring flexing encode 3D-shape and bioactivity in the heparanome? Biomacromolecules. 14:1149–1159. [DOI] [PubMed] [Google Scholar]
- Schlessinger J, Plotnikov AN, Ibrahimi OA, Eliseenkova AV, Yeh BK, Yayon A, Linhardt RJ, Mohammadi M. 2000. Crystal structure of a ternary FGF-FGFR-heparin complex reveals a dual role for heparin in FGFR binding and dimerization. Mol Cell. 6:743–750. [DOI] [PubMed] [Google Scholar]
- Sepuru KM, Nagarajan B, Desai UR, Rajarathnam K. 2016. Molecular basis of chemokine CXCL5-glycosaminoglycan interactions. J Biol Chem. [DOI] [PMC free article] [PubMed] [Google Scholar]
- Singh A, Tessier MB, Pederson K, Wang X, Venot AP, Boons G-J, Prestegard JH, Woods RJ. 2016. Extension and validation of the GLYCAM force field parameters for modeling glycosaminoglycans. Can J Chem. 94:927–935. [DOI] [PMC free article] [PubMed] [Google Scholar]
- Soares PAG, Queiroz INL, Pomin VH. 2017. NMR structural biology of sulfated glycans. J Biomol Struct Dyn. 35:1069–1084. [DOI] [PubMed] [Google Scholar]
- Song J, Li Y, Ji C, Zhang JZH. 2015. Functional loop dynamics of the streptavidin-biotin complex. Sci Rep. 5:7906. [DOI] [PMC free article] [PubMed] [Google Scholar]
- Stancanelli E, Elli S, Hsieh P-H, Liu J, Guerrini M. 2018. Recognition and conformational properties of an alternative antithrombin binding sequence obtained by chemoenzymatic synthesis. ChemBioChem. 19:1178–1188. [DOI] [PMC free article] [PubMed] [Google Scholar]
- Verli H, Guimarães JA. 2004. Molecular dynamics simulation of a decasaccharide fragment of heparin in aqueous solution. Carbohydr Res. 339:281–290. [DOI] [PubMed] [Google Scholar]
- Wales DJ. 2018. Exploring energy landscapes. Annu Rev Phys Chem. 69:401–425. [DOI] [PubMed] [Google Scholar]
- Xu D, Esko JD. 2014. Demystifying heparan sulfate-protein interactions. Annu Rev Biochem. 83:129–157. [DOI] [PMC free article] [PubMed] [Google Scholar]
Associated Data
This section collects any data citations, data availability statements, or supplementary materials included in this article.