

Introduction
Red blood cell transfusions (RBCT) remain the cornerstone of supportive care in lower-risk myelodysplastic syndrome (LRMDS) [1]. Transfusion dependency in LRMDS patients is associated with inferior outcomes, mainly attributed to severe bone marrow failure [2]. However, iron toxicity, due to frequent RBCT or ineffective erythropoiesis, may be an additional negative prognostic factor [3–6]. Recently, much progress has been made in unraveling the iron metabolism. The peptide hormone hepcidin is the key regulator by inhibiting iron uptake through degradation of ferroportin, a cellular iron exporter [7]. Erythroferrone and GDF15, produced by erythroblasts, inhibit hepcidin production, which leads to increased uptake and cellular release of iron for the purpose of erythropoiesis [8].
The pathophysiology of iron metabolism in MDS is still not completely understood. Exceedingly high reactive oxygen species (ROS) levels are associated with iron toxicity, disease development, and progression in MDS patients [9–12]. Malondialdehyde (MDA), resulting from lipid peroxidation of polyunsaturated fatty acids, is a biomarker of oxidative stress [10, 12]. Currently, little is known about the prognostic impact of ROS in MDS patients.
The aim of this study is twofold: (1) describe iron and oxidative stress parameters over time in LRMDS patients and (2) to assess their effect on overall and progression-free survival.
Materials and methods
The EUMDS registry prospectively collects observational data on newly diagnosed LRMDS patients from 148 centers in 16 countries in Europe and Israel as of January 2008. All patients provided informed consent. Clinical data were collected at baseline and at each six-monthly follow-up visit. Serum samples were collected prospectively at each visit from 256 patients included in six participating countries. Conventional iron parameters were measured with routine assays. We additionally analyzed hepcidin, growth differentiation factor 15 (GDF15), soluble transferrin receptor (sTfR), non-transferrin bound iron (NTBI), labile plasma iron (LPI), and MDA. Subjects were prospectively followed until death, loss to follow-up, or withdrawal of consent.
All iron parameters were measured centrally at the department of Laboratory Medicine of the Radboudumc, Nijmegen, The Netherlands. Serum samples were collected just prior to transfusion in transfusion-dependent patients and stored at −80 °C. Details on the assays and reference ranges of hepcidin, GDF15, sTfR, NTBI, LPI, and MDA are provided in the supplement.
The Spearman rank test was used to evaluate correlations between iron parameters. We stratified the results by transfusion dependency per visit and the presence of ring sideroblasts. When evaluating temporal changes in iron parameters, with linear quantile mixed models, we excluded patients from the timepoint they received iron chelation therapy. Overall survival (OS) was defined as the time from MDS diagnosis to death or, in case of progression-free survival, to date of progression or death; patients still alive at the end of follow-up were censored. Time-dependent Kaplan–Meier curves and cox proportional hazards models were used.
Results
In total, 256 consecutive patients, were included in this study. Over five six-monthly visits, 1040 samples were collected. Table 1 describes the patient characteristics. Most patients without ring sideroblasts were transfusion-independent at diagnosis (nonRS-TI; 55.9%), 18.8% with ring sideroblasts were transfusion-independent (RS-TI), 18.4% without ring sideroblasts were transfusion-dependent (nonRS-TD), and 7% with ring sideroblasts were transfusion-dependent patients (RS-TD). The median follow-up time was 6.6 years (95% CI 5.9–7.0).
Table 1.
Baseline characteristics.
| N (%) | |
|---|---|
| Total | 256 (100.0) |
| Sex | |
| Males | 169 (66.0) |
| Females | 87 (34.0) |
| Age | |
| 35–44 | 2 (0.8) |
| 45–54 | 7 (2.7) |
| 55–64 | 51 (19.9) |
| 65–74 | 78 (30.5) |
| 75+ | 118 (46.1) |
| Mean (sd) | 72.1 (9.5) |
| Median (min–max) | 74.0 (37.0–95.0) |
| MDS diagnosis | |
| RCMD | 114 (44.5) |
| RARS | 56 (21.9) |
| RA | 45 (17.6) |
| RAEB-1 | 16 (6.3) |
| RCMD-RS | 10 (3.9) |
| 5q-syndrome | 10 (3.9) |
| MDS-U | 5 (2.0) |
| Group | |
| NonRS-TI | 143 (55.9) |
| NonRS-TD | 47 (18.4) |
| RS-TI | 48 (18.8) |
| RS-TD | 18 (7.0) |
| IPSS-R category | |
| Very low/low | 195 (76.2) |
| Intermediate | 23 (9.0) |
| High/very high | 4 (1.6) |
| Not known | 34 (13.3) |
| IPSS category | |
| Low risk | 144 (56.3) |
| Intermed-1 | 75 (29.3) |
| Intermed-2 | 1 (0.4) |
| Not known | 36 (14.1) |
| Karnofsky performance status | |
| Able to work and normal activity | 193 (75.4) |
| Unable to work | 48 (18.8) |
| Unable to care for self | 1 (0.4) |
| Not known | 14 (5.5) |
| Comorbidity index | |
| Low risk | 158 (61.7) |
| Intermediate risk | 79 (30.9) |
| High risk | 19 (7.4) |
| EQ5D index score | |
| Mean (sd) | 0.77 (0.24) |
| Median (p10–p90) | 0.80 (0.52–1.00) |
| ESA | |
| No | 159 (62.1) |
| Yes | 97 (37.9) |
| Iron chelation | |
| No | 241 (94.1) |
| Yes | 15 (5.9) |
| Desferoxamine | 5 (2.0) |
| Deferiprone/deferasirox | 11 (4.3) |
| Hypomethylating agents | |
| No | 245 (95.7) |
| Yes | 11 (4.3) |
| Overall survival | |
| Median (95% CI) | 4.8 (3.9—not reached) |
| Cause of death | |
| MDS unrelated | 15 (34.1) |
| MDS related | 24 (54.5) |
| Unknown | 5 (11.4) |
| Follow-up time (censored last EUMDS visit) | |
| Median (95% CI) | 6.6 (5.9–7.0) |
sd standard deviation, MDS myelodysplastic syndrome, RCMD refractory cytopenia with multilineage dysplasia, RARS refractory anemia with ring sideroblasts, RA refractory anemia, RAEB refractory anemia with excess blasts, RCMD-RS refractory cytopenia with multilineage dysplasia with ring sideroblasts, MDS-U myelodysplastic syndrome unspecified, RS ring sideroblasts, TI transfusion-independent, TD transfusion-dependent, IPSS(-R) (revised) international prognostic scoring system, EQ5D EuroQoL five dimension scale, ESA erythroid stimulating agents.
LPI was positively correlated with transferrin saturation (TSAT) (r = 0.15, p < 0.001, Fig. S1). LPI values increased exponentially at TSAT values above 80%. This effect was most pronounced in the transfusion-dependent groups, but also observed in the RS-TI group. MDA was weakly correlated with NTBI (r = 0.09, p = 0.069) and negatively correlated with hemoglobin level (r = −0.1, p = 0.033). GDF15 and hepcidin were negatively correlated in the RS-TI and nonRS-TD group and significantly negatively correlated in the RS-TD group (r = −0.34, p = 0.007, Fig. S2).
Serum ferritin levels were elevated in all subgroups with a mean value of 858 µg/L at visit 5. The highest serum ferritin levels were observed in the RS-TD group (mean value at visit 5: 2092 µg/L, Table S1). Serum ferritin increased significantly per visit in the RS-TD group (beta 454.46 µg/L; 95% CI 334.65–574.27), but not in the other groups (Table S2).
All subgroups, except for the nonRS-TI, had elevated TSAT levels. TSAT levels were most markedly increased in the RS-TD group with a mean TSAT of 88% at visit 5 (Table S1). In both transfusion-dependent groups the median increase per visit was significant (Table S2).
LPI was elevated in the RS-TD group exclusively with a mean value of 0.59 µmol/L at visit 5 (Table S1). NTBI was elevated in all subgroups, with the highest values in the RS-TD group (Table S1). The increase in median NTBI level was significant in both transfusion-dependent groups (Table S2).
Hepcidin levels were markedly elevated in the nonRS-TD group. Interestingly, hepcidin levels were lower in the RS-TD group, probably reflecting ineffective erythropoiesis, likewise supported by lower hepcidin/ferritin ratios in RS groups (Table S1). Median hepcidin levels increased over time in the transfusion-dependent subgroups only (Table S2).
GDF15 levels, analyzed in the light of its potential role in hepcidin suppression, were increased in all subgroups (Table S1). The RS subgroups had higher GDF15 levels compared to the nonRS groups, reflecting increased erythropoiesis.
Mean sTfR levels were within the reference range in all subgroups except for the RS-TI group, which showed elevated levels, reflecting increased erythropoiesis (Table S1).
MDA levels were within the reference range in the nonRS-TI group and above the upper limit of the reference range in all other subgroups with the highest levels in the RS-TD group (Table S1). MDA levels at diagnosis were markedly higher in the RCMD-RS group compared to other subtypes (Table S3.1). As expected, in the group with elevated MDA levels, the transfusion density was markedly higher as compared with patients with low MDA levels (Table S3.2). Overall MDA levels increased over time (p < 0.0001). The steepest increase was observed in transfusion-dependent patients, with the highest median levels over time in the RS-TD group (Table S3.3).
Overall survival (OS)
Figure 1 shows a Kaplan–Meier curve for OS, stratified by LPI above or below the lower limit of detection (LLOD) and transfusion status as time-varying variables. Transfusion-dependent patients with elevated LPI levels have inferior OS compared to other subgroups. The Cox model shows an adjusted hazard ratio (HR) for OS, corrected for age at diagnosis and IPSS-R, of 2.7 (95% CI 1.5–5.0, p = 0.001) for LPI > LLOD. With the transfusion-independent group with LPI values <LLOD as a reference, the HR for OS in the transfusion-independent group with LPI > LLOD was 4.5 (95% CI 1.4–13.9, p = 0.01), for the transfusion-dependent group with LPI < LLOD: 3.9 (95% CI 1.5–10.4, p = 0.006), and for the transfusion-dependent group with LPI > LLOD: 6.7 (95% CI 2.5–17.6, p < 0.001, Table S4).
Fig. 1. Kaplan–Meier curve overall survival stratified by labile plasma iron above or below the lower limit of detection and transfusion status as time-dependent variables.
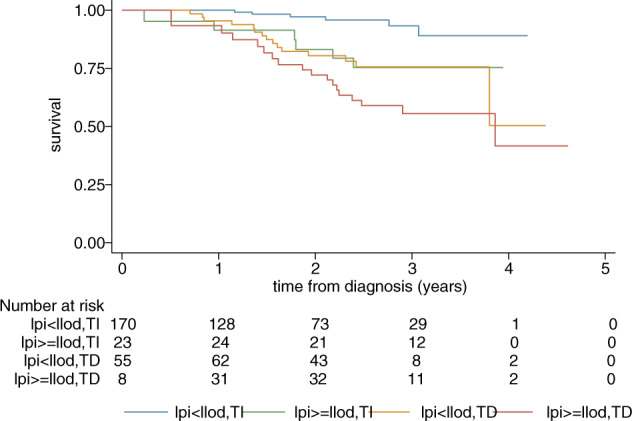
LPI labile plasma iron, LLOD lower limit of detection, TI transfusion-independent, TD transfusion-dependent.
The adjusted HR for OS for elevated NTBI was 1.6 (95% CI 0.8–3.1, p = 0.17). Transfusion-independent patients with normal NTBI levels have superior OS when compared with the other subgroups, who have significantly increased HRs for OS (Table S5).
Elevated TSAT (>80%) alone did not influence OS. However, when we repeated the analysis in the whole EUMDS registry as a dichotomous and continuous variable (n = 1076, 2853 visits), elevated TSAT did influence OS with an adjusted HR of 2.1 (95% CI 1.6–2.7, p < 0.001) and 1.009 (95% CI 1.004–1.014, p < 0.001), respectively. Transfusion-dependent patients with a TSAT ≥ 80% had the worst OS with an adjusted HR of 4.2 (95% CI 2.9–5.9, p < 0.001).
Progression-free survival
In line with the effect of LPI on OS progression-free survival is significantly inferior in transfusion-dependent patients with LPI levels >LLOD (HR 9.2, 95% CI 3.8–22.5, p < 0.001).
Discussion
The results of this study suggest that LRMDS patients who are transfusion-dependent and have a MDS subtype with ring sideroblasts have the highest levels for markers that reflect iron toxicity. Likewise, the highest hepcidin levels were observed in the transfusion-dependent nonRS group, but importantly, hepcidin levels and hepcidin/ferritin ratios were markedly lower in the transfusion-dependent patients with ring sideroblasts. Despite the excess of iron due to RBCT, hepcidin levels were lower than expected, thereby increasing the iron uptake from the gut and release of iron from the reticulo-endothelial system. Transfusion dependency is a known risk factor for iron toxicity. However, ineffective erythropoiesis in RS subgroups evidently leads to additional iron toxicity and potentially to increased morbidity and mortality [13–15]. Therefore, transfusion-dependent LRMDS patients with ring sideroblasts should be closely monitored for signs of iron toxicity and treated accordingly.
Our data suggest that LPI levels above the LLOD are associated with inferior overall and progression-free survival, irrespective of transfusion status. This highlights the importance of rational RBCT strategies in LRMDS patients. Novel hepcidin regulators as erythroferrone, hepcidin agonists, and early start of iron chelation are subjects for future research.
Overall MDA levels, as a marker of oxidative stress, increased significantly over time in our patient group. Oxidative stress due to iron toxicity could lead to organ damage as well as mutagenesis and clonal instability contributing to a higher progression risk [9–12]. Nevertheless, MDA is not an exclusive marker for oxidative stress, future research should focus on both oxidant and antioxidant factors thereby unraveling the exact relation between iron toxicity and oxidative stress.
In conclusion, iron toxicity is associated with inferior survival in LRMDS patients. More restrictive RBCT strategies and pre-emptive iron reducing interventions may prevent or reverse these unwanted effects.
Supplementary information
Acknowledgements
The authors would like to thank the other EUMDS Steering Committee members, local investigators and their teams (Table S4), and patients for their contribution to the EUMDS Registry; Jan Verhagen for his contribution in the measurement of the iron parameters; Margot Rekers, Karin van der Linden, and Siem Klaver for sample handling; Elise van Pinxten-van Orsouw and Linda van der Landen for data entry of all iron parameters; and Louise de Swart for her contribution to the analyses on the iron parameters.
EUMDS Registry Participants
R. Stauder21, A. Walder22, M. Pfeilstöcker23, A. Schoenmetzler-Makrai23, S. Burgstaller24, J. Thaler24, I. Mandac Rogulj25, M. Krejci26, J. Voglova27, P. Rohon28, A. Jonasova29, J. Cermak30, D. Mikulenkova30, I. Hochova31, P. D. Jensen32, M. S. Holm33, L. Kjeldsen34, I. H. Dufva35, H. Vestergaard36, D. Re37, B. Slama38, P. Fenaux39, B. Choufi40, S. Cheze41, D. Klepping42, B. Salles42, B. de Renzis43, L. Willems44, D. De Prost45, J. Gutnecht46, S. Courby47, V. Siguret48, G. Tertian49, L. Pascal50, M. Chaury51, E. Wattel52, A. Guerci53, L. Legros54, P. Fenaux55, R. Itzykson55, L. Ades55, F. Isnard56, L. Sanhes57, R. Benramdane58, A. Stamatoullas59, S. Amé60, O. Beyne-Rauzy61, E. Gyan62, U. Platzbecker63, C. Badrakan64, U. Germing65, M. Lübbert66, R. Schlenk67, I. Kotsianidis68, C. Tsatalas68, V. Pappa69, A. Galanopoulos70, E. Michali70, P. Panagiotidis71, N. Viniou71, A. Katsigiannis72, P. Roussou72, E. Terpos73, A. Kostourou74, Z. Kartasis75, A. Pouli76, K. Palla77, V. Briasoulis78, E. Hatzimichael78, G. Vassilopoulos79, A. Symeonidis80, A. Kourakli80, P. Zikos81, A. Anagnostopoulos82, M. Kotsopoulou83, K. Megalakaki83, M. Protopapa84, E. Vlachaki85, P. Konstantinidou86, G. Stemer87, A. Nemetz88, U. Gotwin89, O. Cohen89, M. Koren89, E. Levy90, U. Greenbaum90, S. Gino-Moor91, M. Price92, Y. Ofran93, A. Winder94, N. Goldshmidt95, S. Elias, R. Sabag95, I. Hellman96, M. Ellis96, A. Braester97, H. Rosenbaum98, S. Berdichevsky99, G. Itzhaki100, O. Wolaj100, S. Yeganeh101, O. Katz101, K. Filanovsky102, N. Dali103, M. Mittelman104, L. Malcovati105, L. Fianchi106, A. vd Loosdrecht107, V. Matthijssen108, A. Herbers109, H. Pruijt109, N. Aboosy110, F. de Vries110, G. Velders111, E. Jacobs112, S. Langemeijer113, M. MacKenzie113, C. Lensen114, P. Kuijper115, K. Madry116, M. Camara117, A. Almeida117, G. Vulkan118, O. Stanca Ciocan119, A. Tatic120, A. Savic121, C. Pedro122, B. Xicoy123, P. Leiva124, J. Munoz125, V. Betés126, C. Benavente127, M. Lozano128, M. Martinez128, P. Iniesta129, T. Bernal130, M. Diez Campelo131, D. Tormo132, R. Andreu Lapiedra133, G. Sanz134, E. Hesse Sundin135, H. Garelius136, C. Karlsson137, P. Antunovic138, A. Jönsson138, L. Brandefors139, L. Nilsson140, P. Kozlowski141, E. Hellstrom-Lindberg142, M. Grövdal143, K. Larsson144, J. Wallvik144, F. Lorenz145, E. Ejerblad146, D. Culligan147, C. Craddock148, S. Kolade149, P. Cahalin149, S. Killick150, S. Ackroyd151, C. Wong152, A. Warren152, M. Drummond153, C. Hall154, K. Rothwell155, S. Green156, S. Ali156, D. Bowen157, M. Karakantza157, M. Dennis158, G. Jones159, J. Parker160, A. Bowen160, R. Radia161, E. Das-Gupta161, P. Vyas162, E. Nga163, D. Creagh164, J. Ashcroft165, J. Mills166, L. Bond167
Funding
The EUMDS Registry is supported by an educational grant from Novartis Pharmacy B.V. Oncology Europe, and Amgen Limited. This work is part of the MDS-RIGHT activities, which has received funding from the European Union’s Horizon 2020 Research and Innovation Programme under Grant Agreement No. 634789 MDS-RIGHT—“Providing the right care to the right patient with MyeloDysplastic Syndrome at the right time.” The Lifelines Biobank initiative has been made possible by subsidy from the Dutch Ministry of Health, Welfare and Sport, the Dutch Ministry of Economic Affairs, the University Medical Center Groningen (UMCG the Netherlands), University Groningen, and the Northern Provinces of the Netherlands. The authors wish to acknowledge the services of the Lifelines Cohort Study, the contributing research centers delivering data to Lifelines, and all the study participants.
Author contributions
Design: MH, TB, CvM, ASm, SL, TdW; provision of patients, assembly of data: DB, DC, SK, ASy, HG, MS, SL, AT, SK, PP, OS, EH-L, JC, MvK, HW, RR, EW, DWS; statistical analysis and interpretation: MH, TB, CvM, ASm, TdW; manuscript writing: all authors; final approval: all authors.
Compliance with ethical standards
Conflict of interest
CvM: project manager of the EUMDS Registry, is funded by the EUMDS and MDS-RIGHT project budget; ASm: research funding from Novartis, Cilag-Janssen, and Boehringer Ingelheim; ASy: honoraria and consulting fees from Amgen, Celgene/GenesisPharma, Genzyme/Sanofi, Gilead, Janssen-Cilag, Pfizer, MSD, and Novartis; HG: honoraria from Celgene, Novartis, and Alexion; SK: honoraria from Novartis, Jazz, and Celgene; EH-L: research funding from Celgene; NB: research funding from Novartis, Bristol Meyer Squibb, Pfizer, Ariad, MSD, Astellas, Xenikos, and Celgene, educational grant from Novartis, Celgene, and Janssen-Cilag; DWS: paid employee of RadboudUMC, which offers hepcidin measurements via Hepcidinanalysis.com at a fee for service basis; TdW: research funding from Amgen, Celgene, and Novartis, as project coordinator EUMDS. The other authors declare that they have no conflict of interest.
Footnotes
Members of the EUMDS Registry Participants are listed below Acknowledgements.
Publisher’s note Springer Nature remains neutral with regard to jurisdictional claims in published maps and institutional affiliations.
Contributor Information
Marlijn Hoeks, Email: marlijn.hoeks@radboudumc.nl.
on behalf of the EUMDS Registry Participants:
R. Stauder, A. Walder, M. Pfeilstöcker, A. Schoenmetzler-Makrai, S. Burgstaller, J. Thaler, I. Mandac Rogulj, M. Krejci, J. Voglova, P. Rohon, A. Jonasova, J. Cermak, D. Mikulenkova, I. Hochova, P. D. Jensen, M. S. Holm, L. Kjeldsen, I. H. Dufva, H. Vestergaard, D. Re, B. Slama, P. Fenaux, B. Choufi, S. Cheze, D. Klepping, B. Salles, B. de Renzis, L. Willems, D. De Prost, J. Gutnecht, S. Courby, V. Siguret, G. Tertian, L. Pascal, M. Chaury, E. Wattel, A. Guerci, L. Legros, P. Fenaux, R. Itzykson, L. Ades, F. Isnard, L. Sanhes, R. Benramdane, A. Stamatoullas, S. Amé, O. Beyne-Rauzy, E. Gyan, U. Platzbecker, C. Badrakan, U. Germing, M. Lübbert, R. Schlenk, I. Kotsianidis, C. Tsatalas, V. Pappa, A. Galanopoulos, E. Michali, P. Panagiotidis, N. Viniou, A. Katsigiannis, P. Roussou, E. Terpos, A. Kostourou, Z. Kartasis, A. Pouli, K. Palla, V. Briasoulis, E. Hatzimichael, G. Vassilopoulos, A. Symeonidis, A. Kourakli, P. Zikos, A. Anagnostopoulos, M. Kotsopoulou, K. Megalakaki, M. Protopapa, E. Vlachaki, P. Konstantinidou, G. Stemer, A. Nemetz, U. Gotwin, O. Cohen, M. Koren, E. Levy, U. Greenbaum, S. Gino-Moor, M. Price, Y. Ofran, A. Winder, N. Goldshmidt, S. Elias, R. Sabag, I. Hellman, M. Ellis, A. Braester, H. Rosenbaum, S. Berdichevsky, G. Itzhaki, O. Wolaj, S. Yeganeh, O. Katz, K. Filanovsky, N. Dali, M. Mittelman, L. Malcovati, L. Fianchi, A. vd Loosdrecht, V. Matthijssen, A. Herbers, H. Pruijt, N. Aboosy, F. de Vries, G. Velders, E. Jacobs, S. Langemeijer, M. MacKenzie, C. Lensen, P. Kuijper, K. Madry, M. Camara, A. Almeida, G. Vulkan, O. Stanca Ciocan, A. Tatic, A. Savic, C. Pedro, B. Xicoy, P. Leiva, J. Munoz, V. Betes, C. Benavente, M. Lozano, M. Martinez, P. Iniesta, T. Bernal, M. Diez Campelo, D. Tormo, R. Andreu Lapiedra, G. Sanz, E. Hesse Sundin, H. Garelius, C. Karlsson, P. Antunovic, A. Jönsson, L. Brandefors, L. Nilsson, P. Kozlowski, E. Hellstrom-Lindberg, M. Grövdal, K. Larsson, J. Wallvik, F. Lorenz, E. Ejerblad, D. Culligan, C. Craddock, S. Kolade, P. Cahalin, S. Killick, S. Ackroyd, C. Wong, A. Warren, M. Drummond, C. Hall, K. Rothwell, S. Green, S. Ali, D. Bowen, M. Karakantza, M. Dennis, G. Jones, J. Parker, A. Bowen, R. Radia, E. Das-Gupta, P. Vyas, E. Nga, D. Creagh, J. Ashcroft, J. Mills, and L. Bond
Supplementary information
The online version of this article (10.1038/s41375-020-01022-2) contains supplementary material, which is available to authorized users.
References
- 1.Cazzola M, Della Porta MG, Malcovati L. Clinical relevance of anemia and transfusion iron overload in myelodysplastic syndromes. Hematology Am Soc Hematol Educ Program. 2008;1:166–75. doi: 10.1182/asheducation-2008.1.166. [DOI] [PubMed] [Google Scholar]
- 2.Malcovati L, Porta MG, Pascutto C, Invernizzi R, Boni M, Travaglino E, et al. Prognostic factors and life expectancy in myelodysplastic syndromes classified according to WHO criteria: a basis for clinical decision making. J Clin Oncol. 2005;23:7594–603. doi: 10.1200/JCO.2005.01.7038. [DOI] [PubMed] [Google Scholar]
- 3.Leitch HA, Fibach E, Rachmilewitz E. Toxicity of iron overload and iron overload reduction in the setting of hematopoietic stem cell transplantation for hematologic malignancies. Crit Rev Oncol Hematol. 2017;113:156–70. doi: 10.1016/j.critrevonc.2017.03.002. [DOI] [PubMed] [Google Scholar]
- 4.Shenoy N, Vallumsetla N, Rachmilewitz E, Verma A, Ginzburg Y. Impact of iron overload and potential benefit from iron chelation in low-risk myelodysplastic syndrome. Blood. 2014;124:873–81. doi: 10.1182/blood-2014-03-563221. [DOI] [PMC free article] [PubMed] [Google Scholar]
- 5.de Swart L, Reiniers C, Bagguley T, van Marrewijk C, Bowen D, Hellström-Lindberg E, et al. Labile plasma iron levels predict survival in patients with lower-risk myelodysplastic syndromes. Haematologica. 2018;103:69–79. doi: 10.3324/haematol.2017.171884. [DOI] [PMC free article] [PubMed] [Google Scholar]
- 6.Porter JB, de Witte T, Cappellini MD, Gattermann N. New insights into transfusion-related iron toxicity: Implications for the oncologist. Crit Rev Oncol Hematol. 2016;99:261–71. doi: 10.1016/j.critrevonc.2015.11.017. [DOI] [PubMed] [Google Scholar]
- 7.Ganz T, Nemeth E. Hepcidin and iron homeostasis. Biochim Biophys Acta. 2012;1823:1434–43. doi: 10.1016/j.bbamcr.2012.01.014. [DOI] [PMC free article] [PubMed] [Google Scholar]
- 8.Kautz L, Jung G, Valore EV, Rivella S, Nemeth E, Ganz T. Identification of erythroferrone as an erythroid regulator of iron metabolism. Nat Genet. 2014;46:678–84. doi: 10.1038/ng.2996. [DOI] [PMC free article] [PubMed] [Google Scholar]
- 9.Ye ZW, Zhang J, Townsend DM, Tew KD. Oxidative stress, redox regulation and diseases of cellular differentiation. Biochim Biophys Acta. 2015;1850:1607–21. doi: 10.1016/j.bbagen.2014.11.010. [DOI] [PMC free article] [PubMed] [Google Scholar]
- 10.Pimková K, Chrastinová L, Suttnar J, Štikarová J, Kotlín R, Čermák J, et al. Plasma levels of aminothiols, nitrite, nitrate, and malondialdehyde in myelodysplastic syndromes in the context of clinical outcomes and as a consequence of iron overload. Oxid Med Cell Longev. 2014;2014:416028. doi: 10.1155/2014/416028. [DOI] [PMC free article] [PubMed] [Google Scholar]
- 11.Pilo F, Angelucci E. A storm in the niche: Iron, oxidative stress and haemopoiesis. Blood Rev. 2018;32:29–35. doi: 10.1016/j.blre.2017.08.005. [DOI] [PubMed] [Google Scholar]
- 12.de Souza GF, Barbosa MC, Santos TE, Carvalho TM, de Freitas RM, Martins MR, et al. Increased parameters of oxidative stress and its relation to transfusion iron overload in patients with myelodysplastic syndromes. J Clin Pathol. 2013;66:996–8. doi: 10.1136/jclinpath-2012-201288. [DOI] [PubMed] [Google Scholar]
- 13.Santini V, Girelli D, Sanna A, Martinelli N, Duca L, Campostrini N, et al. Hepcidin levels and their determinants in different types of myelodysplastic syndromes. PLoS ONE. 2011;6:e23109. doi: 10.1371/journal.pone.0023109. [DOI] [PMC free article] [PubMed] [Google Scholar]
- 14.Ambaglio I, Malcovati L, Papaemmanuil E, Laarakkers CM, Della Porta MG, Gallì A, et al. Inappropriately low hepcidin levels in patients with myelodysplastic syndrome carrying a somatic mutation of SF3B1. Haematologica. 2013;98:420–3. doi: 10.3324/haematol.2012.077446. [DOI] [PMC free article] [PubMed] [Google Scholar]
- 15.Zipperer E, Post JG, Herkert M, Kündgen A, Fox F, Haas R, et al. Serum hepcidin measured with an improved ELISA correlates with parameters of iron metabolism in patients with myelodysplastic syndrome. Ann Hematol. 2013;92:1617–23. doi: 10.1007/s00277-013-1839-5. [DOI] [PubMed] [Google Scholar]
Associated Data
This section collects any data citations, data availability statements, or supplementary materials included in this article.