Abstract
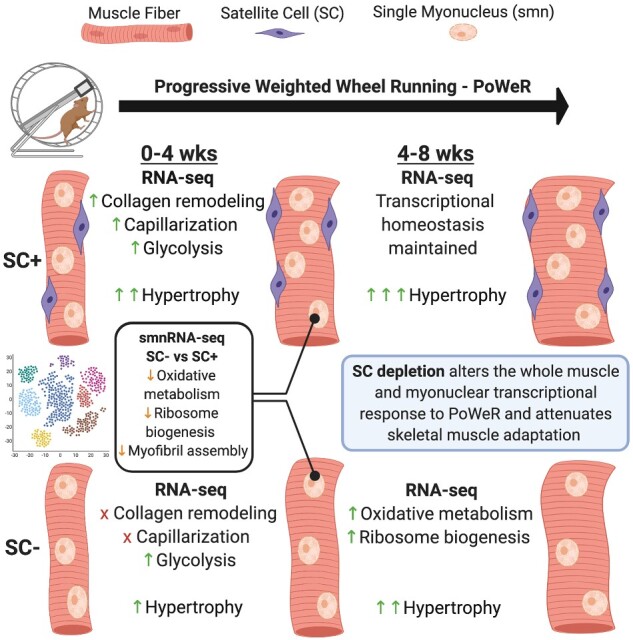
Satellite cells are required for postnatal development, skeletal muscle regeneration across the lifespan, and skeletal muscle hypertrophy prior to maturity. Our group has aimed to address whether satellite cells are required for hypertrophic growth in mature skeletal muscle. Here, we generated a comprehensive characterization and transcriptome-wide profiling of skeletal muscle during adaptation to exercise in the presence or absence of satellite cells in order to identify distinct phenotypes and gene networks influenced by satellite cell content. We administered vehicle or tamoxifen to adult Pax7-DTA mice and subjected them to progressive weighted wheel running (PoWeR). We then performed immunohistochemical analysis and whole-muscle RNA-seq of vehicle (SC+) and tamoxifen-treated (SC−) mice. Further, we performed single myonuclear RNA-seq to provide detailed information on how satellite cell fusion affects myonuclear transcription. We show that while skeletal muscle can mount a robust hypertrophic response to PoWeR in the absence of satellite cells, growth, and adaptation are ultimately blunted. Transcriptional profiling reveals several gene networks key to muscle adaptation are altered in the absence of satellite cells.
Keywords: satellite cell, muscle stem cell, Pax7, exercise, hypertrophy, adaptation, muscle function
Graphical Abstract
Introduction
Satellite cells, the resident muscle stem cell, are required for postnatal development, skeletal muscle regeneration across the lifespan, and skeletal muscle growth before maturity (<4 months old).1–4 Certain groups, including our own, have aimed to address the role of satellite cells during hypertrophic growth in response to mechanical loading, anabolic agents, and exercise in mature skeletal muscle.2,5–9 Our laboratory has leveraged the Pax7CreER; R26DTA/+ (Pax7-DTA) strain to deplete satellite cells at several time points and over various durations to gain a fundamental understanding of the requirements of satellite cells during adaptation.3,5,9–11 We have reported that satellite cells are not required for hypertrophy in response to short-term testosterone administration or synergist ablation induced mechanical overload; however, we have discovered that sustained periods of muscle growth during long-term synergist ablation or wheel running requires satellite cells for maximal adaptation.5,6,9
While synergist ablation has classically been utilized to study muscle hypertrophy in mice, several groups have recently developed models of muscle growth and adaptation that can be more easily translated to humans.12–14 We have developed a progressive weighted wheel running (PoWeR) protocol that induces robust skeletal muscle adaptation and growth with a resulting phenotype very similar to that of progressive cycle training in humans.15,16 This new model provides an opportunity to perform rigorous studies to generate novel insight that further elucidates how satellite cells regulate skeletal muscle adaptation to exercise.
Here, we aimed to generate a comprehensive characterization and transcriptome-wide profiling of skeletal muscle during growth and adaptation to PoWeR in the presence and absence of satellite cells in order to identify distinct phenotypes and gene networks influenced by satellite cell content. We subjected Pax7-DTA mice to 4 and 8 weeks of PoWeR and performed immunohistochemistry (IHC) on the soleus (oxidative phenotype) and plantaris (mixed oxidative and glycolytic phenotype) of vehicle- (SC+) and tamoxifen-treated (SC−) mice and whole-muscle RNA-sequencing (RNA-seq) on the soleus. We further performed single-myonuclear RNA-seq (smnRNA-seq) on the soleus muscle of SC+ and SC− mice after PoWeR to provide detailed information on how satellite cells/fusion affects myonuclear transcription. We show that while skeletal muscle can mount an adaptive response to PoWeR in the absence of satellite cells, hypertrophic growth and adaptation are attenuated in both the soleus and plantaris. Transcriptome-wide profiling of the soleus revealed several gene networks key to muscle adaptation are altered in the absence of satellite cells at the 4- and 8-week time points.
Results
PoWeR-Induced Muscle Hypertrophy Is Blunted in the Absence of Satellite Cells
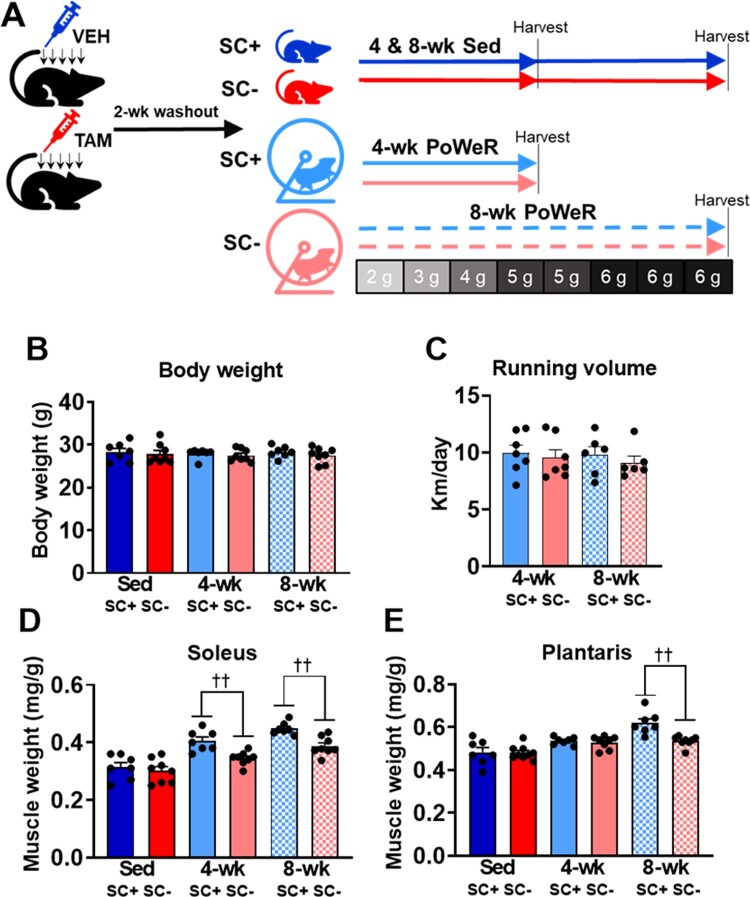
The study design is shown in Figure 1A. Neither satellite cell depletion (SC−) nor PoWeR influenced body weight over the duration of the study (Figure 1B). Mice ran equal amounts over the 4-week and 8-week PoWeR protocols and this was not influenced by the presence of satellite cells (Figure 1C). PoWeR induced higher normalized soleus weight after 4 weeks and 8 weeks of PoWeR in SC+ and SC− groups; however, this effect was blunted at both time points in the absence of satellite cells (Figure 1D). PoWeR also induced higher normalized plantaris weight after 4 and 8 weeks of PoWeR in SC+ and SC− groups which were blunted at 8 weeks in the absence of satellite cells (Figure 1E). Tamoxifen administration did not influence body or muscle weights in sedentary controls, nor did it influence body weight or higher muscle weights after 8 weeks of PoWeR in parental Pax7-CreER mice (Figures S1A–C).
Figure 1.
Satellite cell depletion blunted higher muscle weights induced by PoWeR. (A) Study design for Sedentary (Sed) and PoWeR-trained satellite cell replete (SC+) and deplete (SC−) mice. The amount of weight in grams added to the wheel each week during PoWeR is indicated. (B) Endpoint body weights across all groups. (C) Average running volume after 4-weeks and 8-weeks of PoWeR. (D) Normalized muscle weight in the soleus. (E) Normalized muscle weight in the plantaris. Data are represented as mean ± SEM. Statistical analysis: two-way ANOVA with Tukey’s multiple comparisons test. PoWeR led to higher muscle weights at 4-weeks (P < 0.0001) and 8-weeks (P < 0.0001) in the soleus and at 4-weeks (P < 0.01) and 8-weeks (P < 0.0001) in the plantaris. There was a significant effect for satellite cell depletion blunting this adaptation. ††P < 0.01.
Higher Satellite Cell Density in the Soleus and Plantaris of SC+ PoWeR-Trained Mice
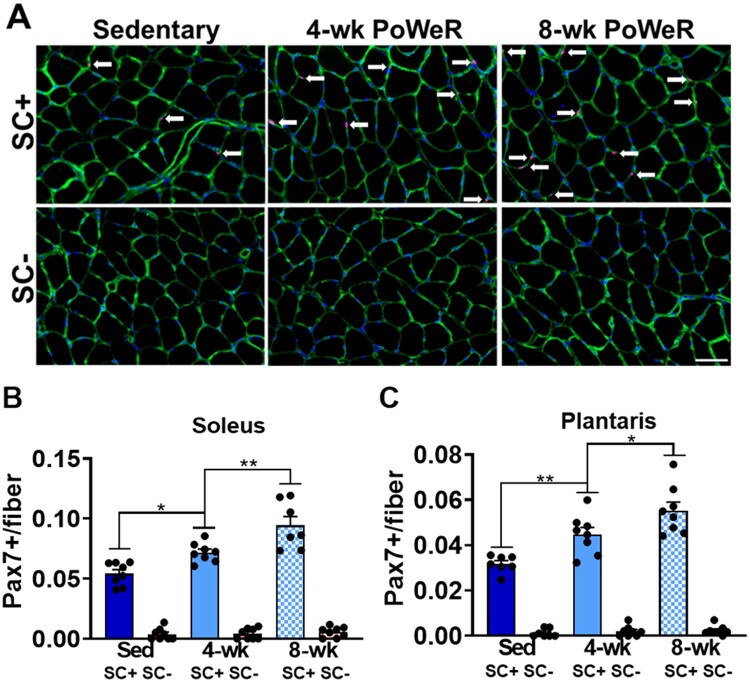
Tamoxifen administration depleted satellite cells ≥90% in the soleus and plantaris in sedentary and PoWeR-trained mice. This is shown qualitatively in representative IHC images from the soleus (Figure 2A) and quantitatively in the soleus and plantaris (Figures 2B and C). PoWeR training led to higher satellite cell density at 4- and 8 weeks in the SC+ soleus and plantaris (Figure 2B and C).
Figure 2.
PoWeR led to higher satellite cell content in the soleus and plantaris in SC+ mice. (A) Representative images of satellite cell IHC from the soleus across all groups showing laminin (green), nuclei (blue), and Pax7 (red; white arrows). (B) Satellite cell density in the soleus. (C) Satellite cell density in the plantaris. Scale bar = 50 µm. Data are represented as mean ± SEM. Statistical analysis: two-way ANOVA with Tukey’s multiple comparisons test. There was a main effect for PoWeR (P < 0.0001) and satellite cell depletion (P < 0.0001) in both the soleus and plantaris. There was a significant interaction between PoWeR and satellite cell content in the soleus (P < 0.001) and plantaris (P < 0.0001). *P < 0.05, **P < 0.01.
PoWeR Promoted a Shift in Fiber Type Distribution in the Plantaris, Independent of Satellite Cell Content
Four weeks of PoWeR training led to a myosin heavy chain (MyHC) 2b to MyHC 2a shift in fiber type distribution in the plantaris, which was unaffected by satellite cell depletion. This is shown qualitatively in representative IHC images (Figure S2A) and quantitatively in Figure S2B. Fiber type distribution did not differ between 4 and 8 weeks of PoWeR in the plantaris (Figure 2B). The soleus did not show any alterations in fiber type distribution in response to PoWeR (Figure 2C).
Higher Myonuclear Density and Fiber Size in the Soleus and Plantaris of SC+ Compared to SC− PoWeR-Trained Mice
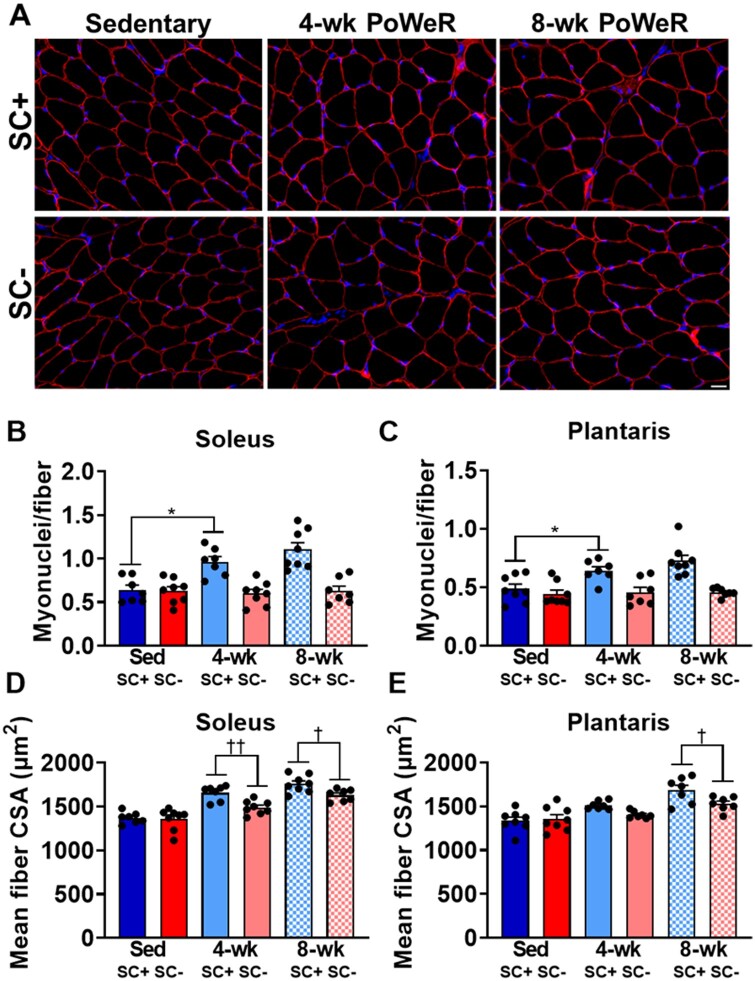
PoWeR training led to higher myonuclear density at the 4-week time point in the soleus and plantaris in SC+ PoWeR-trained mice, which did not increase further at 8-week time points. No increase in myonuclear content was apparent in SC− muscle at either time point. This is shown qualitatively in representative IHC images from the soleus (Figure 3A) and quantitatively in the soleus and plantaris (Figures 3B and C). PoWeR training led to larger muscle fiber size at 4- and 8-week time points in both the soleus and plantaris in SC+ and SC− groups; however, satellite cell depletion blunted muscle fiber hypertrophy at 4- and 8-week time points in the soleus and at 8-week time point in the plantaris (Figures 3D and E). To examine how satellite cell content transcriptionally influenced both short- and long-term muscle adaptation, RNA-seq was performed on the soleus as it displayed blunted muscle fiber hypertrophy at both the 4-week and 8-week time points.
Figure 3.
Satellite cell depletion inhibited myonuclear accretion and blunted muscle fiber hypertrophy in response to PoWeR. (A) Representative IHC images from the soleus across all groups showing dystrophin (red) and nuclei (blue). (B) Myonuclear cell density in the soleus. (C) Myonuclear density in the plantaris. (D) Mean fiber CSA in the soleus. (E) Mean fiber CSA in the plantaris. Scale bar = 20 µm. Data are represented as mean ± SEM. Statistical analysis: two-way ANOVA with Tukey’s multiple comparisons test. (B) and (C) There was a main effect for PoWeR (P < 0.05) and satellite cell depletion (P < 0.001) in the soleus and a main effect for PoWeR (P < 0.01) and satellite cell depletion (P < 0.0001) in the plantaris. There was a significant interaction between PoWeR and satellite cell depletion in the soleus (P < 0.05) and plantaris (P < 0.05). (D) and (E) PoWeR led to higher muscle fiber CSA at 4-weeks (P < 0.0001) and 8-weeks (P < 0.0001) in the soleus and at 4-weeks (P < 0.05) and 8-weeks (P < 0.0001) in the plantaris. There was a significant effect for satellite cell depletion blunting this adaptation. *P < 0.05, †P < 0.05, ††P < 0.01.
Whole-Muscle RNA-Seq Reveals Altered Gene Expression During Adaptation to 4 Weeks of PoWeR in Satellite Cell-Depleted Soleus Muscle
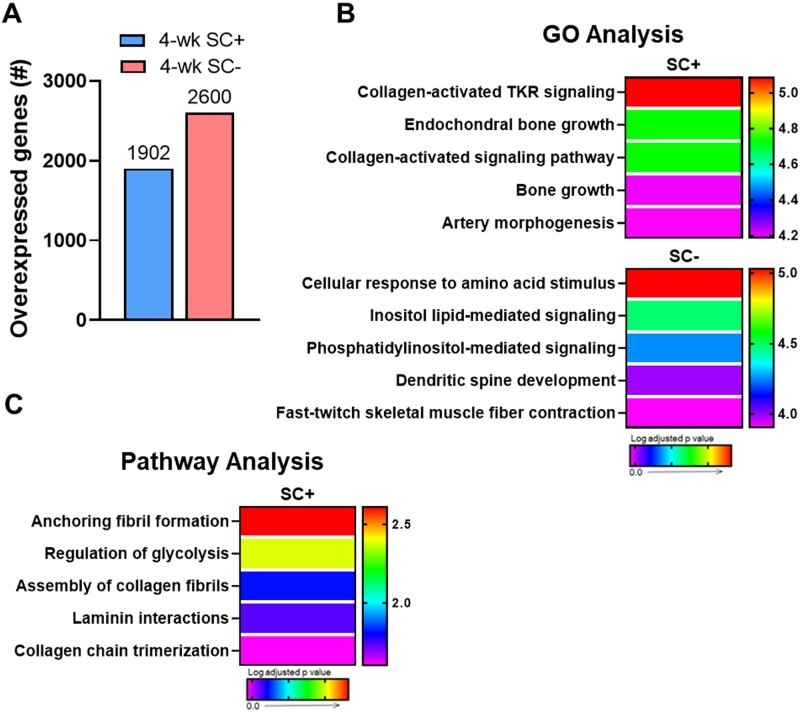
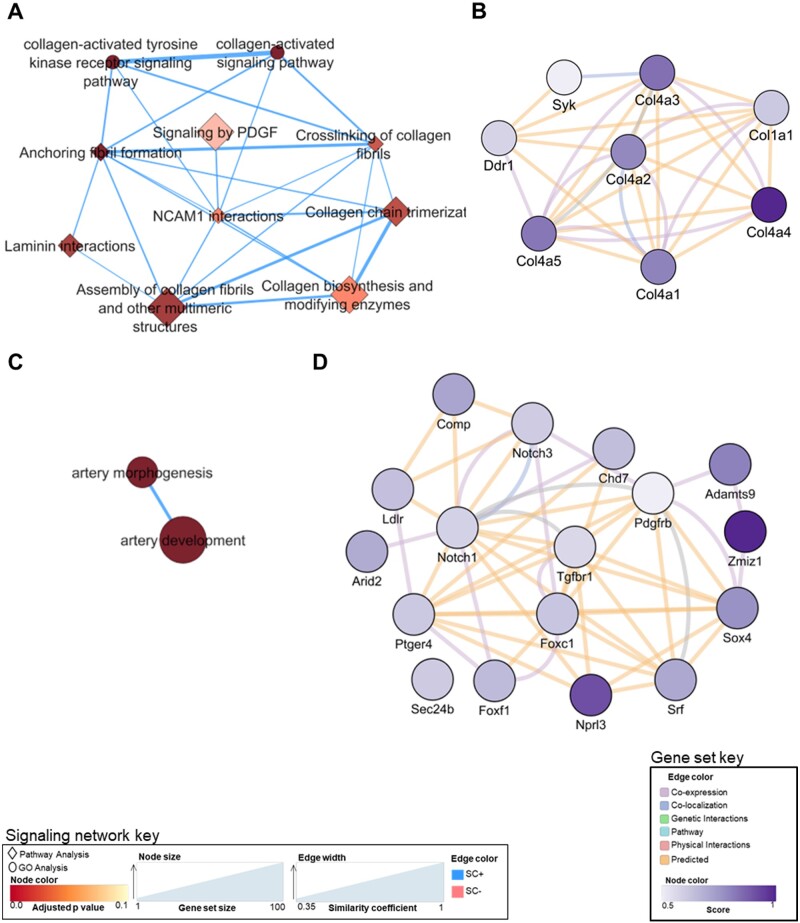
To identify gene networks contributing to blunted muscle fiber hypertrophy in SC− soleus, we performed whole-muscle RNA-seq on satellite cell replete and deplete soleus. After 4-weeks of PoWeR training, 1902 genes were overexpressed in SC+ soleus and 2600 were overexpressed in SC−soleus relative to their sham controls (Figure 4A). Gene ontology (GO) and pathway analyses revealed substantial differences in gene expression profiles in response to 4-weeks of PoWeR between SC+ and SC− soleus (Figures 4B and C). While both SC+ and SC− soleus displayed increased expression of genes promoting glycolysis, genes involved in extracellular matrix (ECM) remodeling and capillarization were significantly overexpressed only in the in SC+ soleus in response to PoWeR (Figure 4B and C). Enrichment mapping, combining GO and pathway analyses, allowed more detailed analyses of the pathways that comprise the nodes of gene networks differentially enriched in SC+ (blue) or SC− (pink) soleus. Figure 5A expands the ECM remodeling network and Figure 5C expands the capillarization network, with the color of each node scaled to the adjusted P-value and the node size scaled to the gene set size. Edge sizes connecting nodes were scaled to the similarity coefficient (genes shared between nodes). Highly enriched nodes in the ECM remodeling (Figure 5B) and capillarization (Figure 5D) networks, specific to SC+ soleus muscle, were further analyzed in GeneMANIA to visualize and provide information around the genes enriching each node. The color of the node for each gene is scaled to an interaction score, defined as the effect of a given gene on the selected pathway. Edges represent network categories (see “Materials and Methods” section for detailed description).
Figure 4.
Collagen remodeling and capillarization pathways were enriched only in the presence of satellite cells after 4-weeks of PoWeR in the soleus. (A) Bar graph showing the number of overexpressed genes in the soleus (whole-muscle RNA-seq) after 4-weeks of PoWeR in SC+ and SC− skeletal muscle 24 h after the last bout of exercise relative to sham controls. (B) The most highly enriched biological processes (GO Analysis) for both groups. (C) The most highly enriched Reactome pathways (Pathway Analysis) for the SC+ group. The SC− group had no statistically enriched pathways.
Figure 5.
Enriched signaling networks and gene sets specific to SC+ soleus. (A) Collagen signaling network. (B) Gene set enriching the collagen-activated tyrosine kinase receptor signaling pathway node. (C) Capillarization signaling network. (D) Gene set enriching the artery morphogenesis node.
After 4-weeks of PoWeR training, 1844 genes were underexpressed in SC+ soleus and 2502 were underexpressed in SC− soleus compared to their sham controls (Figure S3A). Enrichment analyses showed similarity in the pathways downregulated in response to 4-weeks of PoWeR between SC+ and SC− soleus (Figures S3B and C), including downregulation of oxidative metabolism and ribosome biogenesis. We also performed whole muscle RNA-seq on SC+ and SC− plantaris to examine if similar changes would occur in a different muscle undergoing adaptation to PoWeR. Supporting findings in the soleus, there is an upregulation in glycolytic gene networks and a downregulation in ribosome biogenesis gene networks in SC+ and SC− plantaris (Figures S4A–C and S5A–C).
Analysis of the Myonuclear Transcriptome after 4-Weeks of PoWeR Revealed Downregulation of Translation and Oxidative Metabolism Genes Specific to Satellite Cell Deplete Soleus
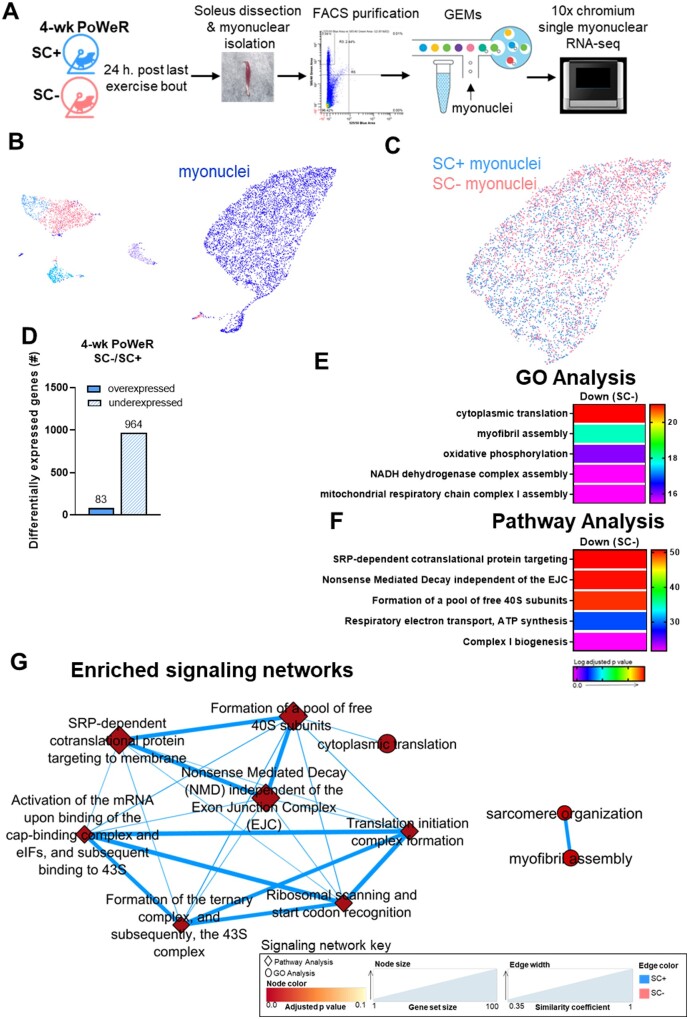
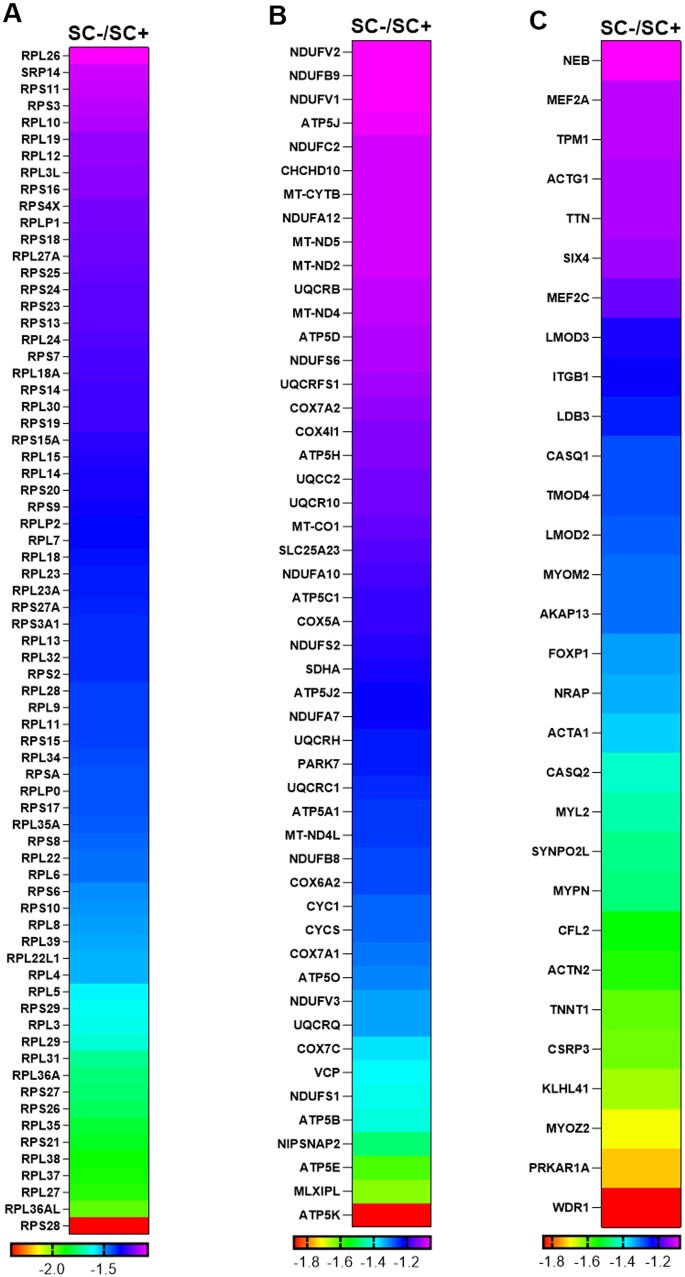
In order to examine the myonuclear transcriptome in relation to the whole-muscle transcriptome, we performed RNA-seq on individual isolated myonuclei (smnRNA-seq) from SC+ and SC− soleus muscles after 4-weeks of PoWeR. A schematic of the workflow is shown in Figure 6A. The UMAP plot shows unbiased clustering of the combined data from SC+ and SC− soleus muscles, with the myonuclear cluster indicated (Figure 6B). Myonuclei within this cluster derived from SC+ muscle are shown in blue and from SC− muscle in pink in Figure 6C. Myonuclei from SC− soleus showed 964 underexpressed genes and 83 overexpressed genes when compared to SC+ myonuclei (Figure 6D). GO and pathway analysis of the myonuclear transcriptome revealed lower expression of genes involved in ribosome biogenesis, oxidative metabolism, and sarcomeric adaptation in SC− soleus, demonstrating a substantial suppression of these pathways after PoWeR in the absence of satellite cells (Figure 6E–G). An expanded list of the genes in these enriched pathways and their expression levels are shown in Figure 7A–C.
Figure 6.
Myonuclear transcriptome reveals a greater downregulation of oxidative, ribosomal, and sarcomeric pathways in the absence of satellite cells in the soleus. (A) Schematic of myonuclear isolation and sequencing from skeletal muscle following PoWeR. (B) Unbiased cluster of smnRNA-seq data, including all cell types and myonuclei from SC+ and SC− mice represented on a UMAP plot. (C) Distinct myonuclear cluster showing myonuclei from SC+ muscle in blue and SC− muscle in pink. (D) Bar graph showing the number of over and underexpressed genes in the soleus after 4-weeks of PoWeR in SC+ skeletal muscle when compared to SC− skeletal muscle. The most highly enriched (E) biological processes (GO Analysis) and (F) Reactome pathways (Pathway Analysis). (G) Translation and sarcomeric signaling networks.
Figure 7.
Muscle adaptation signaling networks are suppressed in the absence of satellite cells in soleus. (A–C) Gene list and expression levels of the gene sets enriching (A) SRP-dependent cotranslational protein targeting to membrane, (B) oxidative phosphorylation, and (C) myofibril assembly.
SC− Soleus Displayed Delayed Transcriptional Activity after 8-Weeks of PoWeR
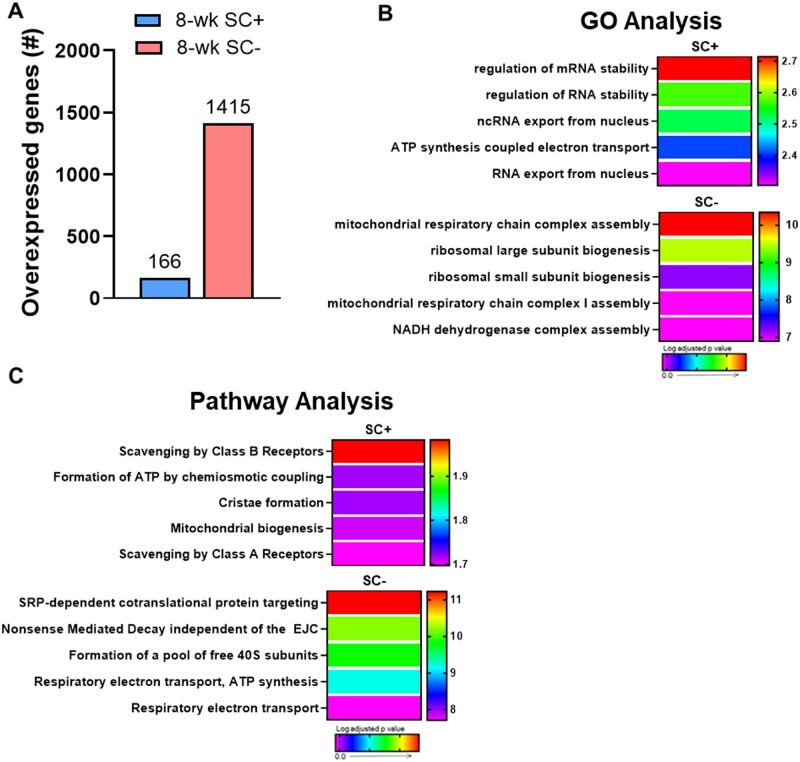
After 8-weeks of PoWeR training, only 166 genes were overexpressed in SC+ soleus while 1415 were overexpressed in SC− skeletal muscle relative to 4-week PoWeR (Figure 8A). Consistent with a robust transcriptional response, GO and pathway analyses displayed a greater degree of pathway enrichment in SC− soleus in response to 8-weeks of PoWeR (Figures 8B and C). In particular, translation and ribosome biogenesis networks were only enriched in the absence of satellite cells (Figure 8B and C and Figure S6A and B) and there was higher degree of enrichment in oxidative pathways in SC− soleus (Figure 8B and C). Pathways most highly enriched in the presence of satellite cells (eg, RNA/mRNA stability) were also upregulated in SC− soleus at 8-weeks compared to 4-weeks (Figures S6C and D).
Figure 8.
Oxidative phosphorylation and ribosome biogenesis are upregulated after 8-weeks of PoWeR only in the absence of satellite cells in the soleus. (A) Bar graph showing the number of overexpressed genes in the soleus (whole-muscle RNA-seq) after 8-weeks of PoWeR in SC+ and SC− skeletal muscle 24 h after the last bout of exercise relative to 4-week PoWeR. (B) The most highly enriched biological processes (GO Analysis) for both groups. (C) The most highly enriched Reactome pathways (Pathway Analysis) for both groups.
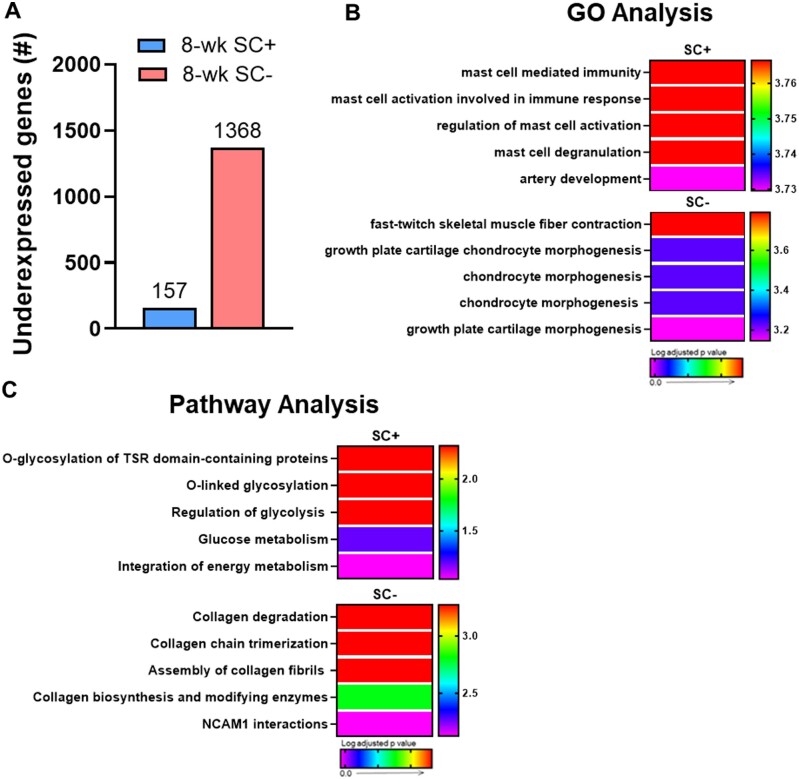
After 8-weeks of PoWeR training, 157 genes were underexpressed in SC+ soleus and 1368 were underexpressed in SC− soleus (Figure 9A), consistent with the large difference in overexpressed genes seen between groups (see Figure 8A). GO and pathway analyses revealed few pathways to be heavily enriched in either group, but heterogeneity existed in enrichment analysis between SC+ and SC− soleus (Figure 9B and C). This was driven largely by the downregulation of gene sets involved in collagen remodeling at the 8-week time point in the absence of satellite cells. The enriched pathways and biological processes in SC+ soleus were driven by a small group of genes related to immune function and another small gene set involved in suppressing glycolysis. Given the relatively large number of underexpressed genes in SC− skeletal muscle, the low level of pathway enrichment is surprising and indicates that the vast majority of these underexpressed genes do not map to known biological processes or pathways. This may represent an uncoordinated transcriptional response or be related to meaningful unmapped pathways being altered in response to PoWeR in the absence of satellite cells.
Figure 9.
Collagen remodeling is suppressed after 8-weeks of PoWeR only in the absence of satellite cells in the soleus. (A) Bar graph showing the number of underexpressed genes in the soleus (whole-muscle RNA-seq) after 8-weeks of PoWeR in SC+ and SC− skeletal muscle 24 h after the last bout of exercise relative to 4-week PoWeR. (B) The most highly enriched biological processes (GO Analysis) for both groups. (C) The most highly enriched Reactome pathways (Pathway Analysis) for both groups.
Aberrant Skeletal Muscle Adaptation in Response to PoWeR in the Absence of Satellite Cells
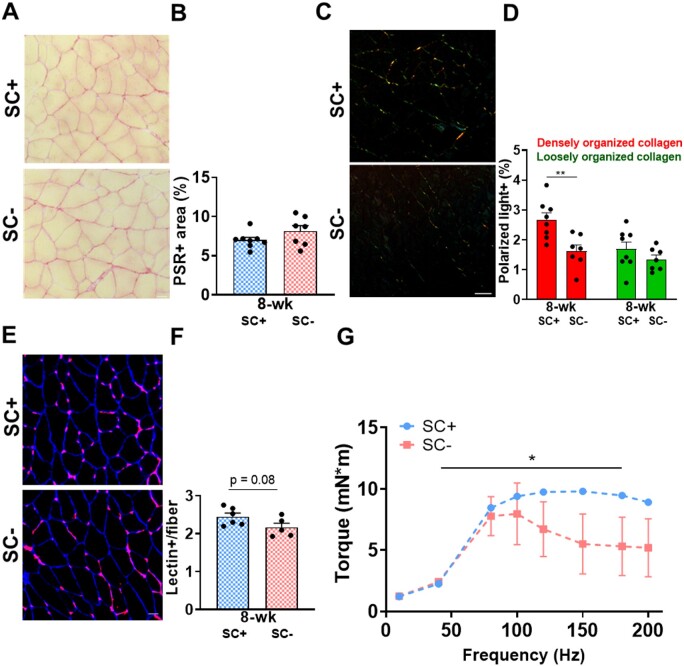
Based on the dysregulation of pathways key to skeletal muscle adaptation in the soleus in the absence of satellite cells, we aimed to determine if there was a resultant phenotype after PoWeR. We found that the total collagen area was not influenced by the presence of satellite cells in response to PoWeR. This is shown qualitatively in Picrosirius red (PSR)-stained cross sections of the soleus imaged under bright field excitation (Figure 10A), quantified in Figure 10B. We found that only in the presence of satellite cells was there an increase in densely organized collagen networks, suggesting altered collagen organization/remodeling in the absence of satellite cells. This is shown qualitatively in PSR-stained cross sections of the soleus imaged under polarized light excitation (Figure 10C), quantified in Figure 10D. We also assessed capillarization and found a trend for reduced capillary density in response to PoWeR in SC− skeletal muscle. Representative images of lectin-stained cross sections of the soleus are presented in Figure 10E and quantified in Figure 10F. To determine if this maladaptive response to exercise influence muscle strength, we assessed peak torque over a force–frequency curve and found that plantar flexor muscles from SC− mice were unable to maintain levels of peak torque when compared to SC+ muscles (Figure 10G). Neither PoWeR nor satellite cell depletion influenced gastrocnemius weight, suggesting the size of this muscle did not drive the noted differences in strength (Figure S7).
Figure 10.
Satellite cell depletion led to aberrant collagen remodeling, capillarization, and strength adaptation to PoWeR. (A) Representative PSR-stained soleus images visualized with bright field. (B) Relative area positive for PSR. (C) Representative PSR-stained soleus images visualized with polarized light. (D) Relative area of red and green emitted light. (E) Representative lectin (red) and laminin (blue) stained soleus images to identify capillaries and fibers. (F) Relative number of Lectin+ events. (G) Force frequency curve (n = 3/group). Scale bar = 50 µm. Data are represented as mean ± SEM. Statistical analyses: (B), (D), (E) unpaired two-tailed Student’s t-test, (G) repeated measures one-way ANOVA with Sidak’s multiple comparisons test. *P < 0.05, **P < 0.01.
Discussion
Whether satellite cells are required for skeletal muscle hypertrophy is a long-standing debate in the field.4,7,17 It is now apparent that robust muscle fiber hypertrophy can occur in the absence of satellite cell participation in response to anabolic pharmacological interventions.6,18–23 What remains less clear is the extent to which satellite cells are necessary to mount a growth response to an exercise (or overload) stimulus.5,7,8 The findings of this study show that while the soleus and plantaris hypertrophy and adapt to a considerable degree in the absence of satellite cells, these responses are blunted when compared to satellite cell replete muscle. This is the first report to characterize how two metabolically distinct hind limb skeletal muscles phenotypically adapt to short (4-weeks) and sustained (8-weeks) periods of muscle overload in the absence of satellite cells. Measures of strength, capillarization, and collagen content in satellite cell deplete muscle during adaption are unique to this report.
Further, the transcriptional profiling (RNA-seq) of skeletal muscle during different phases of adaptation in satellite cell deplete skeletal muscle is novel and our SMN-seq dataset is if the first of its kind. Our data show, for the first time, that a hallmark of the response to exercise in the absence of satellite cells is an immense altering of the transcriptome that is highly ineffective—failing to influence biologically meaningful processes. Further, we identify the dysregulation of several exercise-induced gene networks in the absence of satellite cells that likely contribute to a maladaptive response to exercise.
At the end of 4 weeks of PoWeR, soleus muscles from SC− mice have blunted muscle fiber hypertrophy and fail to mount a transcriptional response conducive to appropriate skeletal muscle adaptation to exercise. When compared to SC+ mice, there is a failure to increase gene networks regulating collagen turnover/remodeling. In order to determine if this aberrant transcriptional response to PoWeR in SC− mice led to phenotypic alterations, we assessed ECM composition quantifying collagen networks and total collagen content. Analysis revealed lower proportions of densely organized collagen networks in soleus muscles from SC+ compared to SC− mice after 8 weeks of PoWeR. ECM remodeling during skeletal muscle hypertrophy is a well-characterized phenomenon that is critical for transmitting force generated by muscle fibers.24,25 Forces are transmitted laterally through basement membrane collagens and longitudinally via fibrillar collagens and the capacity to transmit force is determined by the molecular composition and arrangement of the ECM.24,26 Further research is needed to determine exactly how densely organized collagen networks directly contribute to force production.
Based on the different composition of collagens comprising satellite cell deplete and replete skeletal muscle after PoWeR, we wanted to determine if there was a resultant strength phenotype by examining measures of in vivo plantar flexion torque. Our data show that while the level of peak force achieved by SC+ and SC− mice are not different, force levels drop off rapidly in SC− mice over the duration of strength testing, while peak force levels are maintained in SC+ mice. In line with this, we have previously shown that force generation of the plantaris muscle is attenuated after synergist ablation in SC− skeletal muscle.5 Here, we show increased remodeling and stiffness of collagen in skeletal muscle only occurs in the presence of satellite cells. It seems likely that in response to PoWeR or synergist ablation, altered ECM organization in the absence of satellite cells is contributing to reduced strength outcomes.26,27
While glycolytic pathways were enriched and shifts in MyHC composition occurred independent of satellite cell content, gene expression profiling showed that artery morphogenesis/capillarization pathways were preferentially activated in SC+ compared to SC− soleus, which was associated with a trend for lower capillary density in the absence of satellite cells. This suggests that the requirement for satellite cells in response to exercise is not ubiquitous and can vary between metabolic adaptations (eg, shifts in MyHC isoform vs capillarization). Capillaries are a critical component of muscle adaptation as they represent the points of exchange between the blood and surrounding tissues for oxygen, growth factors, and nutrients.28 Low capillary density is associated with blunted skeletal muscle growth in humans, and muscle-specific VEGF knockout attenuates angiogenesis and hypertrophy of the plantaris after functional overload.29–32 It is now well established that satellite cells are anatomically close to capillaries and participate in bidirectional signaling with endothelial cells (eg, VEGF signaling).33–35 Satellite cell differentiation supports angiogenesis and a recent report shows high levels of VEGFA in satellite cells, which serves to recruit blood vessel endothelial cells.33–35 Further, the report by Verma et al., showed ECM organization to be a highly enriched satellite cell to endothelial cell interaction pathway, which may in part explain our ECM findings.34 If attenuated capillarization manifests in lower maximal aerobic capacity was not addressed in this study and is an exciting area of future exploration. Further, while we show phenotypic alterations that support the enrichment of certain transcriptional networks, it should be acknowledged that a discordance between the proteomic and transcriptomic response to exercise has been reported.36
Our soleus whole-muscle RNA-seq data at the 4-week time point show both SC+ and SC− mice transcriptionally downregulate several pathways involved in oxidative metabolism and ribosome biogenesis in response to PoWeR. To determine if gene expression responses observed at the whole muscle level were generated from the muscle fiber, as opposed to other cell populations in the muscle, we analyzed the myonuclear transcriptome of the soleus after 4-weeks of PoWeR in both SC+ and SC− mice, isolating myonuclei 24 h after the last running bout, consistent with our whole-muscle data. The smnRNA-seq data show genes promoting ribosome biogenesis, sarcomeric adaptation, and oxidative phosphorylation are substantially lower in SC− compared to SC+ myonuclei, demonstrating a dysregulation of the myonuclear (muscle fiber) transcriptome in the absence of satellite cells. Downregulation of ribosomal genes in SC+ muscle corroborates what has been shown after chronic resistance training in humans and supports the idea that the downregulation of ribosome biogenesis plays a role in skeletal muscle adaptation.37 This is likely a form of energy partitioning through the stabilization of ribosomes (ribosome biogenesis is the most energy-demanding process in cells) during exercise in order to meet the transcriptional and energy demands required for metabolic adaptation, sarcomeric remodeling, and growth.38,39 However, the magnitude of transcriptional suppression in the absence of satellite cells that were detected at the myonuclear level is extreme and likely contributed to blunted growth. This transcriptional dysregulation may reflect a reliance on myonuclear addition via satellite cell fusion for the muscle fiber to effectively coordinate metabolic pathway adaptation and muscle growth in response to PoWeR. This idea is supported by the report from Omairi et al. who compared hypertrophic growth alone (Mtn−/− model) to hypertrophic growth plus metabolic adaptation (Mtn−/−ErrγTg/+ model) and found myonuclear accretion to occur only when the muscle was challenged with both growth and metabolic stimuli.21
These findings help to explain certain differences for the reliance on satellite cells based on the overload stimulus utilized; eg, synergist ablation, primarily a muscle growth stimulus, vs PoWeR, a stimulus that drives muscle growth and substantial alterations in metabolic pathways. The more granular approach taken to analyze the myonuclear transcriptome and compare it to that of the whole muscle allows us to parse out processes primarily regulated by myonuclei (ribosome biogenesis/muscle fiber assembly/metabolic adaptation) vs processes potentially regulated by other cell types which were present in our whole muscle sequencing, such as ECM remodeling via fibroblasts and capillarization via endothelial cells. Although a recent publication using single myonuclear RNA-seq demonstrated considerable heterogeneity in myonuclei,40 the extent to which the differences in myonuclear transcriptome can be attributed to newly fused satellite cell-derived myonuclei remains to be determined.
The transcriptional signature of SC+ soleus muscle at the end of 8-week time point of PoWeR varies by only a few hundred genes compared to the 4-week time point. This demonstrates SC+ muscle is capable of mounting a robust and effective transcriptional response to a novel stimulus in order to coordinate adaptation, which leads to a new transcriptional homeostasis that is maintained for the final 4 weeks of training. On the contrary, in SC− skeletal muscle, there is pronounced transcriptional heterogeneity (thousands of differentially expressed genes) between the 4-week and 8-week time points, in stark contrast to SC+ skeletal muscle, showing failure to initiate an appropriate transcriptional response to a novel stimulus over time. Interestingly, pathways downregulated at the 4-week time point (oxidative phosphorylation and ribosome biogenesis) are now upregulated at the 8-week time point only in SC− skeletal muscle. This may be indicative of delayed or compensatory transcriptional activation in resident myonuclei in the absence of satellite cell-dependent myonuclear addition to aid in adaptation.
In response to both synergist ablation and PoWeR, resident myonuclei can transcriptionally support a hypertrophic and adaptive response in the absence of satellite cells and myonuclear addition. However, muscle growth and adaptation are ultimately blunted in satellite cell deplete muscle. Attenuated growth in response to synergist ablation is associated with fibrosis, at least partially due to a lack of communication from satellite cells to fibroblasts to suppress ECM accumulation in response to the severe model of mechanical overload.5 In response to PoWeR, a more translational model of exercise, muscle does not become fibrotic in the absence of satellite cells, but growth is still attenuated and associated with aberrant ECM/collagen remodeling. Our data suggest that satellite cells are critical for a coordinated and effective transcriptional response to a novel stimulus, optimizing adaptations and muscle hypertrophy. It seems possible that satellite cells and/or fusion are not anabolic per se, but that satellite cells are a prerequisite for a coordinated transcriptional response to exercise that will lead to maximal muscle adaptation.
Materials and Methods
Animals
The Pax7CreER/+-R26DTA/+ strain, called Pax7-DTA, was generated by crossing the male Pax7CreER/CreER mouse strain with the female Rosa26DTA/DTA mouse strain.41 The Pax7-DTA mouse allows for the specific and inducible depletion of satellite cells upon tamoxifen treatment, through Cre-mediated recombination to induce expression of the diphtheria toxin A (DTA) gene in Pax7-expressing cells, effectively killing satellite cells.
All animal procedures were conducted in accordance with institutional guidelines approved by the Institutional Animal Care and Use Committee of the University of Kentucky.
Experimental Design
For initial whole-muscle RNA-seq and IHC experiments, 48 adult (6 months old) female Pax7-DTA mice were treated via intraperitoneal injection with vehicle (SC+) (15% ethanol in sunflower seed oil) or tamoxifen (SC−) at a dose of 2.5 mg/day for 5 days, as previously described.2 Following a 1-week washout period, mice were singly housed and randomly assigned to 4-week Sedentary SC+/SC− or 8-week Sedentary groups (cage with locked running wheel), 4-week PoWeR SC+/SC− groups or 8-week PoWeR SC+/SC− groups (n = 8 per group). After 1 week of acclimation to an unweighted wheel, 4-week PoWeR consisted of 2 g of weight in Week 1, 3 g in Week 2, 4 g in Week 3, 5 g in Week 4; 8-week PoWeR consisted of 2 g of weight in Week 1, 3 g in Week 2, 4 g in Week 3, 5 g in Weeks 4 and 5, and 6 g in Weeks 6–8 (Figure 1A). The wheels were loaded with 1 g magnets (product no. B661, K&J Magnetics, Pipersville, PA). ClockLab software (Actimetrics, Wilmette, IL) was used to record running behavior. The animals had access to food and water ad libitum and were checked daily for health and wellness. Running wheels were locked 24 h before sacrifice and mice were fasted overnight. Elevated mRNA expression following exercise peaks after 3–6 h and returns to baseline by 24 h.42 The gastrocnemius muscle was excised and weighed. The soleus and plantaris muscles were excised, weighed, and prepared for IHC analysis and the contralateral limb of the soleus for RNA extraction (a subset of plantaris muscles were prepared of RNA extraction), and then stored at −80°C. As there were no within or between-group differences in body or muscle weights in 4-week Sedentary SC+/SC− or 8-week Sedentary SC+/SC− mice, 4- and 8-week time points were collapsed and treated as one group for each treatment (Sedentary SC+ and Sedentary SC−). For smnRNA-seq analysis, an additional six mice were randomly assigned to the 4-week PoWeR SC+/SC− groups. Wheels were locked for 24 h before sacrifice and mice were fasted overnight. The soleus muscle from one SC+ mouse and one SC− mouse was excised and prepared immediately for smnRNA-seq. Mice from each group (SC+/SC−) were selected based on similarity in body weight and running volume over the 4-week protocol. Another group of six mice was randomly assigned to the 8-week PoWeR SC+/SC− groups for in vivo muscle function testing. Wheels were locked 48 h before testing. Adult (6 months old) female mice from the parental strain, Pax7CreER/CreER (Pax7-CreER) were also randomized to vehicle (n = 11) or tamoxifen (n = 11) treatment and then sedentary or 8-week PoWeR groups to determine the effects of tamoxifen, independent of satellite cell depletion.
Immunohistochemistry
IHC analyses were performed as previously described.3 Briefly, hind limb muscles were excised and weighed, then were pinned to a cork block at resting length and covered with Tissue Tek Optimal Cutting Temperature compound (Sakura Finetek, Torrance, CA, USA), and quickly frozen in liquid nitrogen-cooled isopentane and stored at −80°C. Frozen muscles were sectioned at −23°C (7 µm), air dried for at least 1 h, and then stored at −20°C. For determining fiber type distribution, muscle fiber cross-sectional area (CSA), fiber type-specific CSA, and myonuclear density, cross sections were incubated overnight in a cocktail of isotype-specific antimouse antibodies for MyHC 1 (1:75, IgG2B, BA.D5), MyHC 2a (neat, IgG1, SC.71), and MyHC 2b (neat, IgM, BF.F3) from Developmental Studies Hybridoma Bank (DSHB, Iowa City, IA, USA), along with an antibody against dystrophin (1:100, ab15277, Abcam, St. Louis, MO, USA), to delineate fiber borders for CSA quantification. Sections were subsequently incubated with secondary antibodies (1:250, goat anti-mouse IgG2b Alexa Fluor 647, #A21242; 1:500, IgG1 Alexa Fluor 488, #A21121; 1:250, IgM Alexa Fluor 555, #A21426) from Invitrogen (Carlsbad, CA, USA), along with the secondary antibody for dystrophin (1:150, antirabbit IgG AMCA, CI-1000, Vector), diluted in phosphate-buffered saline (PBS). Sections were mounted using VECTASHIELD with DAPI (H-1200, Vector).
Detection of Pax7+ cells was performed as previously described.2 Briefly, sections were fixed in 4% paraformaldehyde (PFA) followed by antigen retrieval using sodium citrate (10 mM, pH 6.5) at 92°C. Endogenous peroxidase activity was blocked with 3% hydrogen peroxide in PBS followed by an additional blocking step with 1% tyramide signal amplification (TSA) blocking reagent (TSA kit, T20935, Invitrogen) and Mouse-on-Mouse blocking reagent (Vector Laboratories, Burlingame, CA, USA). Pax7 primary antibody (1:100, DSHB) and laminin primary antibody (1:100, Sigma-Aldrich) were diluted in 1% TSA blocking buffer and applied overnight. Samples were then incubated with antimouse biotin-conjugated secondary antibody against the Pax7 primary antibody (1:1000, 115-065-205, Jackson ImmunoResearch, West Grove, PA, USA) and antirabbit secondary for laminin (1:250, A11034, Alexa Fluor 488, Invitrogen, Carlsbad, CA, USA). Slides were washed in PBS followed by streptavidin-horseradish peroxidase (1:500, S-911, Invitrogen) for 1 h. AlexaFluor 594 was used to visualize antibody binding for Pax7 (1:100, TSA kit, Invitrogen). Sections were mounted and nuclei were stained with VECTASHIELD with DAPI (H-1200, Vector).
For PSR and lectin staining soleus muscles were excised and pinned to a cork block at resting length and covered with Tissue Tek Optimal Cutting Temperature compound (Sakura Finetek, Torrance, CA, USA), and quickly frozen in liquid nitrogen-cooled isopentane and stored at −80°C. Muscle cross sections were stained with PSR for 1 h per the manufacturer’s instructions (24901-500; Polysciences, Warrington, PA, USA). PSR was used according to the manufacturer’s recommendations to visualize the collagen network under polarized light. Detection of capillaries was evaluated on muscle sections using lectin.43 Fresh muscle sections were cut and allowed to air dry for 4 h, rehydrated with PBS, blocked in 2.5% normal horse serum (NHS, Vector Laboratories, S-2012), and incubated in Texas Red conjugated lectin from Griffonia simplicifolia (1:50) diluted in 2.5% NHS (Sigma, L4889).
Image Quantification
All WGA images were captured at ×10 magnification, and the total stained area quantified using the thresholding feature of the AxioVision Rel software, as described previously.44 PSR images were captured at ×10 magnification and quantifications were obtained with ImageJ software. Polarized images were analyzed and the amounts of densely (red) and loosely (green) packed collagen were quantified in the muscle cross sections relative to muscle area with ImageJ. Lectin images were captured at ×10. Images of lectin stained sections were taken at equal exposure times. Using the analyze feature in Zen, the images were thresholded for lectin positive areas and the analysis was applied across the entire cross section of muscle. Areas of excess background staining and auto fluorescence were excluded from the quantification. The number of capillaries detected by the software was summed to get the total number of capillaries in each section. Sections were measured for area using the spline contour feature in ZEN. Individual fibers were counted by hand to get the fiber number and the data expressed as lectin+ events/fiber.
All remaining images were captured at ×20 magnification at room temperature using a Zeiss upright fluorescent microscope (Zeiss AxioImager M1 Oberkochen, Germany). Whole muscle sections were obtained using the mosaic function in Zeiss Zen 2.3 imaging software. To minimize bias and increase reliability, fiber type distribution, muscle fiber CSA, fiber type-specific CSA, and myonuclear density were quantified on cross sections using MyoVision automated analysis software.45 To determine satellite cell density (Pax7+ cells/fiber), satellite cells (Pax7+/DAPI+) were counted manually on entire muscle cross sections using tools in the Zen software. Satellite cell counts were normalized to fiber number, delineated by laminin boundaries. All manual counting was performed by a blinded, trained technician.
RNA Isolation
Soleus muscles were homogenized in QIAzol (Qiagen, Hilden, Germany) and RNA was isolated using RNeasy Mini Kit (Qiagen) according to the manufacturer’s instructions. Two micrograms of RNA was eluted in 50 µL of nuclease-free water (concentration 50ng/µL) and purity checked: RIN ≥6.8, OD260/280 > 2.0 and sent to Novogene for subsequent library construction, sequencing, and preliminary bioinformatic analysis. RNA samples were pooled (n = 4/group) based on the experimental results reported by Kendziorski et al. showing that gene expression from RNA pools are similar to averages of individuals that comprise the pool.46
RNA-Seq Analysis
Downstream analysis was performed using a combination of programs including STAR, HTseq, Cufflink, and our wrapped scripts. Alignments were parsed using TopHat program and differential expressions were determined through DESeq2/edgeR. Reference genome and gene model annotation files were downloaded from genome website browser (NCBI/UCSC/Ensembl) directly. Indexes of the reference genome were built using STAR and paired-end clean reads were aligned to the reference genome using STAR (v2.5). STAR used the method of Maximal Mappable Prefix (MMP) which can generate a precise mapping result for junction reads. HTSeq v0.6.1 was used to count the read numbers mapped of each gene. FPKM (Reads Per Kilobase of exon model per million mapped reads) of each gene was calculated based on the length of the gene and reads count mapped to this gene. FPKM considers the effect of sequencing depth and gene length for the reads count at the same time and is currently the most commonly used method for estimating gene expression levels.47 Differential expression analysis between two conditions/groups (two biological replicates per condition) was performed using the DESeq2 R package (2_1.6.3). DESeq2 provides statistical routines for determining differential expression in digital gene expression data using a model based on the negative binomial distribution. The resulting P-values were adjusted using the Benjamini and Hochberg’s approach for controlling the False Discovery Rate (FDR). Genes with an adjusted P < 0.1 found by DESeq2 were assigned as differentially expressed.
Myonuclear Isolation
Soleus muscles were excised immediately following euthanasia and the protocol developed by Cutler et al. was followed for isolation of myonuclei.48 Briefly, muscles were minced with scissors in homogenization buffer (500 µL HEPES [1 M] 3 mL KCl [1 M] 250 µL spermidine [100 mM] 750 µL spermine tetrahydrochloride [10 mM] 10 mL EDTA [10 mM] 250 µL EGTA [100 mM] 2.5 mL MgCl [100 mM] 5.13 g sucrose), dounced on ice in homogenization buffer and passed through a 40 µm filter into sorting buffer. DAPI was added to label nuclei and fluorescently-labeled nuclei were purified via fluorescence-activated cell sorting (FACS) and collected in reverse transcription (RT) buffer.
Construction of Libraries and Generation of cDNA on the ×10 Genomics Platform
Nuclei were loaded into the 10X Chromium system using the Single Cell Reagent Kit v3 according to the manufacturer’s protocol. Following library construction, libraries were sequenced on the Illumina NovaSeq 6000 system at the University of Florida.
Single Myonuclear (smn)RNA-Seq Analyses
The Cell Ranger Single-Cell Software Suite was used to perform sample demultiplexing, barcode processing, and single-cell 3′ gene counting (http://software.10xgenomics.com/single-cell/overview/welcome). The cDNA insert was aligned to an appropriate reference genome using STAR. For mouse cells, mm10 was used. Partek Flow was used for all downstream analysis from Filtered_Barcode_Matrix.h5 files. Filter criteria included total reads: (Min: 499, Max: 20 567), expressed genes: (Min: 400, Max: 4018), and mitochondrial reads percent: (Min: 0%, Max: 15.00%). Additional filtering was performed which excluded features where values were < 1.0 in at least 99.9% of the samples yielding a total of 9358 genes for downstream analysis. Samples were normalized using counts per million and log transformation. Principal component analysis was used prior to t-SNE for visual-based clustering. Myonuclei for each sample were classified by Acta1 expression. Gene set analysis was performed between selected time points and treatments. Low-value filtering was set to 1.0 for lowest average coverage and FDR step-up (Adj P < 0.01) was used for multiple test correction.
Pathway Analysis
Differentially expressed gene lists (DEGs) were uploaded to g:Profiler for pathway analysis and uploaded to Cytoscape v3.8 for subsequent enrichment analysis and data visualization.49 The GeneMANIA application within Cytoscape was also used for network category analysis and data visualization.50 Nodes were generated with an adjusted P < 0.1 for enrichment. The size of each node is scaled to the gene set size, the shape of each node is specific to GO (circle) or pathway (diamond) enrichment. The color of the node is scaled to the adjusted P-value. Edges connecting nodes are scaled to the similarity coefficient (genes shared between nodes). Network categories included: coexpression: genes are linked if their expression levels are similar across conditions in a gene expression study. Colocalization: genes are linked if they are both expressed in the same tissue or if their gene products are both identified in the same cellular location. Genetic interaction: genes are functionally associated if the effects of perturbing one gene were found to be modified by perturbations to a second gene. Pathway: two gene products are linked if they participate in the same reaction within a pathway. Physical interaction: genes are linked if they were found to interact in a protein–protein interaction study. Predicted: predicted functional relationships between genes.
Strength Testing
Following PoWeR training, strength of plantar flexor muscles was determined by in vivo isometric tetanic torque. Mice were anesthetized by 2.5% isoflurane with oxygen set at 1.5 L/min (VetEquip vaporizer) in an induction chamber and transferred to a nose cone. The right hind limb was assessed for all mice. Fur on the lower two-thirds of the hind limb was trimmed (Wahl Bravmini), and the mouse was placed on a 37°C temperature regulated platform (809c in situ mouse apparatus, Aurora Scientific, Aurora, ON, Canada). The hind limb was securely positioned using a clamp at the knee, and the foot was placed in a footplate attached to a dual-mode lever and motor (300D-300C-LRFP, Aurora Scientific). Tape was wrapped around the foot and footplate to prevent compensatory movement or placement shifting, and the apparatus was adjusted to ensure the tibia was parallel with the platform with a 90° angle at the ankle. Platinum needle electrodes were placed percutaneously lateral to the knee to stimulate the tibial nerve via an electric stimulator (High Power Bi-Phase Stimulator, Aurora Scientific). Needles were adjusted to identify the optimal placement to generate maximum torque production and eliminate activation of dorsiflexors, using the Instant Stim function with Live Data Monitor in Dynamic Muscle Control LabBook (DMC v6.000). The level of electrical current to stimulate maximal torque output was determined by a series of twitches (0.05 s pulse duration) beginning at 10 mA and increasing to ∼50 mA until the maximum isometric torque stimulated by the minimum current was determined. This current setting remained constant throughout the subsequent torque–frequency curve to determine maximum isometric tetanic torque (10 Hz, 40 Hz, 80 Hz, 100 Hz, 120 Hz, 150 Hz, 180 Hz, and 200 Hz, 0.25s pulse duration with a 2 min rest period between each stimulus). All data were collected with DMC v6.000 and analyzed using Dynamic Muscle Analysis (DMA v5.501).
Statistical Analysis
Results are presented as mean ± SEM. Data were analyzed with GraphPad Prism software, via a two-way ANOVA with Tukey’s correction for multiple comparisons, a one-way repeated measures ANOVA with Sidak’s correction for multiple comparisons or an unpaired two-tailed Student’s t-test. Significance was set at a P < 0.05.
Supplementary Material
Acknowledgments
We would like to thank Dr. Esther Dupont-Versteegden for her consultation and valuable insight.
Supplementary Material
Supplementary material is available at the APS Function online.
Funding
This work was supported by grants from the National Institutes of Health (NIH) to C.A.P. and J.J.M. (AR060701 and AG049806) AR075364 to D.A.E., AR071753 and AG063994 to K.A.M., HL121284 and HL136951 to F.A., and AR073638 to J.M.P. The project described was also supported by the NIH National Center for Advancing Translational Sciences through grant number TL1TR001997 (D.A.E.). The content is solely the responsibility of the authors and does not necessarily represent the official views of the NIH.
Conflict of Interest Statement
The authors declare no conflicts of interests
References
- 1. Seale P, Sabourin LA, Girgis-Gabardo A, Mansouri A, Gruss P, Rudnicki MA.. Pax7 is required for the specification of myogenic satellite cells. Cell 2000;102(6):777–786. [DOI] [PubMed] [Google Scholar]
- 2. McCarthy JJ, Mula J, Miyazaki M, et al. Effective fiber hypertrophy in satellite cell-depleted skeletal muscle. Development 2011;138(17):3657–3666. [DOI] [PMC free article] [PubMed] [Google Scholar]
- 3. Murach KA, White SH, Wen Y, et al. Differential requirement for satellite cells during overload-induced muscle hypertrophy in growing versus mature mice. Skelet Muscle 2017;7(1):14. [DOI] [PMC free article] [PubMed] [Google Scholar]
- 4. Egner IM, Bruusgaard JC, Gundersen K.. Satellite cell depletion prevents fiber hypertrophy in skeletal muscle. Development 2016;143(16):2898–2906. [DOI] [PubMed] [Google Scholar]
- 5. Fry CS, Lee JD, Jackson JR, et al. Regulation of the muscle fiber microenvironment by activated satellite cells during hypertrophy. FASEB J 2014;28(4):1654–1665. [DOI] [PMC free article] [PubMed] [Google Scholar]
- 6. Englund DA, Peck BD, Murach KA, et al. Resident muscle stem cells are not required for testosterone-induced skeletal muscle hypertrophy. Am J Physiol Cell Physiol 2019;317:C719–C724. [DOI] [PMC free article] [PubMed] [Google Scholar]
- 7. Goh Q, Millay DP.. Requirement of myomaker-mediated stem cell fusion for skeletal muscle hypertrophy. Elife 2017;6:e20007. [DOI] [PMC free article] [PubMed] [Google Scholar]
- 8. Goh Q, Song T, Petrany MJ, et al. Myonuclear accretion is a determinant of exercise-induced remodeling in skeletal muscle. eLife 2019;8:e44876. [DOI] [PMC free article] [PubMed] [Google Scholar]
- 9. Englund DA, Murach KA, Dungan CM, et al. Depletion of resident muscle stem cells negatively impacts running volume, physical function and muscle hypertrophy in response to lifelong physical activity. Am J Physiol Cell Physiol 2020;318(6):C1178–C1188. [DOI] [PMC free article] [PubMed] [Google Scholar]
- 10. Fry CS, Lee JD, Mula J, et al. Inducible depletion of satellite cells in adult, sedentary mice impairs muscle regenerative capacity without affecting sarcopenia. Nat Med 2015;21(1):76. [DOI] [PMC free article] [PubMed] [Google Scholar]
- 11. Lee JD, Fry CS, Mula J, et al. Aged muscle demonstrates fiber-type adaptations in response to mechanical overload, in the absence of myofiber hypertrophy, independent of satellite cell abundance. J Gerontol A Biol Sci Med Sci 2015;71(4):461–467. [DOI] [PMC free article] [PubMed] [Google Scholar]
- 12. Murach KA, McCarthy JJ, Peterson CA, Dungan CM.. Making mice mighty: recent advances in translational models of load-induced muscle hypertrophy. J Appl Physiol 2020. [DOI] [PMC free article] [PubMed] [Google Scholar]
- 13. Cui D, Drake JC, Wilson RJ, et al. A novel voluntary weightlifting model in mice promotes muscle adaptation and insulin sensitivity with simultaneous enhancement of autophagy and mTOR pathway. FASEB J 2020. [DOI] [PMC free article] [PubMed] [Google Scholar]
- 14. Graber TG, Fandrey KR, Thompson LV.. Novel individualized power training protocol preserves physical function in adult and older mice. GeroScience 2019;41(2):165–183. [DOI] [PMC free article] [PubMed] [Google Scholar]
- 15. Dungan CM, Murach KA, Frick KK, et al. Elevated myonuclear density during skeletal muscle hypertrophy in response to training is reversed during detraining. Am J Physiol Cell Physiol 2019. [DOI] [PMC free article] [PubMed] [Google Scholar]
- 16. Murach KA, Mobley CB, Zdunek CJ, et al. Muscle memory: myonuclear accretion, maintenance, morphology, and miRNA levels with training and detraining in adult mice. J Cachexia Sarcopenia Muscle 2020. [DOI] [PMC free article] [PubMed] [Google Scholar]
- 17. McCarthy JJ, Dupont-Versteegden EE, Fry CS, Murach KA, Peterson CA.. Methodological issues limit interpretation of negative effects of satellite cell depletion on adult muscle hypertrophy. Development 2017;144:1363–1365. [DOI] [PubMed] [Google Scholar]
- 18. Amthor H, Macharia R, Navarrete R, et al. Lack of myostatin results in excessive muscle growth but impaired force generation. Proc Natl Acad Sci USA 2007;104(6):1835–1840. [DOI] [PMC free article] [PubMed] [Google Scholar]
- 19. Amthor H, Otto A, Vulin A, et al. Muscle hypertrophy driven by myostatin blockade does not require stem/precursor-cell activity. Proc Natl Acad Sci USA 2009;106(18):7479–7484. [DOI] [PMC free article] [PubMed] [Google Scholar]
- 20. Lee S-J, Huynh TV, Lee Y-S, et al. Role of satellite cells versus myofibers in muscle hypertrophy induced by inhibition of the myostatin/activin signaling pathway. Proc Natl Acad Sci USA 2012;109(35):E2353–E2360. [DOI] [PMC free article] [PubMed] [Google Scholar]
- 21. Omairi S, Matsakas A, Degens H, et al. Enhanced exercise and regenerative capacity in a mouse model that violates size constraints of oxidative muscle fibres. Elife 2016;5:e16940. [DOI] [PMC free article] [PubMed] [Google Scholar]
- 22. Blaauw B, Canato M, Agatea L, et al. Inducible activation of Akt increases skeletal muscle mass and force without satellite cell activation. FASEB J 2009;23(11):3896–3905. [DOI] [PubMed] [Google Scholar]
- 23. Raffaello A, Milan G, Masiero E, et al. JunB transcription factor maintains skeletal muscle mass and promotes hypertrophy. J Cell Biol 2010;191(1):101–113. [DOI] [PMC free article] [PubMed] [Google Scholar]
- 24. Huijing P, Baan GC, Rebel GT.. Non-myotendinous force transmission in rat extensor digitorum longus muscle. J Exp Biol 1998;201(5):683–691. [PubMed] [Google Scholar]
- 25. Mendias CL, Schwartz AJ, Grekin JA, Gumucio JP, Sugg KB.. Changes in muscle fiber contractility and extracellular matrix production during skeletal muscle hypertrophy. J Appl Physiol 2017;122(3):571–579. [DOI] [PMC free article] [PubMed] [Google Scholar]
- 26. Wood LK, Kayupov E, Gumucio JP, Mendias CL, Claflin DR, Brooks SV.. Intrinsic stiffness of extracellular matrix increases with age in skeletal muscles of mice. J Appl Physiol 2014;117(4):363–369. [DOI] [PMC free article] [PubMed] [Google Scholar]
- 27. Ramaswamy KS, Palmer ML, Van Der Meulen JH, et al. Lateral transmission of force is impaired in skeletal muscles of dystrophic mice and very old rats. J Physiol 2011;589(5):1195–1208. [DOI] [PMC free article] [PubMed] [Google Scholar]
- 28. Phillips BE, Atherton PJ, Varadhan K, et al. The effects of resistance exercise training on macro‐and micro‐circulatory responses to feeding and skeletal muscle protein anabolism in older men. J Physiol 2015;593(12):2721–2734. [DOI] [PMC free article] [PubMed] [Google Scholar]
- 29. Moro T, Brightwell CR, Phalen DE, et al. Low skeletal muscle capillarization limits muscle adaptation to resistance exercise training in older adults. Exp Gerontol 2019;127:110723. [DOI] [PMC free article] [PubMed] [Google Scholar]
- 30. Snijders T, Nederveen JP, Joanisse S, et al. Muscle fibre capillarization is a critical factor in muscle fibre hypertrophy during resistance exercise training in older men. J Cachexia Sarcopenia Muscle 2017;8(2):267–276. [DOI] [PMC free article] [PubMed] [Google Scholar]
- 31. Delavar H, Nogueira L, Wagner PD, Hogan MC, Metzger D, Breen EC.. Skeletal myofiber VEGF is essential for the exercise training response in adult mice. Am J Physiol Regul Integr Comp Physiol 2014;306(8):R586–R595. [DOI] [PMC free article] [PubMed] [Google Scholar]
- 32. Huey KA, Smith SA, Sulaeman A, Breen EC.. Skeletal myofiber VEGF is necessary for myogenic and contractile adaptations to functional overload of the plantaris in adult mice. J Appl Physiol 2016;120(2):188–195. [DOI] [PMC free article] [PubMed] [Google Scholar]
- 33. Christov C, Chrétien F, Abou-Khalil R, et al. Muscle satellite cells and endothelial cells: close neighbors and privileged partners. Mol Biol Cell 2007;18(4):1397–1409. [DOI] [PMC free article] [PubMed] [Google Scholar]
- 34. Verma M, Asakura Y, Murakonda BSR, et al. Muscle satellite cell cross-talk with a vascular niche maintains quiescence via VEGF and notch signaling. Cell Stem Cell 2018;23(4):530–543.e539. [DOI] [PMC free article] [PubMed] [Google Scholar]
- 35. Rhoads RP, Johnson RM, Rathbone CR, et al. Satellite cell-mediated angiogenesis in vitro coincides with a functional hypoxia-inducible factor pathway. Am J Physiol Cell Physiol 2009;296(6):C1321–C1328. [DOI] [PMC free article] [PubMed] [Google Scholar]
- 36. Makhnovskii PA, Zgoda VG, Bokov RO, et al. Regulation of proteins in human skeletal muscle: the role of transcription. Sci Rep 2020;10(1):1–9. [DOI] [PMC free article] [PubMed] [Google Scholar]
- 37. Phillips BE, Williams JP, Gustafsson T, et al. Molecular networks of human muscle adaptation to exercise and age. PLoS Genet 2013;9(3). [DOI] [PMC free article] [PubMed] [Google Scholar]
- 38. Feaga HA, Kopylov M, Kim JK, Jovanovic M, Dworkin J.. Ribosome dimerization protects the small subunit. J Bacteriol 2020;202(10). [DOI] [PMC free article] [PubMed] [Google Scholar]
- 39. Maitra A, Dill KA.. Bacterial growth laws reflect the evolutionary importance of energy efficiency. Proc Natl Acad Sci USA 2015;112(2):406–411. [DOI] [PMC free article] [PubMed] [Google Scholar]
- 40. Machado L, Dos Santos M, Camps J, et al. Skeletal muscle tissue damage leads to a conserved stress response and stem cell-specific adaptive transitions. Cell Stem Cell. [DOI] [PubMed] [Google Scholar]
- 41. Murphy MM, Lawson JA, Mathew SJ, Hutcheson DA, Kardon G.. Satellite cells, connective tissue fibroblasts and their interactions are crucial for muscle regeneration. Development 2011;138(17):3625–3637. [DOI] [PMC free article] [PubMed] [Google Scholar]
- 42. Pilegaard H, Ordway GA, Saltin B, Neufer PD.. Transcriptional regulation of gene expression in human skeletal muscle during recovery from exercise. Am J Physiol Endocrinol Metab 2000;279(4):E806–E814. [DOI] [PubMed] [Google Scholar]
- 43. Kirkeby S, Mandel U, Vedtofte P.. Identification of capillaries in sections from skeletal muscle by use of lectins and monoclonal antibodies reacting with histo-blood group ABH antigens. Glycoconj J 1993;10(2):181–188. [DOI] [PubMed] [Google Scholar]
- 44. Jackson JR, Kirby TJ, Fry CS, et al. Reduced voluntary running performance is associated with impaired coordination as a result of muscle satellite cell depletion in adult mice. Skelet Muscle 2015;5(1):41. [DOI] [PMC free article] [PubMed] [Google Scholar]
- 45. Wen Y, Murach KA, Vechetti IJ Jr, et al. MyoVision: software for automated high-content analysis of skeletal muscle immunohistochemistry. J Appl Physiol (1985) 2018;124:40–51. [DOI] [PMC free article] [PubMed] [Google Scholar]
- 46. Kendziorski CM, Zhang Y, Lan H, Attie AD.. The efficiency of pooling mRNA in microarray experiments. Biostatistics (Oxford, England) 2003;4(3):465–477. [DOI] [PubMed] [Google Scholar]
- 47. Mortazavi A, Williams BA, McCue K, Schaeffer L, Wold B.. Mapping and quantifying mammalian transcriptomes by RNA-Seq. Nat Methods .2008;5(7):621. [DOI] [PubMed] [Google Scholar]
- 48. Cutler AA, Corbett AH, Pavlath GK.. Biochemical isolation of myonuclei from mouse skeletal muscle tissue. Bio-protocol .2017;7(24):e2654. [DOI] [PMC free article] [PubMed] [Google Scholar]
- 49. Shannon P, Markiel A, Ozier O, et al. Cytoscape: a software environment for integrated models of biomolecular interaction networks. Genome Res 2003;13(11):2498–2504. [DOI] [PMC free article] [PubMed] [Google Scholar]
- 50. Warde-Farley D, Donaldson SL, Comes O, et al. The GeneMANIA prediction server: biological network integration for gene prioritization and predicting gene function. Nucleic Acids Res .2010;38(Web Server issue):W214–W220. [DOI] [PMC free article] [PubMed] [Google Scholar]
Associated Data
This section collects any data citations, data availability statements, or supplementary materials included in this article.


