



Abstract
Known fetal hemoglobin (HbF) silencers have potential on-target liabilities for rational β-hemoglobinopathy therapeutic inhibition. Here through transcription factor (TF) CRISPR screening we identify ZNF410 as an HbF repressor. ZNF410 does not bind directly to the γ-globin genes but rather its chromatin occupancy is solely concentrated at CHD4, encoding the NuRD nucleosome remodeler, itself required for HbF repression. CHD4 has two ZNF410-bound regulatory elements with 27 combined ZNF410 binding motifs constituting unparalleled genomic clusters. These elements completely account for ZNF410’s effects on fetal globin repression. Knockout of ZNF410 or its mouse homolog Zfp410 reduces CHD4 by 60%, enough to substantially de-repress HbF while eluding cellular or organismal toxicity. These studies suggest a potential target for HbF induction for β-hemoglobin disorders with a wide therapeutic index. More broadly, ZNF410 represents a special class of gene regulator, a conserved TF with singular devotion to regulation of a chromatin subcomplex.
Introduction
Despite renewed enthusiasm for novel approaches to β-hemoglobinopathies, the clinical unmet need for these most common monogenic diseases remains vast1–3. Induction of fetal γ-globin gene expression could bypass the underlying β-globin molecular defects and ameliorate the pathophysiological cascades that result in elevated morbidity and mortality. Critical regulators of the switch from fetal to adult globin gene expression include the DNA-binding transcription factors (TFs) BCL11A and ZBTB7A and the nucleosome remodeling and deacetylase (NuRD) chromatin complex4–7. BCL11A and ZBTB7A each bind to unique sites at the proximal promoters of the duplicated fetal γ-globin genes HBG1 and HBG2 and each physically interact with NuRD5,8–10. Although the molecular details underpinning this switch, including the precise sequences bound and NuRD subcomplex members required, are increasingly understood, still the feasibility to directly perturb these mechanisms through pharmacology remains uncertain. One challenge is the pleiotropic molecular, cellular and organismal effects of each of the aforementioned fetal hemoglobin (HbF) repressors which makes the therapeutic window uncertain and the risk of undesired on-target liabilities considerable. An ideal target would have a wide therapeutic index through which inhibition of function could be tolerated across a diverse set of cellular contexts.
To better define additional molecular players orchestrating the developmental regulation of globin gene expression, we performed a CRISPR screen focusing on putative DNA-binding TFs that contribute to HbF silencing. We identified ZNF410 as a DNA-binding TF required for HbF repression. We find that it displays a narrowly restricted pattern of chromatin occupancy, not binding to the globin locus directly, but rather binding to upstream elements, through an unusual set of clustered motifs, controlling the expression of the catalytic NuRD subunit CHD4. We observe that ZNF410 and its mouse homolog Zfp410 are dispensable for survival to adulthood as well as normal erythropoiesis and hematopoietic repopulation.
Results
CRISPR screen for transcriptional regulators of HbF level
We performed a CRISPR screen in a primary human erythroid precursor cell line (HUDEP-2) that expresses an adult-type pattern of globins to discover genes required for repression of HbF. The screen targeted 1,591 TFs and 13 genes of the NuRD complex as controls. HUDEP-2 cells stably expressing SpCas9 were first generated. HUDEP-2/Cas9 cells were then transduced by the sgRNA library at low multiplicity and selected for sgRNA cassette integration by acquisition of puromycin resistance. Following erythroid maturation culture, cells were stained for HbF expression and HbF+ cells (range 1.8-7%) were selected by FACS (Fig. 1a). Integrated sgRNAs were amplified from genomic DNA and counted by deep sequencing. We calculated two sgRNA enrichment scores. First, sgRNA abundance was compared in HbF+ and total cells at the end of erythroid maturation to obtain an HbF enrichment score. Second, sgRNA abundance was compared in cells at the end of erythroid maturation and the starting library to define a cell fitness score. Negative cell fitness scores indicate relative depletion whereas positive scores indicate relative enrichment of cells bearing these sgRNAs.
Figure 1. ZNF410 is an HbF repressor.

(a) Schematic of CRISPR/Cas9-based knockout screen in HUDEP-2 cells to identify repressors of HbF expression. (b) HbF enrichment and cell fitness scores for each of 1,591 transcription factors and 13 genes of the NuRD complex. The gene ZNF410 was prioritized for further study based on positive HbF enrichment score, neutral cell fitness score and unknown role in erythropoiesis and globin regulation. (c) HUDEP-2/Cas9 cells nontransduced (mock) or transduced with nontargeting (NT) or ZNF410 targeting sgRNA assayed on day 9 of erythroid differentiation with intracellular staining (HbF+ cells, P = 0.0096), RT-qPCR (%HBG1/2 expression relative to total HBG1/2 and HBB expression, fold-change relative to mock; P = 0.0081) and HPLC (HbF level, P = 0.0004). Data are presented as mean values and error bars are standard deviation (n = 3). P values were calculated by two-tailed Student’s t-test comparing NT to ZNF410 edited. (d) Intracellular HbF staining of HUDEP-2 wildtype (wt, n = 1) cells and three ZNF410 knockout HUDEP-2 clones (n = 1 for each clone) without or with (gray bars) re-expression of ZNF410. (e) ZNF410 targeted by RNP electroporation of Cas9 and sgRNA in CD34+ HSPCs and subsequently differentiated to erythroid cells in vitro. Bars indicate median value, experiments performed in 4 individual donors including biological triplicate for donor 4 (total n = 6 replicates). At the end of erythroid culture (day 18), erythroid maturation was assessed by surface expression of CD71 and CD235a and enucleation frequency by Hoechst staining. Representative FACS plots are shown. Quadrant values indicated are mean ± SD; two-tailed Student’s t-test comparing ZNF410 edited to mock for CD71+CD235a+ and CD71−CD235a+ quadrants did not show significant differences (P > 0.05). HbF level measured by HPLC was increased in ZNF410 edited primary erythroid cells compared to mock control cells (P < 0.0001).
As expected, we found that known HbF regulators like BCL11A and ZBTB7A showed highly elevated HbF enrichment scores (Fig. 1b). For BCL11A we observed a modest negative fitness score, suggesting that loss of this gene had a modest negative impact on cell accumulation in vitro. For ZBTB7A we observed a positive fitness score, suggesting cells mutated at this gene accumulated in the population, consistent with its known requirement for terminal erythroid maturation11. In addition, we validated prior findings that a NuRD subcomplex including CHD4, MTA2, GATAD2A, MBD2, and HDAC2 was required for HbF control6. Editing CHD4 led to potent HbF induction but was associated with negative cell fitness.
We observed sgRNAs targeting ZNF410 were associated with robust HbF induction (Fig. 1b). Unlike other regulators like BCL11A, ZBTB7A, and CHD4, we observed no fitness effects of targeting ZNF410. ZNF410 encodes a zinc finger protein with a cluster of five C2H2 zinc fingers. Published erythroid expression profiling data show ZNF410 expression throughout erythropoiesis, with relative decline in orthochromatic erythroblasts (Supplementary Table 1)12–16. One previous study indicated that over-expression of ZNF410 in human foreskin fibroblasts led to increased expression of matrix remodeling genes MMP1, PAI2 and MMP12 and ZNF410 sumoylation extended its half-life17. We focused on ZNF410 as a potential regulator of HbF.
Validation in HUDEP-2 cells and primary adult erythroid precursors
We first tested the role of ZNF410 in HbF repression by targeting it in HUDEP-2 cells with 5 individual gRNAs. Each gRNA produced efficient gene edits (Extended Data Fig. 1a). Upon ZNF410 editing, cell growth and viability were comparable to controls (Extended Data Fig. 1b, c). ZNF410 editing resulted in significant increase of HBG1/2 expression compared to mock treated and control locus targeted cells (Extended Data Fig. 1d). We used ZNF410 sg-1 for all further experiments as it led to highly efficient production of frameshift indels. Upon further erythroid differentiation of HUDEP-2 cells edited using ZNF410 sg-1, we found induction of HbF, as measured by HbF+ cells by intracellular flow cytometry, HBG1/2 expression by RT-qPCR, and HbF induction by HPLC (Fig. 1c). There was a nonsignificant trend of increase in embryonic HBE1 expression and a modest decrease in adult HBB and HBA1/2 expression by RT-qPCR (Extended Data Fig. 1e). We generated 3 single-cell-derived HUDEP-2 ZNF410 biallelic KO clones using paired genomic cleavages that delete the entire coding sequence (Extended Data Fig. 1f). In each clone, the fraction of HbF+ cells was elevated. Upon re-expression of ZNF410, HbF was partially silenced, consistent with a causal role of ZNF410 in repressing HbF (Fig. 1d).
We next examined the role of ZNF410 in HbF repression in primary erythroblasts derived from erythroid culture of adult mobilized peripheral blood CD34+ HSPCs. Using cells from 3 independent donors, we found that targeting ZNF410 by 3×NLS-SpCas9:sgRNA RNP electroporation produced >99% indels with a +1 insertion allele and loss of protein expression (Fig. 1e, Extended Data Fig. 2a). Cell growth was similar in ZNF410 targeted primary erythroid maturation cultures compared to controls (Extended Data Fig. 2b). There was a significant increase in HBG1/2 expression and a decrease in HBB expression in ZNF410 targeted erythroblasts compared to controls (Extended Data Fig. 2c). There was a nonsignificant trend of increase in HBE1 expression and no change in HBA1/2 expression in ZNF410 targeted erythroblasts compared to controls (Extended Data Fig. 2c). ZNF410 targeted erythroblasts displayed normal erythroid maturation based on immunophenotype and enucleation, and robust induction of HbF from a median of 5.5% in mock to 21.1% in ZNF410 targeted samples (Fig. 1e, P < 0.0001). We also observed HbF induction in ZNF410 targeted primary erythroblasts derived from CD34+ HSPCs from a sickle cell disease (SCD) patient (Extended Data Fig. 2d).
ZNF410 is a DNA-binding protein with highly restricted chromatin occupancy
We performed dense mutagenesis of ZNF410 to identify critical minimal sequences required for function. In this experimental design, heightened HbF enrichment scores indicate sequences where not only frameshift but also in-frame mutations may be associated with loss-of-function6. We observed heightened HbF enrichment scores especially when targeting sequences from exons 6-9 encoding the cluster of five C2H2 zinc fingers of ZNF410 (Fig. 2a). This dependence on its putative DNA binding domain suggested that the DNA-binding function of ZNF410 might be important for its role in HbF repression.
Figure 2. ZNF410 chromatin occupancy is restricted to two CHD4 elements with densely clustered motifs.

(a) Dense mutagenesis of ZNF410 coding sequence by pooled screening of 180 sgRNAs (NGG PAM restricted). Each circle represents enrichment score of an individual sgRNA, black line LOWESS curve. The 5 C2H2 zinc-finger domains (red rectangles) of ZNF410 appear essential for HbF repression. (b) Genome-wide ZNF410 chromatin occupancy identified by CUT&RUN in HUDEP-2 samples with ZNF410-HA over-expression using anti-HA antibody compared to IgG control (n = 4 for each). The two peaks with greatest enrichment of ZNF410 binding were at the CHD4 promoter and CHD4 −6 kb enhancer. The next most enriched peaks, at CHD4 intron 2 and TIMELESS intron 1, showed substantially less enrichment. (c) Genome-wide ZNF410 motif occurrences (identified from JASPAR and mapped by pwmscan) across 3-kb sliding windows. Only three windows comprised more than two ZNF410 motifs, including the CHD4 promoter (16 motifs), CHD4 −6 kb enhancer (11 motifs), and GALNT18 intron 1 (6 motifs). (d) CHD4 locus at 100-kb (top panel) or 1.9-kb resolution (bottom panels) indicating ZNF410 binding (red peaks) at the CHD4 promoter and CHD4 −6 kb enhancer regions in representative control IgG (n = 9) and anti-HA (n = 7) samples in HUDEP-2 cells over-expressing HA-tagged ZNF410, control IgG (n = 1) and anti-ZNF410 (n = 1) in HUDEP-2 cells, and control IgG (n = 2) and anti-ZNF410 (n = 2) in CD34+ HSPC derived erythroid precursors. Positions of ZNF410 motifs (red rectangles), cleavage frequency (footprint) from ZNF410-HA CUT&RUN (red bars), accessible chromatin by ATAC-seq (gray peaks, n = 3) and DNA sequence conservation by SiPhy rate.
We examined the chromatin occupancy of ZNF410 by conducting CUT&RUN, an approach to studying protein-DNA interactions in situ without fragmentation or cross-linking18. Initially we used an HA antibody to probe for epitope tagged ZNF410 in HUDEP-2 cells. Known HbF repressing TFs like BCL11A and ZBTB7A act by binding to proximal promoter elements at the fetal γ-globin (HBG1 and HBG2) genes. We did not observe any chromatin occupancy of ZNF410 at the α-globin (HBA1 and HBA2) or β-globin (HBB) gene clusters (Extended Data Fig. 3a, 3b). Unlike typical DNA binding transcription factors which show thousands of binding sites genome wide, ZNF410 showed highly restricted chromatin occupancy. With standard peak calling parameters, we found 49 peaks, but most of these had marginal enrichment of ZNF410-HA signal compared to an IgG control. The top two peaks were found at the CHD4 locus, one at the promoter (57-fold enrichment) and the other 6 kb upstream at a region of open chromatin (77-fold enrichment, Fig. 2b, 2d). This latter element we subsequently refer to as the CHD4 −6 kb enhancer (see functional data below). The third most enriched peak was in CHD4 intron 2, with ~10-fold enrichment (Fig. 2b, 2d). The fourth most enriched peak was in TIMELESS intron 1, with ~10-fold enrichment, around accessible chromatin at sequences bearing an LTR element (Fig. 2b, Extended Data Fig. 4a).
Subsequently we used a ZNF410 antibody to probe for endogenous ZNF410 with CUT&RUN, both in HUDEP-2 cells and in CD34+ HSPC-derived erythroid precursors (Fig. 2d). In both cases, we found that ZNF410 chromatin occupancy was highly restricted to CHD4. In HUDEP-2 cells, only 5 total peaks were identified, the top 4 of which were at the CHD4 promoter and CHD4 −6 kb enhancer (Fig. 2d, Extended Data Fig. 4b). The 5th peak was at intronic sequences of DPY19L3 bearing an LTR element (5-fold enrichment) (Extended Data Fig. 4d). In CD34+ HSPC-derived erythroid precursors, only 5 total peaks were identified, all of which were at the CHD4 promoter or CHD4 −6 kb enhancer, with no other genomic sites of ZNF410 occupancy found (Fig. 2d, Extended Data Fig. 4c).
The ZNF410 binding motif has previously been described by high-throughput SELEX using expression of the DNA-binding domain in 293FT cells19. We observed a striking cluster of these motifs at CHD4, with numerous motif instances found at both the promoter (16 motifs) and the −6 kb enhancer (11 motifs, Fig. 2c, d). We scanned the genome for the ZNF410 binding motif, dividing the genome into 3-kb windows. 4,306 genomic windows had 1 motif instance and 16 windows had 2 motif instances (Fig. 2c). Only 3 windows had more than 2 motif instances, of which 2 were the aforementioned CHD4 elements. We observed 6 motif instances within a window at GALNT18 intron 1, although we observed neither ZNF410 occupancy nor chromatin accessibility at this locus in erythroid precursors (Extended Data Fig. 3c).
ZNF410 regulates HbF through CHD4
These results suggested that ZNF410 exhibits singular binding to CHD4. We performed RNA-seq of HUDEP-2 cells edited at ZNF410 to measure gene expression changes (Fig. 3a). Based on log2 fold-change >1 and adjusted P value <0.01, there were 63 differentially expressed genes. CHD4 was the most significantly downregulated gene upon ZNF410 editing (log2 fold-change −1.07, Padj 2.27 × 10−43). HBG2 was the 4th most significantly upregulated gene (log2 fold-change 2.35, Padj 5.93 × 10⁻²⁵). Gene set enrichment analysis showed that genes differentially expressed after ZNF410 editing were enriched in those differentially expressed after CHD4 editing (for upregulated genes, NES 1.61, q 0.05; for downregulated genes, NES −1.39, q 0.09; Fig. 3b, Extended Data Fig. 5a). APOL1, the second most significantly upregulated gene, has been associated with autophagy. We evaluated autophagy induction by LC3-I/II immunoblot and did not observe a difference in ZNF410 targeted HUDEP-2 cells or CD34+ HSPC derived erythroblasts compared to controls (Extended Data Fig. 5b). The expression of ZNF410 and CHD4 were significantly correlated across 54 human tissues from the GTEx dataset20 (Extended Data Fig. 5c, Pearson correlation, r = 0.77, P < 0.0001). We evaluated a repository of genome-wide CRISPR KO screen data spanning 558 cell lines to identify genes with a similar pattern of cellular dependency as ZNF41021,22. We found that CHD4 was the most similarly codependent gene across cell lines, indicating a pervasive relationship between ZNF410 and CHD4 (Fig. 3c). These results suggest that a major function of ZNF410 across numerous cellular contexts appears to be control of CHD4 expression.
Figure 3. ZNF410 represses HbF by activating CHD4.

(a) RNA-seq differential gene expression analysis of ZNF410 (n = 3) compared to AAVS1 (n = 3) targeted HUDEP-2 cells. Downregulated and upregulated genes defined by Padj < 0.01 and log2 fold-change<−1 or >1 respectively. (b) Comparison of genes upregulated in ZNF410 and CHD4 mutant cells by GSEA shows enrichment of CHD4 regulated genes in the ZNF410 regulated gene set. (c) Pearson correlation between ZNF410 dependency and CHD4 dependency across 558 cell lines identifies CHD4 as the most ZNF410 codependent gene. (d) CHD4 expression measured by RT-qPCR in ZNF410 targeted primary erythroblasts derived from CD34+ HSPCs (n = 3, P < 0.01) compared to safe sgRNA targeted control cells (n = 3) on day 7 and day 10 of erythroid culture. Data are presented as mean values and error bars are standard deviation. (e) Cas9 paired cleavages with CHD4-proximal-gRNA-1 and CHD4-distal-gRNA-1 were used to generate an element deletion clone (CHD4 Δ 6.7 kb), with the biallelic deletion spanning both of the ZNF410 binding regions upstream of CHD4. (f) CHD4 expression measured by RT-qPCR in the CHD4 Δ 6.7 kb clone (n = 1) compared to 3 individual HUDEP-2 cell clones (n = 3) plated in parallel. HBG expression relative to total β-like globin (HBG+HBB) measured by RT-qPCR in the CHD4 Δ 6.7 kb deletion clone (n = 1) compared to control clones (n = 3). Data are presented as median values. (g) CHD4 Δ 6.7 kb clone and HUDEP-2 cells were subjected to control (safe, n = 1) and ZNF410 targeting (n = 1) by RNP electroporation. Relative CHD4 and HBG expression measured by RT-qPCR. (h) RNA-seq differential gene expression analysis of ZNF410 targeted (n = 3) compared to AAVS1 targeted (n = 3) CHD4 Δ 6.7 kb clones. Downregulated and upregulated genes defined by Padj<0.01 and log2 fold-change<−1 or >1 respectively.
We validated the change in CHD4 expression after ZNF410 editing by RT-qPCR in both HUDEP-2 cells and primary erythroid precursors derived from CD34+ HSPCs. We found that CHD4 mRNA expression was reduced by 57% after ZNF410 editing (Fig. 3d, Extended Data Fig. 5d, P < 0.01). Likewise the protein level of CHD4 was reduced after ZNF410 editing (Extended Data Fig. 2a). CHD4 is the catalytic chromatin remodeling subunit of an HbF-repressing NuRD subcomplex6,7. After ZNF410 editing, the levels of subcomplex members GATAD2A and MBD2 were also reduced, while MTA2, HDAC2, and RBBP4 were unchanged (Extended Data Fig. 2a). These results appear consistent with emerging data that CHD4-GATAD2A-MBD2 form a peripheral component of NuRD23. To test the requirement of ZNF410 binding for CHD4 expression, we generated HUDEP-2 cell clones in which the two upstream ZNF410 motif clusters at CHD4 were both deleted by paired genomic cleavages (Fig. 3e, Extended Data Fig. 5e). We isolated 4 biallelically deleted HUDEP-2 clones. We found that CHD4 expression decreased by 56-79% after deletion of the upstream elements, similar to the decrease observed after editing ZNF410 itself. Consistent with reduced expression of CHD4, γ-globin was induced (Fig. 3f, Extended Data Fig. 5f). No change in CHD4 expression was observed upon ZNF410 editing in the absence of the upstream elements, suggesting that the control of CHD4 expression requires these elements (Fig. 3g). We did not observe further γ-globin induction in CHD4 upstream element deleted cells upon ZNF410 editing (Fig. 3g, Extended Data Fig. 5g). In contrast, γ-globin increased in these same cells upon BCL11A or ZBTB7A editing, indicating the cells were competent for further γ-globin induction (Extended Data Fig. 5g, 5h). We performed RNA-seq of CHD4 Δ6.7 kb element deleted cells after ZNF410 editing (Fig. 3h). In contrast to HUDEP-2 cells, we only observed 2 differentially expressed genes after ZNF410 editing in CHD4 Δ6.7 kb element deletion cells, consistent with our prior results that nearly all gene expression changes found after ZNF410 editing are due to changes in CHD4 expression. We observed a similar reduction in CBX6 expression in ZNF410 edited HUDEP-2 cells and ZNF410 edited CHD4 Δ6.7 kb HUDEP-2 cells, suggesting that ZNF410 regulates CBX6 in a manner independent of its regulation of CHD4 (Extended Data Fig. 5i). There is a single ZNF410 motif at the CBX6 promoter. We did not observe chromatin occupancy at this site by CUT&RUN, although it is difficult to exclude low-level occupancy. Together these results suggest that ZNF410 represses γ-globin exclusively by binding upstream elements and trans-activating CHD4.
ZNF410 is a non-essential gene
ZNF410 and its mouse ortholog Zfp410 share 94% amino acid identity, including 98% at the cluster of 5 ZnFs17. We performed CUT&RUN to investigate the chromatin occupancy of endogenous Zfp410 in a mouse erythroid cell line (MEL cells). Similar to results in human erythroid precursors, we observed that genomic enrichment of Zfp410 binding was highly restricted to the Chd4 locus, with tremendous enrichment at the promoter (77-fold enrichment) and at the Chd4 −6 kb enhancer (45-fold enrichment), each overlapping accessible chromatin regions and motif clusters (Fig. 4a, b). The third most enriched site for Zfp410 occupancy was at the promoter of Hist1h2bl, with ~14-fold enrichment, although no motifs were observed at this site (Extended Data Fig. 6a). To evaluate the requirement of ZNF410 in normal development and homeostasis, we investigated mice with a loss-of-function allele of the mouse ortholog Zfp410. We obtained mouse embryonic stem cells heterozygous for a Zfp410 gene trap allele (Gt) from the European Mouse Mutant Cell Repository (EuMMCR). The targeting cassette was inserted to intron 5 to disrupt expression of full-length Zfp410 (Extended Data Fig. 6b). Of note, exons 6-9 encode the five ZnFs (Extended Data Fig. 6c). We derived heterozygous mice with germline transmission of this allele. Although the sample size is currently small, we observed 6 Zfp410Gt/Gt homozygotes out of 20 live births from Zfp410+/Gt heterozygote intercrosses, consistent with expected Mendelian transmission (Fig. 4c). We intercrossed Zfp410+/Gt heterozygous mice transgenic for a human β-globin cluster transgene (β-YAC)24,25. We evaluated fetal livers of E14.5 embryos. Zfp410 expression was reduced by >99% in Zfp410Gt/Gt homozygous mouse fetal liver compared to wildtype animals (Fig. 4d). We observed a decrease in Chd4 expression, from 1.0±0.13 in +/+, 0.91±0.04 in Gt/+ and 0.4±0.04 in Gt/Gt β-YAC embryos (P < 0.0001 for Gt/Gt compared to +/+), and elevated transgenic human γ-globin expression in Zfp410 deficient embryos, from 16.8±8.1% in +/+, 19.9±6.9% in Gt/+ and 47.0±10.1% in Gt/Gt embryos (P < 0.01 for Gt/Gt compared to +/+) (Fig. 4e,f). These results indicate the evolutionary conservation of ZNF410/Zfp410 with respect to control of CHD4/Chd4 and regulation of γ-globin expression. There was a nonsignificant trend of increase in mouse embryonic βh1-globin expression with no change in εy-globin and adult β-major/minor globin expression in Gt/Gt compared to +/+ embryos (Extended Data Fig. 6d). The Zfp410Gt/Gt homozygotes showed moderately reduced body weight compared to heterozygotes or wt mice (Extended Data Fig. 6e), but otherwise appeared healthy and active. Analysis of complete blood counts showed apparently unremarkable hematologic parameters in Zfp410Gt/Gt homozygous mice, including no evidence of anemia or hemolysis (Extended Data Fig. 6f). The absence of a severe phenotype of constitutive Zpf410 loss-of-function is notable in comparison to other HbF regulators. For example, Bcl11a-deficient mice experience perinatal lethality26, Zbtb7a-deficient mice mid-gestation embryonic lethality due to anemia11, and Chd4-deficient mice pre-implantation embryonic lethality27. Together these results suggest that ZNF410 is an evolutionarily conserved HbF repressor that is not essential for mammalian survival.
Figure 4. Zfp410-deficient mice are viable with unremarkable hematology.
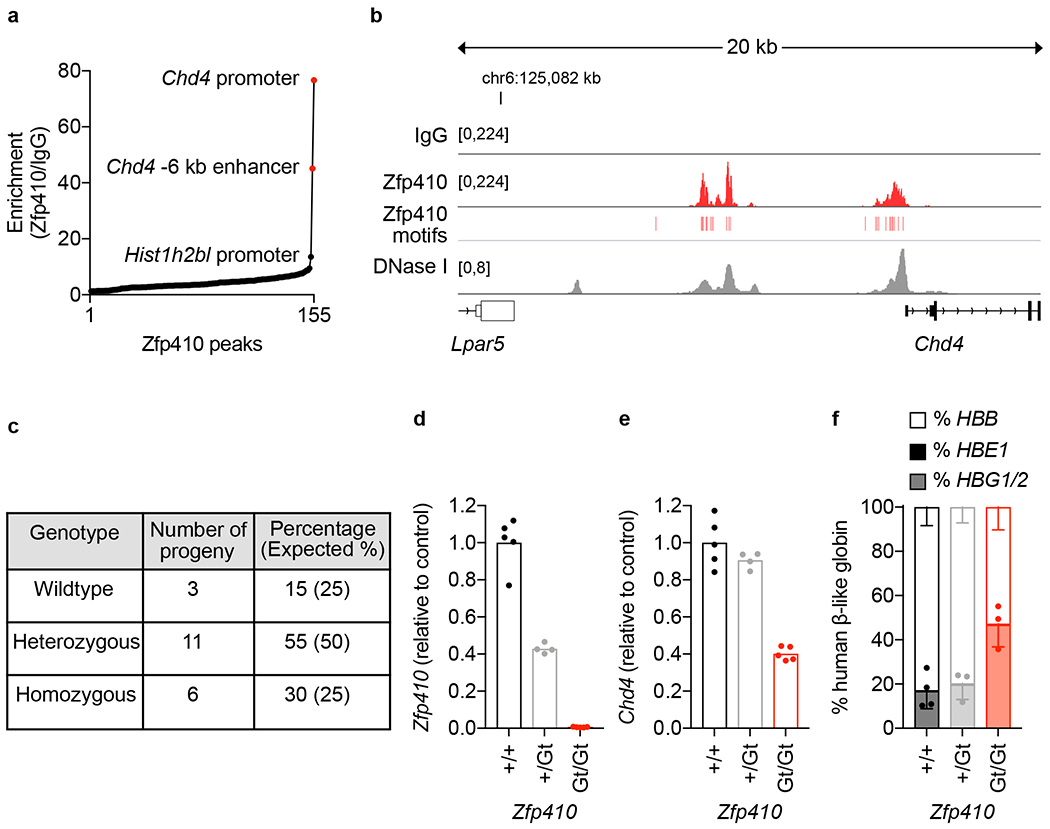
(a) CUT&RUN in mouse erythroleukemia (MEL) cells using anti-Zfp410 antibody (n = 3) and IgG control (n = 3). Enrichment for Zfp410 binding concentrated at Chd4 promoter (~77-fold enrichment) and Chd4 −6 kb enhancer (~45-fold enrichment) peaks. The next most enriched peak was at the Hist1h2bl promoter (~14-fold enrichment). (b) Chd4 locus showing Zfp410 binding (red peaks) at the Chd4 promoter and Chd4 −6 kb enhancer in representative IgG control (n = 3) and anti-Zfp410 (n = 3) samples. Positions of Zfp410 motifs (red rectangles) and accessible chromatin by DNase-seq (gray peaks). (c) Mouse ES cells heterozygous for Zfp410 gene-trap allele (Gt), obtained from EuMMCR, were used to generate heterozygous (Zfp410 +/Gt) and homozygous (Zfp410 Gt/Gt) gene-trap mice, with Zfp410+/Gt intercrosses yielding 20 progeny from 4 litters. (d) Zfp410 expression, measured by RT-qPCR using primers spanning exons 5 and 6, was diminished in Zfp410Gt/Gt (n = 5) mouse E14.5 fetal liver erythroid cells compared to heterozygous (n = 4, P < 0.0001) and wildtype (n = 5, P < 0.0001) control animals. (e) Chd4 expression, measured by RT-qPCR was decreased in Zfp410Gt/Gt (n = 5) mouse E14.5 fetal liver erythroid cells compared to heterozygous (n = 4, P < 0.0001) and wildtype (n = 5, P < 0.0001) control animals. (f) HBG1/2 expression, measured by RT-qPCR was elevated relative to total human β-like globin gene expression (HBE1 + HBG1/2 +HBB) in Zfp410Gt/Gt, β-YAC (n = 3) mouse E14.5 fetal liver erythroid cells compared to heterozygous (n = 3, P = 0.0178) and wildtype (n = 4, P = 0.0067) control animals. Data are presented as mean values and error bars are standard deviation. P values were calculated by two-tailed Student’s t-test for (d) - (f).
ZNF410 appears dispensable for human erythropoiesis and hematopoiesis
To evaluate the role of ZNF410 in human hematopoiesis, we performed gene editing of ZNF410 in primary human hematopoietic stem and progenitor cells (HSPCs). We electroporated 3×NLS-SpCas9 and sgRNA as ribonucleoprotein (RNP) to CD34+ HSPCs from two healthy donors and achieved >99% indels (Fig. 5a, b). Since all of these measured indels were +1 insertions, biallelic ZNF410 knockouts comprised nearly all cells in the population. To test the role of ZNF410 more broadly in hematopoiesis, we performed xenotransplantation of edited HSPCs to immunodeficient NBSGW mice (Fig. 5a). NBSGW mice support multilineage (lymphoid, myeloid and erythroid) human engraftment in absence of conditioning therapy28. After 16 weeks we analyzed bone marrow from engrafted recipients. We observed similar human hematopoietic engraftment for ZNF410 edited HSPCs compared to mock control xenografts (Fig. 5c). ZNF410 +1 insertion frameshift indels were observed at >99% frequency in total BM human hematopoietic cells similar to the input cell product (Fig. 5b). A comparable distribution of multilineage hematopoietic reconstitution was found in control and ZNF410 edited recipients, including B-lymphocyte, T-lymphocyte, granulocyte, monocyte, HSPC and erythroid contributions (Fig. 5d, e). We found that CHD4 expression was decreased by ~60% in human erythroid cells sorted from bone marrow, similar to in vitro results (Fig. 5f). The level of HbF as measured by HPLC from engrafting human erythrocytes was ~2.5% in controls and ~17% in ZNF410 edited recipients (Fig. 5g).
Figure 5. ZNF410-deficient human HSPCs derepress HbF and retain repopulation potential.
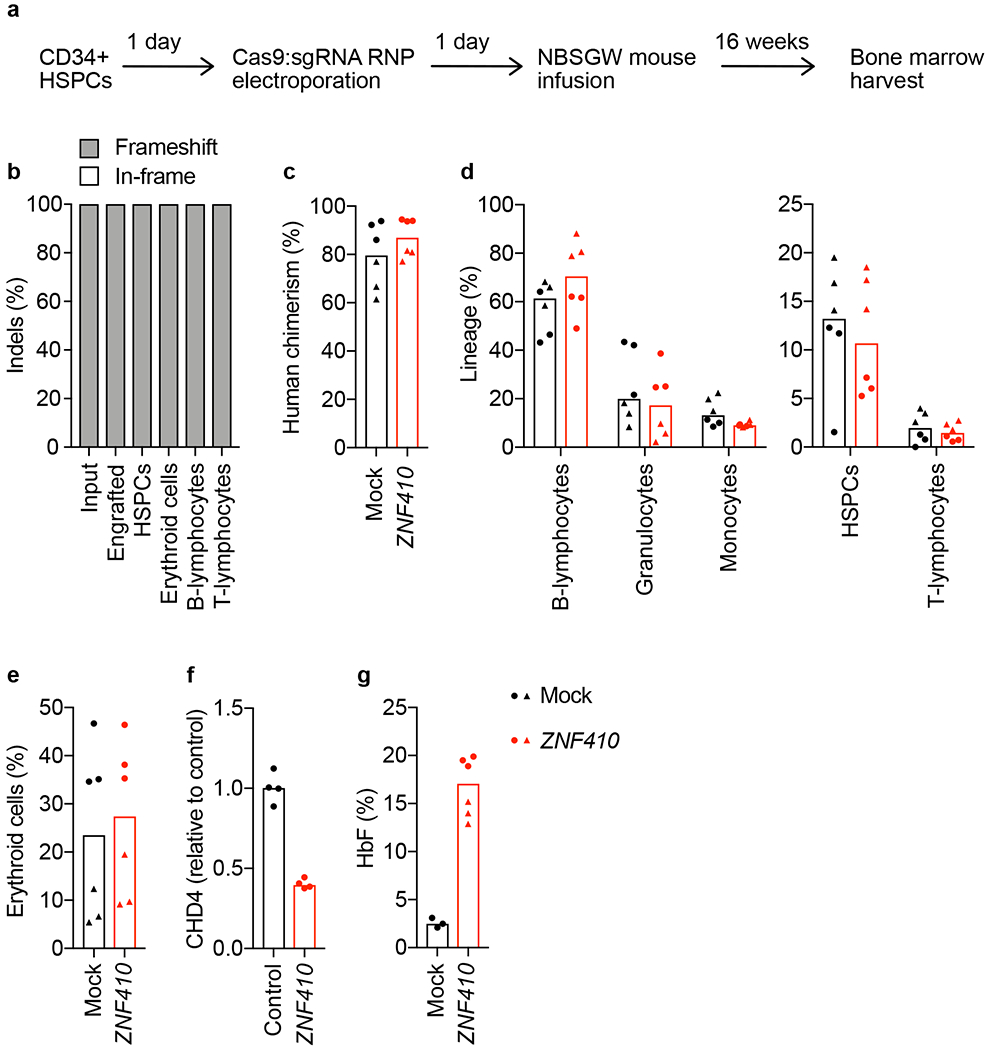
(a) Schematic of gene editing and transplant of human CD34+ HSPCs in immunodeficient NBSGW mice. Animals were euthanized 16 weeks post-transplant and bone marrow (BM) was harvested and sorted into various subpopulations by flow cytometry. (b-e) Two independent CD34+ HSPC donors were edited and transplanted into 6 mice for each condition (mock, n = 6 or ZNF410 edited, n = 6). Each symbol represents one mouse, recipients of donor 1 depicted as circles and donor 2 as triangles. Bars indicate median value. (b) Indel frequency at ZNF410 was quantified in input cells 4 days after electroporation and in total and sorted engrafted BM cells. Percentage of frameshift alleles is represented in gray and the percentage of in-frame alleles is represented in white for each bar. (c) Engraftment of human hematopoietic cells assessed by hCD45+ compared to total CD45+ cells. (d) B-lymphocytes (CD19+), granulocytes (CD33dim SSChigh) and monocytes (CD33bright SSClow) expressed as fraction of hCD45+ cells. HSPCs (CD34+) and T-lymphocytes (CD3+) expressed as fraction of hCD45+ CD19− CD33− cells. (e) Erythroid cells (hCD235a+) expressed as fraction of hCD45− mCD45− cells. (f) CHD4 expression measured by RT-qPCR in human erythroid cells from control (n = 4) and ZNF410 edited (n = 4) xenografts. (g) HbF measured by HPLC from hemolysates of sorted BM hCD235a+ cells from mock (n = 3) and ZNF410 edited (n = 6) xenografts.
For comparison, we also performed xenotransplant experiments with BCL11A- and ZBTB7A-edited HSPCs. Consistent with the known role of BCL11A in supporting HSC self-renewal (and unlike the selective erythroid impact of BCL11A erythroid enhancer editing29), we observed reduced human chimerism in the bone marrow of recipients of BCL11A exon edited HSPCs after 16 weeks, reduced BCL11A edits compared to input cell product, and reduced fraction of frameshift alleles compared to total edits (Extended Data Fig. 7a,b). For ZBTB7A, the fraction of engrafting human hematopoietic cells was similar to controls but the gene edits were reduced compared to input cell product (Extended Data Fig. 7a,b). During erythroid maturation culture, ZBTB7A edited HSPCs showed impaired terminal erythroid maturation potential based on immunophenotype and enucleation frequency, in contrast to ZNF410 edited cells (Extended Data Fig. 7c,d). Together these results suggest HSPCs bearing BCL11A and ZBTB7A loss-of-function alleles are under negative selective pressure during hematopoietic repopulation and erythropoiesis unlike ZNF410 edited cells.
Discussion
The advances in knowledge of the molecular details of hemoglobin switching have begun to bear fruits in the form of novel autologous therapies1. A host of HSC-based therapies that reduce the expression of BCL11A in erythroid cells or prevent its binding to HBG1/2 promoter sequences are in clinical trials or late preclinical development. However the clinical unmet need remains vast, with ~300,000 infants estimated to be born each year worldwide with sickle cell disease and tens of thousands more with severe β-thalassemia. The feasibility in terms of cost and infrastructure to scale up autologous cell-based therapies remains uncertain. Furthermore the toxicity of myeloablative transplantation will likely render these therapies out of reach to many patients.
The most realistic near-term hope to develop scalable therapies to address the root cause of these diseases would be through pharmacotherapy. Drugs that could interrupt molecular vulnerabilities required for adult erythroid cells to maintain fetal globins in a silenced state are greatly needed. These could complement or even supplant existing treatments like hydroxyurea30. BCL11A itself would certainly represent a preeminent target. Its roles in erythropoiesis besides HbF silencing are modest. However BCL11A plays essential roles in various hematopoietic lineages, including in B-lymphocytes, dendritic cells and hematopoietic stem cells26,31–33. In addition, it has functions beyond hematopoiesis not only in the central nervous system but also in breast and pancreatic cells34,35. Another exciting target would be ZBTB7A given its potent role in HbF repression. However ZBTB7A is required for terminal erythropoiesis and germinal center B cell maturation and plays important roles in T-lymphocytes, osteoclasts and HSCs36. Our results emphasize the critical requirement for ZBTB7A in human terminal erythropoiesis. A specific NuRD subcomplex including CHD4, GATAD2A, MBD2, MTA2 and HDAC2 is required for HbF silencing6,37. Targeting NuRD including key protein-protein interactions appears promising but would need to navigate the numerous gene expression programs that depend on this chromatin complex. For most of the known HbF regulators, their pleiotropic roles could yield potential on-target liabilities with narrow therapeutic index even if rational targeting approaches could be devised. Clinical observations have shown that modest increases in HbF level, particularly if pancellularly distributed, may be sufficient to ameliorate β-hemoglobinopathy clinical severity and that HbF induction effects may be magnified in patients due to disease associated stress erythropoiesis and peripheral selection for F-cells38,39.
Here we identify ZNF410 as an HbF repressor that acts specifically to enhance the expression of CHD4. While this manuscript was under review, an independent study reported similar results40. Our gene expression profiling showed that changes in expression following ZNF410 loss mimicked the effects of partial inhibition of CHD4. Complete knockout of ZNF410/Zfp410 is well-tolerated throughout erythropoiesis, hematopoiesis, and mammalian development, apparently since the remaining level of CHD4 is sufficient to maintain cellular functions. Zfp410 mutant mice survive to adulthood and ZNF410 knockout HSPCs demonstrate no defects in erythroid maturation or hematopoietic reconstitution. Future studies would be needed to extensively characterize any potential biological impacts of changes in gene expression, such as upregulation of APOL1 and S100A1. Traditionally TFs have been considered undruggable targets. However the example of small molecules binding and resulting in specific degradation of zinc finger proteins like IKZF1 has encouraged the development of ligands to modulate DNA-binding factors41,42.
ZNF410 appears to represent a special form of gene regulator. Conventional DNA-binding TFs bind and directly control the expression of thousands of genomic targets. In contrast, ZNF410 shows unique binding to CHD4 in both human and mouse cells. This exquisite specificity appears to be achieved through a remarkable clustering of 27 ZNF410 binding sites at the CHD4 promoter and −6 kb enhancer, a density unlike anywhere else in the genome. Both ZNF410 itself and its two target elements at CHD4 are highly conserved across vertebrates. Despite thousands of ZNF410 motifs across the genome, we detected minimal ZNF410 occupancy at these sites. The absence of detectable ZNF410 occupancy or chromatin accessibility even at GALNT18 intron 1 with 6 clustered motif instances suggests that motif clusters may be necessary but insufficient for ZNF410 binding. Future studies are needed to better understand how ZNF410 transactivates CHD4, including mutagenesis of both ZNF410 and its binding sequences at CHD4 to explore the roles of protein-level cooperativity and chromatin accessibility as well as the cis-regulatory logic of ZNF410 motif clusters. An example from existing literature of clustered homotypic TF binding sites associated with gene control is the binding of ZFP64 to the MLL gene promoter, activating the expression of the chromatin regulator MLL, although in this case ZFP64 shows a limited set of additional direct target genes43. CHD4 is an especially abundant nuclear protein in erythroid precursors44. Haploinsufficiency of CHD4 (or MLL) causes impaired intellectual development and congenital anomalies, suggesting that chromatin regulatory complexes must be maintained at precise levels to maintain proper gene regulation, particularly during development45–47. Another zinc finger protein that binds a single gene is TFIIIA, with 9 ZFs, in which distinct ZFs bind to the tandemly repeated 5S rRNA DNA sequences and the rRNA itself48. There are more than a thousand putative DNA-binding TFs, for many of which the genomic binding sites and regulons remain poorly characterized49. ZNF410 may be emblematic of a class of TFs relying on homotypic motif clusters50 with limited gene targets that are devoted to maintenance of core cellular programs.
In summary, here we identify ZNF410 as a dispensable TF that represses HbF level in adult-stage erythroid precursors by devoted maintenance of CHD4 levels through binding a singular cluster of sequences upstream of CHD4.
Methods
Cell culture
HUDEP-2 cells51 were cultured as previously described52. Expansion phase medium for HUDEP-2 cells consists of SFEM (Stemcell Technologies #09650) base medium supplemented with 50 ng/ml recombinant human SCF (R&D systems #255-SC), 1 μg/ml doxycycline (Sigma Aldrich #D9891), 0.4 μg/ml dexamethasone (Sigma Aldrich #D4902), 3 IU/ml EPO (Epoetin Alfa, Epogen, Amgen) and 2% Penicillin-Streptomycin solution (10,000 U/ml stock). Erythroid differentiation medium (EDM) for HUDEP-2 cells consists of Iscove’s Modified Dulbecco’s Medium (IMDM, ThermoFisher #12440053) supplemented with 1% L-Glutamine (Gibco #25030081), 330 μg/ml human holo-Transferrin (Sigma #T0665), 10 μg/ml human insulin (Sigma #I9278), 2 IU/ml heparin (Sigma #H3149), 5% inactivated human plasma (Octaplas, blood group AB, Octapharma), 3 IU/ml EPO (Epoetin Alfa, Epogen, Amgen) and 2% Penicillin-Streptomycin solution (10,000 U/ml stock). EDM-2 medium for HUDEP-2 cells is EDM supplemented with 100 ng/ml human SCF and 1 μg/ml doxycycline. CD34+ HSPCs from adult mobilized peripheral blood from de-identified healthy donors were purchased from Fred Hutchinson Cancer Research Center, Seattle, Washington. Upon thawing, CD34+ HSPCs were resuspended in X-VIVO 15 medium (Lonza #04-380Q) containing 50 ng/ml recombinant human Flt-3 ligand (Peprotech #300-19), 100 ng/ml recombinant human TPO (Peprotech #300-18) and 100 ng/ml recombinant human SCF (R&D systems #255-SC) (referred to as X-VIVO complete medium). Erythroid differentiation was performed in 3 phases as previously described53. Mouse erythroleukemia cells, MEL-745A cl. DS19, were cultured in RPMI 1640 medium supplemented with 10% fetal bovine serum and 1% Penicillin-Streptomycin.
sgRNA library screening
For library screening, HUDEP-2 cells with stable expression of LentiCas9-Blast (Addgene plasmid 52962) were transduced at a low multiplicity of infection (MOI) with virus containing sgRNA library cloned in lentiGuide-Puro (Addgene plasmid 52963) to ensure that most cells received only one sgRNA in expansion phase medium54. The sgRNA library included 18,020 gRNA overlapping those in GeCKOv255 and Avana56 libraries targeting 1,591 transcription factors and 13 genes of the NuRD complex as controls. After 24 hours, cells were transferred to and cultured in erythroid differentiation medium for 14 days. At the end of erythroid culture, cells were processed for intracellular HbF staining using Fetal Hemoglobin Monoclonal Antibody (HBF-1) conjugated to FITC (Thermo Fisher #MHFH01), and HbF+ cells were sorted by FACS as previously described6. Genomic DNA was extracted from the total cell population and from HbF+ sorted cells and deep sequenced to identify guide RNAs with enrichment in the HbF+ pool as previously described6. Briefly, two-step PCR was performed to amplify sgRNA cassette from genomic DNA, using Herculase II Fusion DNA polymerase (Agilent #600677). Multiple reactions of the first PCR were set up for each sample in order to maximize genomic DNA input up to 1,000-cell equivalents per sgRNA. After the first PCR, all reactions for each sample were pooled and 1 μl of this mix used as input for the second PCR reaction which was performed in duplicate. Illumina adaptor and sample barcodes added in the second PCR. Primers for the second PCR were of variable length to increase library complexity54. Sequences of PCR primers can be found in Supplementary Table 2. Amplicons obtained from the second PCR were purified by gel extraction and quantified using the Qubit dsDNA HS assay kit (Invitrogen #Q32851). Single-end 75 bp sequencing was performed on the NextSeq 500 platform by the Molecular Biology Core Facilities at Dana-Farber Cancer Institute. Candidate HbF regulators were identified by analyzing sequencing data using the model-based analysis of genome-wide CRISPR-Cas9 Knockout (MAGeCK) computational tool57. The sgRNA level and gene-level cell fitness and HbF enrichment scores are listed in Supplementary Tables 3 and 4.
Validation in HUDEP-2 cells
Candidate HbF regulators identified by the screen were validated in arrayed format in HUDEP-2 cells. HUDEP-2 cells with stable expression of lentiCas9-Blast were transduced with sgRNA cloned in lentiGuide-Puro in expansion phase medium. 24 hours after transduction, cells were cultured in EDM2 for 4 days, EDM with doxycycline for 3 days and EDM without doxycycline for 2 days as previously described52. These culture conditions result in differentiation of normal HUDEP-2 cells to orthochromatic erythroblasts. At the end of erythroid differentiation cells were divided into aliquots and processed for intracellular HbF staining, RNA isolation and hemoglobin HPLC. In addition to mock treated cells, non-targeting sgRNAs or sgRNAs targeting either AAVS1 or a functionally neutral locus on chr2 (so-called “safe targeting” sgRNA)58 were used as experimental controls as indicated in each figure legend. For RNA sequencing experiments HUDEP-2 cells were cultured in expansion phase medium for 6 days after transduction or electroporation. RNA was isolated using Trizol according to the manufacturer’s protocol (Thermo Fisher #15596026). Purified RNA was treated with DNase I. mRNA libraries were prepared and sequenced by the Molecular Biology Core Facilities at Dana-Farber Cancer Institute.
Generation of ZNF410 null HUDEP-2 cell clones
The entire coding sequence of ZNF410 was deleted in HUDEP-2 cells using paired Cas9 cleavages. ZNF410 null HUDEP-2 cell clones were generated in two steps. In the first step a cell clone with heterozygous deletion of ZNF410 was obtained using the gRNAs ZNF410-del-5’-tgt1 and ZNF410-del-3’-tgt1. In the second step this heterozygous ZNF410 null clone was retargeted using a second pair of guide RNAs, ZNF410-del-5’-tgt2 and ZNF410-del-3’-tgt2, to obtain biallelic deletion of ZNF410. Three individual ZNF410 null clones were obtained by limiting dilution of bulk edited cells. Mono- or biallelic deletion clones were identified by PCR amplification of the genomic DNA flanking the deletion (outer PCR) and inside the targeted region (inner PCR) using the following primers: ZNF410-outer-FP/RP and ZNF410-inner-FP/RP. For the rescue experiment, the three ZNF410 null clones were transduced with either an HA-tagged ZNF410 construct or an HA-tagged nuclear localization sequence (NLS) containing control vector. Successfully transduced cells were obtained by selection of cells using blasticidin (Invivogen #ant-bl-05).
Validation in CD34+ HSPCs
CD34+ cells were thawed and maintained in X-VIVO complete medium for 24 hours. 100,000 cells per condition were electroporated using the Lonza 4D nucleofector with 100 pmol 3×NLS-Cas9 protein and 300 pmol modified sgRNA targeting the gene of interest. In addition to mock treated cells, AAVS1 targeting or “safe-targeting” RNPs were used as experimental controls as indicated in each figure legend. After electroporation cells were differentiated to erythroblasts as described previously53. 4 days after electroporation, genomic DNA was isolated from an aliquot of cells, the sgRNA targeted locus was amplified by PCR and processed for Sanger sequencing. Sequencing results were analyzed by Synthego’s ICE algorithm to obtain editing efficiency and allele contributions. At the end of erythroid culture (day 18) cells were processed for surface marker / enucleation analysis by staining with anti-CD71 (PE-Cy7 conjugated, eBioscience #25-0719-42), anti-CD235a (APC conjugated, eBioscience #17-9987-42) and Hoechst 33342 (Invitrogen #H3570) following manufacturer’s recommendations for antibody concentration and flow cytometry data acquisition on the BD LSR Fortessa. Cells were also processed for hemoglobin HPLC using the Bio-Rad D-10 hemoglobin testing system.
Dense mutagenesis of ZNF410
180 guide RNAs were identified by searching for 20-mer sequences upstream of an NGG PAM on the sense and antisense strands of the consensus coding sequence (CCDS) for ZNF410 obtained from the Ensembl genome browser (Transcript ID ENST00000555044.6). Lentiviral sgRNA libraries were synthesized as previously described59 and pooled screening was performed as described in the sgRNA library screening section above. Sequencing results were analyzed by the CRISPRO tool60. For each gRNA an HbF enrichment score was calculated comparing the abundance of the gRNA in HbF-high cells to the total cell pool at the end of erythroid culture. Cell fitness scores were calculated by comparing the abundance of the gRNA in cells at the end of erythroid culture to the starting library. The CRISPRO algorithm maps the cell fitness and HbF enrichment score to gene, transcript and protein coordinates and lists associated protein structural domains. sgRNA sequences with corresponding amino acid position, cell fitness and HbF enrichment scores are listed in Supplementary Table 5. LOWESS curves were generated by Prism software using the default parameter: 10 points in smoothing window (medium).
CUT&RUN
CUT&RUN was performed to identify the genome-wide ZNF410/Zfp410 DNA binding profile as previously described18. The antibodies used were anti-HA antibody (ThermoFisher #71-5500) in HUDEP-2 cells expressing an HA-tagged ZNF410 construct or anti-ZNF410 (Abcam #ab174204) to detect endogenously expressed ZNF410 in HUDEP-2 and primary human CD34+ cells as well as endogenously expressed Zfp410 in MEL cells. Normal rabbit IgG polyclonal antibody (Millipore Sigma #12370) was used as a control for non-specific sequence enrichment. Anti-H3K27me3 antibody (Cell signaling Technology #9733) was used as a positive control for the steps leading up to the chromatin release. Protein A-MNase was kindly provided by Dr. Steve Henikoff. Sequencing libraries were prepared using the NEBNext Ultra™ II DNA Library Prep Kit for Illumina as previously described9. Paired-end 42-bp sequencing was performed on the NextSeq 500 platform by the Molecular Biology Core Facilities at Dana-Farber Cancer Institute. Sequencing data analysis was adapted from previous protocols9,18. FastQC (Babraham Institute) was performed for all samples to check sequencing quality. Adapter sequences were trimmed with Trimmomatic61 with the following settings: “ILLUMINACLIP:$TRIMMOMATIC/adapters/TruSeq3-PE.fa:2:15:4:4:true SLIDINGWINDOW:4:15 MINLEN:25.” Trimmed reads were aligned to the human reference genome hg19 using bowtie262 with the following settings: “--end-to-end --no-unal --no-mixed --no-discordant --dovetail --phred33 -p 4.” The resulting alignment files (.sam) were converted to sorted, indexed bam files and marked for duplicates using Picard (https://broadinstitute.github.io/picard/). Reads were filtered using an alignment score cutoff of 10 with samtools63. Peak calling was performed using macs264 with the following settings: “callpeak -f BAMPE -t [ test replicates] -c [control replicates] -B -g [hs or mm] -q 0.05 -n [outputID].” Genomic regions annotated as part of the ENCODE project blacklist65 as problematic regions for alignment of high-throughput functional genomics data were excluded from analysis using files ENCFF001TDO (hg19, Birney laboratory, EBI) and ENCFF547MET (mm10, Kundaje laboratory, Stanford) and BEDtools66. Locus footprinting was performed to identify regions of DNA that are relatively protected from MNase cleavage compared to neighboring regions due to occupancy by a transcription factor. Footprint patterns at a locus were determined by enumerating the ends of each fragment sequenced and aligned to the locus. Data was visualized using IGV67.
Genome-wide motif mapping
Genome-wide ZNF410 DNA binding motif instances were mapped using the pwmscan webtool (https://ccg.epfl.ch/pwmtools/pwmscan.php) and the ZNF410 motif MA0752.1 from the JASPAR CORE 2018 vertebrates motif library. The number of motif instances in the genome was enumerated using a 3-kb sliding window with a 100-bp overlap to determine genomic distribution of motif occurrence for ZNF410. Motifs that fall within the overlapping region between genomic windows are assigned to the adjacent window with the greater number of motifs, or if both adjacent windows have the same number of motifs, motifs are assigned to the first of the two windows. The motif counting script was written using Python version 2.7.12 and is available at https://github.com/yao-qiuming/Vinjamur_NG2021.
ATAC-seq and DNase-seq identification of regions of open chromatin
ATAC-seq was performed in HUDEP-2 cells grown in expansion phase medium following the OMNI-ATAC protocol68. MEL DNase-seq data was obtained from the ENCODE project69,70 (https://www.encodeproject.org/) from the laboratory of Dr. John Stamatoyannopoulos, UW (dataset: ENCSR000CNN, file: ENCFF990ATO).
DNA sequence conservation
SiPhy rate71 (10 mer) from: http://www.broadinstitute.org/igvdata/hg19/omega.10mers.wig.tdf.
GSEA
Genes that were differentially expressed in ZNF410 targeted HUDEP-2 cells compared to AAVS1 targeted control cells were compared by gene set enrichment analysis (GSEA)72,73 to genes that were differentially expressed in CHD4 targeted HUDEP-2 cells compared to non-targeting control cells6. The list of genes differentially expressed in CHD4 targeted HUDEP-2 cells are genes that were differentially expressed in both datasets (q <0.05) when either the helicase domain or the CHDCT2 domain of CHD4 were perturbed using sgRNA GGTGTCAGTGCCCTGAGCCC or GAATTCGGGCAATGGTAGCT respectively from previously published data6. The motivation for combining these two datasets is based on the observation that helicase domain targeting is toxic to cells while CHDCT2 domain targeting is better tolerated and so the combined list of differentially expressed genes better represents gene expression changes due to CHD4 ablation than either dataset alone.
Gene dependency correlation
Gene dependency scores for 558 cell lines were obtained from the Achilles Avana 20Q2 Public CERES dataset of the Depmap portal (DepMap, Broad (2020): DepMap 20Q2 Public. figshare. Dataset. https://doi.org/10.6084/m9.figshare.12280541.v4.)21,22. Project Achilles performs genome scale CRISPR/Cas9 loss-of-function screening in cancer cell lines and uses CERES to determine a dependency score for each gene in each cell line. Pearson’s correlations of dependency scores and P values were calculated for ZNF410 and every other gene in the dataset.
Analysis of gene expression across human tissues
ZNF410 and CHD4 expression values (TPM) across 54 human tissues were obtained from the GTEx Portal20 on 10/01/2019. Pearson correlation was used to compare the expression of ZNF410 and CHD4.
Generation of CHD4 Δ6.7 kb and Δ6.9 kb clones
The genomic region upstream of CHD4 encompassing the two clusters of ZNF410 DNA binding motifs was targeted using a pair of sgRNAs (CHD4-proximal-gRNA-1: GUGCGGUGGGAUUUCCCGGC and CHD4-distal-gRNA-1: CGAGGCUGUGUCAGCGCCGC or CHD4-distal-gRNA-2: UUGGUCUGUGGGAUGGACAU) to generate HUDEP-2 clones with biallelic deletion of the intervening sequence. These clones are termed CHD4 Δ 6.7 kb (for clones generated using CHD4-proximal-gRNA-1 and CHD4-distal-gRNA-1) or CHD4 Δ6.9 kb (for clones generated using CHD4-proximal-gRNA-1 and CHD4-distal-gRNA-2). The bulk population of targeted cells was serial diluted and ~30 cells per plate were plated in 96-well plates to obtain single cell clones. Mono- or biallelic deletion was identified by PCR amplification of the genomic DNA flanking the deletion (outer PCR) and inside the targeted region (inner PCR) using the following primers: CHD4-Outer-FP and CHD4-Outer-RP1 or CHD4-Outer-RP2, CHD4-Inner-FP and CHD4-Inner-RP (sequences listed in Supplementary Table 2).
RT-qPCR
RNA was isolated using either Trizol (Invitrogen #15596026) or the RNeasy Plus Mini kit (Qiagen #74136) following the manufacturer’s protocol. RNA was quantified using the Nanodrop spectrophotometer. cDNA was synthesized using the iScript cDNA synthesis kit (Bio-Rad #1708891) following the manufacturer’s recommendations. qPCR was performed using the Sybr Select Master Mix (Thermo Fisher #4472908) on an Applied Biosystems 7300 or Quant Studio 3 real-time PCR system. Primers used for RT-qPCR are listed in Supplementary Table 2. CAT was used as a reference gene for human cells and Gapdh for mouse cells.
Immunoblots
Cellular protein extracts were prepared using the NE-PER nuclear and cytoplasmic extraction reagents (Thermo Scientific #78833). Cytoplasmic extracts from HUDEP-2 cells in expansion phase culture and CD34+ HSPC derived erythroblasts on day 7 of erythroid maturation culture were used for LC3-I/II immunoblot. Nuclear extracts from CD34+ HSPC-derived erythroblasts on day 11 of erythroid maturation culture were used to assess ZNF410 (Proteintech #14529-1-AP), CHD4 (Abcam #ab70469), GATAD2A (Bethyl Laboratories #A302-358A), MTA2 (Abcam #ab8106), MBD2 (Bethyl Laboratories #A301-632A), HDAC2 (Abcam #ab32117), RBBP4 (Bethyl Laboratories #A301-206A-T) and GAPDH (Cell Signaling Technology #5174S) protein expression. All primary antibodies were used at a dilution of 1:1,500, except the anti-ZNF410 antibody which was used at a dilution of 1:500. Standard SDS-PAGE immunoblotting protocol was followed using 4-20% TGX Precast Protein Gels (Bio-Rad), the Transblot Turbo transfer system (Bio-Rad) and the Amersham ImageQuant 800 imager (GE).
Generation of Zfp410 gene-trap allele mice
All animal experiments were approved by the Boston Children’s Hospital Institutional Animal Care and Use Committee. Our mouse colony is maintained as follows: the room temperature is set at 71 degrees F (± 3 degrees), relative humidity 35%-70% (± 5%), 10-15 air changes per hour, and the light cycle “on” is 6:30am-8:30pm. The room is at a negative pressure. Zfp410 gene-trap allele mice were generated as described below. C57BL/6 mice were obtained from Charles River Laboratories (Strain Code 027). Mouse ES cells heterozygous for a Zfp410 gene-trap allele produced in the EUCOMM (European Conditional Mouse Mutagenesis Program) were purchased from the European Mouse Mutant Cell Repository (EuMMCR, Germany). The ES cells were derived from a C57BL/6N background. The targeting cassette was inserted in intron 5 and contains a splice acceptor site upstream of the lacZ gene that disrupts normal splicing and thus expression of Zfp410 (Extended Data Fig. 4b). This allele also has conditional potential with LoxP sites flanking exon 6. We purchased 3 ES cell clones (E06, F06 and F07). Karyotype analysis was performed by EuMMCR. The percentage of cells with normal chromosome count (2n = 40) for each clone was 77% for E06, 70% for F06 and 90% for F07. Clones E06 and F07 were chosen for blastocyst micro-injections. Chimeric mice were generated by the NIH/NIDDK Center of Excellence in Molecular Hematology, Mouse Embryonic Stem Cell (ESC) and Gene Targeting Core facility. C57BL/6 mice were used as the host for blastocyst micro-injections. For clone E06, there were a total of 13 pups born from 3 pregnant fosters, of which there were 2 male and 1 female chimeric mice. For clone F07, there were 3 pups born from 2 pregnant fosters, none of which were chimeras. Of the 3 chimeric mice obtained, one male produced germline transmission of the Zfp410 gene-trap (Gt) allele upon breeding with wildtype C57BL/6 mice. Mice heterozygous for the Zfp410 gene-trap allele (Zfp410+/Gt) were intercrossed to generate mice homozygous for the Zf410 gene-trap allele (Zfp410Gt/Gt). Mice carrying the Zfp410 gene-trap allele were genotyped using primers flanking the LoxP site in intron 6 (LoxP-FP and LoxP-RP). During homologous recombination, the targeting cassette replaces endogenous DNA stretches resulting in a slightly different PCR product from the targeted compared to the wildtype allele. Mice heterozygous for the Zfp410 gene-trap allele (Zfp410+/Gt) were crossed with mice transgenic for a human β-globin cluster transgene (β-YAC)24,25 to generate Zfp410+/Gt, β-YAC animals. Zfp410+/Gt, β-YAC animals were intercrossed in timed matings, euthanized on E14.5, and fetal liver tissue was processed for RNA isolation using Trizol. Embryonic tissue was also collected for genotyping of embryos. Peripheral blood was collected from mice at 3 months of age. CBCs were performed on the Advia hematology system at the BCH-HSCI Flow Core. Values for the normal range of various hematological parameters for C57BL/6 mice were obtained from the Charles River Laboratories website (https://animalab.eu/sites/all/pliki/produkty-dopobrania/Biochemistry_and_Hematology_for_C57BL6NCrl_Mouse_Colonies_in_North_American_for_January_2008_December_2012.pdf). RNA was isolated from whole blood using Trizol following the manufacturer’s protocol.
Xenotransplant
NOD.Cg-KitW–41J Tyr + Prkdcscid Il2rgtm1Wjl (NBSGW) mice were obtained from Jackson Laboratory (Stock 026622). CD34+ HSPCs from adult mobilized peripheral blood from de-identified healthy donors were thawed and recovered in X-VIVO complete medium for 24 hours. After recovery, cells were electroporated using the Lonza 4D nucleofector with 3×NLS-Cas9 protein and sgRNA. Cells were allowed to recover from electroporation for 24-48 hours in X-VIVO complete medium. Cells were counted and divided equally among 3 or 4 recipient mice per condition. A portion of cells was subjected to in vitro erythroid differentiation. Pre-transplant editing efficiency was assessed on day 4 of in vitro culture. In each experiment 4 mice received cells that were not subjected to electroporation (mock) as experimental controls. Cells were resuspended in 200 μl DPBS per mouse and infused by retro-orbital injection into non-irradiated NBSGW female mice. 16 weeks post transplantation, mice were euthanized, bone marrow was collected and xenograft analysis was performed as previously described29. Analysis of bone marrow subpopulations was performed by flow cytometry. Bone marrow cells were first incubated for 15 minutes with Human TruStain FcX (BioLegend #422302) and TruStain FcX (anti-mouse CD16/32, BioLegend #101320) to block non-specific binding of immunoglobulin to Fc receptors, followed by incubation with anti-human CD45 (V450, clone HI30, BD Biosciences #560367), anti-mouse CD45 (PE-eFluor 610, clone 30-F11, Thermo Fisher #61-0451-82), anti-human CD235a (FITC, BioLegend #349104), anti-human CD33 (PE, BioLegend #366608), anti-human CD19 (APC, BioLegend #302212), anti-human CD3 (PE/Cy7, BioLegend #300420) and anti-human CD34 (FITC, BioLegend #343504) antibodies. Fixable Viability Dye (eFluor 780, Thermo Fisher #65-0865-14) was used to exclude dead cells. The percentage of human engraftment was calculated as hCD45+ cells/(hCD45+ cells + mCD45+ cells) × 100. B-lymphocyte (CD19+), granulocyte (CD33dim SSChigh) and monocyte (CD33bright SSClow) lineages were gated on the hCD45+ population. HSPCs (CD34+) and T-lymphocyte (CD3+) lineages were gated on the hCD45+ hCD19− hCD33− population. Human erythroid cells (CD235a+) were gated on the hCD45− mCD45− population. The detailed gating strategy is shown in Extended Data Figure 8.
Statistical analyses
All values indicated for replicates (n = x) are biological replicates. P values were calculated by two-tailed Student’s t-test. Statistical analyses were performed with Prism version 7.
Extended Data
Extended Data Figure 1.

HUDEP-2 cells were edited at ZNF410 or AAVS1 (control) using sgRNA:Cas9 RNP electroporation. (a) Efficient editing was achieved with all five ZNF410 targeting gRNAs (n=1 for each gRNA). Cells were cultured in EDM2 for 8 days and (b) cell count and (c) viability data were recorded on alternate days for five individual gRNAs targeting ZNF410 (sg 1-5, n=3 for sg 1, n=1 for sg 2-5) in comparison to mock (n=3) and AAVS1 (control, n=3) targeted cells. Data are presented as mean values and error bars are standard deviation. (d) Robust y-globin induction was obtained with all five ZNF410 targeting gRNAs (n=1 for each gRNA) in comparison to mock (n=1) and AAVS1 (control, n=1) targeted cells. (e) HUDEP-2/Cas9 cells nontransduced (mock, n=3) or transduced with ZNF410 targeting sgRNA (n=4) assayed on day 9 of erythroid differentiation with RT-qPCR for HBE1 (p=0.1426, ns), HBB (p=0.0353) and HBA (p = 0.0122) expression. All values are relative to Catalase expression (endogenous control) and expressed as fold change relative to mock for each biological replicate. Data are presented as mean values and error bars are standard deviation. Statistically significant differences were determined using paired Student’s t-test comparing ZNF410 targeted cells to mock. (f) Three HUDEP-2 ZNF410 biallelic KO clones were generated using paired genomic cleavages that delete the entire coding sequence. Clones were generated in two successive steps. In the first step a HUDEP-2 clone heterozygous for ZNF410 deletion was isolated. The ZNF410 null allele in this clone is designated Null cl. allele 1 and its sequence is shown on the left. In the second step this heterozygous ZNF410 deletion clone was retargeted and three biallelic ZNF410 null clones were isolated with the sequences of the second ZNF410 null allele in each clone shown on the right of the figure.
Extended Data Figure 2.

(a) Immunoblot showing protein expression of ZNF410, CHD4, and members of the HbF repressive NuRD subcomplex - GATAD2A, MTA2, MBD2, HDAC2 and RBBP4 - in ZNF410 targeted primary erythroblasts on Day 11 of erythroid culture. GAPDH included as loading control. (b) Growth curve of ZNF410 targeted primary erythroblasts (n=3) compared to mock (n=3) and safe control (n=3) targeted cells over 18 days of erythroid differentiation culture. Data are presented as mean values and error bars are standard deviation. (c) HBG1/2 (p<0.05), HBE1 (ns), HBB (p<0.01) and HBA1/2 (ns) globin gene expression measured by RT-qPCR in ZNF410 targeted (n=3) compared to Mock (n=3) and safe control targeted (n=3) primary erythroblasts. Catalase was used as the endogenous normalization control. Values are displayed relative to the mean of mock samples. Statistical tests compare ZNF410 targeted and mock samples, ns not significant. Data are presented as mean values and error bars are standard deviation. (d) ZNF410 targeted (n=1) by RNP electroporation of Cas9 and sgRNA in CD34+ HSPCs from a sickle cell disease patient and subsequently differentiated to erythroid cells in vitro. At the end of erythroid culture (day 18), HbF level was measured by hemoglobin HPLC and compared to mock (n=1) and safe control (n=1) targeted cells.
Extended Data Figure 3.

(a-c) α-like and -like globin gene clusters and GALNT18 intron 1 with a cluster of 6 ZNF410 motifs indicating absence of ZNF410 occupancy in representative CUT&RUN control IgG (n=9) and anti-HA (n=7) in HUDEP-2 cells over-expressing HA-tagged ZNF410, control IgG (n=1) and anti-ZNF410 (n=1) in HUDEP-2 cells, and control IgG (n=2) and anti-ZNF410 (n=2) in CD34+ HSPC derived erythroid precursors. Positions of ZNF410 motifs (red rectangles), accessible chromatin by representative ATAC-seq in HUDEP-2 cells (gray peaks, n=3) and DNA sequence conservation by SiPhy rate.
Extended Data Figure 4.

(a) The third most enriched peak for ZNF410 binding (following CHD4 promoter and −6 kb enhancer) by CUT&RUN with anti-HA antibody in HUDEP-2 cells over-expressing ZNF410-HA was at TIMELESS intron 1. Representative CUT&RUN control IgG (n=9) and anti-HA (n=7) in HUDEP-2 cells over-expressing HA-tagged ZNF410, control IgG (n=1) and anti-ZNF410 (n=1) in HUDEP-2 cells, and control IgG (n=2) and anti-ZNF410 (n=2) in CD34+ HSPC derived erythroid precursors. Positions of ZNF410 motifs (red rectangles), accessible chromatin by representative ATAC-seq in HUDEP-2 cells (gray peaks, n=3), DNA sequence conservation by SiPhy rate, and repetitive elements from RepeatMasker. (b) A total of 5 peaks were identified by CUT&RUN with anti-ZNF410 antibody in HUDEP-2 cells. The top 4 peaks were at the CHD4 promoter or −6 kb enhancer, the fifth was at DPY19L3 intron 5. (c) A total of 5 peaks were identified by CUT&RUN with anti-ZNF410 antibody in CD34+ HSPC derived erythroid precursors. All 5 peaks were at the CHD4 promoter or −6 kb enhancer. (d) Peak of ZNF410 occupancy at DPY19L3 intron 5 in HUDEP-2 cells.
Extended Data Figure 5.
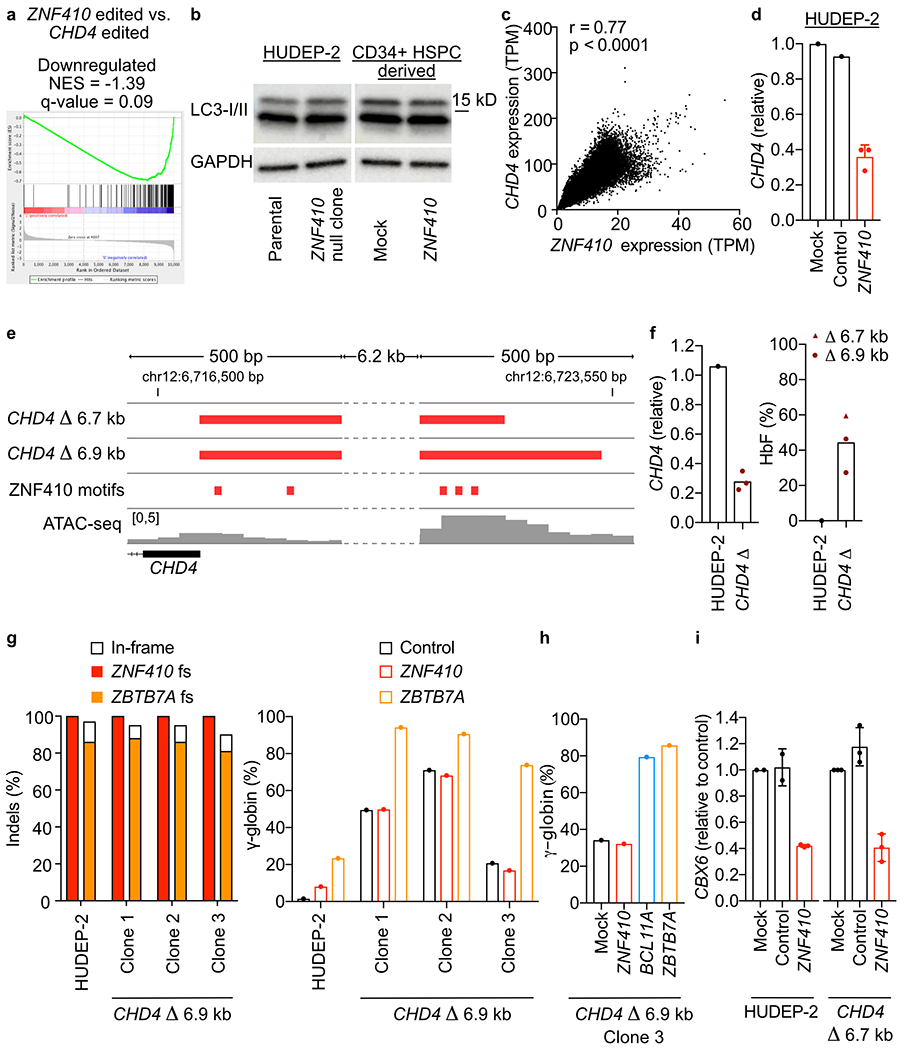
(a) Comparison of genes downregulated in ZNF410 and CHD4 mutant cells by GSEA (b) LC3-I/II and GAPDH (control) immunoblot in unedited parental and ZNF410 null HUDEP-2 cells (left panel) and mock and ZNF410 targeted primary erythroblasts (c) Correlation of ZNF410 and CHD4 expression across 54 human tissues from GTEx (Pearson r=0.77, p<0.0001) (d) CHD4 expression in ZNF410 targeted (n=3) compared to mock (n=1) and AAVS1 (n=1) targeted control HUDEP-2 cells. Data are mean values, error bars are standard deviation. (e) Cas9 paired cleavages with CHD4-proximal-gRNA-1 and CHD4-distal-gRNA-1 (CHD4 Δ 6.7 kb) or CHD4-proximal-gRNA-1 and CHD4-distal-gRNA-2 (CHD Δ 6.9 kb) were used to generate HUDEP-2 clones with biallelic deletions spanning both of the ZNF410 binding regions upstream of CHD4. Positions of ZNF410 motifs (red rectangles) and accessible chromatin by ATAC-seq (gray peaks) (f) CHD4 expression in CHD4 Δ 6.9 kb clones (n=3) compared to HUDEP-2 cells (n=1) (left panel) and HbF level measured by hemoglobin HPLC in CHD4 Δ 6.7 kb (n=1) and Δ 6.9 kb (#2 and #3, n=2) clones compared to HUDEP-2 cells (n=1) (right panel). (g) CHD4 Δ 6.9 kb clones and HUDEP-2 cells were subjected to AAVS1 (negative control), ZNF410 and ZBTB7A targeting using RNP electroporation of 3X-NLS-Cas9 and sgRNA. Left panel, editing efficiency measured by indel frequency in HUDEP-2 cells (n=1) and CHD4 Δ 6.9 kb clones (n=3) targeted with ZNF410 or ZBTB7A sgRNAs. The shaded portion of the bar represents the percentage of indels resulting in frameshift (fs) alleles. The white portion of the bar represents in-frame indels. Right panel, HBG expression relative to total β-like globin (HBG+HBB) in HUDEP-2 cells (n=1) and CHD4 Δ 6.9 kb clones (n=3) targeted with AAVS1 (negative control), ZNF410 or ZBTB7A sgRNAs. (h) HBG expression relative to total β-like globin (HBG+HBB) in CHD4 Δ 6.9 kb clone 3 (n=1) subjected to ZNF410, BCL 11A and ZBTB7A targeting using RNP electroporation of 3xNLS-Cas9 and sgRNA compared to mock (n=1) cells. (i) CBX6 expression in mock, AAVS1 and ZNF410 targeted HUDEP-2 cells (n=2 for mock and control, n=3 for ZNF410 targeted) and CHD4 Δ 6.7 kb HUDEP-2 cells (n=3 for mock, control and ZNF410 targeted). Catalase was used as the endogenous normalization control. CBX6 expression in targeted cells is shown relative to expression in mock cells. Data are mean values, error bars are standard deviation.
Extended Data Figure 6.
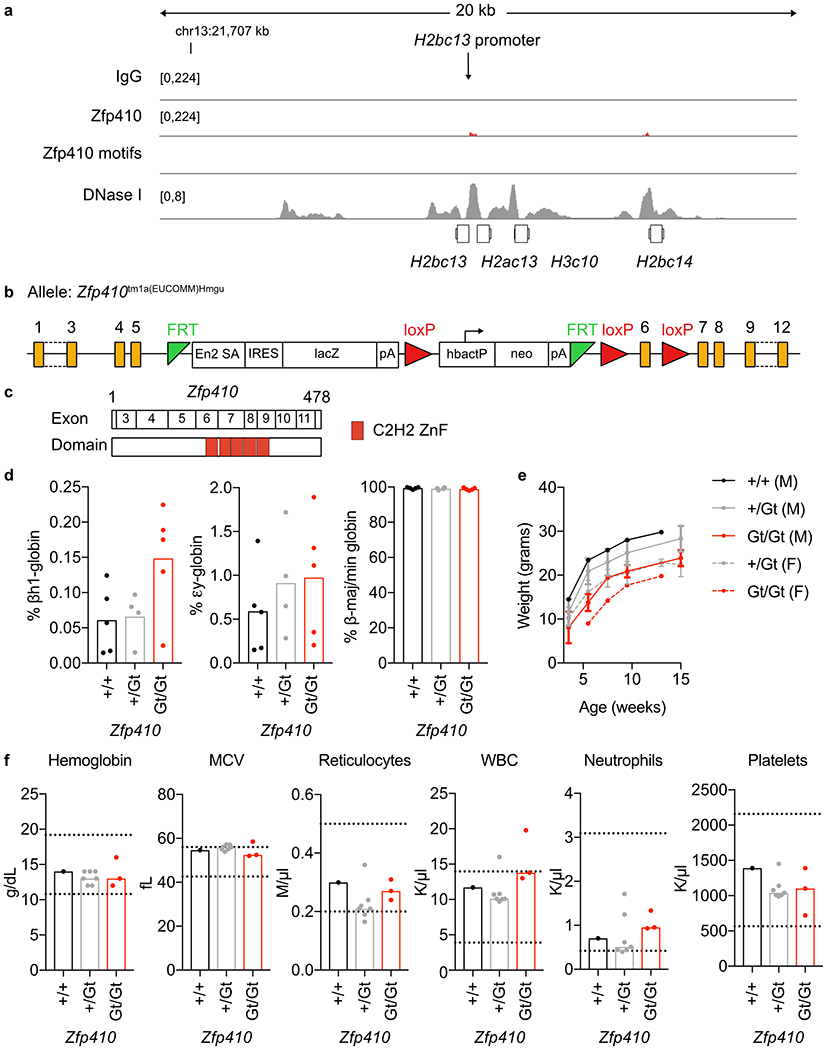
(a) CUT&RUN performed in mouse erythroieukemia (MEL) cells using anti-Zfp410 antibody (n=3) and IgG control (n=3). The third most enriched Zfp410 peak (following Chd4 promoter and Chd4 −6 kb enhancer) was at the Hist1h2bl promoter. No Zfp410 motifs were identified at this locus, which overlaps accessible chromatin (DNase-seq, gray peaks). (b) Diagram of the Zfp410 gene trap allele. A targeting cassette including splice acceptor site upstream of LacZ was inserted into Zfp410 intron 5 thus disrupting full-length expression. Schema obtained along with mouse ES cells from EuMMCR, Germany. (c) Exon and domain structure of mouse Zfp410. (d) Mouse embryonic (βh1 and εy) and adult β-major/minor globin gene expression measured by RT-qPCR in Zfp410 Gt/Gt (n=5) mouse E14.5 fetal liver erythroid cells compared to heterozygous (n=4) and wildtype (n=5) control animals. (e) Weight was measured at indicated time points over the course of 15 weeks for wildtype male (+/+ (M), n=1), Zfp410 heterozygous male (+/Gt (M), n=2), Zfp410 homozygous male (Gt/Gt (M), n=2), Zfp410 heterozygous female (+/Gt (F), n=5) and Zfp410 homozygous female (Gt/Gt (F), n=1) mice. Data are presented as mean values and error bars are standard deviation. (f) Peripheral blood hematological parameters for wildtype (n=1), Zfp410 +/Gt (n=7) and Zfp410 Gt/Gt (n=3) mice, with normal ranges for hemoglobin, mean corpuscular volume (MCV), reticulocyte, white blood cell (WBC), neutrophil and platelet count shown by dotted lines.
Extended Data Figure 7.
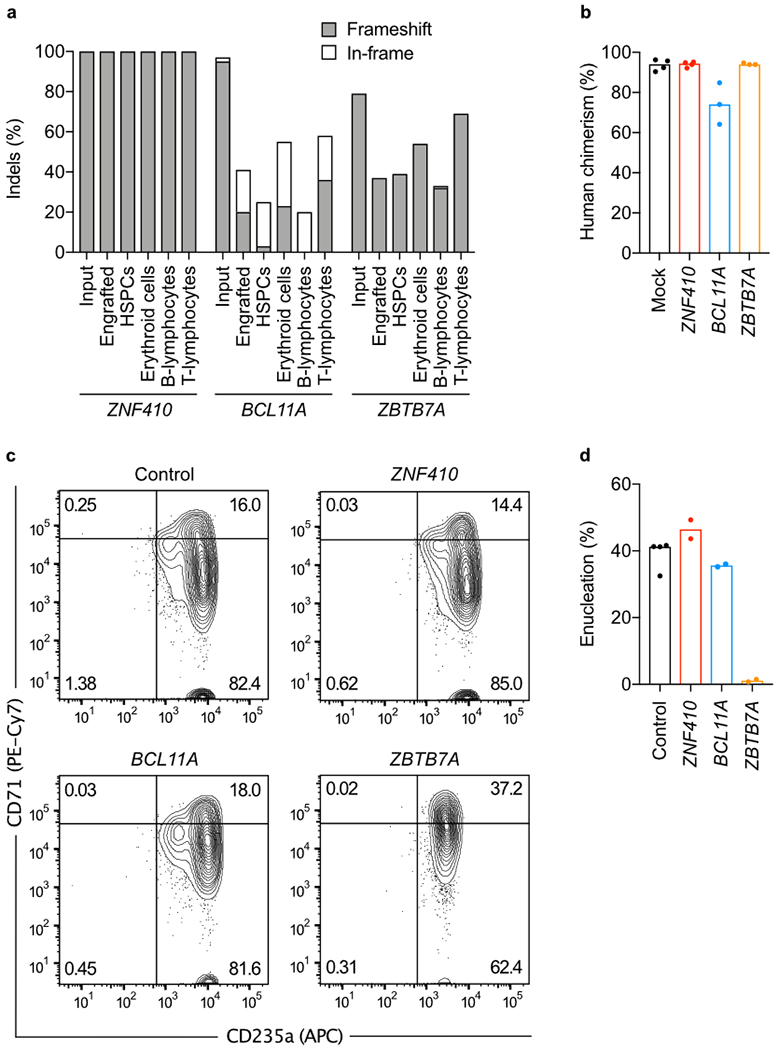
CD34+ HSPCs from donor 3 were edited by RNP electroporation targeting ZNF410, BCL11A or ZBTB7A and infused to NBSGW mice or subject to in vitro erythroid differentiation. (a) Indel frequency at ZNF410, BCL11A and ZBTB7A was quantified in input cells 4 days after electroporation, and in engrafted total or sorted cells at bone marrow (BM) harvest. The percentage of frameshift alleles is represented in gray and the percentage of in-frame alleles is represented in white. (b) Comparison of engraftment assessed by human CD45+ staining compared to total CD45+ cells in xenografts of ZNF410 (n=4), BCL11A (n=3) and ZBTB7A (n=3) edited and mock control (n=4) CD34+ HSPCs. Each symbol represents one mouse. (c, d) Erythroid maturation, evaluated based on CD71 and CD235a immunophenotype and enucleation frequency, was assessed on day 18 of in vitro erythroid culture in safe control (n=4), ZNF410 (n=2), BCL11A (n=2) and ZBTB7A (n=2) targeted primary erythroblasts.
Extended Data Figure 8.

Hierarchy of FACS gates and representative plots for each gate are shown for a representative control (mock) transplanted bone marrow sample. The first gate was plotted to delineate the cell population of interest (POI) and avoid debris. The second and third gates were plotted to exclude doublets. Values in plots are for respective gates.
Supplementary Material
Acknowledgements
We thank Drs. Ryo Kurita and Yukio Nakamura for sharing HUDEP-2 cells (Department of Research and Development, Central Blood Institute, Blood Service Headquarters, Japanese Red Cross Society, Tokyo, Japan and Cell Engineering Division, RIKEN BioResource Research Center, Faculty of Medicine, University of Tsukuba, Ibaraki, Japan); Dr. Ronald Mathieu and the HSCI-BCH Flow Cytometry Facility, supported by the Harvard Stem Cell Institute and the NIH (U54DK110805) for assistance with flow cytometry; Dr. Zachary Herbert from the Molecular Biology Core Facilities at Dana-Farber Cancer Institute for assistance with sequencing; Dr. Yuko Fujiwara and Minh Nguyen from the BCH Mouse Embryonic Stem Cell and Gene Targeting Core (supported by the NIH/NIDDK Center of Excellence in Molecular Hematology U54DK110805) for assistance with transgenic mouse generation; Dr. John Doench for assistance with CRISPR screening; Dr. Steven Henikoff for sharing pA-MNase for CUT&RUN experiments; Jasmine Bonanno for technical assistance; and Drs. Stuart Orkin, Christian Brendel, Nan Liu, Davide Seruggia, Neekesh Dharia, and members of the Bauer laboratory for helpful discussions. D.S.V. was supported by the Cooley’s Anemia Foundation Research Fellowship award; L.P. was supported by NHGRI (R00HG008399 and R35HG010717); D.E.B. was supported in part by a Sponsored Research Agreement from Sanofi, NHLBI (DP2HL137300 and P01HL032262), and the Burroughs Wellcome Fund.
Footnotes
Competing interests statement
D.E.B. and D.S.V. are co-inventors on a patent related to ZNF410 disruption. The authors declare no other competing interests.
Code availability
The scripts used for analysis of CUT&RUN experiments and motif mapping have been provided in Supplementary Methods. The motif counting script is available at https://github.com/yao-qiuming/Vinjamur_NG2021.
Data availability
The datasets generated during the current study are available from the indicated repositories where applicable or are included in this article.
-
Datasets generated during the current study:
RNA sequencing of HUDEP-2 cells and CHD4 Δ 6.7 kb HUDEP-2 cells edited at ZNF410 have been deposited in NCBI’s Gene Expression Omnibus (GEO) and are accessible through GEO Series accession number GSE166222 (https://www.ncbi.nlm.nih.gov/geo/query/acc.cgi?acc=GSE166222)
CUT&RUN data for genomic ZNF410 chromatin occupancy are accessible through GEO Series accession number GSE166221 (https://www.ncbi.nlm.nih.gov/geo/query/acc.cgi?acc=GSE166221)
ATAC-seq data for HUDEP-2 cells are accessible through GEO Series accession number GSE167298
-
Publicly available datasets referenced in this manuscript:
Erythroid expression profiling datasets: GSE53983, GSE54602, GSE22552, E-MTAB-1035.
RNA sequencing of HUDEP-2 cells edited at CHD4 is available from NCBI SRA portal under accession No. PRJNA496556, https://www.ncbi.nlm.nih.gov/sra
ZNF410 and CHD4 expression values (TPM) across 54 human tissues were obtained from the GTEx Portal (https://gtexportal.org/home/)
Gene dependency scores for 558 cell lines were obtained from the Achilles Avana 20Q2 Public CERES dataset of the Depmap portal (DepMap, Broad (2020): DepMap 20Q2 Public. figshare. Dataset. https://doi.org/10.6084/m9.figshare.12280541.v4
MEL DNase sequencing: ENCODE project dataset: ENCSR000CNN, file: ENCFF990ATO
References
- 1.Orkin SH & Bauer DE Emerging Genetic Therapy for Sickle Cell Disease. Annu. Rev. Med 70, 257–271 (2019). [DOI] [PubMed] [Google Scholar]
- 2.Piel FB, Steinberg MH & Rees DC Sickle Cell Disease. The New England journal of medicine vol. 377 305 (2017). [DOI] [PubMed] [Google Scholar]
- 3.Weatherall DJ The Evolving Spectrum of the Epidemiology of Thalassemia. Hematol. Oncol. Clin. North Am 32, 165–175 (2018). [DOI] [PubMed] [Google Scholar]
- 4.Sankaran VG et al. Human Fetal Hemoglobin Expression Is Regulated by the Developmental Stage-Specific Repressor BCL11A. Science 322, 1839–1842 (2008). [DOI] [PubMed] [Google Scholar]
- 5.Masuda T et al. Transcription factors LRF and BCL11A independently repress expression of fetal hemoglobin. Science 351, 285–289 (2016). [DOI] [PMC free article] [PubMed] [Google Scholar]
- 6.Sher F et al. Rational targeting of a NuRD subcomplex guided by comprehensive in situ mutagenesis. Nat. Genet 51, 1149–1159 (2019). [DOI] [PMC free article] [PubMed] [Google Scholar]
- 7.Amaya M et al. Mi2β-mediated silencing of the fetal γ-globin gene in adult erythroid cells. Blood 121, 3493–3501 (2013). [DOI] [PMC free article] [PubMed] [Google Scholar]
- 8.Martyn GE et al. Natural regulatory mutations elevate fetal globin via disruption of BCL11A or ZBTB7A binding. Nat. Genet 50, 498–503 (2018). [DOI] [PubMed] [Google Scholar]
- 9.Liu N et al. Direct Promoter Repression by BCL11A Controls the Fetal to Adult Hemoglobin Switch. Cell 173, 430–442.e17 (2018). [DOI] [PMC free article] [PubMed] [Google Scholar]
- 10.Xu J et al. Corepressor-dependent silencing of fetal hemoglobin expression by BCL11A. Proceedings of the National Academy of Sciences 110, 6518–6523 (2013). [DOI] [PMC free article] [PubMed] [Google Scholar]
- 11.Maeda T et al. LRF Is an Essential Downstream Target of GATA1 in Erythroid Development and Regulates BIM-Dependent Apoptosis. Dev. Cell 17, 527–540 (2009). [DOI] [PMC free article] [PubMed] [Google Scholar]
- 12.An X et al. Global transcriptome analyses of human and murine terminal erythroid differentiation. Blood 123, 3466–3478 (2014). [DOI] [PMC free article] [PubMed] [Google Scholar]
- 13.Shi L et al. Developmental transcriptome analysis of human erythropoiesis. Hum. Mol. Genet 23, 4528–4542 (2014). [DOI] [PMC free article] [PubMed] [Google Scholar]
- 14.Merryweather-Clarke AT et al. Global gene expression analysis of human erythroid progenitors. Blood 117, e96–108 (2011). [DOI] [PubMed] [Google Scholar]
- 15.Kingsley PD et al. Ontogeny of erythroid gene expression. Blood 121, e5–e13 (2013). [DOI] [PMC free article] [PubMed] [Google Scholar]
- 16.Gautier E-F et al. Comprehensive Proteomic Analysis of Human Erythropoiesis. Cell Rep 16, 1470–1484 (2016). [DOI] [PMC free article] [PubMed] [Google Scholar]
- 17.Benanti JA, Williams DK, Robinson KL, Ozer HL & Galloway DA Induction of extracellular matrix-remodeling genes by the senescence-associated protein APA-1. Mol. Cell. Biol 22, 7385–7397 (2002). [DOI] [PMC free article] [PubMed] [Google Scholar]
- 18.Skene PJ, Henikoff JG & Henikoff S Targeted in situ genome-wide profiling with high efficiency for low cell numbers. Nat. Protoc 13, 1006–1019 (2018). [DOI] [PubMed] [Google Scholar]
- 19.Jolma A et al. DNA-binding specificities of human transcription factors. Cell 152, 327–339 (2013). [DOI] [PubMed] [Google Scholar]
- 20.GTEx Consortium. The Genotype-Tissue Expression (GTEx) project. Nat. Genet 45, 580–585 (2013). [DOI] [PMC free article] [PubMed] [Google Scholar]
- 21.Meyers RM et al. Computational correction of copy number effect improves specificity of CRISPR-Cas9 essentiality screens in cancer cells. Nat. Genet 49, 1779–1784 (2017). [DOI] [PMC free article] [PubMed] [Google Scholar]
- 22.Dempster JM et al. Extracting Biological Insights from the Project Achilles Genome-Scale CRISPR Screens in Cancer Cell Lines. 720243 (2019) doi: 10.1101/720243. [DOI] [Google Scholar]
- 23.Low JKK et al. The Nucleosome Remodeling and Deacetylase Complex Has an Asymmetric, Dynamic, and Modular Architecture. Cell Rep 33, 108450 (2020). [DOI] [PMC free article] [PubMed] [Google Scholar]
- 24.Porcu S et al. The human beta globin locus introduced by YAC transfer exhibits a specific and reproducible pattern of developmental regulation in transgenic mice. Blood 90, 4602–4609 (1997). [PubMed] [Google Scholar]
- 25.Gaensler KM, Kitamura M & Kan YW Germ-line transmission and developmental regulation of a 150-kb yeast artificial chromosome containing the human beta-globin locus in transgenic mice. Proc. Natl. Acad. Sci. U. S. A 90, 11381–11385 (1993). [DOI] [PMC free article] [PubMed] [Google Scholar]
- 26.Liu P et al. Bcl11a is essential for normal lymphoid development. Nat. Immunol 4, 525–532 (2003). [DOI] [PubMed] [Google Scholar]
- 27.O’Shaughnessy-Kirwan A, Signolet J, Costello I, Gharbi S & Hendrich B Constraint of gene expression by the chromatin remodelling protein CHD4 facilitates lineage specification. Development 142, 2586–2597 (2015). [DOI] [PMC free article] [PubMed] [Google Scholar]
- 28.McIntosh BE et al. Nonirradiated NOD,B6.SCID Il2rgamma−/− kitW41/W41 (NBSGW) mice support multilineage engraftment of human hematopoietic cells. Stem Cell Reports 4, 171–180 (2015). [DOI] [PMC free article] [PubMed] [Google Scholar]
- 29.Wu Y et al. Highly efficient therapeutic gene editing of human hematopoietic stem cells. Nature Medicine vol. 25 776–783 (2019). [DOI] [PMC free article] [PubMed] [Google Scholar]
- 30.John CC et al. Hydroxyurea Dose Escalation for Sickle Cell Anemia in Sub-Saharan Africa. N. Engl. J. Med 382, 2524–2533 (2020). [DOI] [PubMed] [Google Scholar]
- 31.Ippolito GC et al. Dendritic cell fate is determined by BCL11A. Proc. Natl. Acad. Sci. U. S. A 111, E998–1006 (2014). [DOI] [PMC free article] [PubMed] [Google Scholar]
- 32.Tsang JC et al. Single-cell transcriptomic reconstruction reveals cell cycle and multilineage differentiation defects in Bcl11a-deficient hematopoietic stem cells. Genome Biol. 16, 178 (2015). [DOI] [PMC free article] [PubMed] [Google Scholar]
- 33.Luc S et al. Bcl11a Deficiency Leads to Hematopoietic Stem Cell Defects with an Aging-like Phenotype. Cell Rep. 16, 3181–3194 (2016). [DOI] [PMC free article] [PubMed] [Google Scholar]
- 34.Khaled WT et al. BCL11A is a triple-negative breast cancer gene with critical functions in stem and progenitor cells. Nat. Commun 6, 1–10 (2015). [DOI] [PMC free article] [PubMed] [Google Scholar]
- 35.Benitez CM et al. An Integrated Cell Purification and Genomics Strategy Reveals Multiple Regulators of Pancreas Development. PLoS Genet. 10, (2014). [DOI] [PMC free article] [PubMed] [Google Scholar]
- 36.Maeda T Regulation of hematopoietic development by ZBTB transcription factors. Int. J. Hematol 104, 310–323 (2016). [DOI] [PMC free article] [PubMed] [Google Scholar]
- 37.Yu X et al. Disruption of the MBD2-NuRD complex but not MBD3-NuRD induces high level HbF expression in human erythroid cells. Haematologica 104, haematol.2018.210963 (2019). [DOI] [PMC free article] [PubMed] [Google Scholar]
- 38.Steinberg MH Fetal hemoglobin in sickle cell anemia. Blood 136, 2392–2400 (2020). [DOI] [PMC free article] [PubMed] [Google Scholar]
- 39.Vinjamur DS, Bauer DE & Orkin SH Recent progress in understanding and manipulating haemoglobin switching for the haemoglobinopathies. British Journal of Haematology vol. 180 630–643 (2018). [DOI] [PubMed] [Google Scholar]
- 40.Lan X et al. ZNF410 Uniquely Activates the NuRD Component CHD4 to Silence Fetal Hemoglobin Expression. Mol. Cell 81, 239–254.e8 (2021). [DOI] [PMC free article] [PubMed] [Google Scholar]
- 41.Krönke J et al. Lenalidomide causes selective degradation of IKZF1 and IKZF3 in multiple myeloma cells. Science 343, 301–305 (2014). [DOI] [PMC free article] [PubMed] [Google Scholar]
- 42.Lu G et al. The myeloma drug lenalidomide promotes the cereblon-dependent destruction of Ikaros proteins. Science 343, 305–309 (2014). [DOI] [PMC free article] [PubMed] [Google Scholar]
- 43.Lu B et al. A Transcription Factor Addiction in Leukemia Imposed by the MLL Promoter Sequence. Cancer Cell 34, 970–981.e8 (2018). [DOI] [PMC free article] [PubMed] [Google Scholar]
- 44.Gillespie MA et al. Absolute Quantification of Transcription Factors Reveals Principles of Gene Regulation in Erythropoiesis. Mol. Cell 78, 960–974.e11 (2020). [DOI] [PMC free article] [PubMed] [Google Scholar]
- 45.Jones WD et al. De novo mutations in MLL cause Wiedemann-Steiner syndrome. Am. J. Hum. Genet 91, 358–364 (2012). [DOI] [PMC free article] [PubMed] [Google Scholar]
- 46.Sifrim A et al. Distinct genetic architectures for syndromic and nonsyndromic congenital heart defects identified by exome sequencing. Nat. Genet 48, 1060–1065 (2016). [DOI] [PMC free article] [PubMed] [Google Scholar]
- 47.Weiss K et al. De Novo Mutations in CHD4, an ATP-Dependent Chromatin Remodeler Gene, Cause an Intellectual Disability Syndrome with Distinctive Dysmorphisms. Am. J. Hum. Genet 99, 934–941 (2016). [DOI] [PMC free article] [PubMed] [Google Scholar]
- 48.Layat E, Probst AV & Tourmente S Structure, function and regulation of Transcription Factor IIIA: From Xenopus to Arabidopsis. Biochim. Biophys. Acta 1829, 274–282 (2013). [DOI] [PubMed] [Google Scholar]
- 49.Lambert SA et al. The Human Transcription Factors. Cell 172, 650–665 (2018). [DOI] [PMC free article] [PubMed] [Google Scholar]
- 50.Ezer D, Zabet NR & Adryan B Homotypic clusters of transcription factor binding sites: A model system for understanding the physical mechanics of gene expression. Comput. Struct. Biotechnol. J 10, 63–69 (2014). [DOI] [PMC free article] [PubMed] [Google Scholar]
References for Methods
- 51.Kurita R et al. Establishment of Immortalized Human Erythroid Progenitor Cell Lines Able to Produce Enucleated Red Blood Cells. PLoS One 8, (2013). [DOI] [PMC free article] [PubMed] [Google Scholar]
- 52.Vinjamur DS & Bauer DE Growing and Genetically Manipulating Human Umbilical Cord Blood-Derived Erythroid Progenitor (HUDEP) Cell Lines. Methods Mol. Biol 1698, 275–284 (2018). [DOI] [PubMed] [Google Scholar]
- 53.Giarratana MCC et al. Proof of principle for transfusion of in vitro-generated red blood cells. Blood 118, 5071–5079 (2011). [DOI] [PMC free article] [PubMed] [Google Scholar]
- 54.Shalem O et al. Genome-scale CRISPR-Cas9 knockout screening in human cells. Science 343, 84–87 (2014). [DOI] [PMC free article] [PubMed] [Google Scholar]
- 55.Sanjana NE, Shalem O & Zhang F Improved vectors and genome-wide libraries for CRISPR screening. Nat. Methods 11, 783–784 (2014). [DOI] [PMC free article] [PubMed] [Google Scholar]
- 56.Doench JG et al. Optimized sgRNA design to maximize activity and minimize off-target effects of CRISPR-Cas9. Nat. Biotechnol 34, 1–12 (2016). [DOI] [PMC free article] [PubMed] [Google Scholar]
- 57.Li W et al. MAGeCK enables robust identification of essential genes from genome-scale CRISPR/Cas9 knockout screens. Genome Biol. 15, 554 (2014). [DOI] [PMC free article] [PubMed] [Google Scholar]
- 58.Morgens DW et al. Genome-scale measurement of off-target activity using Cas9 toxicity in high-throughput screens. Nat. Commun 8, 15178 (2017). [DOI] [PMC free article] [PubMed] [Google Scholar]
- 59.Canver MC et al. BCL11A enhancer dissection by Cas9-mediated in situ saturating mutagenesis. Nature 527, 192–197 (2015). [DOI] [PMC free article] [PubMed] [Google Scholar]
- 60.Schoonenberg VAC et al. CRISPRO: Identification of functional protein coding sequences based on genome editing dense mutagenesis. Genome Biol. 19, 1–19 (2018). [DOI] [PMC free article] [PubMed] [Google Scholar]
- 61.Bolger AM, Lohse M & Usadel B Trimmomatic: a flexible trimmer for Illumina sequence data. Bioinformatics 30, 2114–2120 (2014). [DOI] [PMC free article] [PubMed] [Google Scholar]
- 62.Langmead B & Salzberg SL Fast gapped-read alignment with Bowtie 2. Nat. Methods 9, 357–359 (2012). [DOI] [PMC free article] [PubMed] [Google Scholar]
- 63.Li H et al. The Sequence Alignment/Map format and SAMtools. Bioinformatics 25, 2078–2079 (2009). [DOI] [PMC free article] [PubMed] [Google Scholar]
- 64.Zhang Y et al. Model-based analysis of ChIP-Seq (MACS). Genome Biol 9, R137 (2008). [DOI] [PMC free article] [PubMed] [Google Scholar]
- 65.Amemiya HM, Kundaje A & Boyle AP The ENCODE Blacklist: Identification of Problematic Regions of the Genome. Sci. Rep 9, 9354 (2019). [DOI] [PMC free article] [PubMed] [Google Scholar]
- 66.Quinlan AR & Hall IM BEDTools: a flexible suite of utilities for comparing genomic features. Bioinformatics 26, 841–842 (2010). [DOI] [PMC free article] [PubMed] [Google Scholar]
- 67.Robinson JT et al. Integrative genomics viewer. Nat. Biotechnol 29, 24–26 (2011). [DOI] [PMC free article] [PubMed] [Google Scholar]
- 68.Corces MR et al. An improved ATAC-seq protocol reduces background and enables interrogation of frozen tissues. Nat. Methods 14, 959–962 (2017). [DOI] [PMC free article] [PubMed] [Google Scholar]
- 69.ENCODE Project Consortium. An integrated encyclopedia of DNA elements in the human genome. Nature 489, 57–74 (2012). [DOI] [PMC free article] [PubMed] [Google Scholar]
- 70.Davis CA et al. The Encyclopedia of DNA elements (ENCODE): data portal update. Nucleic Acids Res. 46, D794–D801 (2018). [DOI] [PMC free article] [PubMed] [Google Scholar]
- 71.Garber M et al. Identifying novel constrained elements by exploiting biased substitution patterns. Bioinformatics 25, i54–62 (2009). [DOI] [PMC free article] [PubMed] [Google Scholar]
- 72.Subramanian A et al. Gene set enrichment analysis: a knowledge-based approach for interpreting genome-wide expression profiles. Proc. Natl. Acad. Sci. U. S. A 102, 15545–15550 (2005). [DOI] [PMC free article] [PubMed] [Google Scholar]
- 73.Mootha VK et al. PGC-1alpha-responsive genes involved in oxidative phosphorylation are coordinately downregulated in human diabetes. Nat. Genet 34, 267–273 (2003). [DOI] [PubMed] [Google Scholar]
Associated Data
This section collects any data citations, data availability statements, or supplementary materials included in this article.
Supplementary Materials
Data Availability Statement
The datasets generated during the current study are available from the indicated repositories where applicable or are included in this article.
-
Datasets generated during the current study:
RNA sequencing of HUDEP-2 cells and CHD4 Δ 6.7 kb HUDEP-2 cells edited at ZNF410 have been deposited in NCBI’s Gene Expression Omnibus (GEO) and are accessible through GEO Series accession number GSE166222 (https://www.ncbi.nlm.nih.gov/geo/query/acc.cgi?acc=GSE166222)
CUT&RUN data for genomic ZNF410 chromatin occupancy are accessible through GEO Series accession number GSE166221 (https://www.ncbi.nlm.nih.gov/geo/query/acc.cgi?acc=GSE166221)
ATAC-seq data for HUDEP-2 cells are accessible through GEO Series accession number GSE167298
-
Publicly available datasets referenced in this manuscript:
Erythroid expression profiling datasets: GSE53983, GSE54602, GSE22552, E-MTAB-1035.
RNA sequencing of HUDEP-2 cells edited at CHD4 is available from NCBI SRA portal under accession No. PRJNA496556, https://www.ncbi.nlm.nih.gov/sra
ZNF410 and CHD4 expression values (TPM) across 54 human tissues were obtained from the GTEx Portal (https://gtexportal.org/home/)
Gene dependency scores for 558 cell lines were obtained from the Achilles Avana 20Q2 Public CERES dataset of the Depmap portal (DepMap, Broad (2020): DepMap 20Q2 Public. figshare. Dataset. https://doi.org/10.6084/m9.figshare.12280541.v4
MEL DNase sequencing: ENCODE project dataset: ENCSR000CNN, file: ENCFF990ATO