Abstract
Background and aim:
While the entire world is still experiencing the dramatic emergency due to SARS-CoV-2, Italy has a prominent position since it has been the locus of the first major outbreak among Western countries. The aim of this study is the evaluation of temporal connection between SARS-CoV-2 positive tests (cases) and deaths in Italy in the first wave of the epidemic.
Methods:
A temporal link between cases and deaths was determined by comparing their daily/weekly trends using surveillance data of the period March 2–June 2020.
Results:
The monitoring of the cases/deaths evolution during the first wave of the outbreak highlights a striking correlation between infections of a certain week and deaths of the following one. We defined a weekly lethality rate that is virtually unchanged over the entire months of April and May until the first week of June (≈13.6%). Due to the rather low number of cases/deaths, this parameter starts to fluctuate in the following three weeks.
Conclusions:
The analysis indicates that the weekly lethality rate is virtually unchanged over the entire first wave of the epidemic, despite the progressive increase of the testing. As observed for the overall lethality, this parameter uniformly presents rather high values. The definition of a temporal link between cases and deaths will likely represent a useful tool for highlighting analogies and differences between the first and the second wave of the pandemic and for evaluating the effectiveness, even if partial, of the strategies applied during the ongoing outbreak. (www.actabiomedica.it)
Keywords: COVID-19, Italy, lethality rate, mortality burden, SARS-CoV-2, weekly lethality rate
Introduction
After the detection of the first case of severe acute respiratory syndrome coronavirus 2 (SARS-CoV-2) in China in December 2019, the spread of the novel coronavirus disease 2019 (COVID-2019) has posed an enormous challenge to the entire world, involving more than 200 countries with over 27 million infected individuals and 1.7 million deaths in one year (1,2).
Italy was the first European country that experienced the dramatic consequences of a rapid COVID-19 diffusion, with hospital overload, high shortage of healthcare resources and professionals, as well as a massive death toll (3–5). Here, a total of 240,331 cases (confirmed infections) and 34,892 deaths from pneumonia were registered as of June 28th, 2020, identifiable as the end of the first wave of the Italian outbreak (6). The integrated surveillance data of the Italian National Institute of Health (Istituto Superiore di Sanità [ISS]) indicated that subjects who tested positive were on average 58 years old, while patients who died of COVID-19 had a median age of 82 years, being mainly men with pre-existing comorbidities (7,8).
As for other novel emerging infectious diseases, one of the most relevant epidemiologic measure to be determined is the proportion of cases who eventually die from the disease (9). During the pandemic months, several attempts to quantify the case fatality ratio (CFR) of SARS-CoV-2 have been proposed, but were considerably weakened by intrinsic barriers. First, the demographic characteristics of the population from one country to another pose important challenges in drawing firm conclusions. Second, general consensus is growing in support of the hypothesis that the CFR variability was likely attributable to the underestimated number of people who are infected with SARS-CoV-2 – mostly asymptomatic and pauci-symptomatic individuals (9,10). Specific literature underlined that CFR estimations of COVID-19 according to either the calendar date or the days since the first confirmed case may be affected from wide variation (11,12). Thus, several outstanding methodological issues prevent from providing reliable death estimates from the perspective of longitudinal time-series analysis of COVID-19 lethality, also due to the static nature of the traditional cumulative CFR in describing the extent of a dynamic event (11).
It is commonly recognized that the CFR cannot be evaluated using the number of deaths per number of confirmed cases at the same time because this approach does not take into account the clinical course of the disease (11). In this respect, there is a broad range of estimates for the median time delay from illness onset to death (8,13,14), likely due to disparities in country-based demographics, healthcare access, and treatment options. Additionally, at least in Italy, the adoption of a daily CFR could be biased by the weekday-dependent number of daily laboratory tests, by the way data are transmitted from the local health agencies to the national surveillance system, and by the delay of death notification, which all lead to a marked variation of that value.
Based on these considerations and with the aim of proposing a metric of the magnitude and kinetics of the lethality associated with SARS-CoV-2 that could be also used as a valuable proxy indicator of the COVID-19 control measures and actions, we conducted a population-based retrospective analysis of COVID-19 mortality data in Italy by identifying a temporal link between the number of cases and the number of deceased people taken from epidemiological surveillance data of the first wave of the pandemic.
Materials and Methods
Study Design and Data Source
We carried out a longitudinal retrospective time-series study on the lethality associated with SARS-CoV-2 in Italy, using data collected in the national COVID-19 integrated surveillance system (6). Here, we gathered the daily number of laboratory tests, confirmed cases, and deceased related to SARS-CoV-2 (Supplementary Materials, Table S1). We traced data over 18 weeks (denoted as W0, W1, ..., W17) covering the period from February 24th (the first documented autochthonous infection and the first death date back to February 20th and 21st, respectively) to June 28th (Supplementary Materials, Table S2) that essentially corresponds to the first wave of the epidemic in Italy. Since data became complete and reliable only after some days from the beginning of the outbreak, the analysis was carried out starting from W1 (March 2nd-8th).
Statistical Analysis
Numbers of cases, deaths, and tests (swabs) were grouped in a week-based manner (Supplementary Materials, Table S3). The average daily values of cases and deaths were obtained by dividing the total weekly number by seven. The WLRs for the examined 16 weeks (from W2 to W17) were computed by dividing the average daily number of deaths of a given week (Wi) by the average daily number of cases of the previous week (Wi-1).
To gain further insights into the progression of the pandemic during the first wave, we conducted a post-hoc sensitivity analysis, which can be described as follows: (i) it was observed that the time-trends of the curves were similar and shifted with respect to each other; (ii) the two datasets were normalized to the maximum of each ensemble (Supplementary Materials, Table S3); (iii) the curve of normalized cases was systematically shifted by one day at a time, and the sum of squared residuals (SSR) between the overlaid cases/deaths curves was calculated. The same analysis was performed by evaluating the weekly averages of cases and deaths, and repeating steps (ii) and (iii), where the curve of cases was shifted by one week at a time.
The temporal shift between cases and deaths identified with this approach prompted us calculate the Weekly Lethality Rate (WLR) defined as the ratio between the average number of deaths of a certain week and the average number of cases of the previous one. 95% confidence intervals (95% CI) were calculated according to a Poisson approximation (15).
Data were analyzed with MATLAB R2014b and R statistical software v. 4.0.0 (16,17); results presented in terms of percentage with 95% CIs, and mean and standard deviation (SD).
Results
Comparative analysis of the evolution of cases and deaths
Overall, the whole population of 240,331 cases and 34,892 deaths reported by the Italian surveillance system as of June 28th was considered in the analysis. The curve of cases peaked (6557) on March 21st, while the highest daily number of deaths (919) was reached on March 27th. Fig. 1 displays the daily trends of cases and deaths, along with the lockdown beginning (March 9th) and end (May 18th).
Figure 1.
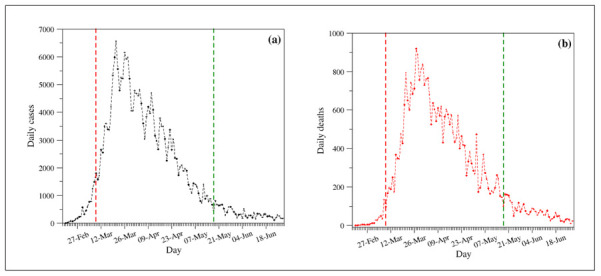
Daily evolutions of (a) cases and (b) deaths. The vertical dashed lines identify the lockdown period (March 9th – May 18th).
Since the visual inspection of the curves suggested a similar temporal evolution of cases and deaths, we systematically shifted the curve of normalized cases with respect to that of the normalized deaths; the best fitting was achieved by applying a six-day shift, which was reached through the evaluation of the SSR between the two curves after each shift (Fig. 2A).
Figure 2.
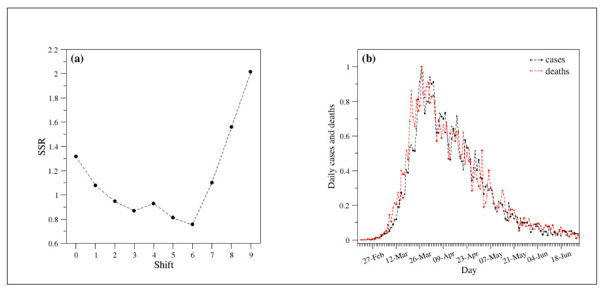
(a) Sum of squared residuals (SSR) as a function of shift. (b) Comparison of the evolution of the number of cases (black) and deaths (red) upon normalization of the curves. The normalization was performed by dividing the actual values by the maximum of each ensemble. The curve of cases is six-day shifted ahead.
In particular, as shown in Fig. 2B, the application of this shift produces a very good overlap between the two curves. The same analysis carried out on normalized weekly-averaged data indicated that the optimal fitting is obtained by a one-week shift, with a fairly good matching over the initial weeks and an excellent overlap in the regions beyond the peak (Fig. 3).
Figure 3.
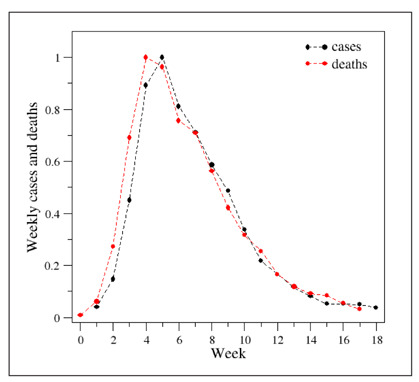
Comparison of the evolution of the weekly cases (black) and deaths (red) upon normalization of the curves. The normalization was performed by dividing the actual values by the maximum of each ensemble. The curve of cases is one-week shifted ahead.
Weekly lethality rate
The inspection of the WLR (see the Methods section for the definition) evolution during the first wave of the pandemic (Fig. 4 and Table 1) indicates that this parameter assumes rather high values (range 15-25%) in the first weeks (W2-W4), likely dictated by a marked underestimation of the number of cases in the same period. In W5-W13, the WLR was almost constant with an average value of 13.6% (± 1.2 SD). The parameter starts to fluctuate in the following four weeks while retaining a rather high average value (15.2% ± 5.6 SD).
Figure 4.
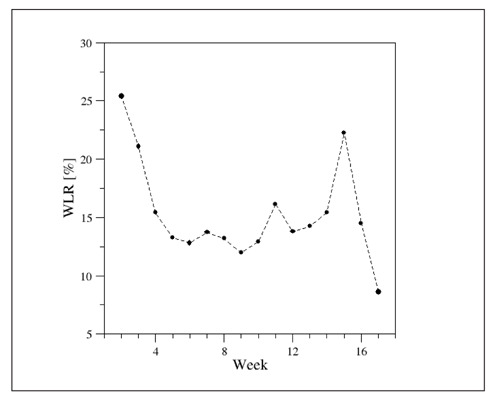
Weekly lethality rate (WLR) evolution in the first wave of the pandemic.
Table 1.
Weekly lethality rate (WLR) values with 95% confidence intervals (95% CIs).
| Week | WLR (95% CIs) |
| W2 | 25.43 (22.05 - 29.12) |
| W3 | 21.11 (19.34 - 23.00) |
| W4 | 15.42 (14.35 - 16.57) |
| W5 | 13.27 (12.33 - 14.27) |
| W6 | 12.83 (11.80 - 13.93) |
| W7 | 13.72 (12.58 - 14.92) |
| W8 | 13.20 (11.97 - 14.50) |
| W9 | 11.98 (10.70 - 13.36) |
| W10 | 12.92 (11.31 - 14.64) |
| W11 | 16.14 (13.98 - 18.63) |
| W12 | 13.78 (11.45 - 16.38) |
| W13 | 14.24 (11.45 - 17.50) |
| W14 | 15.42 (11.98 - 19.49) |
| W15 | 22.26 (17.23 - 28.58) |
| W16 | 14.51 (10.32 - 19.52) |
| W17 | 8.63 (5.63 - 13.08) |
Discussion
This real-world observational study, based upon the complete epidemiological data of the COVID-19 spread in Italy, allowed straightforwardly evaluating the time evolution of the lethality during the first wave of outbreak, and offered further insights into the SARS-CoV-2 diffusion in the country.
The extremely high WLR values registered in the first three weeks (W2-W4) were most likely affected by a considerable underestimation of the cases in that phase of the infection, when healthcare systems were caught off guard during the rapid diffusion of the virus, and only a selected proportion of individuals underwent COVID-19 testing (3,10). As an overwhelming evidence of this consideration, in the initial weeks a large portion of the swabs resulted positive, with a 25.8% peak at W3, while dropping to less than 1% in the following weeks (Supplementary Materials Table S4, Fig. S1). During the entire months of April and May (W5-W13), the WLR remained almost constant, with a mean value of 13.6% and marginal fluctuations. In this respect, it is important to acknowledge that we based our approach on numbers of cases and deaths, being the first influenced by the number of weekly swabs (Supplementary Materials, Fig. S3); therefore, these differences in testing likely explain the higher precision of WLRs related to the central period (W5-W13), which showed narrower confidence intervals.
Overall, the high lethality values were probably induced by (i) the higher median age of the positive patients (10,18) compared with that registered in other countries (2), (ii) the hospital overload, and (iii) the inadequate number of intensive care units (ICU), which admitted more than 4,000 patients in W5 (Supplementary Materials, Table S1, Fig. S2).
It is worth mentioning that previous analyses conducted on mortality data suggested that the enormous death toll and the excess mortality registered during the March-May period mainly affected that part of population whose health was already compromised in the highly-impacted areas (4,8,10,19). Further research should therefore explore a possible compensatory harvesting effect on overall mortality during the months after the epidemic phase. It must also be observed that the lethality analyses conducted so far do not provide evidence that supports or corroborates the hypothesis of an altered virus potency claimed by some clinicians and researchers starting from May 2020 (20-22), even though decreasing in viral loads have been admitted in the late phases of the first wave (21,23,24).
Towards the end of the wave, a stating decrease of the WLR can be identified. In this respect, analyses of WLR after the completion of the second epidemic wave should explore the whole WLR trend. On the basis of the lethality rates seen worldwide (2) and of the knowledge so far available, several reasons explain the WLR reduction in the weeks right after the period included in this research. First, the lockdown restrictions and control measures, such as social distancing and use of personal protective equipment imposed by the Italian government and local authorities, profoundly limited the virus circulation and led to a decrease of cases (25,26), especially among vulnerable (e.g., older age) subjects, resulting in a lower proportion of deaths. This also contributed to alleviate the overload of hospitals and ICUs, concurrently with the institution of primary-care medical home service dedicated to COVID-19 patients (10,27-29). Second, the increased number of daily tests (Supplementary Materials, Table S1, Fig. S3) gradually improved the capacity of detecting positive cases.
Thus far, our research provided a robust estimate of magnitude and time evolution of COVID-19-related lethality during the first epidemic months in Italy. The first strength of the study is the inclusion of complete data from national surveillance databases within a universal coverage system of the whole Italian population, providing a comprehensive picture of the mortality burden attributable to the disease in Italy. Second, the use of weekly aggregate counts softened the huge variability due to disparities in the number of daily events (numbers of cases, deaths, and swabs), such as the empirically traceable “weekend effect” in the number of performed tests, thus granting accuracy of the estimates. In this regard, the WLR can be considered a reliable attempt for addressing the limitations related to CFR use which have been described in the introduction. Moreover, the WLR-based analysis is straightforward and easily reproducible elsewhere, allowing for comparison between different contexts or time-periods – namely, different outbreak waves and peaks, different countries or different areas of the same country. Lastly, the study of time evolution of the lethality provides a solid measure of the effectiveness of the public health actions implemented in response to epidemic, informing policymakers on future decisions to be applied.
As the SARS-CoV-2 still keeps spreading internationally, public health is committed in the identification of the reliable health measurements of the real extent of its outbreak, upon which to base the most appropriate actions to contain it. The WLR may serve as population-based metrics to lead towards a deepen knowledge of the evolution of COVID-19-related lethality, which is strongly recognized as a good measure of clinical significance of diseases. Our estimate could be also used in active surveillance programs and all other public health initiatives tending to reveal the true disease burden.
On the other hand, it is important to point out the main limitations of the presented study. First, the analysis only focused on cases and deaths classified as related to COVID-19, with possible missing. This may have affected the death statistics on both geography and completeness of reporting, particularly in the first phase of the epidemic and in those areas of the country where emergency preparedness and response were delayed (3). Second, the research included information gathered from public accessible database where data were provided in aggregated form and without any case stratification; thus, it was not possible to evaluate uncertainty sources and adjust results for potential independent predictors of death. However, some factors (for instance, median age of patients, decrease of virus circulation, etc.) have been considered and discussed in the paper.
Despite these limitations, to the best of our knowledge, this is the first research that provides weekly lethality rates associated with SARS-CoV-2 spread, by virtue of an actionable metric that adds important research information on the study of the COVID-19 pandemic. Moreover, the study was based on an accurate methodology and supported with a reliable sensitivity analysis. In fact, the identified shift, which represents the average delay between the swab outcome and the corresponding death, is compatible with the median shift of eleven days between the insurgence of the symptoms and the fatal outcome reported by the Italian National Health Institute – ISS (18). Finally, the definition of a temporal link between cases and deaths will likely represent a useful tool for highlighting analogies and differences between the first and the second wave of the pandemic. In particular, possible variations in the temporal correlations between cases and deaths may provide an idea about the effectiveness, even if partial, of the strategies and of the actions applied during the ongoing second wave of the pandemic.
Conclusions
This study documented the lethality evolution during the first wave of COVID-19 spread in Italy through the introduction of an easily-calculable parameter – referred to as WLR – suited to provide a robust estimate of the proportion of cases who died from the disease. Additionally, it offered a clear overview on the effectiveness of the public health measures and can also be exploited to minimize the disease impact. Finally, the present approach may be useful in unraveling interesting analogies and differences between time-periods and contexts in the pandemic development and in data reporting.
Appendix - Supplementary Materials
Table S1.
Daily cases, deaths, and tests (swabs) collected from the Reports of the Italian National Institute of Health (ISS).
| Date | Daily cases | Daily deaths | Daily tests |
| 20-Feb | 0 | 0 | |
| 21-Feb | 17 | 0 | |
| 22-Feb | 47 | 1 | |
| 23-Feb | 90 | 2 | |
| 24-Feb | 72 | 4 | 4324 |
| 25-Feb | 94 | 4 | 4299 |
| 26-Feb | 147 | 1 | 964 |
| 27-Feb | 185 | 5 | 2427 |
| 28-Feb | 234 | 4 | 3681 |
| 29-Feb | 239 | 8 | 2966 |
| 01-Mar | 573 | 12 | 2466 |
| 02-Mar | 335 | 11 | 2218 |
| 03-Mar | 466 | 27 | 2511 |
| 04-Mar | 587 | 28 | 3981 |
| 05-Mar | 769 | 41 | 2525 |
| 06-Mar | 778 | 49 | 3997 |
| 07-Mar | 1247 | 36 | 5703 |
| 08-Mar | 1492 | 133 | 7875 |
| 09-Mar | 1797 | 97 | 3889 |
| 10-Mar | 1577 | 168 | 6935 |
| 11-Mar | 1713 | 196 | 12393 |
| 12-Mar | 2651 | 189 | 12857 |
| 13-Mar | 2547 | 250 | 11477 |
| 14-Mar | 3497 | 175 | 11682 |
| 15-Mar | 3590 | 368 | 15729 |
| 16-Mar | 3385 | 349 | 13063 |
| 17-Mar | 3374 | 345 | 10695 |
| 18-Mar | 4207 | 475 | 16884 |
| 19-Mar | 5322 | 427 | 17236 |
| 20-Mar | 5986 | 627 | 24109 |
| 21-Mar | 6557 | 793 | 26336 |
| 22-Mar | 5560 | 651 | 25180 |
| 23-Mar | 4790 | 601 | 17066 |
| 24-Mar | 5249 | 743 | 21496 |
| 25-Mar | 5210 | 683 | 27481 |
| 26-Mar | 6153 | 712 | 36615 |
| 27-Mar | 5909 | 919 | 33019 |
| 28-Mar | 5974 | 889 | 35447 |
| 29-Mar | 5217 | 756 | 24504 |
| 30-Mar | 4050 | 812 | 23329 |
| 31-Mar | 4053 | 837 | 29609 |
| 01-Apr | 4782 | 727 | 34455 |
| 02-Apr | 4668 | 760 | 39809 |
| 03-Apr | 4585 | 766 | 38617 |
| 04-Apr | 4805 | 681 | 37375 |
| 05-Apr | 4316 | 525 | 34237 |
| 06-Apr | 3599 | 636 | 30271 |
| 07-Apr | 3039 | 604 | 33713 |
| 08-Apr | 3836 | 542 | 51680 |
| 09-Apr | 4204 | 610 | 46244 |
| 10-Apr | 3951 | 570 | 53495 |
| 11-Apr | 4694 | 619 | 56609 |
| 12-Apr | 4092 | 431 | 46720 |
| 13-Apr | 3153 | 566 | 36717 |
| 14-Apr | 2972 | 602 | 26779 |
| 15-Apr | 2667 | 578 | 43715 |
| 16-Apr | 3786 | 525 | 60999 |
| 17-Apr | 3493 | 575 | 65705 |
| 18-Apr | 3491 | 482 | 61725 |
| 19-Apr | 3047 | 433 | 50708 |
| 20-Apr | 2256 | 454 | 41483 |
| 21-Apr | 2729 | 570 | 52126 |
| 22-Apr | 3370 | 401 | 63101 |
| 23-Apr | 2646 | 464 | 66658 |
| 24-Apr | 3021 | 420 | 62447 |
| 25-Apr | 2357 | 415 | 65387 |
| 26-Apr | 2324 | 260 | 49916 |
| 27-Apr | 1739 | 333 | 32003 |
| 28-Apr | 2019 | 382 | 57272 |
| 29-Apr | 2086 | 323 | 63827 |
| 30-Apr | 1872 | 285 | 68456 |
| 01-May | 1965 | 269 | 74208 |
| 02-May | 1900 | 474 | 55412 |
| 03-May | 1389 | 174 | 44935 |
| 04-May | 1221 | 195 | 37631 |
| 05-May | 1075 | 236 | 55263 |
| 06-May | 1444 | 369 | 64263 |
| 07-May | 1401 | 274 | 70359 |
| 08-May | 1327 | 243 | 63775 |
| 09-May | 1083 | 194 | 69171 |
| 10-May | 802 | 165 | 51678 |
| 11-May | 744 | 179 | 40740 |
| 12-May | 1402 | 172 | 67003 |
| 13-May | 888 | 195 | 61973 |
| 14-May | 992 | 262 | 71876 |
| 15-May | 789 | 242 | 68176 |
| 16-May | 875 | 153 | 69179 |
| 17-May | 675 | 145 | 60101 |
| 18-May | 451 | 99 | 36406 |
| 19-May | 813 | 162 | 63158 |
| 20-May | 665 | 161 | 67195 |
| 21-May | 642 | 156 | 71679 |
| 22-May | 652 | 130 | 75380 |
| 23-May | 669 | 119 | 72410 |
| 24-May | 531 | 50 | 55824 |
| 25-May | 300 | 92 | 35241 |
| 26-May | 397 | 78 | 57674 |
| 27-May | 584 | 117 | 67324 |
| 28-May | 593 | 70 | 75893 |
| 29-May | 516 | 87 | 72135 |
| 30-May | 416 | 111 | 69342 |
| 31-May | 333 | 75 | 54118 |
| 01-Jun | 200 | 60 | 31394 |
| 02-Jun | 319 | 55 | 52159 |
| 03-Jun | 322 | 71 | 37299 |
| 04-Jun | 177 | 88 | 49953 |
| 05-Jun | 519 | 85 | 65028 |
| 06-Jun | 270 | 72 | 72485 |
| 07-Jun | 197 | 53 | 49478 |
| 08-Jun | 280 | 65 | 27112 |
| 09-Jun | 283 | 79 | 55003 |
| 10-Jun | 202 | 71 | 62699 |
| 11-Jun | 380 | 53 | 62472 |
| 12-Jun | 163 | 56 | 70620 |
| 13-Jun | 347 | 78 | 49750 |
| 14-Jun | 337 | 44 | 56527 |
| 15-Jun | 301 | 26 | 28107 |
| 16-Jun | 210 | 34 | 46882 |
| 17-Jun | 329 | 43 | 77701 |
| 18-Jun | 332 | 66 | 58154 |
| 19-Jun | 251 | 47 | 57541 |
| 20-Jun | 264 | 49 | 54722 |
| 21-Jun | 224 | 24 | 40545 |
| 22-Jun | 221 | 23 | 28972 |
| 23-Jun | 113 | 18 | 40485 |
| 24-Jun | 190 | 30 | 53266 |
| 25-Jun | 296 | 34 | 56061 |
| 26-Jun | 255 | 30 | 52768 |
| 27-Jun | 175 | 8 | 61351 |
| 28-Jun | 174 | 22 | 37346 |
Table S2.
Week definition with starting and ending date.
| Week | Starting Date | Ending Date |
| W0 | 24-Feb | 01-Mar |
| W1 | 02-Mar | 08-Mar |
| W2 | 09-Mar | 15-Mar |
| W3 | 16-Mar | 22-Mar |
| W4 | 23-Mar | 29-Mar |
| W5 | 30-Mar | 05-Apr |
| W6 | 06-Apr | 12-Apr |
| W7 | 13-Apr | 19-Apr |
| W8 | 20-Apr | 26-Apr |
| W9 | 27-Apr | 03-May |
| W10 | 04-May | 10-May |
| W11 | 11-May | 17-May |
| W12 | 18-May | 24-May |
| W13 | 25-May | 31-May |
| W14 | 01-Jun | 07-Jun |
| W15 | 08-Jun | 14-Jun |
| W16 | 15-Jun | 21-Jun |
| W17 | 22-Jun | 28-Jun |
Table S3.
Cases and deaths per week. Average daily values were obtained dividing the total weekly number of cases/deaths by seven. The normalization was performed by dividing the actual values by the maximum of each ensemble.
| Week | Average number of cases | Average number of deaths | Normalized number of cases | Normalized number of deaths |
| W0 | 221 | 5 | 0.0401 | 0.0072 |
| W1 | 811 | 46 | 0.1474 | 0.0613 |
| W2 | 2482 | 206 | 0.4512 | 0.2721 |
| W3 | 4913 | 524 | 0.8932 | 0.6915 |
| W4 | 5500 | 758 | 1.0000 | 1.0000 |
| W5 | 4466 | 730 | 0.8119 | 0.9632 |
| W6 | 3916 | 573 | 0.7120 | 0.7566 |
| W7 | 3230 | 537 | 0.5872 | 0.7092 |
| W8 | 2672 | 426 | 0.4858 | 0.5627 |
| W9 | 1853 | 320 | 0.3369 | 0.4224 |
| W10 | 1193 | 239 | 0.2169 | 0.3160 |
| W11 | 909 | 193 | 0.1653 | 0.2542 |
| W12 | 632 | 125 | 0.1149 | 0.1654 |
| W13 | 448 | 90 | 0.0815 | 0.1188 |
| W14 | 286 | 69 | 0.0520 | 0.0913 |
| W15 | 285 | 64 | 0.0517 | 0.0841 |
| W16 | 273 | 41 | 0.0496 | 0.0545 |
| W17 | 203 | 24 | 0.0370 | 0.0311 |
Table S4.
Positive tests over swabs.
| Week | Positive tests over swabs [%] |
| W1 | 19.69 |
| W2 | 23.17 |
| W3 | 25.76 |
| W4 | 19.68 |
| W5 | 13.17 |
| W6 | 8.60 |
| W7 | 6.53 |
| W8 | 4.66 |
| W9 | 3.27 |
| W10 | 2.03 |
| W11 | 1.45 |
| W12 | 1.00 |
| W13 | 0.73 |
| W14 | 0.56 |
| W15 | 0.52 |
| W16 | 0.53 |
| W17 | 0.43 |
Figure S1.
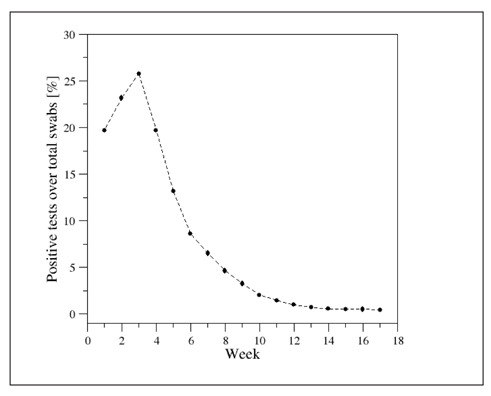
Time evolution of the percentage of weekly positive tests over total swabs.
Figure S2.
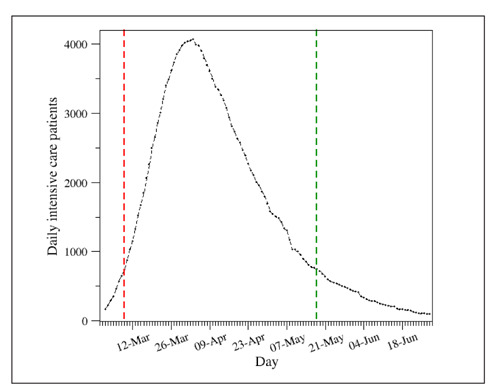
Daily evolution of the number of intensive care patients. The vertical dashed lines identify the lockdown period (March 9th – May 18th).
Figure S3.
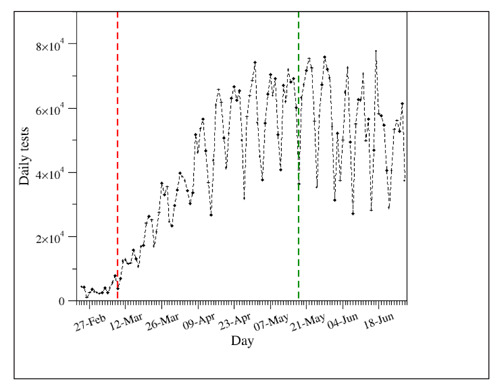
Daily evolution of the number of tests. The vertical dashed lines identify the lockdown period (March 9th – May 18th).
Funding:
This research was funded by Regione Campania project “RicErCa e sviluppO VERsus COVID19 in Campania RECOVER-COVID19” (POR FESR CAMPANIA 2014-2020 - Asse III Obiettivo Specifico 1.3 - Azione 1.3.1).
Conflicts of Interest:
The authors declare no conflict of interest. The funders had no role in the design of the study; in the collection, analyses, or interpretation of data; in the writing of the manuscript, or in the decision to publish the results.
References
- World Health Organization. WHO Coronavirus Disease (COVID-19) Dashboard. Available online: https://covid19.who.int. (Last accessed on December 21st, 2020) [Google Scholar]
- COVID-19 coronavirus pandemic. Available online: https://www.worldometers.info/coronavirus/italy. (Last accessed on December 21st, 2020) [Google Scholar]
- Ferrara P, Albano L. COVID-19 and healthcare systems: what should we do next. Public Health. 2020;185:1–2. doi: 10.1016/j.puhe.2020.05.014. [DOI] [PMC free article] [PubMed] [Google Scholar]
- Anelli F, Leoni G, Monaco R, et al. Italian doctors call for protecting healthcare workers and boosting community surveillance during COVID-19 outbreak. BMJ. 2020;368:m1254. doi: 10.1136/bmj.m1254. [DOI] [PubMed] [Google Scholar]
- Conti S, Ferrara P, Fornari C, et al. Estimates of the initial impact of COVID-19 epidemic on overall mortality: evidence from Italy. ERJ Open Res. 2020;6:00179–2020. doi: 10.1183/23120541.00179-2020. [DOI] [PMC free article] [PubMed] [Google Scholar]
- Dipartimento della Protezione Civile. COVID-19 Italia – Monitoraggio della situazione. Available online: www.opendatadpc.maps.arcgis.com/apps/opsdashboard/index.html#/b0c68bce2cce478eaac82fe38d4138b1 (Last accessed on December 21st, 2020) [Google Scholar]
- Istituto Superiore di Sanità. COVID-19 integrated surveillance data in Italy. Available online: https://www.epicentro.iss.it/en/coronavirus/sars-cov-2-dashboard (Last accessed on December 21st, 2020) [Google Scholar]
- Istituto Superiore di Sanità. Characteristics of SARS-CoV-2 patients dying in Italy. Available online: https://www.epicentro.iss.it/en/coronavirus/bollettino/Report-COVID-2019_7_september_2020.pdf (Last accessed on December 21st, 2020) [Google Scholar]
- Ghani AC, Donnelly CA, Cox DR. Methods for estimating the case fatality ratio for a novel, emerging infectious disease. Am J Epidemiol. 2005;162:479–486. doi: 10.1093/aje/kwi230. [DOI] [PMC free article] [PubMed] [Google Scholar]
- Conti S, Ferrara P, Mazzaglia G, et al. Magnitude and time-course of excess mortality during COVID-19 outbreak: population-based empirical evidence from highly impacted provinces in northern Italy. ERJ Open Res. 2020;6:00458–2020. doi: 10.1183/23120541.00458-2020. [DOI] [PMC free article] [PubMed] [Google Scholar]
- Ghayda RA, Lee KH, Han YJ. Estimation of global case fatality rate of coronavirus disease 2019 (COVID-19) using meta-analyses: Comparison between calendar date and days since the outbreak of the first confirmed case. Int J Infect Dis. 2020;100:302–8. doi: 10.1016/j.ijid.2020.08.065. [DOI] [PMC free article] [PubMed] [Google Scholar]
- Oke J, Heneghan C. Global COVID-19 case fatality rates. CEBM Research. April 6, 2020 Available online: https://www.cebm.net/global-covid-19-case-fatality-rates/ (Last accessed on December 21st, 2020) [Google Scholar]
- Verity R, Okell LC, Dorigatti I, et al. Estimates of the severity of coronavirus disease 2019: a model-based analysis. Lancet Inf. Dis. 2020;20(6):669–677. doi: 10.1016/S1473-3099(20)30243-7. [DOI] [PMC free article] [PubMed] [Google Scholar]
- Wilson N, Kvalsvig A, Barnard L, Baker MG. Case-fatality risk estimates for COVID-19 calculated by using a lag time for fatality. Emerging Infectious Diseases. 2020;26(6):1339–1441. doi: 10.3201/eid2606.200320. [DOI] [PMC free article] [PubMed] [Google Scholar]
- International Agency for Research on Cancer (IARC) Cancer Registration: Principles and Methods; IARC Scientific Publications: Lyon, France; 1991. [Google Scholar]
- MATLAB R2014b, September 2014, MathWorks, Inc., Natick, Massachusetts, USA [Google Scholar]
- R Foundation for Statistical Computing. Vienna, Austria: The R Foundation; Available online: www.R-project.org. [Google Scholar]
- Istituto Superiore di Sanità. Characteristics of SARS-CoV-2 patients dying in Italy. Available online: https://www.epicentro.iss.it/en/coronavirus/bollettino/Report-COVID-2019_28_may_2020.pdf. (Last accessed on December 21st, 2020) [Google Scholar]
- Michelozzi P, de’Donato P, Scortichini M, et al. Temporal dynamics in total excess mortality and COVID-19 deaths in Italian cities. BMC Public Health. 2020;20:1238. doi: 10.1186/s12889-020-09335-8. [DOI] [PMC free article] [PubMed] [Google Scholar]
- Di Giambenedetto S, Ciccullo A, Borghetti A, et al. Off-label use of Tocilizumab in patients with SARS-CoV-2 infection. Journal of Medical Virology. 2020;92(10):1787–1788. doi: 10.1002/jmv.25897. [DOI] [PMC free article] [PubMed] [Google Scholar]
- Clementi N, Ferrarese R, Tonelli M, et al. Lower nasopharyngeal viral load during the latest phase of COVID-19 pandemic in a Northern Italy University Hospital. Clin Chem Lab Med. 2020;58(9):1573–1577. doi: 10.1515/cclm-2020-0815. [DOI] [PubMed] [Google Scholar]
- Tang X, Wu C, Li X, et al. On the origin and continuing evolution of SARS-CoV-2. National Science Review. 2020 doi: 10.1093/nsr/nwaa036. nwaa036. [DOI] [PMC free article] [PubMed] [Google Scholar]
- Veronesi L, Colucci ME, Pasquarella C, et al. Virological surveillance of SARS-CoV-2 in an Italian northern area: comparison of Real Time RT PCR cycle threshold (Ct) values in three epidemic periods. Acta Biomed. 2020;91(S9):19–21. doi: 10.23750/abm.v91i9-S.10138. [DOI] [PMC free article] [PubMed] [Google Scholar]
- Odone A, Vitale M, Signorelli C. The identity of public health in COVID-19 times. Acta Biomed. 2020;91(S9):5–6. doi: 10.23750/abm.v91i9-S.10200. [DOI] [PMC free article] [PubMed] [Google Scholar]
- Bertuzzo E, Mari L, Pasetto D, et al. The geography of COVID-19 spread in Italy and implications for the relaxation of confinement measures. Nature Communications. 2020;11:4264. doi: 10.1038/s41467-020-18050-2. [DOI] [PMC free article] [PubMed] [Google Scholar]
- Gandhi M, Rutherford GW. Facial Masking for Covid-19 – Potential for “Variolation” as We Await a Vaccine. N Engl J Med. 2020;383:e101. doi: 10.1056/NEJMp2026913. [DOI] [PMC free article] [PubMed] [Google Scholar]
- European Observatory on Health Systems and Policies. COVID-19 health system response monitor. Available online: www.covid19healthsystem.org/countries/italy/countrypage.aspx (Last accessed on December 21st, 2020) [Google Scholar]
- Grasselli G, Zangrillo A, Zanella A, et al. Baseline characteristics and outcomes of 1591 patients infected with SARS-CoV-2 admitted to ICUs of the Lombardy region, Italy. JAMA. 2020;323:1574–1581. doi: 10.1001/jama.2020.5394. [DOI] [PMC free article] [PubMed] [Google Scholar]
- Esposito S, Gnocchi M, Gagliardi M. Therapeutic strategies against COVID-19. Acta Biomed. 2020;91(3):e2020038. doi: 10.23750/abm.v91i3.10450. [DOI] [PMC free article] [PubMed] [Google Scholar]


