

Abstract
Objective measurement of physical activity (PA) using accelerometers has become increasingly popular across recreational and clinical applications. However, the effects of multiple processing algorithms, filters, and corrections on PA measurement variability may be under–appreciated.
Objective:
To examine how lifestyle PA estimates are impacted by multiple available scoring methods.
Approach:
Wrist–worn accelerometers (ActiGraph GT3X+) were worn by 132 adults (87 F) with various activity levels for one week. Lifestyle PA was assessed across four PA domains: daily energy expenditure (EE); active EE; moderate–to–vigorous PA (MVPA), and steps using 1–5 algorithms per domain, with/without wrist correction and low–frequency–extension (LFE) options. Estimates were compared to self–report (International Physical Activity Questionnaire).
Main results:
PA estimates differed between algorithms with variable but frequently large effect sizes (d = 0.08–1.88). The wrist correction reduced PA estimates across all domains (p < 0.05, d = 0.26–3.04) except step counts and one daily EE algorithm (d = 0.0). Conversely, the LFE increased step counts (d = 1.44, p < 0.05) but minimally affected all other outcomes (d = 0.08–0.20, p < 0.05). Correlations between objective and self–reported PA were small to moderate (ρ = 0.22–0.45) and decreased with the wrist correction.
Significance:
Measurement of PA using accelerometry is highly dependent on algorithm and filter selection; previously validated methods are therefore not interchangeable. Users should take caution when interpreting absolute PA estimates, and reporting standards should require detailed methodology disclosure to optimize comparisons across studies.
Keywords: accelerometer, ActiGraph, energy expenditure, steps, MVPA, self–report
INTRODUCTION
Objective measures of physical activity (PA) have growing applications in health promotion, rehabilitation, and performance enhancement. Healthcare providers are increasingly investigating the use of accelerometers to assess patients’ PA for observative, preventative, and rehabilitative purposes (Kamdar et al., 2017, Nishizawa et al., 2016). Athletic trainers, first responders, and military personnel may use PA data to assess, monitor, and inform performance and/or training loads (Horner et al., 2013, Sato et al., 2009). Furthermore, researchers may consider PA metrics as independent variables or covariates in clinical, observational, and epidemiological studies (Martin et al., 2011, Ottevaere et al., 2011, Rosenkilde et al., 2012, Troiano et al., 2008).
Physical Activity Guidelines for Americans recommend that adults should engage in at least 150 minutes of moderate–to–vigorous physical activity (MVPA) each week (Piercy et al., 2018); other common adult PA metrics include energy expenditure (EE) in kilocalories (kCal) or metabolic equivalents (METs), and daily steps. Current ‘gold standards’ in assessing PA intensity involve measuring oxygen consumption (VO2) using indirect calorimetry or doubly labelled water (Sallis and Owen, 1999). However, alternate means of quantifying PA are necessary as such methods are impractical outside controlled laboratory settings (Ottevaere et al., 2011, Sallis and Owen, 1999). Self–reported measures of PA can exhibit good concurrent validity (Hagstromer et al., 2006) and high repeatability (Craig et al., 2003), but are criticized for subjectivity to bias and/or recall error (Sallis and Owen, 1999, Kowalski et al., 2012, Prince et al., 2008, Troiano et al., 2008). Hence, obtaining objective PA estimates using actimetry have become increasingly popular.
Numerous algorithms have been developed to transform raw acceleration data into quantitative PA metrics. It can be daunting for novice users to determine which algorithm is optimal and/or appropriate when using commercially available accelerometers and software, especially given that substantial differences between algorithms have been reported (Cain et al., 2013, Ellingson et al., 2017, Kerr et al., 2017, Mâsse et al., 2005, Sallis and Owen, 1999, Staudenmayer et al., 2015, Ellingson et al., 2019). However, the magnitude of these differences for lifestyle physical activity across multiple PA domains (EE, MVPA time, steps) is not well characterized. Poor correlations between such objective PA metrics and self–report are typically attributed to error in the latter (Hagstromer et al., 2006, Sallis and Owen, 1999, Troiano et al., 2008, Troiano et al., 2014). However, more recent work indicates notable differences between algorithms (Crouter et al., 2010, Ellingson et al., 2017, Lyden et al., 2011, Sallis and Owen, 1999) which may contribute to these low correlations. Furthermore, associations between objective PA domains have not been explicitly examined.
Multiple corrective and filtering options can be used to process accelerometer data. Wrist–worn devices have been used increasingly due to improved patient compliance; however, these produce different acceleration patterns than those worn at the hip (Ellingson et al., 2017, Hildebrand et al., 2014, Kerr et al., 2017, LaMunion et al., 2017, Sallis and Owen, 1999, Troiano et al., 2014, Tudor-Locke et al., 2015, Cooke et al., 2018). This complicates scoring methods as most commercially available algorithms were developed using data obtained from hip–worn devices. To attenuate this risk, mathematical options like ActiLife’s wrist correction (commercially available software provided for ActiGraph accelerometers) are available. However, no published studies have evaluated its validity, and many do not clarify whether the correction factor was indeed applied. Additionally, the use of a low frequency extension (LFE) option, which lowers the acceleration threshold necessary to constitute a “count”, can be applied to better recognize low–intensity signals (Cain et al., 2013, Feito et al., 2017). The LFE has been shown to increase EE and step estimates and has been proposed for use particularly in elderly or patient populations, whose lifestyle activities are characterized by lower accelerations (Cain et al., 2013, Feito et al., 2017, Tudor-Locke et al., 2015). However, whether the LFE substantially alters multiple lifestyle PA metrics, when also considering algorithm choice and the wrist correction, has not been evaluated.
Therefore, the primary purpose of this study was to evaluate how multiple lifestyle PA measurements differ between algorithms using a commercially available platform, ActiLife, with and without the wrist correction and LFE. The secondary goal was to determine how algorithm and filter combinations influence correlations within accelerometer domains and with self–reported PA. We hypothesized that the wrist correction would consistently produce the largest overall differences across outputs, followed by the LFE, with the smallest differences occurring between previously validated algorithms. Furthermore, we expected correlations within and between accelerometer domains to exceed those with self–report. Given an increased reliance on objective PA measurement, understanding the independent and cumulative influences of scoring options on lifestyle PA estimates are essential in understanding point estimate error potential, when interpreting results across studies, and in making comparisons to normative guidelines.
METHODS
Subjects
We performed a secondary analysis on accelerometer data previously collected from participants recruited for pain sensitivity studies in our laboratory (Merkle, 2016). The data is publicly available (Frey Law, 2020). To be included in the current investigation, we required a minimum of four days of accelerometer wear and the availability of anthropometric data including height, weight, health status, sex, and age. As a result, nine of 141 initial subjects were excluded for insufficient wear time or missing data, leaving 132 who met the inclusion criteria with diverse health status and activity levels (age 32 ± 13.5 years; 45 males, 87 females; 16 fibromyalgia, 14 low back pain, 102 healthy controls). See table 1 for a summary of subjects’ demographic information. All subjects provided written informed consent as approved by the University of Iowa’s Institutional Review Board prior to data collection.
Table 1.
Demographic characteristics (mean, SD or N, %) of the study population.
| Characteristic | All (N=132) | Males (N=45) | Females (N= 87) |
|---|---|---|---|
| Age (yrs) | 32.0 (13.5) | 26.6 (9.3) | 34.8 (14.5) |
| Weight (kg) | 75.9 (19.6) | 81.8 (18.2) | 72.8 (19.6) |
| Height (m) | 1.70 (0.09) | 1.79 (0.10) | 1.66 (0.06) |
| Health Status: Healthy, pain–free | 102 (77%) | 40 (89%) | 62 (71%) |
| Low–back pain | 14 (11%) | 5 (11%) | 9 (10%) |
| Fibromyalgia | 16 (12%) | 0 (0%) | 16 (18%) |
Activity Assessment
We assessed PA in two ways; 1) accelerometry for one week using the ActiGraph GT3X+ (v3.2.1, ActiGraph LLC, Pensacola, FL, USA) triaxial accelerometer, and 2) self–report at the end of the week. Subjects wore the accelerometer on their self–identified non–dominant wrist using disposable wrist bands, or removable bands if requested for comfort. We asked participants to wear monitors (4.6 × 3.3 × 1.5 cm) 24 hours day−1 (including in the shower, during sleep, etc.) for approximately seven days (6.87 ± 0.39). Entire datasets were used, resulting in 21,761 total hours of collected wear–time. The accelerometers had a dynamic acceleration range of ± 6 g, possessed a digital band–filter of 0.25–2.5 Hz, and were sampled at 30 Hz. At the end of the week, participants returned their devices and electronically completed the International Physical Activity Questionnaire (IPAQ) long form using REDCap to evaluate self–reported activity levels over the same seven–day period. Raw tri–axial acceleration data were then downloaded and saved as GT3X+ CSV files for subsequent offline analysis.
Accelerometer PA Analyses
We evaluated PA metrics using two filter options: the LFE, and the wrist correction (schematic of study design provided in figure 1a). These were measured across four PA domains: 1) daily EE (METs); 2) activity–based EE (kCal h−1); 3) time spent at various PA intensities (sedentary, light, moderate, vigorous and MVPA), and 4) steps (figure 1b).
Figure 1.
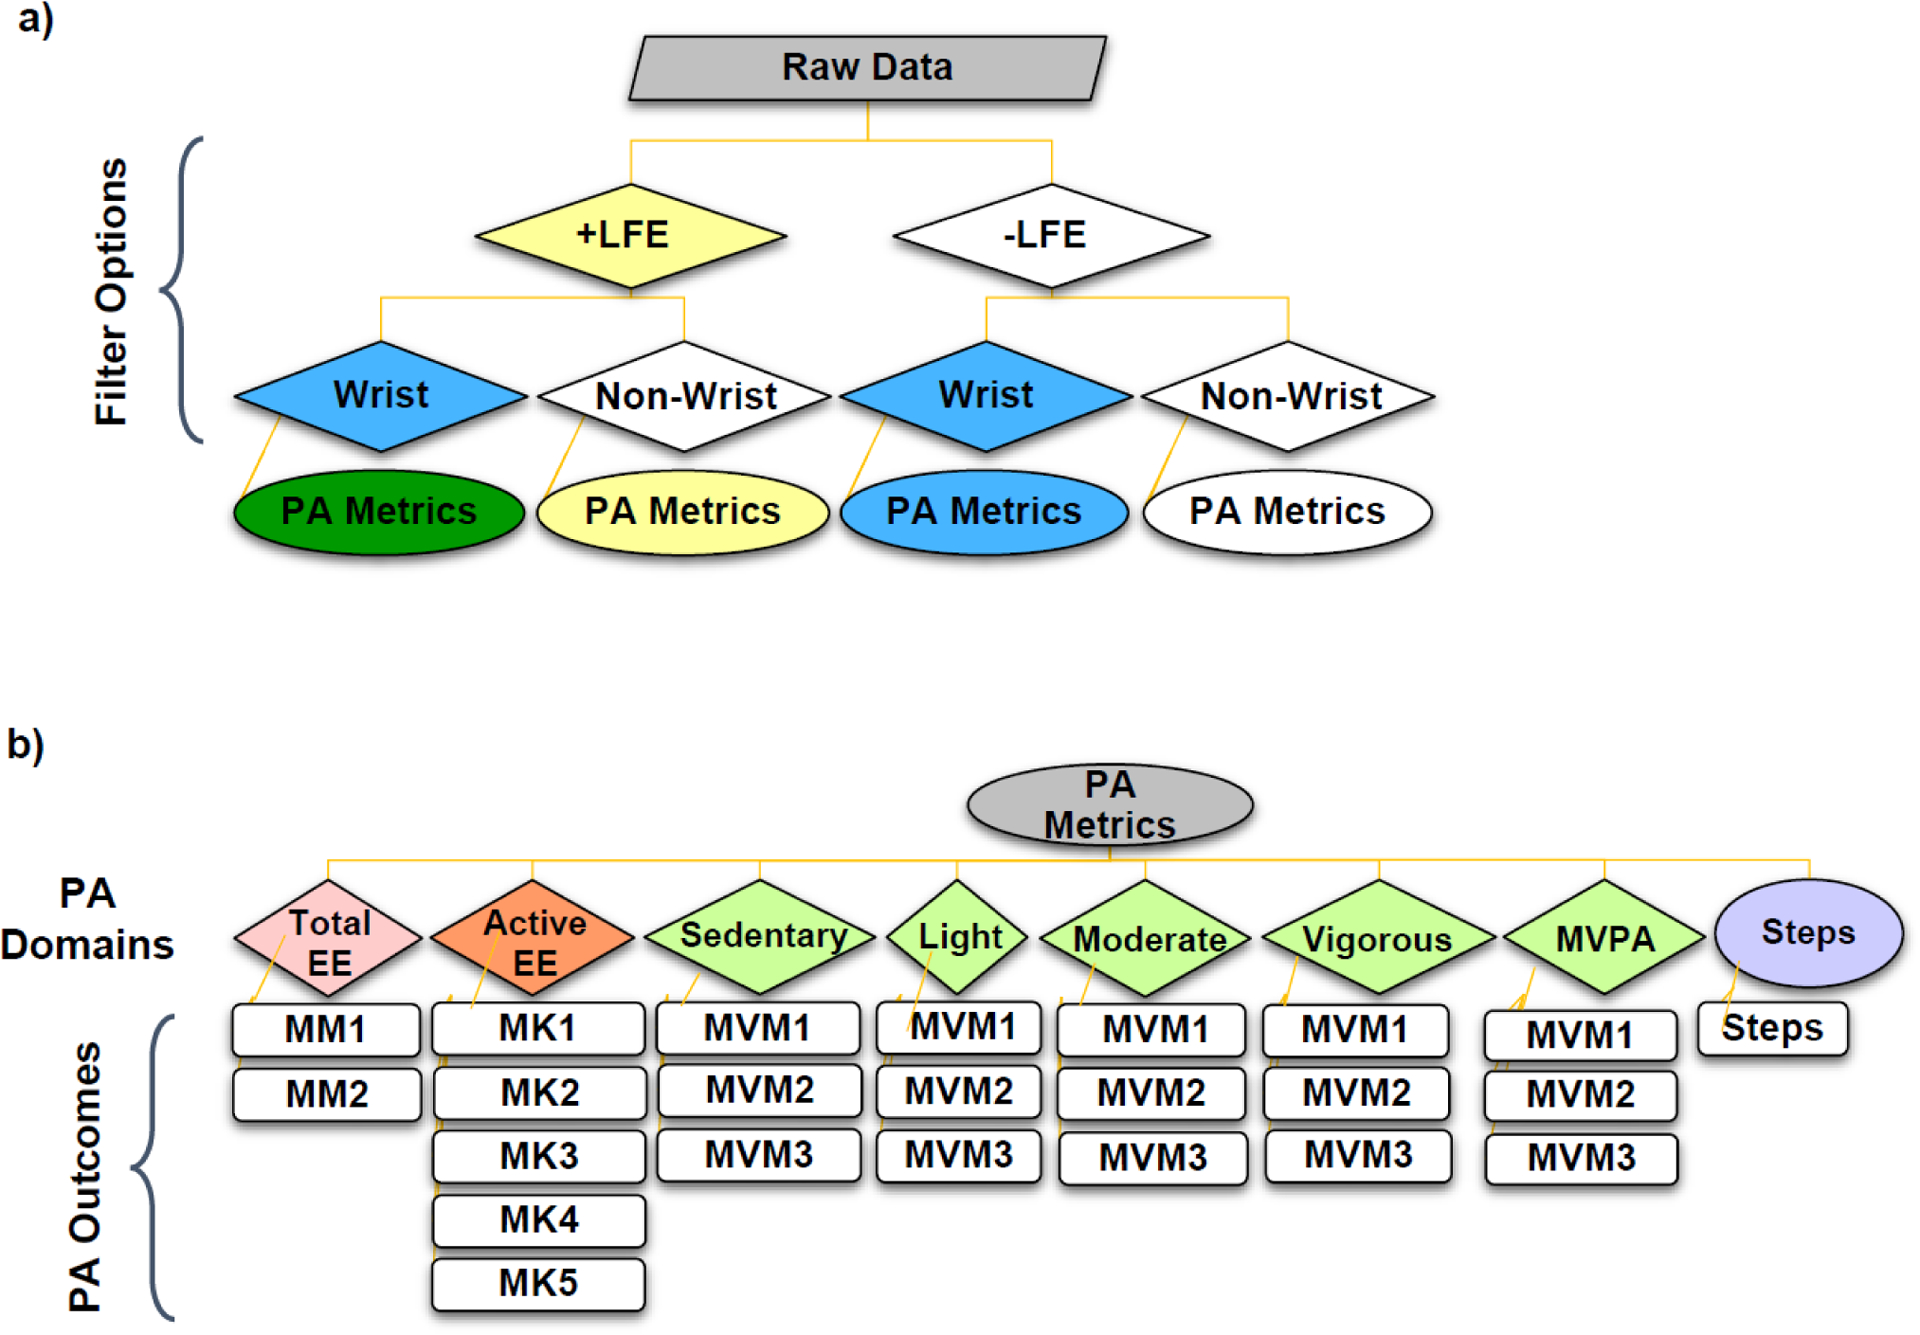
Schematic diagram of study design involving a) low frequency extension (LFE) and wrist wear filtering options applied prior to remaining analysis algorithms; and b) physical activity (PA) metrics extracted for each filtering permutation, with the associated algorithms for each of the four PA domains: total daily energy expenditure (EE, n=2), active EE (n=5), moderate to vigorous physical activity (MVPA, n=3) and steps (n=1). Algorithms used for each PA outcome are represented using abbreviations (e.g. MM1; a full list is provided in table 2).
We considered from one (step counts) to five (active EE) algorithms within each domain based on 1) adult equations available in ActiLife and 2) popular choice in literature. See figure S1.1 in Supplemental Materials 1 for screen shots of the ActiLife interface used to select each algorithm. As many algorithm names are similar, we assigned codes corresponding to PA domain (i.e. MM for method–MET algorithms; MK for method–kCal; and MVM for MVPA–method). See table 2 for a list of algorithms and their corresponding study abbreviations.
Table 2.
Summary of algorithms used to assess four physical activity (PA) domains and their associated abbreviations.
| PA Domain | ActiLife Algorithm Name | Study Abbreviation |
|---|---|---|
| Daily EE (METs) | Freedson Adult (Freedson et al., 1998) | MM1 |
| Crouter Adult (Crouter et al., 2010) | MM2 | |
| Active EE (kCals) | Freedson VM3 Combination (Sasaki et al., 2011) | MK1 |
| Williams Work–Energy (Actigraph, 2019) | MK2 | |
| Freedson (Freedson et al., 1998) | MK3 | |
| Freedson Combination (Freedson et al., 1998) | MK4 | |
| Freedson VM3 (Sasaki et al., 2011) | MK5 | |
| MVPA/Cut–points (MVPA) | Freedson Adult (Freedson et al., 1998) | MVM1 |
| Troiano Adult (Troiano et al., 2008) | MVM2 | |
| Freedson Adult VM3 (Sasaki et al., 2011) | MVM3 | |
| Steps | Y–Crossing Method (ActiGraph, 2019) | Steps |
The seven EE algorithms, two daily MET (MM1, MM2) and five activity–based kCal h−1 (MK1–MK5) all calculate EE from counts per minute; however, each varies in their mathematical structure (e.g., constants, simple linear or piecewise model, etc.) and use of demographic data (e.g., body weight, BW). See table S1.1 in Supplemental Materials 1 for the governing equations as reported by ActiLife. The three MVPA/cut–point algorithms which estimate time spent in sedentary, light, moderate, vigorous, and MVPA use varying count–based cut points (see table S1.2 in Supplemental Materials 1). As only one default algorithm calculates steps in ActiLife (proprietary Y–axis crossing method, according to ActiGraph documentation (2019)), we simply refer to it as ‘steps’. In summary, we assessed a total of eight metrics across four PA domains (daily EE, activity EE, MVPA/cut points, and steps). This involved one metric per domain, save MVPA/cut points which included five: time spent in sedentary, light, moderate, vigorous, and MVPA activity (figure 1b). Two MET algorithms, five kCal algorithms, one step algorithm, and three MVPA/cut–point algorithms were considered for each respective domain, giving a total of 23 PA outcomes (figure 1b). These were each evaluated four times: +LFE/+wrist, +LFE/−wrist, −LFE/+wrist, and −LFE/−wrist (figure 1a).
Processing Details
We imported each participants’ GT3X+ CSV files into ActiLife (v6.13.2) without lux readings. Next, we manually entered and validated subject anthropometrics (age, sex, height, and BW) in ActiLife. Files were then converted to 10–second epoch ActiGraph Data (.agd) files with inclinometer data and triaxial vector magnitude counts per minute . This epoch length was chosen for compatibility with the MM2 daily EE algorithm, which requires initial 10–second sampling intervals (Crouter et al., 2010), and has been used with other algorithms as well (e.g., Cooke et al., 2018). This sampling rate could further be automatically re–integrated into 60–second epochs in ActiLife as needed for other equations (ActiGraph, 2019). We repeated this process with and without the LFE, creating two AGD files for each participant; these files were then scored with and without the wrist correction for each PA metric (figure 1a). According to ActiLife documentation, the wrist correction involves a series of piecewise linear transformations which generally depreciate VMCPM by larger proportions as intensity increases (see figure S1.2, Supplemental Materials 1)
Post–Processing Transformations
We performed additional transformations in Excel to interconvert EE estimates between active EE (kCal h−1) and daily EE (METs) domains, thereby allowing comparisons between all seven EE algorithms. Given that 1 MET = 3.5 mL O2 kg−1 min−1 = 1 kCal kg−1 h−1, and using BW in kg, we calculated equivalent total daily EE from activity EE (equivalent daily MET )) and conversely the activity EE from the total daily EE (equivalent active EE in ) (Compendium, 2011). As not all MVPA/cut point algorithms defined identical categories, we merged vigorous and very–vigorous classifications for MVM1 and MVM3. We also added a null column for MVM3 sedentary time, which was not otherwise identified (see table S1.2 in Supplemental Materials 1 for cut point definitions).
Self–Report PA Analyses
We scored self–reported PA using the 2005 IPAQ long form standard guidelines available online (IPAQ, 2010). We checked responses for errors (e.g. doubly reporting activity time as 60 minutes and one hour) and applied truncation recommendations (e.g. limiting moderate PA to three hours day−1). Extracted PA outcomes included: total PA (MET × min wk−1); time spent in MVPA per week (min); and mean sitting time per day (min).
Statistical Analyses
Summary statistics were computed. We used general linear modelling to compare PA estimates between algorithms while considering the effect of the LFE and wrist correction, using a three–way repeated measures analysis of covariance (RM ANOVA, mixed full–factorial model, type III sum–of–squares) for each PA metric. Analyses were adjusted using BW as a covariate and sex as a between–subjects’ factor; algorithm choice, wrist correction status, and LFE status served as repeated factors. We applied the Huynh–Feldt correction for non–sphericity as needed and conducted post–hoc testing for pairwise–comparisons using the Bonferroni confidence interval adjustment. This sample (N = 132) exceeded the minimum required (N = 101) to detect small effect sizes assuming α = 0.05, power (1 − β) = 0.9, a maximum of seven algorithm comparisons, and a 0.9 correlation between methods (G–Power 3.1.9.4).
We extracted estimated marginal means for each PA output and computed standardized effect sizes (Cohen’s d) for pairwise algorithm and filter differences. Effect sizes were operationally defined as d = 0.2, 0.5, and 0.8 being small, medium, and large, respectively. We also computed percent (%) differences for each subject across metrics to then obtain mean (SD) values across all pairwise combinations of algorithm choice, wrist correction, and the LFE. For the purpose of reporting relative differences, we designated the no–LFE (default condition in ActiLife) and no–wrist correction (to provide a more conservative estimate of % differences) condition as the referent value (i.e., denominator) to maintain consistency in these calculations.
Relationships between and within the four objective PA domains (daily EE [MM1–MM2], activity–based EE [MK1–MK5], time spent in MVPA [MVM1–MVM3], and steps) and the three self–reported PA outcomes (IPAQ) were evaluated. We computed Spearman’s rho (ρ) correlations between all PA outcomes, selected due to the non–parametric nature of IPAQ data. Correlation effect sizes were operationally defined as small (ρ ≥ 0.2), moderate (ρ ≥ 0.5), and large (ρ ≥ 0.8). We performed all statistical analyses in SPSS (v25.0, IBM), defining significance as p ≤ 0.05 and reporting effect sizes throughout. Mean (SD) or range are reported in text and mean (SE) are shown in corresponding figures.
RESULTS
Algorithm Differences
PA estimates differed significantly between algorithm choice for nearly all daily EE, active EE, and MVPA metrics (p < 0.05, figure 2, table S2.1 in Supplemental Materials 2). Follow–up tests revealed that all pairwise differences between EE algorithms, daily and active, were significant (p < 0.001; figure 2a, b).
Figure 2.
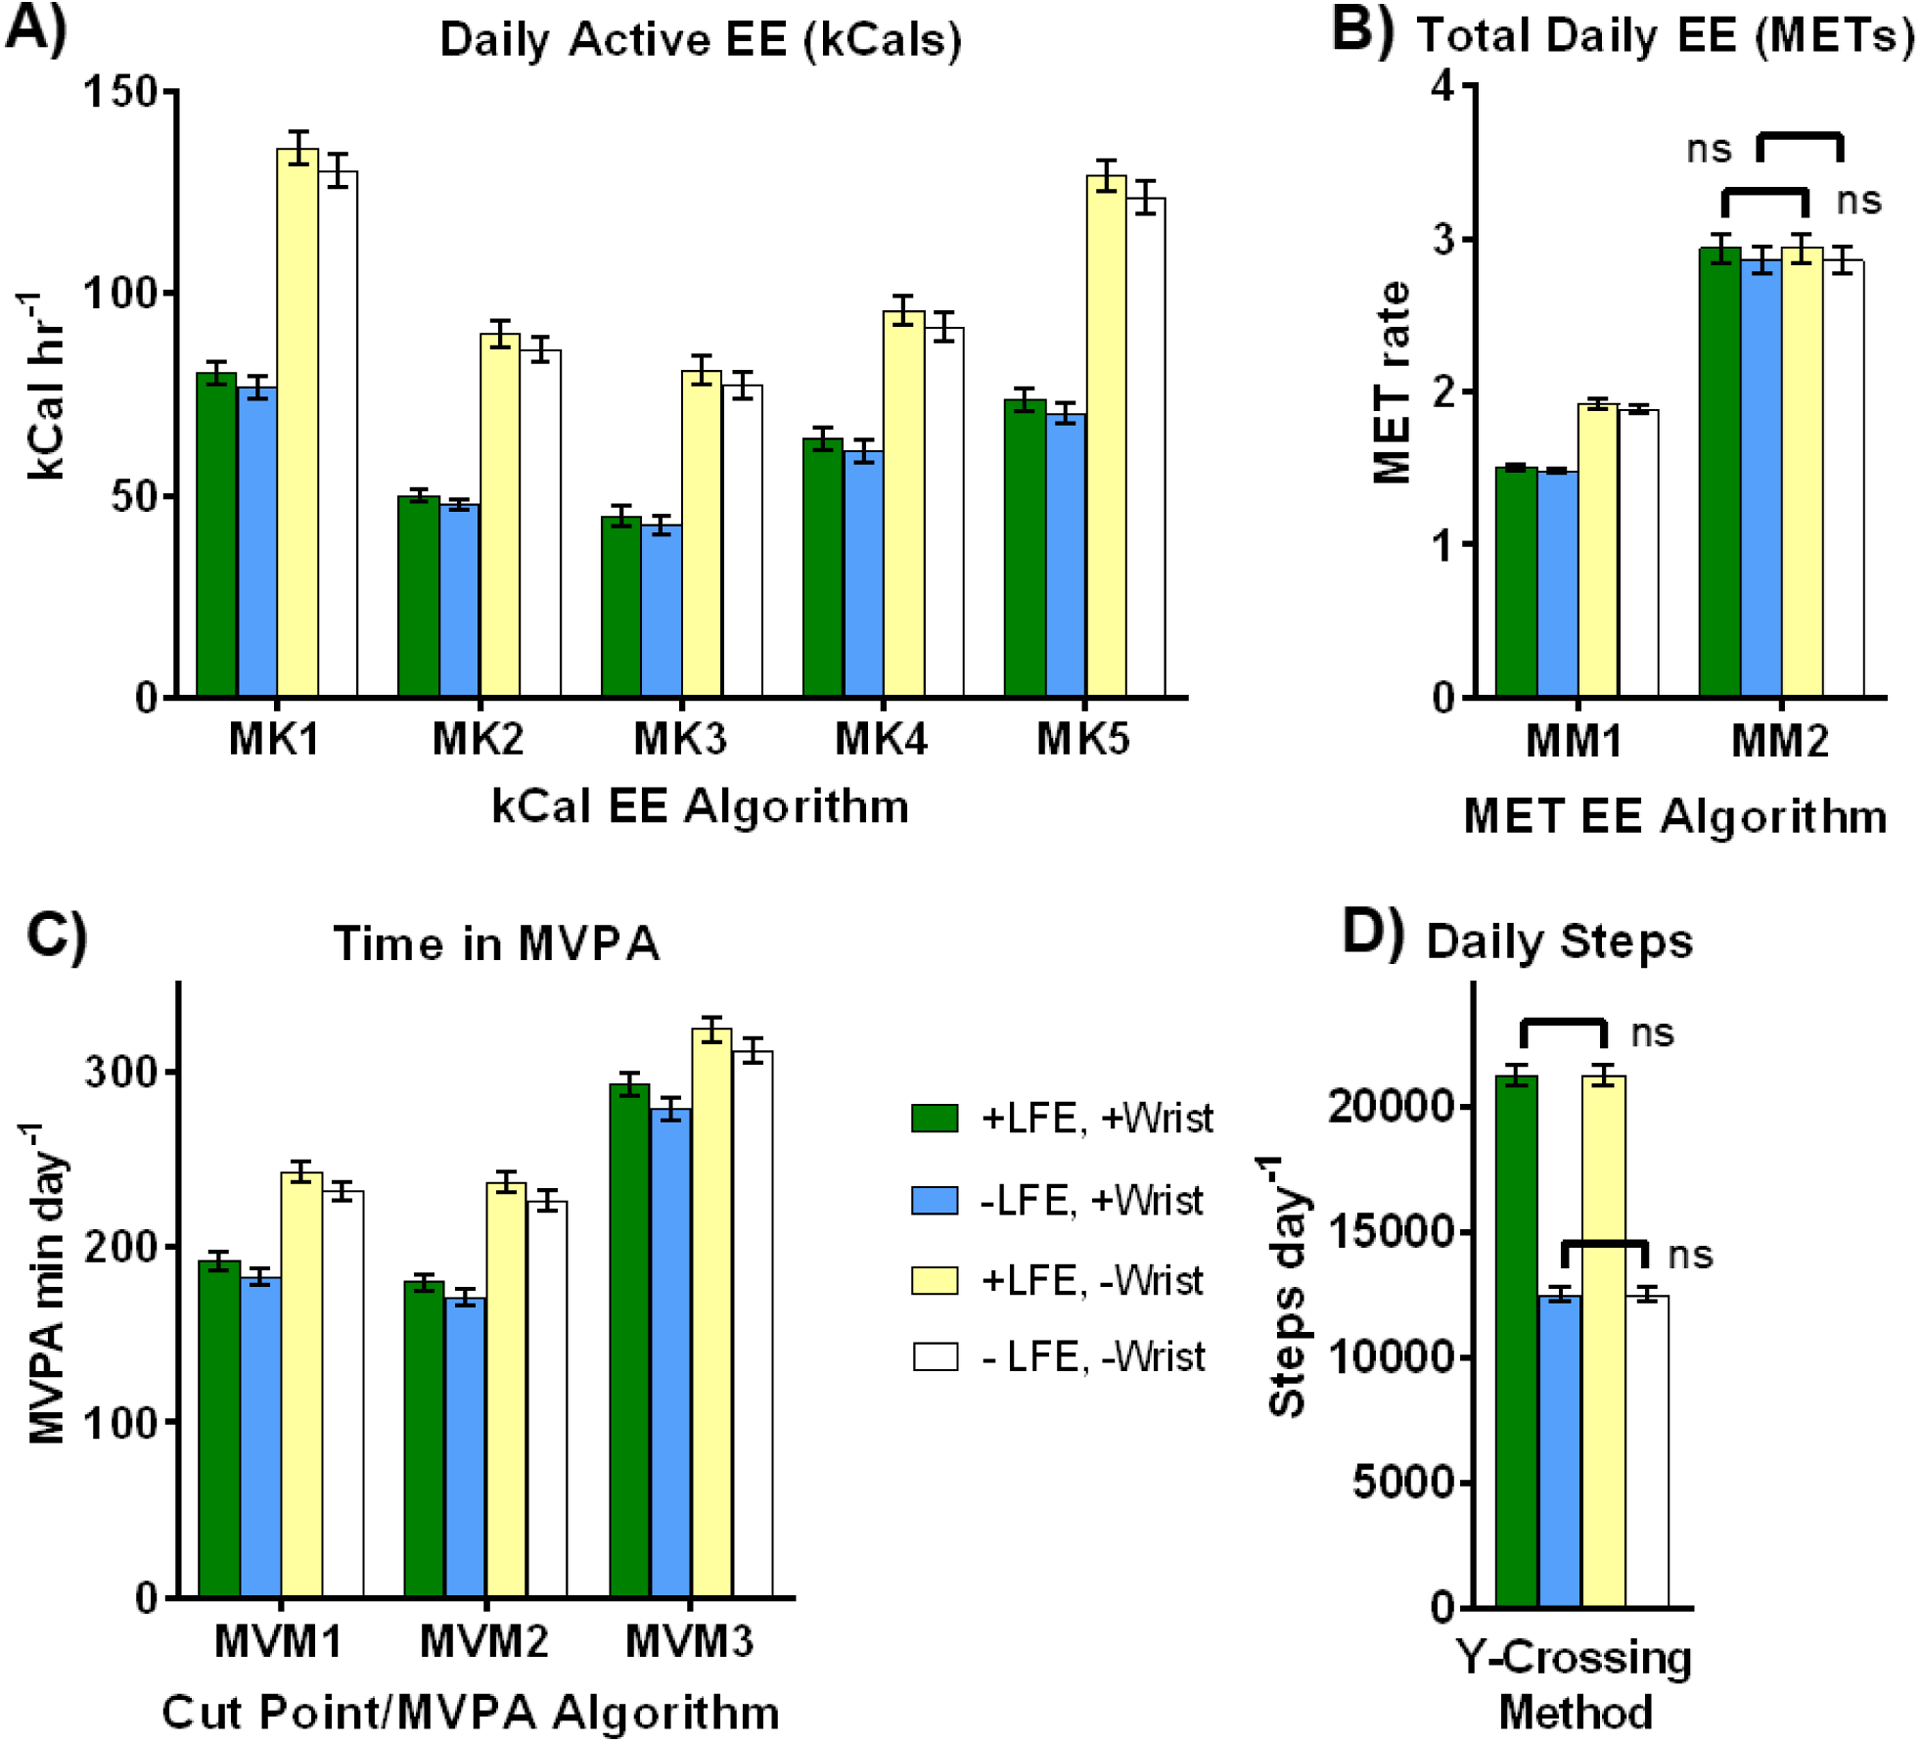
Mean (SE) physical activity (PA) estimates across four primary PA outcomes: A) active energy expenditure (EE, in kCals hr−1); B) total daily EE (in METs); C) time spent in moderate to vigorous PA (MVPA); and D) daily steps. Note relatively large fluctuations across algorithms (panels A–C), small to large declines due to the wrist correction (blue vs. white or green vs. yellow bars), and generally small decreases due to the LFE (green vs. blue or yellow vs. white bars), save step counts, where the LFE produces a large increase (panel D). As nearly all possible pairwise comparisons between outcomes were statistically significant (p < 0.05), only non-significant differences (ns) are indicated (occurs in panels B and D only).
For example, mean active EE estimates using MK1 nearly doubled those obtained using MK3 for each LFE/wrist option (figure 2a). Although some active EE algorithms produced similar estimates (e.g. MK1 versus MK5, or MK2 versus MK4), these too were statistically significant. Further, differences between total daily EE estimates (figure 2b) ranged from approximately 50% to nearly 100% depending on LFE and wrist correction application. Corresponding effect sizes for EE outcomes (figure 3a) were highly variable (d = 0.19–1.71), with 13 of 21 (62%) EE pairwise comparisons being classified as large (d > 0.8). See figure S2.1, Supplemental Materials 2, for graphs illustrating outputs across all seven EE methods after transformation to either kCal or MET units.
Figure 3.
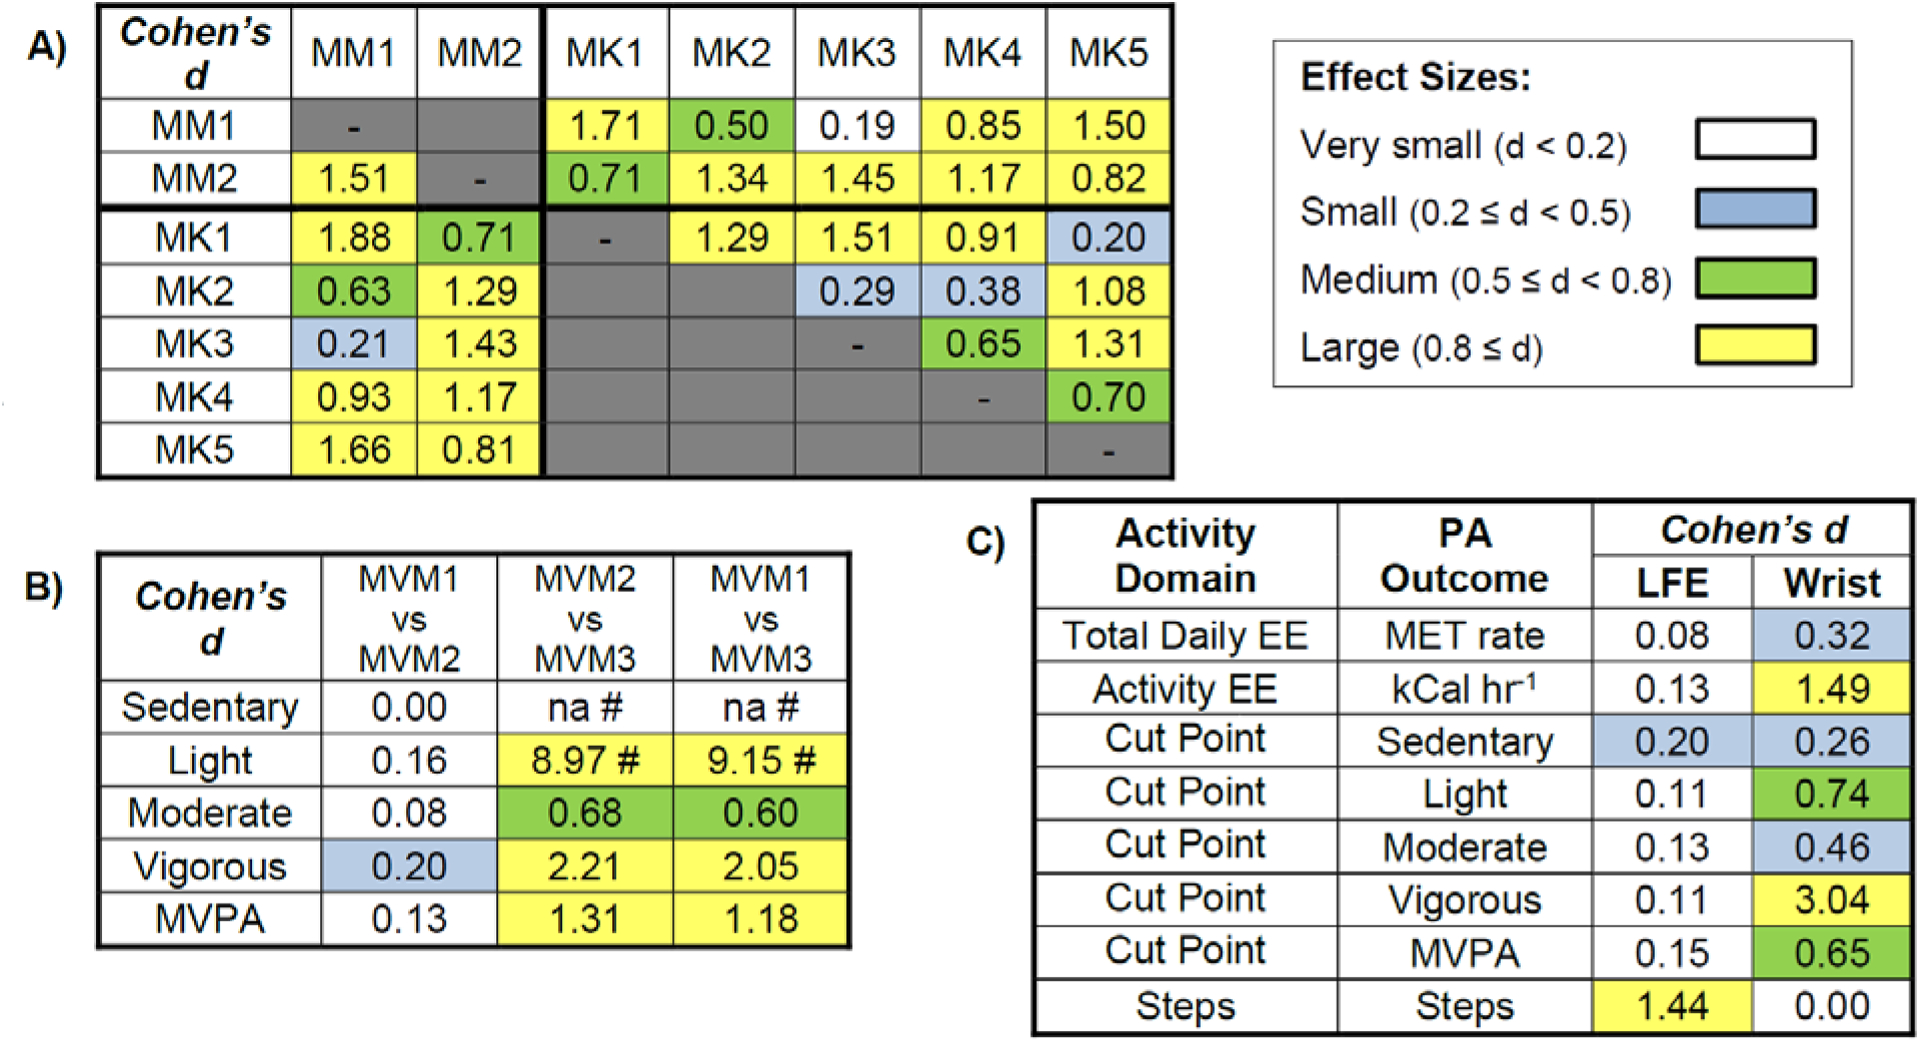
Standardized pairwise effect sizes (Cohen’s d) between A) 7 methods of estimating energy expenditure (EE) either within daily EE (MET) or activity–based EE (kCal) approaches, or transformed to similar units for comparison between approaches, where kCal units are above the diagonal and METs below the diagonal; B) cut–point equations/classifications identifying percent time spent in each PA category; and C) overall LFE and wrist correction options across PA outcomes. All but two effect sizes (those reporting d = 0.00) were statistically significant (p < 0.05). Effect size magnitude was color coded as small (blue), medium (green) and large (yellow). # Note, MVM3 does not identify any sedentary time (na = not available; all otherwise sedentary time allocations are included in light activity); therefore, no meaningful comparisons can be made for this metric involving MVM3.
All MVPA pairwise comparisons differed significantly between methods (p < 0.001, figure 2c, 3b), save MVM1 and MVM2 for sedentary activity (p = 1.0). See figure S2.2 in Supplemental Materials 2 for graphs showing isolated differences in sedentary, light, moderate, and vigorous categories separately. Although significant, MVM1 and MVM2 produced similar outputs across all PA intensities (d < 0.2) while those involving MVM3 differed (d ≥ 0.6).
Wrist Correction and LFE
The wrist correction and LFE filters affected PA estimates quite dissimilarly. The wrist correction reduced PA estimates across all outcomes (p < 0.05, d = 0.26–3.04), save one MET algorithm, MM2 (figure 2b) and steps (figure 2d, 3c), where it produced no change (p = 1.00, d = 0.00). See also table S2.1, Supplemental Materials 2, for ANOVA p–values. Though statistically significant (p < 0.05), the standardized effect size of the LFE was quite small (d = 0.08–0.20) across all outcomes save steps, where estimates increased dramatically (d = 1.44, figure 2, 3). Figure 4 summarizes the mean percent changes observed with either the wrist correction or the LFE, showing the nearly opposite effects these two options produced across all algorithms (save MM2). When the effect of algorithm choice was considered conjunctly with the LFE and wrist correction, the resulting cumulative multiple–factor effect typically produced even greater differences between PA estimates, ranging from a maximum (mean, SD) of 95.2% (30.2%) for MVPA to 362.0% (253.9%) for active EE (kCals).
Figure 4.
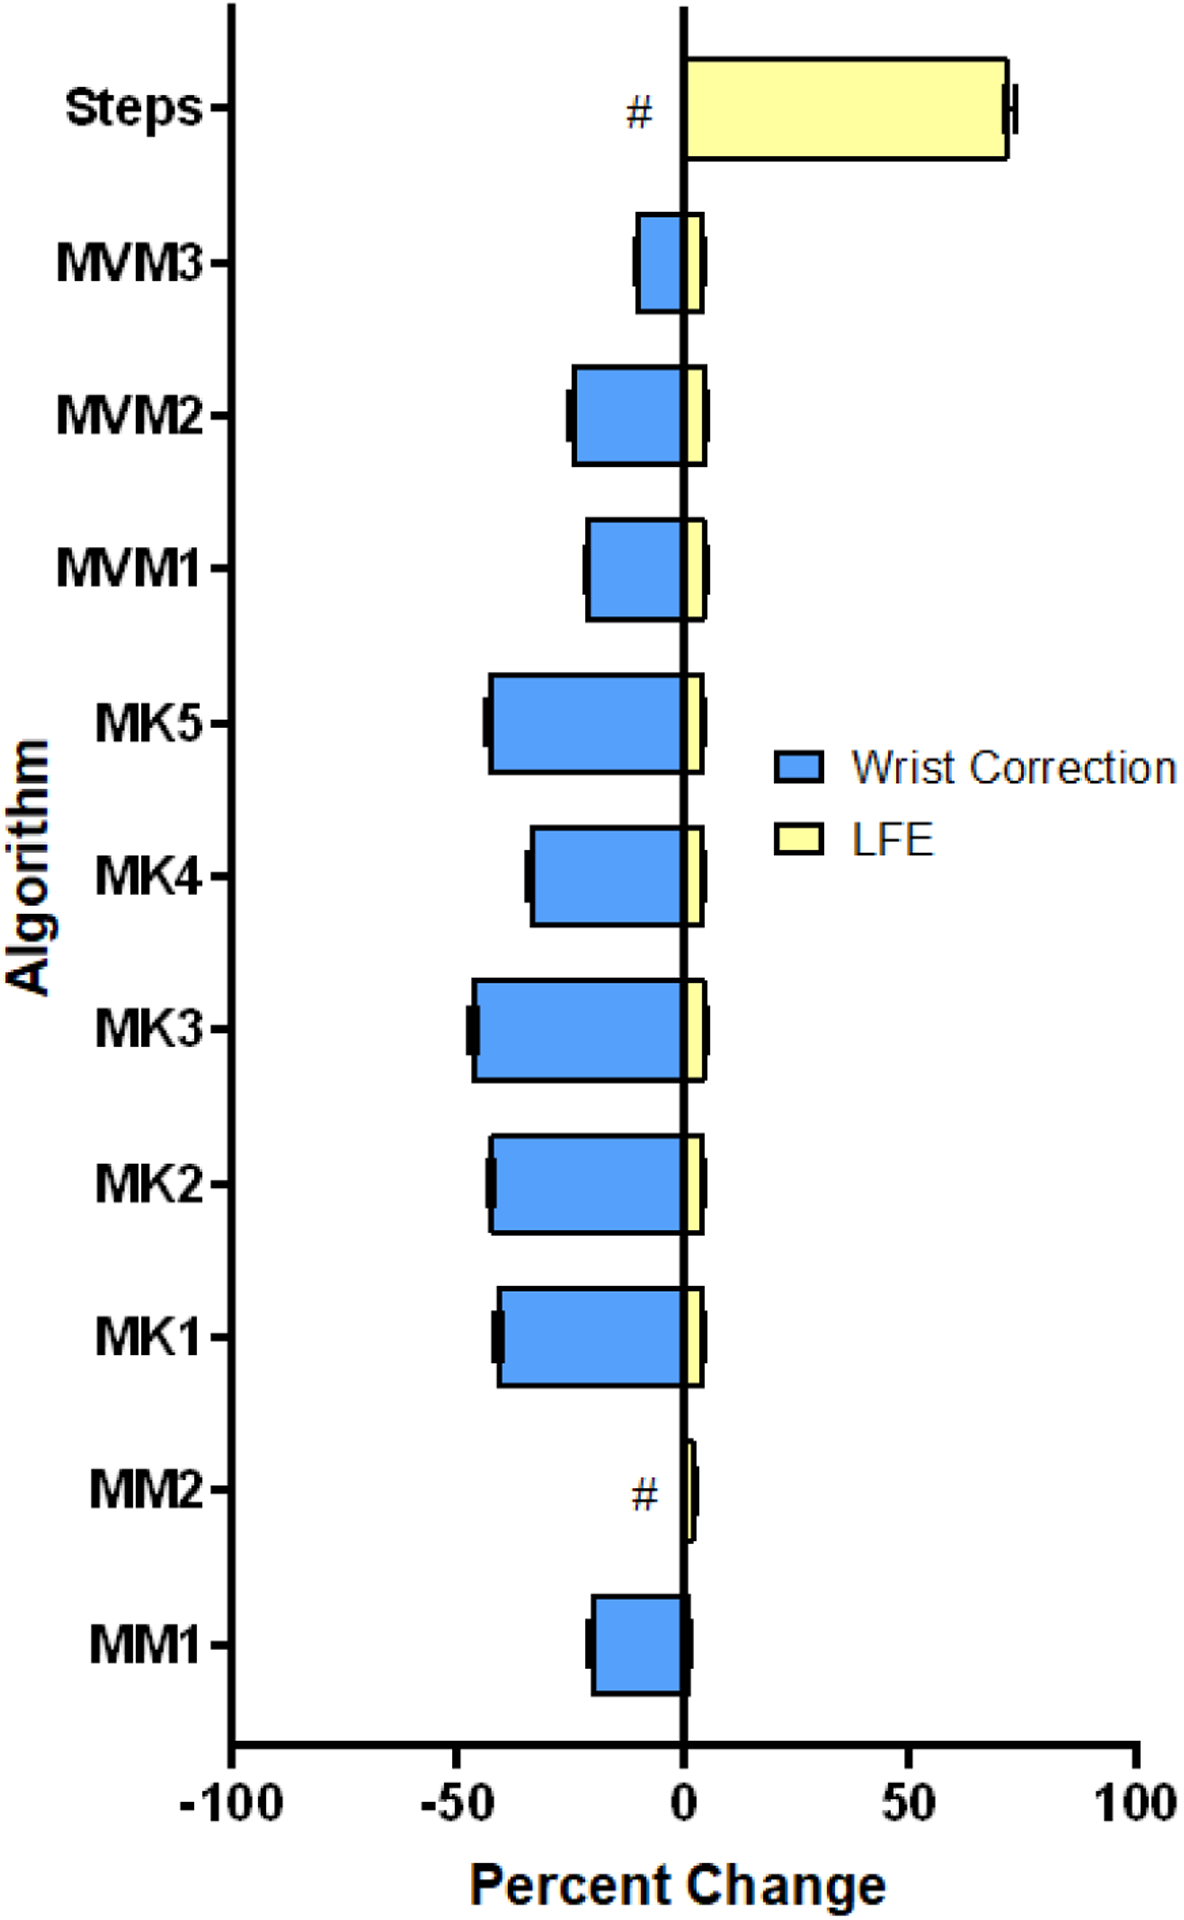
Mean (SE) percent change in primary physical activity (PA) outcomes when applying the wrist correction or low frequency extension (LFE). The wrist correction has a highly variable effect, with two methods being completely insensitive (#). In contrast, the LFE minimally impacts all PA outcomes save steps, where a large increase is clear. Effects on MVM1–3 were evaluated using MVPA; the effect of the LFE was evaluated without the wrist correction, and the effect of the wrist correction was evaluated without the LFE.
PA Assessment Associations
Despite frequently large differences in accelerometer PA outcomes between algorithms, we predominantly saw high correlations within each domain (typically ρ > 0.88) and lower, yet significant, associations between domains: 0.41 ≤ ρ ≤ 0.65 with wrist correction (figure 5a) and 0.57 ≤ ρ ≤ 0.72 without wrist correction (figure 5b). However, MM2 violated both these trends by correlating more strongly with MVPA and step domains (ρ > 0.88) than with other EE algorithms (0.38 ≤ ρ ≤ 0.84) depending on whether the wrist correction was applied. The wrist correction produced notable declines in the correlations between several accelerometry PA domains, whereas the LFE had a minimal impact on between-domain correlations (see figure S2.3, in Supplemental Materials 2).
Figure 5.
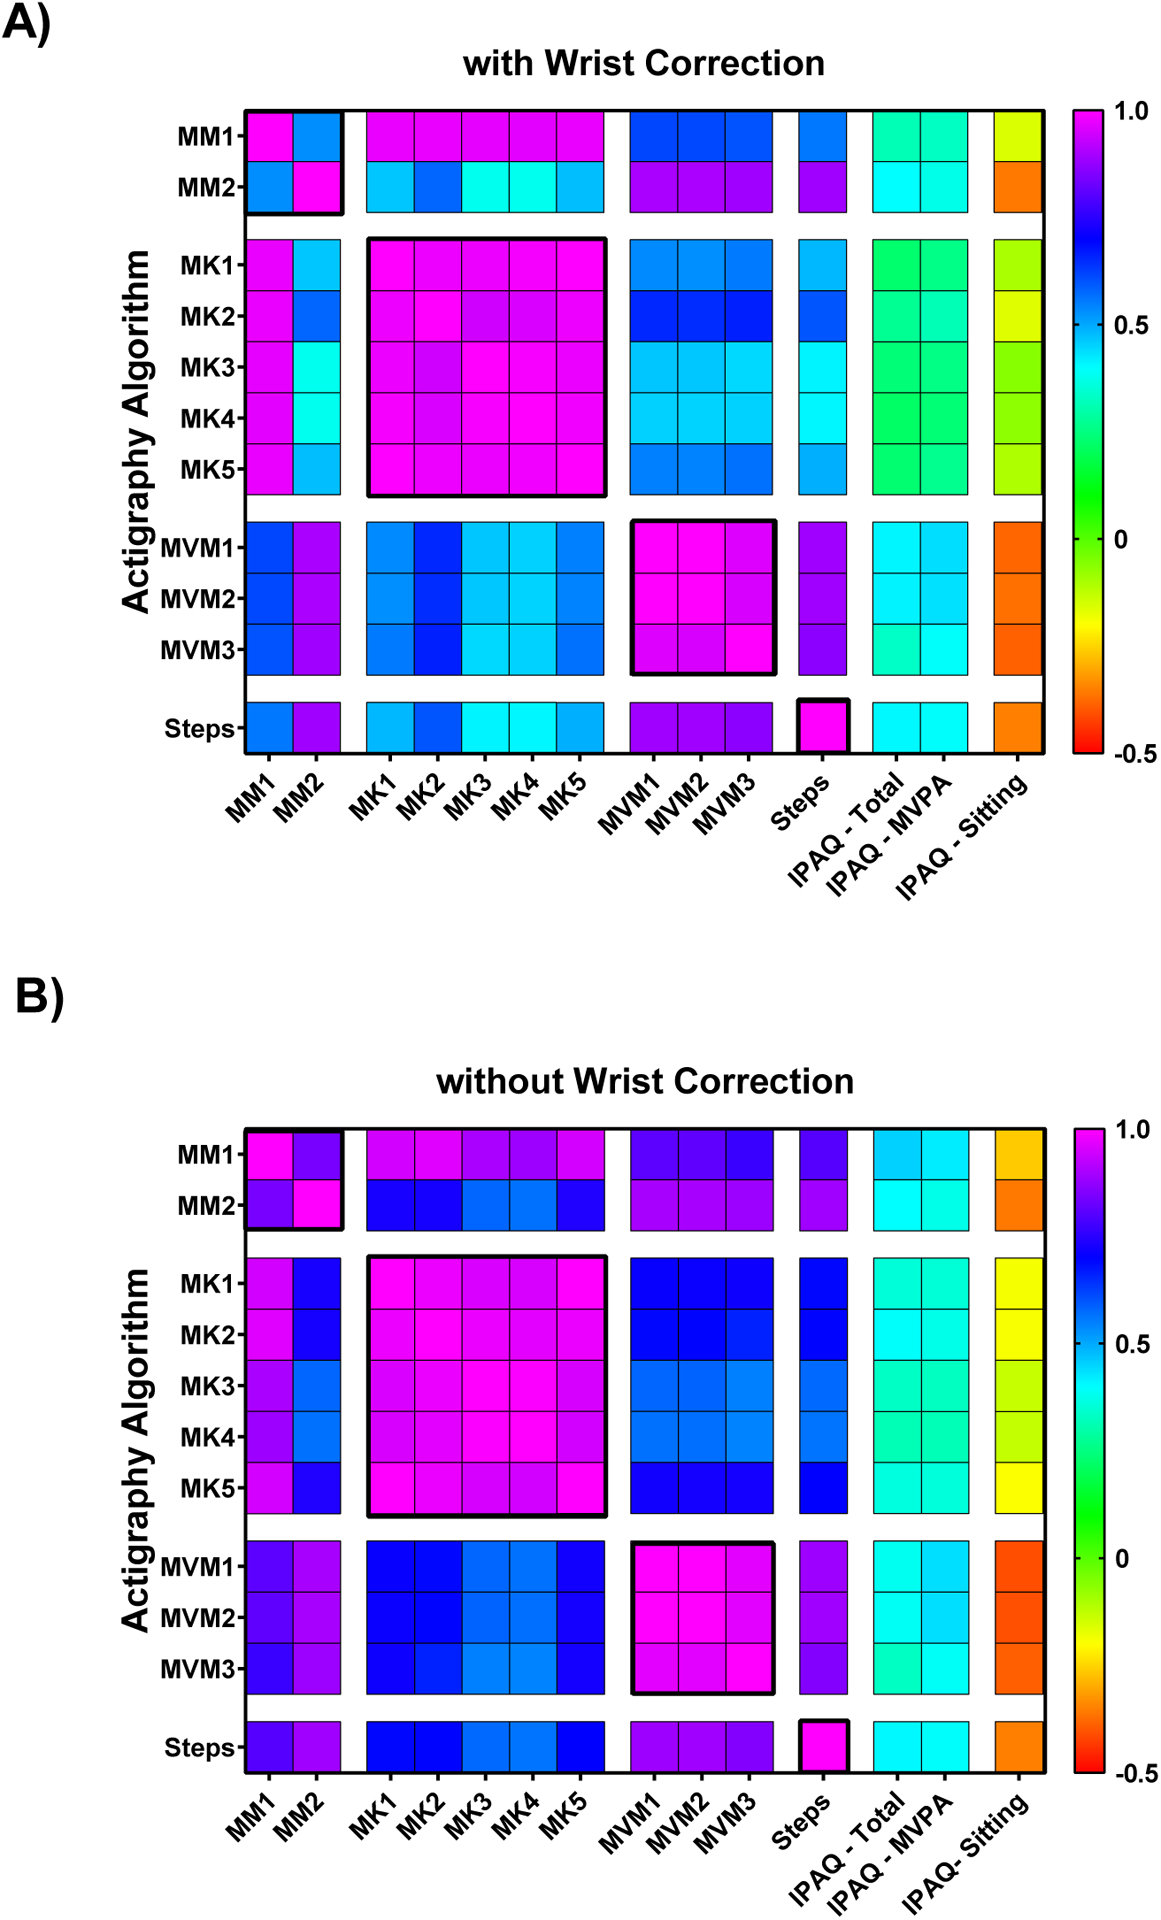
Heat maps representing the Spearman’s ρ correlation coefficients between each algorithm assessed within and between each PA outcome domain: daily energy expenditure (EE, MM1–MM2); active EE (MK1–MK5); time spent in MVPA (MVM1–MVM3); and steps. PA outcomes were also correlated with self–reported PA metrics including: IPAQ total MET×min/week; minutes of MVPA; and average daily minutes spent sitting. These are presented A) with and B) without the wrist correction.
Self–reported total activity and MVPA showed small to moderate positive associations with objective PA estimates (figure 5). Whereas, self-reported sitting time was negatively correlated with several accelerometry measures including MVPA, steps, and one daily EE algorithm (figure 5). Correlations between objective and self-reported PA typically declined with the wrist correction, particularly for EE outcomes (figure 5a vs. 5b, and figure S2.3A in Supplemental Materials 2). The correlations between EE and MVPA or step estimates were nearly as poor with the wrist correction applied as seen otherwise between objective and self–reported PA. Correlations between objective and self-reported PA decreased only slightly across all domains with the LFE (figure S2.3, Supplemental Materials 2).
Between–Subject Factors
Sex and age had no significant effect on, or interaction with, any PA outcome assessed (p > 0.05; see table S2.1, Supplemental Materials 2 for specific p–values). Similarly, no significant effect or interaction was observed involving BW for MVPA or step estimates (p > 0.05). In contrast, BW significantly affected active EE estimates (p < 0.05). This BW effect further differed with and without wrist correction and LFE across algorithms (p < 0.05, table S2.1).
DISCUSSION
While several studies have documented disparities in PA outcomes between analysis algorithms, this is the first to consider objective PA measurement effects across multiple domains, while simultaneously considering additional filtering options like the LFE and wrist correction. The primary finding of this study is that the measurement of lifestyle PA is highly algorithm–dependent, with the LFE and wrist correction producing disparate effects across PA domains. We see activity estimates vary across algorithms by as much as 333 ± 237% despite having used the same raw data and analysis software. The LFE substantially increased step estimates alone, whereas the wrist correction consistently reduced all active EE (kCals), one of two daily EE, and MVPA estimates. This contrasts our initial hypothesis that larger, consistent differences would result from the wrist correction and LFE, with a comparatively smaller effect due to algorithm choice.
Algorithm Choice
Our results are consistent with previously identified variations in EE and MVPA estimates, across multiple algorithms, in both laboratory and lifestyle settings (Brond and Arvidsson, 2016, Cain et al., 2013, Choi et al., 2011, Ellingson et al., 2017, Feito et al., 2017, Hildebrand et al., 2014, Kerr et al., 2017, Lyden et al., 2011, Mâsse et al., 2005, Sallis and Owen, 1999, Sasaki et al., 2011, Staudenmayer et al., 2015, Troiano et al., 2008, Troiano et al., 2014, Tudor-Locke et al., 2015, Youngwon et al., 2012). However, our current study advances previous findings by demonstrating that the effect of algorithm choice is conjunctly influenced by commonly available filter/corrective options. Thus, there is not necessarily a single correction that may be applied to compare the results of different studies, the process of which becomes even more complicated if algorithm choice is not specified. These collective findings suggest that caution should be taken when comparing accelerometry outcomes between studies, even if identical analysis platforms are used. Such variation further questions the validity of comparing objective PA estimates to absolute standards or meeting guidelines like 2 000 kCal day−1 (Blendon, 1981), 8 000–10 000 steps day−1 (Tudor-Locke et al., 2008), or 150 minutes of MVPA week−1 (Piercy et al., 2018) as objective PA measures themselves may differ by 50–200%.
Correlations between objective PA domains, under some analysis conditions, were nearly as low as those observed between objective and self–reported PA. Yet, strong correlations between equations within each domain suggest that, while absolute point estimates remain inconsistent, each algorithm can identify participants with lower and higher activity levels relative to each other. Although large absolute differences in PA estimates sometimes occurred, overall convergent validity between objective PA domains and self–reported PA metrics was apparent. That is, objective domains were positively inter-corrected with each other and with self–reported MVPA and total activity. Further, self–reported sedentary behavior (i.e. sitting time) was negatively related to most objective PA estimates. Thus, despite the absolute differences in PA estimates observed with disparate method selection, these approaches may be best used to detect PA changes when employed longitudinally.
Wrist Correction
Although the use of a wrist correction factor will likely decline as new wrist–based algorithms are developed, users meanwhile may assume that checking the “worn on wrist” option in ActiLife provides more accurate PA estimates. have reported that wrist–worn accelerometers typically yield greater accelerations and counts than those worn at the hip (Hildebrand et al., 2014, Kerr et al., 2017, LaMunion et al., 2017, Sallis and Owen, 1999, Troiano et al., 2014, Tudor-Locke et al., 2015, Cooke et al., 2018), we are not aware of any which have confirmed an appropriate relationship or explicitly validated any scaling method.
The lack of a clearly defined relationship between hip- and wrist-based measures may be due to acceleration profiles that vary with activity. For example, accelerometer outputs for two different accelerometers were only 5 – 17% higher at the wrist than the hip, as computed from mean data reported by (Hildebrand et al., 2014). When running or climbing stairs, this difference rose moderately to 23 – 64% higher for the wrist (Hildebrand et al, 2014). However, for a series of activities that disproportionately required upper body movements, such as writing, moving items on a bookshelf etc., wrist accelerations averaged 188–241% higher than the hip. Although cumulative lifestyle PA is typically dominated by walking activities, small discrepancies between hip and wrist measurements while walking are indeed lower than mean errors induced by the wrist correction (~10 – 50%). Conversely and surprisingly, while studies have consistently observed greater step estimates when assessed at the wrist than when worn at the hip (Hildebrand et al., 2014, Kerr et al., 2017, LaMunion et al., 2017, Sallis and Owen, 1999, Troiano et al., 2014, Tudor-Locke et al., 2015), we found that step counts in ActiLife were completely insensitive to the wrist correction.
On the other hand, when estimating vigorous intensities, the wrist correction proved to be overly conservative. Zero time spent in vigorous activity was observed in any subject (even in highly active individuals) with the wrist correction. The wrist correction demonstrates inconsistent effects across PA domains, differences that exceed prior wrist to hip discrepancies during walking, and reductions in associations with self-reported PA. This suggests that the wrist correction is not necessarily superior to simply using wrist–worn data in hip–based algorithms, despite the inherent risk of then overestimating absolute PA metrics for some activities.
It remains unclear how successful a wrist-to-hip transformation could be. Given the popularity and convenience of obtaining data from wrist–worn devices and self–report (Ellingson et al., 2017, Hildebrand et al., 2014, Kerr et al., 2017, LaMunion et al., 2017, Sallis and Owen, 1999, Troiano et al., 2014, Tudor-Locke et al., 2015) future studies should be directed at developing and validating wrist–specific EE, MVPA and step algorithms. However, it is unlikely that this will fully remedy the potential for large variation between algorithms as identified in the current investigation. For example, Ellingson et. al. (2017) found large differences in MET estimates across four different wrist–based algorithms, developed for this very reason, which are not yet available in commercial software.
Low Frequency Extension
Like past studies, we found that the LFE notably inflates step estimates and only minimally increases estimated time in MVPA (Cain et al., 2013, Feito et al., 2017, Tudor-Locke et al., 2015). We add to current knowledge in that the LFE showed only small increases in EE estimates, which has not been previously reported. Yet, arguably, the use of the LFE may be appropriately applied depending on the population under study. Tudor–Locke et al. (2015) indeed found that the LFE gave more accurate step counts at low walking speeds (referent measures obtained by direct observation), suggesting that the LFE is more appropriate for populations with slow ambulation (i.e. elderly or patient cohorts). However, it is not clear whether it is appropriate to use the LFE selectively, when investigating a mixed population where only some participants may exhibit slow ambulation, as the LFE clearly alters PA measurement. Further, it seems questionable that our patient population averaged 20 458 ± 5 298 steps day−1 with the LFE. Even without the LFE, average steps day−1 exceeded 11 600 ± 3 476, which surpasses national averages (Tudor-Locke et al., 2008). While our experiment does not aim to validate the LFE, it does suggest that whether the LFE is indeed appropriate must be carefully considered in future studies. It is unclear whether comparisons between cohorts would remain valid if the LFE is applied only for select patients who meet arbitrarily defined age and/or health status requirements. However, this issue is of importance only when step counts are a primary measurement outcome, as other PA domains were relatively insensitive to the LFE.
Interactions and Application to Practice
While numerous studies report isolated accelerometer PA measurement comparisons in laboratory or lifestyle environments, our study is novel as it evaluates interactions between algorithm choice, the wrist correction, and the LFE across multiple PA outcome domains. Our results demonstrate interdependence between analysis options and inconsistent effects across domains which have not been previously identified. These findings were independent of sex or age, with BW only proving to be important when estimating active EE, which inherently employs BW in governing equations. The combined influence of these variables produces greater differences across EE and MVPA outputs than any isolated filter, correction, or algorithm in this study or in past literature (Cain et al., 2013, Feito et al., 2017, Hildebrand et al., 2014, Kerr et al., 2017, LaMunion et al., 2017, Lyden et al., 2011, Mâsse et al., 2005). The potential for scoring bias has therefore been historically underestimated in making comparisons between studies whose methods vary across multiple factors.
The importance of appropriately selecting and thoroughly documenting accelerometry options has not been sufficiently appreciated in the past (Montoye et al., 2018). The use of objective PA estimates seems to, at times, be sufficiently valued such that minimal additional details are provided. For instance, some studies simply report “using manufacturers’ software” (Martin et al., 2011), “using a conservative approach, in which activity counts… were assessed” (Rosenkilde et al., 2012), or “using dedicated software” when describing measurement methodology (Nishizawa et al., 2016). Our study indicates that those who use accelerometry in performance, research, or clinical settings should be well–informed of the inherent variability between methods, how this translates to accurate result interpretation, and that point–estimates of PA metrics are not seamlessly comparable to other literature or PA guidelines.
Limitations
While this study uniquely demonstrates the potential for large influences of multiple analysis options on four PA outcome domains, results may not generalize to all present and/or future algorithms, corrective filters, or additional device considerations. Other factors like accelerometer brand (Cain et al., 2013, Feito et al., 2017, Hildebrand et al., 2014, Lyden et al., 2011, Sallis and Owen, 1999, Sasaki et al., 2011, Troiano et al., 2014), sampling frequency (Brond and Arvidsson, 2016), wear location (LaMunion et al., 2017), wear–time validation filters (Choi et al., 2011), and heart rate EE validation were not assessed in this study despite prior evidence of their influence on PA estimates (Cain et al., 2013, Lyden et al., 2011, Sallis and Owen, 1999, Sasaki et al., 2011, Troiano et al., 2014). New raw acceleration regression and machine learning/decision–tree models are continually being developed (Ellingson et al., 2017, Kerr et al., 2017, Staudenmayer et al., 2015, Troiano et al., 2014); though increasingly popular, none were available in ActiLife at the time of this study so were not considered. While some techniques we evaluated will become dated, they are not obsolete; the results of this study will therefore help when interpreting PA data from prior studies that use these methods. Thus, it is important to understand how evidence of processing variability complicates comparisons between accelerometer outcomes in literature and with absolute standards (Montoye et al., 2018).
CONCLUSIONS
While accelerometry remains a common way to measure PA, large and inconsistent differences between previously validated scoring methods (measuring active EE, daily EE, MVPA, and step counts) nonetheless exist. We conclude that PA estimates, despite prior validation, cannot be considered interchangeably and the use of the wrist correction should not be applied without careful consideration. Our results highlight the critical influence of analysis methodology on processing raw accelerometer data across PA domains, with differences being amplified when multiple factors are considered simultaneously. Accordingly, it is paramount that accelerometry scoring methods are clearly reported in literature—even when using commercial software. Although accelerometer measures of lifestyle PA provide objective and thus unbiased estimates, absolute differences can exceed 100%. This limits the validity of comparisons between studies or with absolute PA standards, but not when comparing groups within studies or longitudinally. Influential factors and limitations affecting objective PA analyses should therefore be carefully considered when using accelerometry to assess lifestyle behavior.
Supplementary Material
Supplemental Materials 1. ActiLife Interface and Equations.pdf
Supplemental Materials 2. Expanded Results.pdf
ACKNOWLEDGEMENTS
The authors affirm that they have no involvements in or financial affiliations with any commercial organization having a direct interest in any matter included in this manuscript. The authors were supported in part by funding from the University of Iowa Center for Research by Undergraduates Fellowship, the University of Iowa Department of Physical Therapy & Rehabilitation Science, and the United States Army. The use of the electronic data collection interface (REDCap) was supported by the National Center for Advancing Translational Sciences of the National Institutes of Health under Award Number UL1TR002537. We extend special thanks to the following individuals for their assistance with data collection: Dan Wang, Charles Paul, Emma Grimann, and Christopher DeBlois. The views and content expressed are those of the author(s) and do not necessarily reflect the official views of the University of Iowa, the U.S. Department of the Army, or the U.S. Department of Defense. Results of the present study and any mention of trade names, commercial products, or organizations does not imply endorsement by the University of Iowa or the U.S. Government.
Footnotes
ETHICAL STATEMENT
All subjects provided written informed consent as approved by the University of Iowa’s Institutional Review Board prior to any data collection.
REFERENCES
- ACTIGRAPH 2019. ActiGraph Documentation [Online]. ActiGraph: Actigraph, LLC. Available: https://actigraphcorp.force.com/support/s/topic/0TO0Z000000sZgRWAU/documentation [Accessed 6 April 2018]. [Google Scholar]
- BLENDON RJ 1981. Public Health versus Personal Medical Care. N Engl J Med, 304, 981–983. [DOI] [PubMed] [Google Scholar]
- BROND JC & ARVIDSSON D 2016. Sampling frequency affects the processing of Actigraph raw acceleration data to activity counts. J Appl Physiol, 120, 362–369. [DOI] [PubMed] [Google Scholar]
- CAIN KL, CONWAY TL, ADAMS MA, HUSAK LE & SALLIS JF 2013. Comparison of older and newer generations of ActiGraph accelerometers with the normal filter and the low frequency extension.(Report). Int J Behav Nutr Phys Act, 10. [DOI] [PMC free article] [PubMed] [Google Scholar]
- CHOI L, LIU Z, MATTHEWS CE & BUCHOWSKI MS 2011. Validation of accelerometer wear and nonwear time classification algorithm. Med Sci Sports Exerc, 43, 357–364. [DOI] [PMC free article] [PubMed] [Google Scholar]
- COMPENDIUM 2011. Compendium of Physical Activities [Online]. University of Arizona and National Cancer Institute. Available: https://sites.google.com/site/compendiumofphysicalactivities/ [Accessed April 04 2018]. [Google Scholar]
- COOKE AB, DASKALOPOULOU SS & DASGUPTA K 2018. The impact of accelerometer wear location on the relationship between step counts and arterial stiffness in adults treated for hypertension and diabetes. J Sci Med Sport, 21, 398–403. [DOI] [PubMed] [Google Scholar]
- CRAIG CL, MARSHALL AL, SJOSTROM M, BAUMAN AE, BOOTH ML, AINSWORTH BE, PRATT M, EKELUND U, YNGVE A, SALLIS JF & OJA P 2003. International physical activity questionnaire: 12-country reliability and validity. Med Sci Sports Exerc, 35, 1381–95. [DOI] [PubMed] [Google Scholar]
- CROUTER SE, KUFFEL E, HAAS JD, FRONGILLO EA & BASSETT DR JR. 2010. Refined two-regression model for the ActiGraph accelerometer. Med Sci Sports Exerc, 42, 1029–37. [DOI] [PMC free article] [PubMed] [Google Scholar]
- ELLINGSON LD, HIBBING PR, KIM Y, FREY-LAW LA, SAINT-MAURICE PF & WELK GJ 2017. Lab-based validation of different data processing methods for wrist-worn ActiGraph accelerometers in young adults. Physiol Meas, 38, 1045–1060. [DOI] [PubMed] [Google Scholar]
- ELLINGSON LD, HIBBING PR, WELK GJ, DAILEY D, RAKEL BA, CROFFORD LJ, SLUKA KA & FREY-LAW LA 2019. Choice of Processing Method for Wrist-Worn Accelerometers Influences Interpretation of Free-Living Physical Activity Data in a Clinical Sample. J Meas Phys Behav, 2, 228–236. [Google Scholar]
- FEITO Y, HORNBUCKLE LM, REID LA & CROUTER SE 2017. Effect of ActiGraph’s low frequency extension for estimating steps and physical activity intensity. PLoS One, 12, e0188242. [DOI] [PMC free article] [PubMed] [Google Scholar]
- FREEDSON PS, MELANSON E & SIRARD J 1998. Calibration of the Computer Science and Applications, Inc. accelerometer. Med Sci Sports Exerc, 30, 777–81. [DOI] [PubMed] [Google Scholar]
- FREY LAW L 2020. Physical Activity Estimates using Actilife and IPAQ, 10.7910/DVN/MHZT7W, Harvard Dataverse, V1, UNF:6:bc1GkCMjhtg8q/mz39Uuqw== [fileUNF] [DOI]
- HAGSTROMER M, OJA P & SJOSTROM M 2006. The International Physical Activity Questionnaire (IPAQ): a study of concurrent and construct validity. Public Health Nutr, 9, 755–62. [DOI] [PubMed] [Google Scholar]
- HILDEBRAND M, VAN HEES VT, HANSEN BH & EKELUND U 2014. Age group comparability of raw accelerometer output from wrist- and hip-worn monitors. Med Sci Sports Exerc, 46, 1816–24. [DOI] [PubMed] [Google Scholar]
- HORNER F, BILZON JL, RAYSON M, BLACKER S, RICHMOND V, CARTER J, WRIGHT A & NEVILL A 2013. Development of an accelerometer-based multivariate model to predict free-living energy expenditure in a large military cohort. J Sports Sci, 31, 354–60. [DOI] [PubMed] [Google Scholar]
- IPAQ 2010. IPAQ Scoring Protocol [Online]. Google Sites. Available: https://sites.google.com/site/theipaq/scoring-protocol [Accessed April 2018]. [Google Scholar]
- KAMDAR BB, KADDEN DJ, VANGALA S, ELASHOFF DA, ONG MK, MARTIN JL & NEEDHAM DM 2017. Feasibility of Continuous Actigraphy in Patients in a Medical Intensive Care Unit. Am J Crit Care, 26, 329–335. [DOI] [PMC free article] [PubMed] [Google Scholar]
- KERR J, MARINAC CR, ELLIS K, GODBOLE S, HIPP A, GLANZ K, MITCHELL J, LADEN F, JAMES P & BERRIGAN D 2017. Comparison of Accelerometry Methods for Estimating Physical Activity. Med. Sci. Sports Exerc, 49, 617–624. [DOI] [PMC free article] [PubMed] [Google Scholar]
- KOWALSKI K, RHODES R, NAYLOR PJ, TUOKKO H & MACDONALD S 2012. Direct and indirect measurement of physical activity in older adults: a systematic review of the literature. Int J Behav Nutr Phys Act, 9, 148. [DOI] [PMC free article] [PubMed] [Google Scholar]
- LAMUNION SR, BASSETT DR, TOTH LP & CROUTER SE 2017. The effect of body placement site on actigraph wgt3x-bt activity counts. Biomed Phys Eng Express, 3, 035026. [Google Scholar]
- LYDEN K, KOZEY SL, STAUDENMEYER JW & FREEDSON PS 2011. A comprehensive evaluation of commonly used accelerometer energy expenditure and MET prediction equations. Eur J Appl Physiol, 111, 187–201. [DOI] [PMC free article] [PubMed] [Google Scholar]
- MARTIN CK, DAS SK, LINDBLAD L, RACETTE SB, MCCRORY MA, WEISS EP, DELANY JP & KRAUS WE 2011. Effect of calorie restriction on the free-living physical activity levels of nonobese humans: results of three randomized trials. J Appl Physiol, 110, 956–963. [DOI] [PMC free article] [PubMed] [Google Scholar]
- MERKLE S 2016. Exploring pain & movement relationships: is greater physical activity associated with reduced pain sensitivity & does endogenous muscle pain alter protective reflexes in the upper extremity? In: LAURA AFL, BARBARA AR, JOHN CS, RICHARD KS & KATHLEEN AS (eds.). University of Iowa. [Google Scholar]
- MONTOYE AHK, MOORE RW, BOWLES HR, KORYCINSKI R & PFEIFFER KA 2018. Reporting accelerometer methods in physical activity intervention studies: a systematic review and recommendations for authors. Br J Sports Med, 52, 1507. [DOI] [PubMed] [Google Scholar]
- MÂSSE CL, FUEMMELER FB, ANDERSON BC, MATTHEWS EC, TROST GS, CATELLIER JD & TREUTH JM 2005. Accelerometer Data Reduction: A Comparison of Four Reduction Algorithms on Select Outcome Variables. Med Sci Sports Exerc, 37, S544–S554. [DOI] [PubMed] [Google Scholar]
- NISHIZAWA H, SHIBA N & NAKAMURA A 2016. Usefulness of continuous actigraph monitoring in the assessment of the effect of corticosteroid treatment for Duchenne muscular dystrophy: a case report. J Phys Ther Sci, 28, 3249–3251. [DOI] [PMC free article] [PubMed] [Google Scholar]
- OTTEVAERE C, HUYBRECHTS I, DE BOURDEAUDHUIJ I, SJÖSTRÖM M, RUIZ JR, ORTEGA FB, HAGSTRÖMER M, WIDHALM K, MOLNÁR D, MORENO LA, BEGHIN L, KAFATOS A, POLITO A, MANIOS Y, MÁRTINEZ-GÓMEZ D & DE HENAUW S 2011. Comparison of the IPAQ-A and actigraph in relation to VO2max among European adolescents: the HELENA study. J Sci Med Sport, 14, 317–24. [DOI] [PubMed] [Google Scholar]
- PIERCY K, TROIANO R, BALLARD RM, CARLSON SA, FULTON J, GALUSKA D, GEORGE SM & OLSON RD 2018. The Physical Activity Guidelines for Americans. JAMA-J. Am. Med. Assoc, 320, 2020–2028. [DOI] [PMC free article] [PubMed] [Google Scholar]
- PRINCE SA, ADAMO KB, HAMEL ME, HARDT J, CONNOR GORBER S & TREMBLAY M 2008. A comparison of direct versus self-report measures for assessing physical activity in adults: a systematic review. Int J Behav Nutr Phys Act, 5, 56. [DOI] [PMC free article] [PubMed] [Google Scholar]
- ROSENKILDE M, AUERBACH P, REICHKENDLER MH, PLOUG T, MERETE STALLKNECHT B & SJÖDIN A 2012. Body fat loss and compensatory mechanisms in response to different doses of aerobic exercise—a randomized controlled trial in overweight sedentary males. Am J Physiol Regul Integr Comp Physiol, 303, R571–R579. [DOI] [PubMed] [Google Scholar]
- SALLIS JF & OWEN N 1999. Measuring Physical Activity. Behavioral Medicine & Health Psychology 3: Physical Activity & Behavioral Medicine: Thousand Oaks, CA SAGE Publications, Inc. [Google Scholar]
- SASAKI JE, JOHN D & FREEDSON PS 2011. Validation and comparison of ActiGraph activity monitors. J Sci Med Sport, 14, 411–6. [DOI] [PubMed] [Google Scholar]
- SATO K, SMITH SL & SANDS WA 2009. Validation of an accelerometer for measuring sport performance. J Strength Cond Res, 23, 341–7. [DOI] [PubMed] [Google Scholar]
- STAUDENMAYER J, HE S, HICKEY A, SASAKI J & FREEDSON P 2015. Methods to estimate aspects of physical activity and sedentary behavior from high-frequency wrist accelerometer measurements. J Appl Physiol (1985), 119, 396–403. [DOI] [PMC free article] [PubMed] [Google Scholar]
- TROIANO RP, BERRIGAN D, DODD KW, MASSE LC, TILERT T & MCDOWELL M 2008. Physical activity in the United States measured by accelerometer. Med Sci Sports Exerc, 40, 181–8. [DOI] [PubMed] [Google Scholar]
- TROIANO RP, MCCLAIN JJ, BRYCHTA RJ & CHEN KY 2014. Evolution of accelerometer methods for physical activity research. Br J Sports Med, 48, 1019. [DOI] [PMC free article] [PubMed] [Google Scholar]
- TUDOR-LOCKE C, BARREIRA T & SCHUNA J 2015. Comparison of Step Outputs for Waist and Wrist Accelerometer Attachment Sites. Med Sci Sports Exerc, 47, 839–842. [DOI] [PubMed] [Google Scholar]
- TUDOR-LOCKE C, HATANO Y, PANGRAZI RP & KANG M 2008. Revisiting “How Many Steps Are Enough?”. Med Sci Sports Exerc, 40, S537–S543. [DOI] [PubMed] [Google Scholar]
- YOUNGWON K, BEETS M & WELK G 2012. Everything you wanted to know about selecting the “right” Actigraph accelerometer cut-points for youth, but a systematic review. J Sci Med Sport, 15, 311–321. [DOI] [PubMed] [Google Scholar]
Associated Data
This section collects any data citations, data availability statements, or supplementary materials included in this article.
Supplementary Materials
Supplemental Materials 1. ActiLife Interface and Equations.pdf
Supplemental Materials 2. Expanded Results.pdf