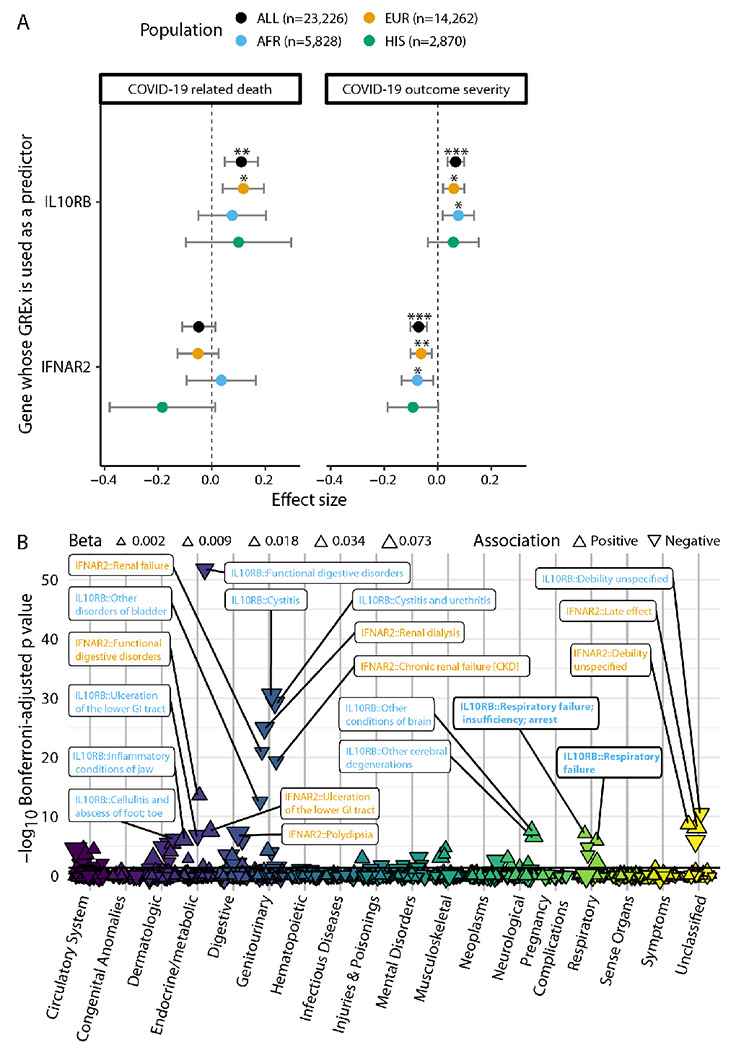
Figure 3. Association of blood IL10RB and IFNAR2 GReX with COVID-19 related outcomes and non COVID-19 phenotypes.

Panel A. GReX of IL10RB and IFNAR2 is imputed in 23,216 individuals in the MVP cohort for whom COVID-19 outcome severity information is available. For COVID-19 related death (left panel) we check the association of GReX with the outcome of COVID-19 related death (4.8% of this cohort) under logistic regression models for IL10RB and IFNAR2 GReX while adjusting for age, sex, Elixhauser’s comorbidity score and ancestry-specific population structure. For COVID-19 outcome severity, we applied an ordinal regression model (same predictors and covariates as above) using an outcome scale corresponding to mild (74.9% of the cohort), moderate (17%), severe (3.2%) COVID-19 related outcomes and death (4.8%). EUR, AFR and HIS refer to harmonized European, African and Hispanic ancestry respectively and the sample sizes are provided in the legend at the top. For both panels, the population of Asian ancestry (n = 266) is included in the fixed effects meta-analysis (Population: “ALL” in the graph) but not plotted. ***, ** and * correspond to Bonferroni-adjusted association p values (for ngenes × noutcomes for each population cohort) of equal or less than 0.001, 0.01 and 0.05 respectively. Panel B. PheWAS of IL10RB and IFNAR2 blood GReX for individuals of European descent in the MVP cohort (n=296,407). Phenotypes are grouped in categories shown in the x-axis, y-axis represents −log10(Bonferroni-adjusted p values). The data points are triangles that face to the top or bottom for positive and negative association with GReX respectively; the magnitude of the effect size is represented by the triangle size and the color corresponds to the phenotype category. Only the top 20 associations are labeled (orange for IFNAR2 and blue for IL10RB); full results are provided in Supplementary Appendix 10. Horizontal black line corresponds to Bonferroni-adjusted p = 0.05.
