

Abstract
Dishevelled (DVL) critically regulates Wnt signaling and contributes to a wide spectrum of diseases and is important in normal and pathophysiological settings. However, how it mediates diverse cellular functions remains poorly understood. Recent discoveries have revealed that constitutive Wnt pathway activation contributes to breast cancer malignancy, but the mechanisms by which this occurs are unknown and very few studies have examined the nuclear role of DVL. Here, we have performed DVL3 ChIP‐seq analyses and identify novel target genes bound by DVL3. We show that DVL3 depletion alters KMT2D binding to novel targets and changes their epigenetic marks and mRNA levels. We further demonstrate that DVL3 inhibition leads to decreased tumor growth in two different breast cancer models in vivo. Our data uncover new DVL3 functions through its regulation of multiple genes involved in developmental biology, antigen presentation, metabolism, chromatin remodeling, and tumorigenesis. Overall, our study provides unique insight into the function of nuclear DVL, which helps to define its role in mediating aberrant Wnt signaling.
Keywords: breast cancer, ChIP‐seq, DVL, epigenetics, Wnt
Subject Categories: Cancer; Chromatin, Epigenetics, Genomics & Functional Genomics; Signal Transduction
This study identifies novel gene targets of nuclear Dishevelled 3 and shows that DVL3 depletion decreases binding of the histone methyltransferase KMT2D, thereby altering epigenetic marks and mRNA levels of target genes and decreasing tumor growth.

Introduction
DVL plays a critical role in disease and developmental disorders, but its complex mechanisms of action remain poorly understood (Mlodzik, 2016; Gentzel & Schambony, 2017; Sharma et al, 2018). Wnt signaling is frequently altered in disparate pathologies due to a disruption in the normal pattern of Wnt ligand expression which results in dysregulated and constitutive signals transmitted across the plasma membrane. DVL integrates and transmits these signals arising from aberrant expression of Wnt ligands, antagonists, and membrane receptors (Gammons & Bienz, 2018; Sharma & Pruitt, 2020). Although DVL relays Wnt signals under normal and pathophysiological conditions, much remains unknown about the function of nuclear DVL. DVL has been studied primarily as a cytoplasmic scaffold which promotes processes such as β‐catenin stabilization (Gao & Chen, 2010) or cell migration (Saxena et al, 2015). However, seminal studies show that nuclear localization of DVL is important even for canonical signaling (Itoh et al, 2005; Gan et al, 2008; Simmons et al, 2014; Wang et al, 2015). We were the first to report that novel post‐translational lysine acetylation of DVL‐1 serves as a novel regulatory switch to promote its nuclear localization (Sharma et al, 2019). Limited reports demonstrated that DVL binds to the promoters of four Wnt target genes such as cMyc, BMP4, cyclinD1, and/or FZD7 (Gan et al, 2008; Simmons et al, 2014), but beyond the identity of these classic Wnt target genes which have been known for many years, virtually nothing is known about the genes bound by DVL. Moreover, our previous study identified another novel DVL target gene, CYP19A1, which encodes aromatase and had not been previously linked with Wnt signaling (Castro‐Piedras et al, 2018). In this study, we also observed an enrichment of H3K4me3, a mark associated with active transcription, relative to H3K27me3, a mark associated with transcriptional repression at CYP19A1 promoters where DVL3 bound (Castro‐Piedras et al, 2018). The methylation of H3 at the lysine 4 position (H3K4) is a well‐studied mark of transcriptional activity at regulatory regions like enhancers and promoters (Gardner et al, 2011). There are several enzymes responsible for the methylation of H3K4, which belong to the family of histone‐lysine methyltransferases (KMTs) (Allis et al, 2007; Pruitt, 2016). It has been reported that these enzymes may have redundant functions in the methylation of H3K4. For example, only 5% of H3K4me3 on promoters is generated by KMT2A (Vallianatos & Iwase, 2015), while KMT2D is required to maintain broad H3K4me3 super‐enhancer signals (Dhar et al, 2018). Similarly to DVL3, KMT2D functions in cell development, differentiation, cell migration, and tumor progression (Guo et al, 2013; Froimchuk et al, 2017).
For a more comprehensive analysis of DVL nuclear function, we set out to identify novel DVL target genes. Since DVL shows nuclear localization in breast cancer cells (Dass et al, 2016; Castro‐Piedras et al, 2018) and mediates oncogenic signaling, we conducted the first DVL3 ChIP‐seq to identify novel gene targets in breast cancer cell lines. Our study shows that DVL3 localizes to both promoter and enhancer regulatory regions and differentially regulates novel gene targets involved in a number of processes including developmental biology, T‐cell mediated immunity, and tumorigenesis. In loss‐of‐function studies, we show that DVL governs cell growth properties in vitro and in vivo. Additionally, bioinformatics analyses identify potential transcription factors which could be involved in DVL3‐mediated transcriptional regulation. Furthermore, we show binding of DVL to a chromatin‐modifying enzyme, KMT2D, and establish a role for DVL3 in H3K4 methylation. Hence, this study uncovers novel DVL targets and reveals a role in regulating epigenetic marks that are important for chromatin structure at transcription regulatory regions. Furthermore, this study addresses a critical question in the field regarding the role of nuclear DVL (Habas & Dawid, 2005; Weitzman, 2005) and reveals a surprisingly broader scope of DVL function (Torres & Nelson, 2000; Dass et al, 2016; Mlodzik, 2016) in cancer models.
Results
Nuclear DVL3 binding is enriched on specific motif sequences
During mammary gland development, Wnt signaling is tightly regulated (Gavin & McMahon, 1992). While aberrant Wnt signaling has been observed in various cancer types (Liu et al, 2008; Xu et al, 2008; Akiri et al, 2009), much remains unknown about its contribution to breast cancer (Bafico et al, 2004; Benhaj et al, 2006; Schlange et al, 2007), where the constitutive Wnt signaling is frequently observed (Pruitt et al, 2006; Matsuda et al, 2009). DVL transmits signals from multiple Wnt ligands, receptors, and co‐receptors to regulate critical cellular processes (Sharma et al, 2018). Recently, we and others demonstrated that DVL translocates to the nucleus (Itoh et al, 2005; Gan et al, 2008; Castro‐Piedras et al, 2018); however, the role of nuclear DVL remains unclear. To investigate the novel nuclear roles of DVL, we selected two breast cancer cell lines: MCF7 and MDA‐MB‐468. These cell lines were chosen because (i) both lines possess constitutive autocrine signaling (Fig EV1A) and DVL3 contributes to oncogenic signaling in both MCF7 and MDA‐MB‐468 (Castro‐Piedras et al, 2018), (ii) both lines show high levels of nuclear DVL3 (Castro‐Piedras et al, 2018), (iii) MCF7 is a Tier 2 cell line for the ENCODE Project which allows us to compare our data with publicly available data, and iv) both lines represent two different BC subtypes, with MCF7 as an ER+ cell line and MDA‐MB‐468 as a triple‐negative cell line.
Figure EV1. Autocrine Wnt pathway activation in breast cancer cell lines.

RNA expression of selected Wnt ligands (WNT3A, WNT6, WNT4, and WNT7B) and Frizzled receptors (FZD7, FZD4, and FZD6) in human non‐cancer mammary epithelial cell line (MCF10A and MCF12F), breast cancer cell lines (MCF‐7 and MDA‐MB‐468), and colon carcinoma cell line (HCT116). A minus reverse transcriptase (−RT) control ensures no DNA contamination is present in the RNA preparation.
To examine the role of nuclear DVL3, we performed three independent DVL3 ChIP‐seq analyses in MDA‐MB‐468 and MCF7 cells. For the ChIP‐seq experiments, we used an IgG‐control ChIP‐seq dataset as a reference for peak selection which showed a robust reproducibility between experiments in both cell lines. We obtained a total of 12,162 peaks for DVL3 in MDA‐MB‐468 (all of them ≥ 2‐fold enrichment over IgG, intersecting 6,486 genes), and a total of 2,227 peaks for DVL3 in MCF7 (1848 filtered peaks, ≥ 2‐fold enrichment over IgG; intersecting 901 genes). Interestingly, 37.7% of the filtered MCF7 peaks overlapped with MDA‐MB‐468 peaks (Fig 1A). To identify the DNA motifs predictive of the association of DVL3 with the genome, we analyzed the genomic DNA sequences from DVL3‐binding peaks detected by ChIP‐seq analyses. All the peaks underwent MEME‐ChIP analysis to determine significant motifs that had a strong central enrichment among the DNA sequences for the ChIPs performed (Fig 1B for MDA‐MB‐468 cells, and 1C for MCF7 cells). To further investigate three specific sequence motifs enriched in DVL3 binding, we analyzed the novel DVL3 motifs identified in Fig 1C and D using the TOMTOM motif comparison tool. This in silico tool revealed similarity with some known transcription factor motifs like ZNF410, SOX1, SOX18, TEAD1, and TEAD3 for MDA‐MB‐468 (Fig EV2A) or STAT3, STAT1, Gfi, SOX1, SRY, SOX15, SOX3, SOX17, SOX9, and MEF2A transcription factors for MCF7 (Fig EV2A).
Figure 1. ChIP‐seq identified novel DVL3‐binding sequences.

-
AVenn diagram representing overlap of DVL3 ChIP‐seq peaks between MDA‐MB‐468 and MCF7 cells.
-
BMEME‐ChIP (Motif Analysis of Large Nucleotide Datasets) analysis of the DVL3 binding sites identified DVL3‐specific motifs in MDA‐MB‐468 cells: TGGAATGGAATGGAATGGAAT in 622 fragments with a P value = 3.1e‐4486, ATTCCATTCCATTC in 673 with a P value = 8.6e‐1868, and TTCCATTCCATTCCATTCCA in 605 fragments with a P value = 2.9e‐1614. The P value is the significance of the motif according to MEME, motif discovery program.
-
CMEME‐ChIP analysis of the DVL3‐binding sites identified DVL3‐specific motifs in MCF7 cells: CAGAAKVATTCTCAGAAACTYCTTTGTGA in 1394 fragments with a P value = 1.5e‐2815, GTGTGYRTTCAACTCACAGAGTTGAACSTT in 1143 fragments with a P value = 3.7e‐2478 and KGAAACACTCTTTTTGTAKAWTYTGCAAG in 1359 fragments with a P value = 9.4e‐2181. The P value is the significance of the motif according to MEME, motif discovery program.
-
D, EPie graph showing enriched pathways of ChIP hits for MDA‐MB‐468 (D) and MCF7 (E) cell lines generated by Reactome pathway analysis.
-
F, GBar graphs showing the −log10 P‐values for the Reactome terms of the most significant pathways enriched using binomial test in DVL3 ChIP‐seq for MDA‐MB‐468 (F) and MCF7 (G) cell lines.
Figure EV2. Co‐localization of ZBTB7B with respect to DVL3 genomic binding in breast cancer cells.

- Table of transcription factor motifs matching DVL3‐binding motif by TOMTOM analysis in MDA‐MB‐468 and MCF7 cell lines. The P‐value, e‐value, and q‐value were obtained with TOTOM software.
- DVL3 co‐immunoprecipitates ZBTB7B and vice versa in MCF7. IgG heavy chain (Hc) and light chain (Lc) were blotted for as a control for equal antibody capture for immunoprecipitation and whole cell extracts (WCE) as a positive control.
- An assembly of IgG (first row), DVL3 (second row), and ZBTB7B (third row) ChIP‐seq data in MCF7 for the RFX5‐GBAT2, GPD1‐COX14, MAST3, and HLA‐E genes, visualized by IGV.
- Venn diagram showing the overlap between MCF7 DVL3 ChIP‐seq peaks and ZBTB7B ChIP‐seq.
- ChIP experiments for Input, IgG, DVL3, and ZBTB7B were performed in MDA‐MB‐468 cells. Occupancy of DVL3 at three different genes (MAMDC2, DUX4, and SYNJ1) was analyzed by end‐point PCR.
- Western blot for DVL3 expression in NTC and shDVL3 KD in MDA‐MB‐468 and MCF7 cell lines.
Data information: (F) The membranes were probed with DVL‐3‐specific antibody (sc‐8027; Santa Cruz Biotechnology, Inc), and GAPDH was included as a control.
We set up a co‐IP screen to find possible transcription factors that may bind DVL3 and confirmed by co‐immunoprecipitation that the transcription factor ZBTB7B (Zinc Finger and BTB Domain Containing 7B) binds to DVL3 in the MCF7 cell line (Fig EV2B), indicating that DVL3 and ZBTB7B may be part of a transcription regulatory complex. Additionally, in MCF7 cells, we observed an overlap of 84% of the DVL3 peaks with published ZBTB7B ChIP‐seq data (39) (Fig EV2C and D). In MDA‐MB‐468 cells, we also observed by ChIP‐PCR, a co‐localization of DVL3 and ZBTB7B at MAMDC2 (MAM Domain Containing 2), DUX4 (Double Homeobox 4), and SYNJ1 (Synaptojanin 1) genes (Fig EV2E).
Pathway analysis based on the Reactome database indicates that the gene hits for both cell lines correspond mostly to the following pathways: immune system, signal transduction, metabolism, metabolism of proteins, and gene expression (Fig 1D for MDA‐MB‐468 cells and 1E for MCF7 cells). Interestingly, the pathways that were most significantly overrepresented in both cell lines are pathways associated with the regulation of or the interaction with the immune system. In general, in both cell lines, DVL localized to genes known to be involved in or known to regulate multiple aspects of antigen processing and presentation and peptide loading of class I MHC (Fig 1F and G). In MDA‐MB‐468 cells, we also observed significantly overrepresented other pathways related to interferon signaling, rRNA expression, TCF complex formation, DNA methylation, transcription, and polycomb repressive complex‐mediated methylation (Fig 1F). In contrast, in MCF7 the other pathways significantly overrepresented not associated with the immune system involved the regulation of potassium channels, ion exchangers, TP53‐linked transcription, and a host of other pathways dysregulated during tumorigenesis (Fig 1G).
DVL3 localizes to gene promoters and regulates their expression
We previously reported that DVL3 not only localizes to the nucleus of breast cancer cells, but also binds to aromatase promoters and regulates their transcription (Castro‐Piedras et al, 2018). To investigate further the genomic localization of the DVL3 ChIP‐seq hits, we used IGV track visualization of the bam files. We discovered that DVL3 localized in different promoter regions including, for example, ARAP1 (ArfGAP With RhoGAP Domain, Ankyrin Repeat And PH Domain 1), RFX5 (Regulatory Factor X5), GBAT2 (Glioblastoma Multiforme‐Associated Transcript 2), WDR74 (WD Repeat Domain 74), POU2F3 (POU Class 2 Homeobox 3), SNORD3D (Small Nucleolar RNA, C/D Box 3D), and HLA‐A (Major Histocompatibility Complex, Class I, A) in MDA‐MB‐468 cells and ARAP1, RFX5, GBAT2, ZNF672 (Zinc Finger Protein 672), SSC5D (Scavenger Receptor Cysteine Rich Family Member With 5 Domains), HLA‐A, and HLA‐E (Major Histocompatibility Complex, Class I, E) in MCF7 cells (Fig 2A for MDA‐MB‐468 cells and 2B for MCF7 cells).
Figure 2. DVL3 genomic binding in MDA‐MB‐468 and MCF7 cells.

- An assembly of IgG (first row) and DVL3 (second row) ChIP‐seq data in MDA‐MB‐468 for the ARAP1, RFX5‐GBAT2, WDR74, POU2F3, SNORD3D, and HLA‐A genes, visualized by IGV.
- An assembly of IgG (first row) and DVL3 (second row) ChIP‐seq data in MCF7 for the ARAP1, RFX5‐GBAT2, ZNF672, SSC5D, HLA‐A, and HLA‐E genes, visualized by IGV.
- ChIP‐qPCRs at ARAP1, RFX5‐GBAT2, WDR74, and HAUS5 promoters for IgG and DVL3 in MDA‐MB‐468 (NTC, shA DVL3, and shB DVL3).
- ChIP‐qPCRs at RFX5‐GBAT2, COX14, HLA‐E, and PSMB8 promoters for IgG and DVL3 in MCF7 (NTC, shA DVL3, and shB DVL3).
- RT–qPCR‐based analysis of expression changes of RFX5, GBAT2, WDR74, HCG15, POU2F3, SNORD3B, APOC1P1, HLA‐A, TAP1, PSMD8, PDG1, and JUNB genes in MDA‐MB‐468 (NTC, shA DVL3, and shB DVL3) cells.
- RT–qPCR‐based analysis of expression changes of RFX5, GBAT2, PCAT6, ZNF672, SSC5D, APOC1P1, HLA‐A, HLA‐F, and TAP1 genes in MCF7 (NTC, shA DVL3, and shB DVL3) cells.
Data information: For (A) and (B), each column is 4,000 bp wide. The third rows show the gene nearest to the ChIP‐seq alignment including its location, and orientation. The medium thick dark lines are the UTRs of the gene, and the thicker dark regions are exons followed by thin lines with arrows which are the introns. C and D panels show a representative ChIP‐qPCR of three independent ChIP‐qPCR experiments. For C and D panels, an independent t‐test was used for statistical comparison. *P < 0.05; n = 3, technical replicates; data show means ± SD. For E and F panels, transcript levels were normalized to actin transcript levels, an independent t‐test was used for statistical comparison. *P < 0.05; data show means ± SD, n = 3, biological replicates.
To validate further the binding of DVL3 to those regions, we developed DVL3 stable knockdown cell lines, using two short hairpin RNAs (shRNAs) that target different regions of DVL3 mRNA vs. a non‐targeting control (NTC). These cell lines have reduced expression of DVL3 (Fig EV2F), and ChIP‐qPCR confirmed reduced DVL3 binding in the DVL3‐shRNA cell lines compared with the NTC‐control cell lines (Fig 2C for MDA‐MB‐468 and 2D for MCF7).
Remarkably, the expression of GBAT2, WDR4, HCG15, POU2F3, APOC1P1, HLA‐A, TAP1, PSMD8, PDG1, and JUNB was reduced in DVL3‐depleted MDA‐MB‐468 cells, suggesting a role of DVL3 in the regulation of these genes. In contrast, the lncRNA SNORD3B was upregulated, suggesting that DVL3 acts as a repressor of this lncRNA (Fig 2E). In MCF7 cells, DVL3 depletion led to an upregulation of RFX5, GBAT2, PCAT6, SSC5D, APOC1P1, HLA‐A, HLA‐F, and TAP1 and a downregulation of HAUS5 and ZNF672 (Fig 2F). Thus, the impact of DVL3 depletion with respect to some genes (such as GBAT2) show different trends in MCF7 vs. MDA‐MB‐468 cells, suggesting a complex role of DVL3 in regulating these genes. To investigate whether these findings could also be linked with breast cancer patients, we analyzed RNA‐Seq data from 1904 breast cancer patients using public gene expression data of RNA‐seq downloaded from UCSC Xena project (http://xena.ucsc.edu/) derived from the TCGA Breast Cancer (BRCA) dataset (Goldman et al, 2020). Assessing the transcriptomes of TCGA breast cancer patients with different levels of DVL3 expression, we found that DVL3 positively correlates with the top ChIP‐seq genes analyzed (Fig EV3A). Among those genes, we found that DVL3 mRNA is strongly associated with gene transcripts that control cell cycle, chromatin organization, developmental biology, DNA repair, gene expression, immune system, metabolism, metabolism of proteins, metabolism of RNA, signal transduction, and vesicle‐mediated transport (Table EV1).
Figure EV3. Heatmap showing positive correlation between DVL3 and KMT2D expression and the expression of DVL3 ChIP‐seq hit genes in breast cancer patients.

- Expression of top DVL3 ChIP‐seq target genes upregulated in breast cancer patients with high DVL3 expression.
- Expression of top DVL3 ChIP‐seq target genes upregulated in breast cancer patients with high KMT2D expression.
To further explore DVL3 function in gene transcription, we identified the DVL3‐associated transcriptional profile by RNA‐seq (Fig 3A). We found 223 transcripts that significantly changed their expression (fold change [FC] > 2 and P value < 0.01) in the DVL3‐depleted MDA‐MB‐468 cells (shB DVL3) compared with the control (NTC). Among these, 41 (18%) were downregulated and 184 (82%) upregulated upon DVL3 depletion (Fig 3B, left panel). Furthermore, we found 4964 transcripts that significantly changed their expression in DVL3‐overexpressed MDA‐MB‐468 cells (DVL3‐WT) compared with the control (EV). Among these, 4842 (97.5%) were downregulated and 122 (2.5%) were upregulated upon DVL3 overexpression (Fig 3B, right panel). In MCF7 cells, we found 569 transcripts that significantly changed their expression in the in DVL3‐depleted cells (shB DVL3) compared with the control (NTC). Among these, 41 (7.2%) were downregulated and 530 (92.8%) upregulated upon DVL3 depletion (Fig 3C, left panel). Furthermore, we found 410 transcripts that significantly changed their expression in DVL3‐overexprresed MCF7 cells (DVL3‐WT) compared with the control (EV). Among these, 205 (50%) were downregulated and 205 (50%) were upregulated upon DVL3 overexpression (Fig 3C, right panel).
Figure 3. DVL3 regulates gene transcription.
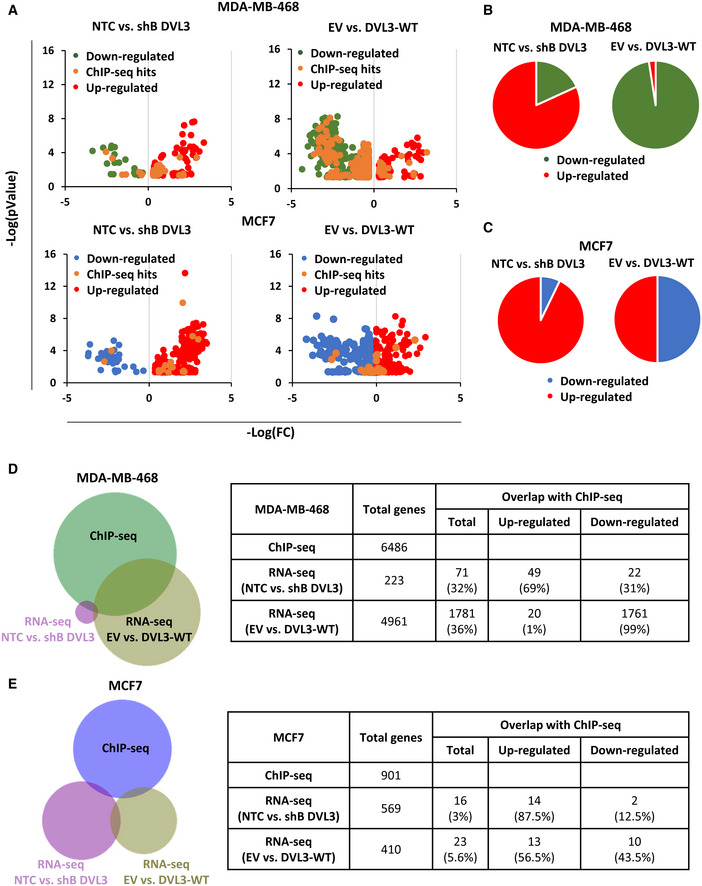
- Volcano plot represents DVL3 transcriptional targets identified by RNA‐seq in MDA‐MB‐468 cells (NTC vs. shB DVL3 and EV vs. DVL3‐WT, upper panel) and in MCF7 cells (NTC vs. shB DVL3 and EV vs. DVL3‐WT, lower panel). In the upper panel, the green dots represent significant downregulated genes, the red dots represent significantly upregulated genes and the orange dots represent DVL3‐ChIP hits in MDA‐MB‐468 cells. In the lower panel, the blue dots represent significant downregulated genes, the red dots represent significantly upregulated genes, and the orange dots represent DVL3‐ChIP hits in MCF7 cells. Gene expression levels were quantified using Fisher’s Exact Test Signal Search in the DNASTAR ArrayStar software package.
- Diagram showing the percentage of upregulated and downregulated genes in the RNA‐seq experiment comparing NTC vs. shB DVL3 (left panel) and EV vs. DVL3‐WT (right panel) in MDA‐MB‐468 cells.
- Diagram showing the percentage of upregulated and downregulated genes in the RNA‐seq experiment comparing NTC vs. shB DVL3 (left panel) and EV vs. DVL3‐WT (right panel) in MCF7 cells.
- Venn diagram showing overlapping between DVL3‐bound genes and DVL3 transcriptional targets in MDA‐MB‐468 cells. A total of 32% of differentially expressed genes identified by RNA‐seq comparing NTC and shB DVL3 were also DVL3 direct targets identified by ChIP‐seq. From these, 69% were upregulated and 31% down‐regulated. A total of 36% of differentially expressed genes identified by RNA‐seq comparing EV and DVL3‐WT were also DVL3 direct targets identified by ChIP‐seq. From these, 1% were upregulated and 99% down‐regulated.
- Venn diagram showing overlapping between DVL3‐bound genes and DVL3 transcriptional targets in MCF7 cells. A total of 3% of differentially expressed genes identified by RNA‐seq comparing NTC and shB DVL3 were also DVL3 direct targets identified by ChIP‐seq. From these, 87.5% were upregulated and 12.5% down‐regulated. A total of 5.6% of differentially expressed genes identified by RNA‐seq comparing EV and DVL3‐WT were also DVL3 direct targets identified by ChIP‐seq. From these, 56.5% were upregulated and 43.5% down‐regulated.
Data information: For all panels n = 3, biological replicates.
Next, we identified the DVL3 direct transcriptional targets by comparing the DVL3‐associated transcriptional profile with the ChIP‐seq data. In MDA‐MB‐468 cells, we observed that 32% and 36% of the genes that showed a DVL3 dependency for transcription were bound by DVL3 when comparing DVL3 depletion vs. DVL3 overexpression, respectively (Fig 3D). Interestingly, the proportion of direct target genes upregulated (69%) was higher than those downregulated (31%) in DVL3‐depleted cells relative to the control. Similarly, the proportion of direct target genes upregulated (1%) was lower than those downregulated (99%) when we comparing DVL3‐overexpressed cells to its control (Fig 3D). In MCF7 cells, the overall percent of total transcripts that change which overlapping with DVL3 ChIP‐seq hits was much smaller. Of these gene subsets, the proportion of direct target genes upregulated (87.5%) was lower than those downregulated (12.5%) in DVL3‐depleted cells relative to the control. Additionally, the proportion of direct target genes upregulated (56.5%) was somewhat higher than the direct downregulated genes (43.5%) in DVL3‐overexpressed cells relative to its control (Fig 3E). These data suggest a potential role of DVL3 in the transcription with a greater impact in MDA‐MB‐468 cells.
DVL3 localizes with H3K4me3 epigenetic mark
The identification of DVL3 direct target genes suggested that DVL3 may facilitate activation or repression at distinct promoters; therefore, we assessed whether DVL3 can co‐localize with H3K4me3, an epigenetic modification associated with active transcription (Santos‐Rosa et al, 2002; Barski et al, 2007). Visualizing the promoter regions of ARAP1, RFX5, GBAT2, APOC1P1, PSMD8, TAP1, and HLA‐A in MDA‐MB‐468 cells (Fig 4A) and the promoter regions of HAUS5, APOC1P1, ZNF672, HLA‐A, and HLA‐E in MCF7 (Fig 4B), we observed that DVL3 peaks overlapped with the epigenetic mark H3K4me3. The depletion of DVL3 showed a reduction in the presence of the mark in the promoter regions of ARAP1, RFX5‐GBAT2, KDM5B, APOC1P1, and PSMB8 for MDA‐MB‐468 (Fig 4C). Interestingly, the depletion of DVL3 showed a decrease in mRNA expression of GBAT2, APOC1P1, and PSMB8 accompanied by the reduction in the H3K4me3 mark also. In MCF7 cells, we did not observe a complete overlap of the histone mark H3K4me3 and DVL3 peaks, which is expected given the possibility that regulation across all promoters is unlikely to be identical. For instance, we see an overlap in GBAT2, PCAT6, and HAUS5 promoters, but a very small signal for APOC1P1 promoter (Fig 4B). Nevertheless, the loss of DVL3 induced an increase in the H3K4me3 ChIP signal in RFX5‐GBAT2, PCAT6, HAUS5, and even in the APOC1P1 promoters (Fig 4D). Together, these data clearly demonstrate that DVL3 binds to multiple novel target genes and its depletion leads to changes in both mRNA and epigenetic marks associated with these gene targets. We extended these analyses to our DVL3 ChIP‐seq hits and found an overlap of 4,782 DVL3 hits with the H3K4me3 mark in MDA‐MB‐468 cell, which corresponds to 74% of DVL3 hits (Fig 4E), and an overlap of 703 DVL3 hits in MCF7 cells, which corresponds to 78% of DVL3 hits (Fig 4F). Interestingly, we also observed an overlap of 756 DVL3 hits with genes identified in MCF7‐FAIRE‐seq datasets, which correspond to nucleosome‐depleted DNA, a hallmark of active chromatin (Fig 4G). Altogether, these data localize DVL3 to transcriptional regulatory regions.
Figure 4. Localization of H3K4me3 mark respect to DVL3 genomic binding in MDA‐MB‐468 and MCF7 cells.

- An assembly of IgG (first row), DVL3 (second row), and H3K4me3 peak (third row) ChIP‐seq data in MDA‐MB‐468 for the ARAP1, RFX5‐GBAT2, APOC1P1, PSMB8, TAP1, and HLA‐A genes, visualized by IGV. The green rectangular block is the location of the statistically qualified peak of H3K4me3 in MDA‐MB‐468.
- An assembly of IgG (first row), DVL3 (second row), and H3K4me3 (third row) ChIP‐seq data in MCF7 for the HAUS5, APOC1P1, ZNF672, HLA‐A, and HLA‐E genes, visualized by IGV.
- ChIP‐qPCRs at ARAP1, RFX5‐GBAT2, KDM5B, APOC1P1, and PSMB8 promoters for IgG and H3K4me3 in MDA‐MB‐468 (NTC, shA DVL3, and shB DVL3).
- ChIP‐qPCRs at RFX5‐GBAT2, PCAT6, APOC1P1, and HAUS5 promoters for IgG and H3K4me3 in MCF7 (NTC, shA DVL3, and shB DVL3).
- Venn diagram showing the overlap between MDA‐MB‐468 DVL3 ChIP‐seq peaks and H3K4me3 ChIP‐seq
- Venn diagram showing the overlap between MCF7 DVL3 ChIP‐seq peaks and H3K4me3 ChIP‐seq
- Venn diagram showing the overlap between MCF7 DVL3 ChIP‐seq peaks and FAIRE‐seq.
Data information: For (A) and (B), each column is 4,000 bp wide. The fourth rows show the gene nearest to the ChIP‐seq alignment, including its location and orientation. C and D panels show a representative ChIP‐qPCR of three independent ChIP‐qPCR experiments. For C and D panels, an independent t‐test was used for statistical comparison. *P < 0.05; data show means ± SD, n = 3, technical replicate.
DVL3 localizes with the histone methyltransferase KMT2D
Intrigued by the role of DVL3 in the trimethylation of H3K4, a hallmark of gene expression, we asked whether DVL3 may act as a scaffold of any epigenetic modifier (“writer” or “eraser”) implicated in H3K4 methylation. In our screen, we identified lysine methyltransferase 2D (KMT2D) as a good candidate and investigated further. Remarkably of all epigenetic modifiers for H3K4me3, both KMT2D‐ and DVL3‐deficient mice have shown strikingly similar abnormalities in cardiovascular system development leading to persistent truncus arteriosus (PTA)(Etheridge et al, 2008; Ang et al, 2016). To further determine whether there is a link between DVL3‐KMT2D‐H3K4me3, we first observed an overlap of the DVL3 peaks with KMT2D at the promoter regions of our representative panel of novel DVL3 targets such as HAUS5, WDR74, YWHAQ, HSPA14, and PRDM10 in MCF7 cells (Fig 5A), and this overlap corresponded to 77% of DVL3 ChIP‐seq hits in MCF7 cells (Fig 5B). These data suggested that KMT2D and DVL3 co‐localize to regulate these promoters in MCF7 cells. Due to the lack of public available data for KMT2D in MDA‐MB‐468 cells to assess this association in this cell line, we first evaluated the potential of DVL3 to regulate KMT2D promoter localization. We observed by ChIP‐qPCR that the loss of DVL3 led to a reduction in localization of KMT2D to those promoters (Fig 5C) indicating that DVL3 is necessary for the localization of KMT2D and hence the methylation of H3K4 at those promoters. Furthermore, assessing the transcriptomes of TCGA breast cancer patients with varying KMT2D expression, we found that KMT2D was positively correlated with the same top ChIP‐seq genes analyzed for DVL3 (Figs EV3B, and EV4A and B, and Table EV2). Altogether, these data show that DVL3 plays a role in the epigenetic regulation of transcription as it is necessary for KMT2D localization to the promoters and therefore regulates H3K4me3.
Figure 5. Localization of KMT2D and epigenetic enhancer marks with respect to DVL3 genomic binding in MDA‐MB‐468 and MCF7 cells.

- An assembly of IgG (first row), DVL3 (second row), and KMT2D (third row) ChIP‐seq data in MCF7 for the HAUS5, WDR74, YWHAQ, CDNF/HSPA14, and PRDM10 genes, visualized by IGV. The bar below the DVL3 peak is the location of the statistically qualified peak of KMT2D in MCF7.
- Venn diagram showing the overlap between MCF7 DVL3 ChIP‐seq peaks and KMT2D ChIP‐seq.
- ChIP‐qPCRs at ARAP1, RFX5‐GBAT2, and PSMB8 promoters for IgG and KMT2D in MDA‐MB‐468 (NTC, shA DVL3, and shB DVL3).
- An assembly of IgG (first row), DVL3 (second row), H3K27ac (third row), and H4K8ac peak (fourth row) ChIP‐seq data in MDA‐MB‐468 for the PRDM10, TRIM26, BTN2A1, PNRC2, and MR1 genes, visualized by IGV. The green rectangular bars are the locations of the statistically qualified peak of H3K27ac or H4K8ac in MDA‐MB‐468.
- An assembly of IgG (first row), DVL3 (second row), H3K27ac (third row), and H4K8ac peak (fourth row) ChIP‐seq data in MCF7 for the WDR74, YWHAQ, CDNF/HSPA14, BTN2A1, and MR1 genes, visualized by IGV. The turquoise and purple rectangular bars are the locations of the statistically qualified peak of H3K27ac or H4K8ac in MCF7, respectively.
- Venn diagram showing the overlap between MDA‐MB‐468 DVL3 ChIP‐seq peaks and H3K27ac ChIP‐seq.
- Venn diagram showing the overlap between MCF7 DVL3 ChIP‐seq peaks and H3K27ac ChIP‐seq.
- Venn diagram showing the overlap between MDA‐MB‐468 DVL3 ChIP‐seq peaks and H4K8ac ChIP‐seq
- Venn diagram showing the overlap between MCF7 DVL3 ChIP‐seq peaks and H4K8ac ChIP‐seq.
- Venn diagram showing the overlap between MDA‐MB‐468 DVL3 ChIP‐seq peaks and super‐enhancer targets in basal breast carcinoma (BRCA)
- Venn diagram showing the overlap between MCF7 DVL3 ChIP‐seq peaks and super‐enhancer targets in luminal breast carcinoma.
Data information: Panel C shows a representative ChIP‐qPCR of three independent ChIP‐qPCR experiments. For panel C, an independent t‐test was used for statistical comparison. *P < 0.05; data show means ± SD, n = 3, technical replicate. For (A), (D), and (E), each column is 4,000 bp wide. The fourth rows (panel A) and the fifth rows (panel D and E) show the gene nearest to the ChIP‐seq alignment, including its location and orientation.
Figure EV4. Correlation analysis between DVL3 and KMT2D expression and the expression of eight DVL3 ChIP‐seq hit genes in breast cancer patients.

- Pearson correlation of DVL3 expression with ARAP1, BRD2, RFX5, CLASP1, HLA‐E, PRDM10, ZNF672, and HNRNPUL2.
- Pearson correlation of KMT2D expression with ARAP1, BRD2, RFX5, CLASP1, HLA‐E, PRDM10, ZNF672, and HNRNPUL2.
DVL3 localizes with KMT2D in predicted breast cancer super‐enhancers
KMT2D plays an important role at enhancers in development, differentiation, metabolism, and tumor suppression (Ang et al, 2016; Froimchuk et al, 2017; Lin‐Shiao et al, 2018; Alam et al, 2020). DNase hypersensitivity and the H3K27ac epigenetic mark are characteristic of enhancers (Creyghton et al, 2010; Shlyueva et al, 2014). Interestingly, in breast cancer H3K4me3 marks a subgroup of super‐enhancers in the intergenic regions, which are associated with higher level of H3K27ac and H4K8ac, as well as higher transcription of adjacent genes (Li et al, 2019). In addition of H3K27ac, H4K8ac is also positively associated with enhancer RNA (eRNA) transcription, a marker of active enhancers (Zhu et al, 2013; Wu et al, 2014). After establishing DVL3 and KMT2D interactions, we further evaluated whether DVL3 also co‐localizes with epigenetic marks associated with enhancers. Visualizing the promoter regions of PRDM10 (PR/SET Domain 10), TRIM26 (Tripartite Motif Containing 26), BTN2A1 (Butyrophilin Subfamily 2 Member A1), PNRC2 (Proline Rich Nuclear Receptor Coactivator 2), and MR1 (Major Histocompatibility Complex, Class I‐Related) in MDA‐MB‐468 cells (Fig 5D) and the promoter regions of WDR74, YWHAQ (Tyrosine 3‐Monooxygenase/Tryptophan 5‐Monooxygenase Activation Protein Theta), HSPA14 (Heat Shock Protein Family A Member 14), BTN2A1, and MR1 in MCF7 (Fig 5E), we observed that DVL3 peaks overlapped with the epigenetic marks, H3K27ac and H4K8ac. Moreover, we extended these analyses to our DVL3 ChIP‐seq hits, and we found that there was an overlap of 5159 DVL3 hits with the H3K27ac mark in MDA‐MB‐468 cell, which corresponds 79% of DVL3 hits (Fig 5F), and an overlap of 713 DVL3 hits in MCF7 cells, which also corresponds to 79% of DVL3 hits (Fig 5G). Additionally, we found that there was an overlap of 2,147 DVL3 hits with the H3K8ac mark in MDA‐MB‐468 cell, which corresponds 33% of DVL3 hits (Fig 5H), and an overlap of 545 DVL3 hits in MCF7 cells, which corresponds to 60% of DVL3 hits (Fig 5I). Furthermore, we used Cistrome Cancer (http://cistrome.org/CistromeCancer/), a comprehensive resource that predicts enhancer profiles from integrative analysis of TCGA expression profiles and public DNase‐seq and H3K27ac ChIP‐seq profiles in different cancer types, we found that there was an overlap of 5,717 MDA‐MB‐468 DVL3 hits with the super‐enhancer targets for the basal breast cancer subtype, which corresponds 88% of DVL3 hits (Fig 5J), and an overlap of 803 MCF7 DVL3 hits with the super‐enhancer targets for the luminal breast cancer subtype, which corresponds to 89% of DVL3 hits (Fig 5K). These data suggest that DVL3 co‐localizes with KMT2D in breast cancer‐specific enhancer regions. These findings demonstrate that DVL3 localizes with the active regulatory marks (H3K4me3, H3K27ac, and H3K8ac). Next, we asked whether DVL3 also localized with the repressive marks H3K9me3 and H3K27me3. Interestingly, in none of the regions studied: ARAP1, RFX5, WDR74, POU2F3, HLA‐A HAUS5, PSMB8, TAP1, JUNB, PRDM10, TRIM26, PNRC2, and MR1 did we observe an overlap of the repressive marks and DVL3 (Fig EV5). Altogether, these data suggest that DVL3 co‐localizes with KMT2D in active regulatory regions of the chromatin.
Figure EV5. Summary of the localization of epigenetic marks respect to DVL3 genomic binding in MDA‐MB‐468.

An assembly of DVL3 (first row), H3K4me3 (second row), H3K27ac (third row), H3K8ac (forth row) H3K9me3 (fifth row), and H3K27me3 peak (sixth row) ChIP‐seq data in MDA‐MB‐468. The seventh row shows the gene nearest to the ChIP‐seq alignment, including its location and orientation. Each column is 18,000 bp wide. Upper panel shows the assembly for the ARAP1, RFX5, WDR74, POU2F3, HLA‐A, and HAUS5/RBM42 genes, visualized by IGV. Lower panel shows the assembly for the TAP2/PSMB8/TAP1/PSMB9, JUNB/PRDX2, PRDM10, TRIM26, PNRC2, and MR1 genes, visualized by IGV.
DVL3 complexes with KMT2D in regulatory regions of breast cancer cells
To further assess the significance of our finding that DVL3 and KMT2D co‐localize at several regulatory regions, we first evaluated the physical interaction between DVL3 and KMT2D by co‐immunoprecipitation (co‐IP). Indeed, KMT2D co‐IP assay revealed that they form a complex MDA‐MB‐468 and MCF7 cells (Fig 6A). To further investigate the functional relationship between DVL3‐KMT2D and H3K4me3, we evaluated whether DVL3 depletion alters H3K4me3 levels. We performed a histone acid extraction in MDA‐MB‐468 cells and observed that DVL3 depletion did not change H3K4me3 levels (Fig 6B). To assess whether DVL3 alters mRNA levels of KMT2D, we confirmed that KMT2D is not a direct target of DVL3 (Fig 6C). Additionally, DVL3 depletion in MDA‐MB‐468 cells (Fig 6D) did not alter KMT2D mRNA levels in these cells (Fig 6E). Interestingly, when we analyzed the mRNA expression levels of KMT2D after the depletion of DVL3 in MCF7 cells (Fig 6F) we observed a significant increase in the expression of KMT2D in this cell line (Fig 6G). Additionally, we assessed whether DVL3 depletion affected the localization of KMT2D in MDA‐MB‐468. In MDA‐MB‐468 cells, using immunofluorescence assays, we detected that KMT2D was mostly in the nucleus and its localization was not affected by the depletion of DVL3 (Fig 6H). Altogether, these data show that DVL3 complexes with KMT2D in both cell lines, and furthermore, this interaction regulates discrete changes in the regulatory regions of the genes studied as there are not changes in global H3K4me3 or changes in KMT2D expression in MDA‐MB‐468 cells.
Figure 6. The effects of silencing DVL3 on KMT2D expression and subcellular localization.

- DVL3 co‐immunoprecipitates KMT2D in MDA‐MB‐468 cells (upper panel) and MCF7 cells (lower panel). IgG heavy chain (Hc) was blotted for as a control for equal antibody capture for immunoprecipitation and whole cell extracts (WCE) as a positive control.
- MDA‐MB‐468 histone extracts from NTC, shA DVL3, and shB DVL3 subjected to immunoblot analysis for H3K4me3 and H3.
- An assembly of IgG (first row), DVL3 (second row) ChIP‐seq in MDA‐MB‐468 cells, IgG (third row), and DVL3 (fourth row) ChIP‐seq data in MCF7 for the KMT2D gene, visualized by IGV. Each column is 20,000 bp wide. The fifth row shows the location and orientation of the KMT2D gene.
- RT–qPCR‐based analysis of expression changes of DVL3 in MDA‐MB‐468 (NTC, shA DVL3, and shB DVL3) cells.
- RT–qPCR‐based analysis of expression changes of KMT2D in MDA‐MB‐468 (NTC, shA DVL3, and shB DVL3) cells.
- RT–qPCR‐based analysis of expression changes of DVL3 in MCF7 (NTC, shA DVL3, and shB DVL3) cells.
- RT–qPCR‐based analysis of expression changes of KMT2D in MCF7 (NTC, shA DVL3, and shB DVL3) cells.
- Immunofluorescence of KMT2D localization in MDA‐MB‐468 cells. The cells were probed with KMT2D antibody (red). The nucleus was stained with DAPI (blue), and the actin filaments (green) were stained with Phalloidin. Merge of KMT2D (red) and nuclear staining (blue) is shown as KMT2D/DAPI, merge of KMT2D (red) and actin (green) is shown as KMT2D/ACTIN, and, merge of KMT2D (red), nuclear staining (blue) and actin (green) is shown as MERGE for NTC, shA DVL3, and shB DVL3 cells. Scale bar: 10 µm
- Sequential ChIP (ChIP‐reChIP) to examine occupancy of DVL3 and KMT2D at RFX5, HAUS5, COX14, APOC1P1, WDR74, JUNB, and HLA‐A promoters analyzed by end‐point PCR.
- Sequential ChIP (ChIP‐reChIP) to examine occupancy of DVL3 and H3K4me3 at RFX5, APOC1P1, JUNB, and, HLA‐A promoters analyzed by end‐point PCR.
Data information: For D‐G panels, transcript levels were normalized to actin transcript levels and an independent t‐test was used for statistical comparison. *P < 0.05; data show means ± SD, n = 3 biological replicates.
Source data are available online for this figure.
Additionally, to evaluate the physical binding of DVL3 and KMT2D at the same target genes, we performed sequential ChIP (ChIP/reChIP) in MDA‐MB‐468 cells. We observed co‐occupancy of DVL3 and KMT2D in the promoter region of RFX5 and a partial co‐occupancy in HAUS5, COX14, APOC1P1, WDR74, JUNB, and HLA‐A promoters, as we detected the co‐occupancy when KMT2D was immunoprecipitated first but not when DVL3 was immunoprecipitated first (Fig 6I). We also observed a complete co‐occupancy of DVL3 and H3K4me3 at RFX5, APOC1P1, JUNB, and HLA‐A promoters (Fig 6J). These data show that DVL3 interacts with KMT2D and co‐occupy the same target gene promoters to regulate transcription.
DVL3 is required for xenograft tumor growth in breast cancer cells
Intrigued with the nuclear role of DVL3 complexing with an epigenetic modifier, we evaluated whether DVL3 is linked with cancer hallmarks. We previously reported that DVL3 downregulation significantly reduced MCF7 cell proliferation (Castro‐Piedras et al, 2018) and extended our analysis to assess spheroid formation. In MDA‐MB‐468 cells, DVL3 depletion reduced spheroid growth after 32 h and showed a fivefold decrease at final point of 96 h (Fig 7A). Similarly, in MCF7 cells, we observed a reduction in spheroid growth after 100 h in vitro (Fig 7B).
Figure 7. The effects of silencing DVL3 on the formation and progression of spheroid and orthotopic xenograft tumor models.

- Quantification of spheroids’ area in MDA‐MB‐468 cell line (NTC vs. shA DVL3). The data are presented as the mean ± SD, n = 3 showing statistical difference after 32 h *P < 0.05.
- Quantification of the spheroids’ area in the MCF7 cell line (NTC, shA DVL3, and shB DVL3). The data are presented as the mean ± SD, n = 3 showing statistical difference after 100 h *P < 0.05.
- IVIS images showing representative tumors generated by injecting luciferase‐expressing MDA‐MB‐468 cells (NTC, shA DVL3, or shB DVL3) in the mammary fat pad of SCID mice. Color scale (luminescent signal intensity): blue, least intense signal; red, most intense signal.
- Quantification of luminescence changes in tumors generated by injecting luciferase‐expressing MDA‐MB‐468 cells (NTC, shA DVL3, or shB DVL3) in the mammary fat pad of SCID mice, Average luminescence was used to measure volume of tumor; n ≥ 9.
- Tumor pictures of tumors resulting from the injections of MDA‐MB‐468 (NTC, shA DVL3, or shB DVL3) in the mammary fat pad of SCID mice. Scale shown in cm.
- Final weight of tumors resulting from the injections of MDA‐MB‐468 (NTC, shA DVL3, or shB DVL3) in the mammary fat pad of SCID mice. One‐way ANOVA was used for statistical comparison, n ≥ 9.
- IVIS images showing representative tumors generated by injecting luciferase‐expressing MCF7 cells (NTC, shA DVL3) in the mammary fat pad of SCID mice. Color scale (luminescent signal intensity): blue, least intense signal; red, most intense signal.
- Quantification of luminescence changes in tumors generated by injecting luciferase‐expressing MCF7 cells (NTC, shA DVL3) in the mammary fat pad of SCID mice. Average luminescence was used to measure volume of tumor. n = 7.
Data information: For all panels: t‐test was used for statistical comparison, unless is specified, data show means ± SD, * indicates significant difference from control P ˂ 0.05.
Given these findings, we assessed the impact of DVL3 loss of function on in vivo xenograft tumor growth. We injected MDA‐MB‐468 stably expressing a NTC or a shRNA targeting DVL3 in the mammary fat pad of mice with severe combined immunodeficiency (SCID). The knockdown of DVL3 significantly inhibited MDA‐MB‐468 growth in SCID mice (Fig 7C and D); this observation was confirmed by the final tumor weight (Fig 7E and F) and in a second breast cancer cell line, MCF7 (Fig 7G and H). These results demonstrate that DVL3 is essential for spheroid proliferation in 3D culture and tumor growth in SCID mice.
Nuclear DVL3 participates in gene expression and spheroid formation
In order to assess the functional significance of nuclear DVL3, we generated HA‐tagged wild‐type DVL3 (WT), and an HA‐tagged‐DVL3 mutant with a mutated nuclear export signal (NESm). After the sequences were confirmed by sequencing, we first evaluated the subcellular localization of DVL3 by immunofluorescence in transiently transfected MDA‐MB‐468 cells with HA‐DVL3‐WT, HA‐DVL3‐NESm, and the empty vector as a control. We observed that HA‐DVL3‐WT was mostly in the cytoplasm and a small percentage translocated to the nucleus, although the staining for HA‐DVL3‐NESm localized exclusively to the nucleus as discrete nuclear speckles and puncta (Fig 8A).
Figure 8. Nuclear DVL3 influences gene expression and spheroid formation.

- Immunofluorescence of HA‐tagged DVL3 localization in MDA‐MB‐468 cells. The cells were probed with an HA antibody (red). The nucleus was stained with DAPI (blue), and the actin filaments (green) were stained with Phalloidin. Merge of actin (green) and nuclear staining (blue) is shown as ACTIN/DAPI, merge of DVL3 (red) and nuclear staining (blue) is shown as HA/DAPI, merge of DVL3 (red) and actin (green) is shown as HA/ACTIN, and merge of DVL3 (red), nuclear staining (blue) and actin (green) is shown as MERGE for empty vector (EV), HA‐DVL3‐WT and HA‐DVL3‐NESm transient transfected cells. Scale bar: 10 µm.
- RT–qPCR‐based analysis of expression changes of DVL3 in stable MDA‐MB‐468 (EV, HA‐DVL3‐NESm) cells.
- RT–qPCR‐based analysis of expression changes of KMT2D in stable MDA‐MB‐468 (EV, HA‐DVL3‐NESm) cells.
- RT–qPCR‐based analysis of expression changes of ARAP1, RFX5, GBAT2, WDR74, SNORD3D, HAUS5, TAP1, HLA‐A, PDG1, and MR1 in stable MDA‐MB‐468 (EV, HA‐DVL3‐NESm) cells.
- Images and quantification of spheroid areas in stable MDA‐MB‐468 cell line (EV, HA‐DVL3‐WT, and HA‐DVL3‐NESm). The data are presented as the mean ± SD, n = 8 showing statistical difference after 32 h for HA‐DVL3‐WT respect to EV and 48 h for HA‐DVL3‐NESm respect to EV *P < 0.05. Independent t‐tests were performed per time point for statistical comparison. Scale bar: 300 µm.
- Proposed model of the role of DVL3, colocalizing with transcription factors such as ZBTB7B and chromatin‐modifying enzymes as KMT2D in transcriptional regulatory region and regulate transcription.
Data information: For B‐D panels, transcript levels were normalized to actin transcript levels and an independent t‐test was used for statistical comparison. *P < 0.05; data show means ± SD, n = 3.
After confirming the nuclear localization of HA‐DVL3‐NESm, we generated stable clones of MDA‐MB‐468 cells expressing EV or HA‐DVL3‐NESm plasmids. We confirmed that DVL3 was overexpressed by qPCR in the HA‐DVL3‐NESm compared with the EV control (Fig 8B). To test whether the changes in gene expression were modulated by nuclear DVL3, we first confirmed that there were no changes in KMT2D expression upon nuclear DVL3 expression (Fig 8C). We also observed a decrease in the expression of ARAP1, GBAT2, WDR74, TAP1, PDG1, and MR1 in the nuclear‐DVL3 overexpressed cells compared with the control (Fig 8D). Next, we evaluated the role of DVL3 in spheroid formation, the stable overexpression of HA‐DVL3‐WT significantly increased spheroid growth compared with the EV control after 32 h (Fig 8E). Similarly, the stable overexpression of HA‐DVL3‐NESm significantly increased spheroid growth compared with the EV control after 48 h (Fig 8E). Altogether, these results are summarized in a model wherein DVL3 binds to transcription regulatory regions where it regulates transcription by potentially acting as a scaffold not only transcription factors but also for epigenetic modifiers as KMT2D to impact tumor growth in vitro and in vivo (Fig 8F).
Discussion
Constitutive Wnt signaling is associated with multiple subtypes of breast cancer (Holloway et al, 2010; Bleckmann et al, 2016) and is a common feature of cancer and tumor‐initiating stem cells (Zhang et al, 2010; Castagnoli et al, 2019). Alterations in Wnt signaling have been linked with cellular heterogeneity observed across breast cancer subtypes. Wnt signaling regulates lineage specification of stem and progenitor cells (Clevers et al, 2014; Sreekumar et al, 2017) and multiple stages of mammary gland development (Dumont et al, 2008; Klarmann et al, 2008; Kessenbrock et al, 2017; Bernascone et al, 2019). Wnt signaling has been linked with TNBC and basal‐like breast cancers (DiMeo et al, 2009; Geyer et al, 2011; Klemm et al, 2011) and is predictive of poor outcome (Khramtsov et al, 2010). While previous reports show a role for DVL3 in proliferation in vitro (Zou et al, 2017; Li et al, 2020a), our report herein is the first to show that the depletion of DVL3 inhibits tumor growth in vivo. Moreover, we observed distinct differences in the impact of DVL3 when comparing the different breast cancer models. First, we observed fewer ChIP hits for DVL3 in MCF7 cells compared with MDA‐MB‐468 cells. Second, we found that depletion of DVL3 induces a difference in H3K4me3 levels at the same genomic loci across the two different cell lines. Moreover, while KMT2D is not a direct transcriptional target of DVL3, and DVL3 depletion did not alter KMT2D expression in MDA‐MB‐468 cells, DVL3 depletion led to increased KMT2D expression in MCF7 cells. Few reports have investigated DVL nuclear localization, and prior to our study here virtually nothing was known about the scope of its binding to gene promoters. In previous studies, we demonstrated that nuclear DVL3 binds to multiple aromatase tissue‐specific promoters and regulates their transcription (Castro‐Piedras et al, 2018). We showed that depletion of DVL3 reduced tissue‐specific aromatase transcripts, a potential explanation for what drives aberrant CYP19A1 “promoter switching”. While aromatase can be regulated at multiple levels (Molehin et al, 2018), promoter switching causes a disproportional use of one or more of the 10 CYP19A1 tissue‐specific promoters instead of the exclusive use of a single promoter typically activated in normal breast tissue (Bulun et al, 2009). This DVL‐CYP19A1 link prompted a search for more genes not historically associated with the Wnt pathway. Our DVL3 ChIP‐seq analysis uncovered 6486 and 901 genes bound by DVL3 in MDA‐MB‐468 and MCF7 cells, respectively. Interestingly, only five of these genes were previously recognized as Wnt target genes: CD44 (Wielenga et al, 1999), LBH (Rieger et al, 2010), WNT3A (Zhang et al, 2009), MMP2 (Wu et al, 2007), and WISP2 (Longo et al, 2002).
Using bioinformatics tools, we identified three possible binding motifs for DVL3 in MDA‐MB‐468 and MCF7 cells. These sequences are similar to the consensus binding site for ZNF410 and TEAD1 in MDA‐MB‐468 and for STAT3, GFI1, and SOX1 in MCF7 cells. We further studied one member of the GFI1 family (Chiang & Ayyanathan, 2013), ZBTB7B, whose overexpression correlates with cell transformation and malignancy in lung, ovarian, breast, glioma, and T‐cell and B‐cell lymphomas (Aggarwal et al, 2010; Jiang et al, 2010; Qu et al, 2010). ZBTB7B also regulates maturation of T lymphocytes and controls the stoichiometry of CD4+ helper vs. CD8+ cytotoxic T‐cell lineage commitment (Wildt et al, 2007; Wang et al, 2008). Indeed, the Wnt pathway regulates maturation of T lymphocytes, through T‐cell factor (TCF) which partners with β‐catenin. TCF1 regulates differentiation of lymphocyte subsets and promotes the development of memory CD8+ T and the differentiation into the Th2 of CD4+ T cells. This connection between the Wnt pathway and ZBTB7B has notable implications as we discovered that 757 DVL3 ChIP hits overlap with ZBTB7B gene targets and 121 of those hits are linked with the immune system and lymphocyte maturation such as GATA3 (Rothenberg, 2019), or the NOTCH1 pathway such as JAG1(de La Coste & Freitas, 2006).
The TEAD family impacts transcription activity of the Hippo pathway, and both the Hippo and Wnt pathways are evolutionarily conserved and the study of the crosstalk between both pathways has been covered in recent reports (Varelas et al, 2010; Imajo et al, 2012; Konsavage & Yochum, 2013; Lee et al, 2018). Here, we found that one of the possible binding sequences in MDA‐MB‐468 is similar to the consensus binding sequence of TEAD, suggesting that both DVL3 and TEAD may localize to the same genomic regions.
We also found DVL3 at the promoters of lncRNAs which show emerging roles in tumorigenesis and cancer metastasis. In MDA‐MB‐468 cells, we observed that DVL3 is associated with lncRNAs (GBAT2 and APOC1P1) and protein‐coding genes (WDR74, HLA‐A, TAP1, PSMB8, and JUNB. APOC1P1) which are positively associated with tumor size in breast cancer tissues (n = 90). In addition, downregulation of APOC1P1‐3 in breast cancer cells was reported to promote apoptosis (Liao et al, 2016). In renal cell carcinoma, APOC1P1 expression is upregulated relative to normal tissues, affecting cell proliferation and invasiveness (Sun et al, 2019). Remarkably, WDR74 is associated with nuclear accumulation of β‐catenin (Li et al, 2020b) and the SMAD complex (Liu et al, 2018) which regulate the canonical Wnt and transforming growth factor (TGF) cancer‐linked pathways, respectively (Hanahan & Weinberg, 2011; Sharma et al, 2018). Interestingly, JUNB cooperates with SMAD to activate TGF target genes (Sundqvist et al, 2018). Our results show that DVL3 and KMT2D co‐localize to the WDR74 and JUNB promoters, further implicating a role for nuclear DVL3. Moreover, HLA‐A, TAP1, and PSMB8 genes participate in antigen presentation (Kelly & Trowsdale, 2019). In MCF7, we observed that DVL3 depletion increased the expression of HLA‐A, HLA‐E, and TAP1, suggesting DVL3 may influence antigen presentation in tumor cells where defects may impact tumor cell evasion of the immune system. Of relevance to our findings, Xiao et al demonstrated that β‐catenin‐independent regulation of paracrine‐secreted factors suppressed cytotoxic immune cell activation (Xiao et al, 2018) further suggesting the importance of Wnt signaling in immunosuppression. While the interaction of DVL3 with immune cells was beyond the scope of our study, our data show that DVL3 regulates transcription of multiple genes involved in antigen presentation. Since DVL is deacetylated by sirtuin‐1 (SIRT1), these novel DVL gene targets may provide new clues into the relationship between DVL and sirtuin‐mediated regulation of the immune system (Rasha et al, 2020). Interestingly, among the DVL3 direct transcriptional targets are WDR74, BTN2A1, and PNRC2. BTN2A1, a butyrophilin within the immunoglobulin superfamily, collaborates with BTN3A1 in sensitizing phosphoantigen‐exposed cells to be recognized by distinct γδ T‐cell subsets, which are potential targets for chimeric antigen receptor‐modified T (CAR‐T)‐based immunotherapy. The BTN2A1‐BTN3A1 complex is necessary for the full activation of T‐cell receptor (TCR) repertoire of γδ T cells (Kabelitz et al, 2020; Vyborova et al, 2020). PNRC1 blocks rRNA processing and hampers rRNA maturation and functions as a tumor suppressor (Gaviraghi et al, 2018). Future studies will explore the expanded role of DVL3 in regulating these direct transcriptional targets.
Few reports have investigated the role of nuclear DVL3, but in the present report, we addressed this question. We mutated the nuclear export signal of DVL3 to generate a nuclear DVL3 mutant. The expression of this mutant induced changes in RNA expression of several ChIP hits (such as its direct target WDR74), confirming the role of DVL3 in regulating transcription. Moreover, the DVL3‐NES mutant enriched in nuclear localization induced spheroid formation confirming its role in proliferation in vitro. Given our previous reports demonstrating that lysine acetylation controls protein–protein interaction involving epigenetic readers (Pandey et al, 2015; Castro‐Piedras et al, 2020), future studies will also explore the role of DVL post‐translational modifications in regulating its ability to mediate protein–protein interactions on gene promoters.
Histone modifiers, such as histone demethylases 3 (KDM3) (Li et al, 2017) and histone‐lysine methyltransferase 2F (KMT2F) (Salz et al, 2014), regulate transcription of Wnt target genes. In human colorectal cancer, the KDM3 family promotes β‐catenin/TCF‐mediated transcription by demethylating H3K9me2 and promoting the recruitment of KMT2A to methylate H3K4 (Li et al, 2017). In addition, KMT2F interacts with beta‐catenin and both are recruited to Wnt target gene promoters to promote gene transcription associated with the H3K4me3 epigenetic mark (Salz et al, 2014). Here, we show how DVL3 plays a role in modulating H3K4me3 levels at genomic loci. The depletion of DVL3 in MDA‐MB‐468 cells caused a reduction in GBAT2, APOC1P1, PSMB8, and WDR74 expression and also reduced the epigenetic mark, H3K4me3, which is associated with actively transcribed genes (Santos‐Rosa et al, 2002; Barski et al, 2007; Hyun et al, 2017). In contrast, in MCF7 cells, the depletion of DVL3 was associated with an increase in H3K4me3 and expression of RFX5, GBAT2, PCAT6, and APOC1P1. Histone modifications control chromatin structure and provide binding platforms for regulatory factors, and we now report for the first time that DVL3 may regulate H3K4 methylation. We linked DVL3 with H3K4 methylation and also observed that DVL3 complexes with KMT2D, a chromatin‐modifying enzyme highly enriched at enhancers (Rao & Dou, 2015). This association suggests that DVL3 may localize to both promoter and enhancer regulatory regions. Notably, the depletion of DVL3 was associated with a reduction in the localization of KMT2D to the novel DVL3 target genes in MDA‐MB‐468 cells. This suggests that DVL3 may play a role in KMT2D localization and hence H3K4 methylation.
Finally, we observed that DVL3 not only regulates transcription and epigenetic marks, but does so at both promoters and enhancers. The observation of DVL3 at enhancers provides more insight on the role of the Wnt pathway in tumorigenesis as enhancers are recognized as oncogenic drivers (Tang et al, 2020). Genomic instability is associated with eRNA expression and biogenesis and enhancer function (Ko et al, 2017; Zhang et al, 2019), and the Wnt pathway is also associated with induction of genomic instability (Hadjihannas et al, 2006; Dose et al, 2014; Augustin et al, 2017). Pharmacological inhibitors targeting enhancer assembly and activation have been reported to reduce tumor growth and proliferation in pre‐clinical tumor models (Tang et al, 2020), our studies provide a novel role of DVL3 in chromatin structure, an area of immense translational potential.
Materials and Methods
Cell lines
MCF7 and MDA‐MB‐468 cell lines used in this manuscript were purchased from ATCC which utilizes STR technology for Cell Authentication, and they were used in a low passage (< 20) within 6 months or less after receipt or resuscitation. MCF7 cells were cultured in MEM (Gibco, 11095‐080) supplemented with 0.1% insulin (Sigma, I0516) while MDA‐MB‐468 cells were cultured in RPMI 1640 (Gibco, 26140‐079) supplemented with 0.1% insulin. All culture media were supplemented with 10% fetal bovine serum and 1% penicillin/streptomycin (Gibco, 15070‐063).
Western blots
Samples were subjected to polyacrylamide gel electrophoresis using Invitrogen Bolt gel system, transferred to PVDF (Millipore, IPVH00010) membranes, and immunoblotted. Antibodies used are as follows: DVL3 (SAB4200007, Sigma and sc‐8027, Santa Cruz), ZBTB7B (A303‐701A, Bethyl Laboratories Inc.), and GAPDH (sc‐47724; Santa Cruz). Membranes were incubated in 5% milk/TBST with primary antibody overnight at 4°C. Membranes were washed with TBST and probed with horseradish peroxidase‐conjugated secondary antibodies in 5% milk/TBST for 1 h at room temperature (RT). Membranes were visualization by enhanced chemiluminescence (ECL) reagent (Thermo Scientific, 32106) on premium X‐ray films (Phenix Research).
DVL stable knockdown
MCF7 and MDA‐MB‐468 were transfected with pGL4.50 [luc2/CMV/Hygro] Vector (Promega), using Lipofectamine‐3000 (Invitrogen, L3000‐015). The hygromycin selection was started 48 h after transfection at concentration 500 µg/ml of Hygromycin (Sigma, H3274), and the hygromycin‐containing media was replaced every 3–4 days until total selection was achieved. Then, the pGL4.50‐selected MCF7 and MDA‐MB‐468 cells were infected by pLKO.1‐puro based shRNA MISSION lentiviral transduction particles for DVL3 (TRCN0000033344, TRCN0000033347; Sigma), and Non‐Target shRNA control transduction particles (SHC002V, Sigma). 24 h prior transduction, cells were plated in order to reach 80% confluency at the time of transduction. The transduction was enhanced with Hexadimethrine Bromide (Sigma, H9268) at a final concentration of 8 μg/ml. Following the addition of hexadimethrine bromide, the appropriate amount of viral particles were added at 2× multiplicity of infection (MOI) to the media, which was replaced with fresh media after 24 h. The puromycin selection was started 72 h after transduction at a concentration 0.5 μg/ml of puromycin (Gibco, A11138‐03), and the puromycin‐containing media was replaced every 3–4 days until total selection was achieved.
HA‐hDVL3 pcDNA3.1 (+) construct generation and stable expression of DVL3‐WT and DVL3‐NES mutant in MDA‐MB‐468 cell line
DVL3 gene was cloned into HindIII/EcoRI restriction enzyme sites of 5.4‐kb pcDNA3.1(+) mammalian expression plasmid using T4 DNA ligase (Invitrogen). The following primers used were designed with HA‐epitope tag at the amino‐terminus; Forward: TAAGCAAAGCTTATGTACCCATACGATGTTCCAGATTACGCTGGCGAGACCAAGATCATCTAC and Reverse: TGCTTACTTAAGTCACATCACATCCACAAAGAACTCACTGGG GTTTCCCATGGC. MAX efficiency‐competent cells (DH5‐alpha; Thermo Fisher) were transformed with ligation products and plated on LB‐ampicillin agar at 37 °C overnight. Bacteria colonies were screened and plasmids were extracted by the QIAprep spin miniprep Kit (Qiagen). Plasmids isolated were subjected to HindIII and EcoRI restriction digest, and fragments were resolved on 1% agarose gel (Bio‐Rad) in 1X TAE buffer. Sanger plasmid sequencing was used to confirm the DNA sequences.
In a manner similar to our previous publication (Sharma et al, 2019), the HA‐DVL3‐NESm mutant was generated by site‐directed mutagenesis with nucleotide primers designed using the QuickChangeII‐XL site‐directed mutagenesis primer design tool and kit (Agilent Technologies) following the manufacturer’s protocol. For the DVL3 NES mutant, the amino acid sequence MANLSL was converted to MANASA at positions 501–506 for DVL3 NES. The nucleotide sequences are the following; Forward: GCCATCGTGATCGTGGGCAGACGCGTTGGCCATGTTGCCG and Reverse: CGGCAACATGGCCAACGCGTCTGCCCACGATCACGATGGC.
Plasmids were transformed into XL10‐Gold ultra‐competent cells and plated on ampicillin‐impregnated LB‐agar overnight at 37 °C. Bacteria colonies were screened and plasmids purified using Qiagen miniprep kit. Sanger plasmid sequencing was done to validate the mutations.
To generate stable DVL3‐expressing MDA‐MB‐468 cells, 350,000cells were plated in a 6‐well dish. After 24 h, cells were transfected with 1 μg DNA empty vector (pcDNA3.1(+) without HA‐tag), HA‐DVL3‐WT, and HA‐DVL3‐NES point‐mutant using lipofectamine3000 reagent (Thermo Scientific). After 48 h, the cells were selected using 1 mg/ml G418 antibiotic until no cells were remaining in non‐transfected control.
Spheroid proliferation assay
Breast cancer cells were seeded (100 µl per well) at a density of 2 × 10⁴ per well into a 96‐well ultra‐low attachment (ULA) plate, forming spheroids with diameter 200–500 μm after three days. Both MCF7 and MDA‐MD‐468 required the addition of 1% Matrigel (Corning, 35234) to promote spheroid formation. The ULA plate was centrifuged (1,000 RPM, 10 min) at room temperature and then placed in the IncuCyte™ ZOOM Live‐Cell Analysis System (Essen Bioscience) to monitor the process of spheroid formation and growth. The plate was allowed to equilibrate for 20 min, and the scan was scheduled as 24 h repeat scanning (1 image per well every 4 h for 120 h) in the IncuCyte™ software using the objective 10×.
Nude mice xenograft model
All the mice SCID‐SHO (Charles River) were raised in a pathogen‐free environment within the animal laboratory animal care center (LARC) under a 12‐h light/12‐h dark cycle. Food (standard mouse chow) and water were provided ad libitum. MDA‐MB‐468 (5 × 10⁶ cells/0.2 ml, 1:1 ratio with Matrigel) and MCF7 (10 × 106 cells/0.2 ml, 1:1 ratio with Matrigel) were subcutaneously injected into the 4th mammary fat pad on the mouse’s right side. Intraperitoneally administration of 6 μg of 17β‐estradiol (Sigma, E2758) was performed daily only in MCF7 mice group. The tumor size of each mouse was monitored using IVIS once a week. Mice were humanely euthanized. The weight of the tumor excised from each of the mice was measured after euthanasia. All animal care and experimental procedures used were approved by the Institutional Animal Care and Use Committee (IACUC) at Texas Tech University Health Sciences Center and conducted in accordance with the National Institutes of Health (NIH) accepted guidelines (National Research Council (U.S.)) found in the Guide for the Care and Use of Laboratory Animals ((US) NRC, 2011).
Chromatin immunoprecipitation (ChIP), ChIP‐seq, and data analysis
ChIP was done according to a published protocol (Castro‐Piedras et al, 2018). Approximately, 2 × 10⁷ cells were harvested for ChIP. Briefly, cells were cross‐linked with 1% (w/v) formaldehyde for 8 min at room temperature and quenched in 0.125 M of glycine for 5 min at room temperature. Cells were washed twice with chilled 1X PBS containing a protease inhibitor cocktail, scraped off the plates, and collected by centrifugation. The collected cell pellet was resuspended in SDS Lysis buffer (50 mM Tris–HCl pH 8.0, 10 mM EDTA, and 1% SDS) with protease inhibitor cocktail. Cells were sonicated in a Diagenode Bioruptor sonicator for 30 cycles (30‐s pulses and 30‐s rest). The soluble chromatin fraction was quantitated, and 100 μg of chromatin was immunoprecipitated with anti‐DVL3 antibody (SAB4200007; Sigma), H3K4me3 (9751s; Cell Signaling), or rabbit IgG (I5006; Sigma) for 2 h at 4°C. Dynabeads Protein A (Invitrogen, 10002D) was added to the chromatin‐antibody mixture and incubated with rotation for 2.5 h at 4°C. ChIP isolates were washed with five low salt buffer washes (0.1% SDS, 1% Triton X‐100, 2 mM EDTA, 20 mM Tris–HCl pH 8.1, and 150 mM NaCl), three high salt buffer washes (0.1% SDS, 1% Triton X‐100, 2 mM EDTA, 20 mM Tris–HCl pH 8.1, and 500 mM NaCl), and one TE wash (1 mM EDTA and 10 mM Tris–HCl pH 8). Immunoprecipitated chromatin was reverse cross‐linked overnight at 65°C, followed by RNAseA (Promega) at 37°C for 2 h, and proteinase K incubation (Promega, 100005393) at 55°C for 2 h, and subsequently eluted and purified using Qiaquick PCR purification kit (Qiagen). The binding to promoters was quantified by real‐time qPCR in CFX96 Deep‐Well Real‐Time System (Bio‐Rad) using PowerUpTM SYBRTM Green Master Mix (Applied Biosystems) and specific ChIP primers (Table EV3).
ChIP DNA was extracted, and at least 10 ng ChIP DNA was sent to GENEWIZ and used for ChIP‐seq library preparation and sequencing. FASTQ files were analyzed using DNASTAR's Laser Gene software. The resulting gene lists were used for over‐representation pathway analysis using the Reactome pathway database https://reactome.org/ (Jassal et al, 2020). MEME‐ChIP was used to analyze DVL3 binding motifs and TOMTOM to identify whether those motifs were similar to known consensus sequences using the MEME Suite Programs http://meme‐suite.org/index.html (Bailey et al, 2009). Coverage files and putative targets of ZBTB7B (Consortium, 2012), H3K4me3 (Messier et al, 2016), H3K27ac (Davis et al, 2018), H4K8ac (GEO: GSM2258949), and KMT2D (Dreijerink et al, 2017) ChIP‐seq data from MCF7 and H3K4me3 (GEO: GSM2258893), H3K27ac (GEO: GSM2258884), and H4K8ac (GEO: GSM2258943) ChIP‐seq data from MDA‐MB‐468 were downloaded from Cistrome Data Browser http://cistrome.org/db/#/ (Liu et al, 2011). H3K9me3 (GEO:GSM4211270) and H3K27me3 (GEO: GSM4211274) MDA‐MB‐468 ChIP‐seq raw data was downloaded from Sequence Read Archive (SRA). The super‐enhancer targets for luminal and basal subtypes of breast cancer (BRCA) were downloaded from Cistrome Data Browser http://cistrome.org/CistromeCancer/TCGA_enhancer/. We downloaded the FASTQ datasets of ZBTB7B, H3K4me3, and FAIRE for MCF7 cells sets from the ENCODE (Davis et al, 2018) portal (https://www.encodeproject.org/) with the following identifiers: ENCSR277BXW, ENCSR985MIB, and ENCSR000DCR; then compared with DVL3 for MCF7 using DNASTAR's Laser Gene software. Proportional Venn diagrams to identify the overlapping genes were generated using the BioVenn tool (Hulsen et al, 2008).
Sequential ChIP (ChIP/reChIP)
Similarly to ChIP protocol, cells were seeded in a 150‐mm dish and incubated at 37°C under conventional O2 conditions. Upon 80–90% confluence, cells were counted and recovered in a 50‐ml Falcon tube. After centrifugation (200 g, 5 min), cells were washed twice with ice‐cold PBS. Subsequently, the cells were cross‐linked with 1 % formaldehyde in PBS for 10 min on a rocker at room temperature and quenched by adding glycine to a 125 mM final concentration. Cells were centrifuged (200 g, 5 min) and washed twice with ice‐cold PBS. The collected cell pellet was resuspended in SDS Lysis buffer (50 mM Tris–HCl pH 8.0, 10 mM EDTA, and 1% SDS) with protease inhibitor cocktail. Cells were sonicated in a Diagenode Bioruptor sonicator for 30 cycles (30‐s pulses and 30‐s rest). The soluble chromatin fraction was quantitated, and 400 μg of chromatin was used for immunoprecipitation. For the first round of IP, 4 μg of the following antibodies were incubated overnight at 4°C in constant rotation: (i) Rabbit IgG (I5006; Sigma), (ii) no antibody, (iii) KMT2D (HPA035977; Sigma) or H3K4me3 (9751s; Cell Signaling), (iv) rabbit IgG (I5006; Sigma), (v) no antibody, and (vi) DVL3 antibody (SAB4200007; Sigma). Simultaneously, Dynabeads Protein A (Invitrogen, 10002D) were prewashed overnight at 4°C in constant rotation with dilution buffer (1% Triton X‐100, 2 mM EDTA, 20 mM Tris–HCl pH 8.1, 150 mM NaCl; supplemented with 500 μg/ml salmon sperm DNA). Prewashed Dynabeads were added to the chromatin‐antibody mixture and incubated with rotation for 2.5 h at 4°C. ChIP material were washed twice with low salt buffer washes (0.1% SDS, 1% Triton X‐100, 2 mM EDTA, 20 mM Tris–HCl pH 8.1, and 150 mM NaCl), twice with high salt buffer washes (0.1% SDS, 1% Triton X‐100, 2 mM EDTA, 20 mM Tris–HCl pH 8.1, and 500 mM NaCl), once with a LiCl buffer wash (0.25 M LiCl, 1 % NP40, 1 % deoxycholate, 1 mM EDTA, 10 mM Tris–HCl pH 8.1), and once with a TE wash (1 mM EDTA and 10 mM Tris–HCl pH 8). To elute the immunocomplexes from the beads, the beads were resuspended in 100 μl of 10 mM DTT in TE and incubated for 30 min at 37°C and the beads were discarded using a magnet. The immunocomplexes were diluted 100 times (to a final volume of 10 ml) with dilution buffer. For the second round of IP 4 μg of the following antibodies were incubated overnight at 4°C in constant rotation: (i) DVL3 antibody (SAB4200007; Sigma), (ii) DVL3 antibody (SAB4200007; Sigma), (iii) DVL3 antibody (SAB4200007; Sigma), (iv) KMT2D (HPA035977; Sigma) or H3K4me3 (9751s; Cell Signaling), (v) KMT2D (HPA035977; Sigma) or H3K4me3 (9751s; Cell Signaling), and (vi) KMT2D (HPA035977; Sigma) or H3K4me3 (9751s; Cell Signaling). Simultaneously, Dynabeads Protein A (Invitrogen, 10002D) were prewashed overnight at 4°C in constant rotation with Dilution buffer, supplemented with 500 μg/ml salmon sperm DNA. Prewashed Dynabeads were added to the chromatin‐antibody mixture and incubated with rotation for 2.5 h at 4°C. ChIPs were washed twice with low salt wash buffer, twice with high salt wash buffer, once with LiCl wash, and once with TE wash. Immunoprecipitated chromatin was reverse cross‐linked overnight at 65°C, followed by RNAse A (Promega) at 37°C for 2 h, and proteinase K incubation (Promega, 100005393) at 55°C for 2 h, and subsequently eluted and purified using Qiaquick PCR purification kit (Qiagen). The binding on the promoters was detected by PCR using JumpStart RedTaq (Sigma).
Expression analysis
Total RNA was isolated using Aurum™ Total RNA Mini Kit (Bio‐Rad), and total RNA was reverse‐transcribed using M‐MLV Reverse Transcriptase (Promega, M170A) to synthesize first‐strand of complementary DNA (cDNA), using Oligo(dT)20 Primer (Thermo Fisher). Gene expression was quantified by real‐time qPCR in CFX96 Deep‐Well Real‐Time System (Bio‐Rad) using PowerUp™ SYBR™ Green Master Mix (Applied Biosystems, 100029284) and specific cDNA primers (Table EV4). Relative gene expression was calculated as delta (Δ Re (the difference between the cycle threshold values, Ct, of the internal control, and Ct of gene of interest)) and confirmed by 2–ΔΔ CT method.
RNA‐Seq and data analysis
RNA was prepared as described above, and library preparation and sequencing were performed at the Center for Biotechnology & Genomics of Texas Tech University. RNA quality was determined using RNA ScreenTape (Agilent). Ribosomal RNA depletion was achieved using NEB Next rRNA Depletion Kit (Human/Mouse/Rat) (NEB # E6310X). RNA fragmentation, double‐stranded cDNA, and adaptor ligation were generated using NEBNext Ultra II Directional RNA Library Prep according to the manufacturer’s protocol (NEB # E7760L). PCR‐enriched libraries were quantified by Qubit, and equimolar indexed libraries (different samples had different indexes for multiplexing) were pooled. Pooled libraries were quantitatively checked using the Agilent Tapestation 2200 and quantified using Qubit. The libraries were then diluted to 200 pM and spiked with 2% phiX libraries (Illumina control). The transcriptome sequencing was performed on the barcoded stranded RNA‐Seq libraries using Illumina NovaSeq 6000 SP flow cell, paired‐end reads (2 × 50 bp). The RNA‐Seq reads were normalized by RPKM and assembled by mapping reads directly to the annotated human reference genome using the DNASTAR SeqMan software (DNASTAR, Inc., Madison, WI). Differential gene expression levels were quantified using Fisher’s Exact Test Signal Search in the DNASTAR ArrayStar software package (DNASTAR, Inc., Madison, WI). Differentially expressed genes were filtered if they met the criterion for a twofold change, a P value that was less than.05 at a 95% confidence interval. For each comparison, genes were sorted based on fold change, from low to high. The results were ported into Excel spreadsheets where the log2 of the fold change for each gene was calculated.
The Cancer Genome Atlas (TCGA) data collection and analysis
Gene expression data for more than 1097 breast cancer samples profiled by TCGA were collected from UCSC Xena database (https://xena.ucsc.edu/; Goldman et al, 2020). The gene expression was normalized by GAPDH expression, and Pearson correlation was used to quantify the association of the expression of DVL3 or KMT2d and the top ChIP‐seq hits.
Co‐immunoprecipitation
Cells were seeded and incubated at 37°C under conventional O2 conditions. Once they were 70% confluent, cells were washed with PBS and lysed in Co‐IP lysis buffer (25 mM Tris, pH 7.4, 150 mM NaCl, 1 mM EDTA, 1% NP‐40, 5% glycerol, and Protease inhibitor cocktail). This was followed by quantification for equal protein loading using standard BCA protocol (Thermo Scientific, 23227). Cell extracts were incubated with 2 μg of DVL3‐specific antibody (SAB4200007; Sigma), ZBTB7B (A303‐701A, Bethyl Laboratories Inc.), KMT2D (HPA035977; Sigma), and species‐matched IgG as a negative control for 2 h/4°C. Protein A Dynabeads (Life Technologies) were incubated with the antigen‐antibody complex for 2 h/4°C. Beads were washed four times with lysis buffer with gentle agitation for 5 min per wash. 5× sample buffer (Invitrogen) was used for elution of complex from beads followed by Western blotting along with WCE.
Histone extraction
Cells were seeded and incubated at 37°C under conventional O2 conditions, and once 70% confluent, cells were harvested and washed twice with ice‐cold PBS. Cells were resuspended in Triton Extraction Buffer (TEB: PBS containing 0.5% Triton X‐100 (v/v), 2 mM phenylmethylsulfonyl fluoride (PMSF), 0.02% (w/v) NaN3) at a cell density of 107 cells per ml and lysed on ice for 10 min with gentle stirring, followed by centrifugation at 6,500 g for 10 min at 4°C to pellet the nuclei and discard the supernatant. Nuclei were washed in half the volume of TEB and centrifuged as before. The nuclei were resuspended in 0.2 N HCl at a density of 4 × 10⁷ nuclei per ml to acid extract the histones over night at 4°C. The samples were centrifuged at 6,500 g for 10 min at 4°C to pellet debris, and the supernatant (which contains the histone proteins) was neutralized with 2 M NaOH at 1/10 of the volume of the supernatant. This was followed by quantification for equal protein loading using standard BCA protocol (Thermo Scientific, 23227). Then, the samples were subjected to Western blot using the following antibodies: H3K4me3 (3724‐CS; Cell Signaling) and H3 total (9715‐CS; Cell Signaling).
Immunofluorescence
3.5 × 10⁵ cells were seeded onto coverslips (12 mm) in a 60‐mm tissue culture dish. The cells were fixed with 4% paraformaldehyde for 15’ at room temperature (RT), followed by quenching with 50 mM ammonium chloride (NH4Cl), permeabilization with 1% Triton X‐100 for 10 mins. The coverslips were blocked with 5% BSA for 30 min, followed by 1‐h incubation with the primary antibody, HA (cst‐3724; Cell Signalling) or KMT2D (HPA035977; Sigma). Samples were then incubated with secondary antibodies: Alexa flour 568 #A11036, and phalloidin 488 #A12379 (Thermo Scientific) for 1 h at RT. The samples were rinsed in PBS for 5 min and mounted with prolong gold antifade mounting solution with DAPI (P36941, Thermo Scientific), then cured overnight at RT, and stored at −20°C until imaged. The samples were imaged using a laser scanning confocal microscope Nikon T‐1E with a 60× objective and NIS software.
Statistical analysis
All experiments were conducted in a randomized and blinded manner to experimental conditions. Data were analyzed using unpaired Student's t‐tests or using one‐way analysis of variance (ANOVA) to assess whether differences observed in the various experiments were significant and Pearson correlation to evaluate whether there is statistical evidence for a linear relationship in the gene expression of the selected genes. The different components of the total variation were settled a priori using multiple regression analysis (GraphPad Prism software). The over‐representation pathway analysis was used to assess whether relevant pathways can be detected in the DVL3 ChIP‐seq hits (http://reactome.org). The Reactome analysis used the Binomial test, and it is calculated using the Benjamini–Hochberg approach (Fabregat et al, 2017). All results are expressed as mean ± SEM and considered significant at *P < 0.05.
Author contributions
Discussion and experiment design: ICP and KP; Design of in vivo experiments: JG; Experiments and statistical data analysis: ICP, JB, MS, DV, EGM, CR, and DM. RNA‐Seq: MF; Data analysis of ChIP‐seq and RNA‐Seq experiments: ICP; Manuscript writing and editing: ICP, MS, and KP; Manuscript review and revision: ICP, JB, MS, DV, EGM, CR, DM, RKB, MF, JG, and KP.
Conflict of interest
The authors have no competing interests as defined by EMBO Reports, or other interests that might be perceived to influence the results and/or discussion reported in this paper.
Supporting information
Expanded View Figures PDF
Table EV1
Table EV2
Table EV3
Table EV4
Source Data for Expanded View
Review Process File
Source Data for Figure 6
Acknowledgements
We are grateful to Dr. Madhurima Saxena for insightful discussion regarding the manuscript. The IVIS and immunofluorescence images were generated in the Image Analysis Core Facility, supported in part by TTUHSC. This work was supported by the National Institute of Health [CA155223 to KP, and 1S10OD025115‐01 to the Center for Biotechnology and Genomics], National Institute on Drug Abuse [DA 044999‐01A1 to JG] and a Cancer Prevention and Research Institute of Texas (CPRIT) Award (RR140008) to KP.
EMBO reports (2021) 22: e50600.
Data availability
The datasets produced in this study are available in the following databases:
ChIP‐seq data: Gene Expression Omnibus (GSE165774) https://www.ncbi.nlm.nih.gov/geo/query/acc.cgi?acc=GSE165774
RNA‐Seq data: Gene Expression Omnibus (GSE165773) https://www.ncbi.nlm.nih.gov/geo/query/acc.cgi?acc=GSE165773
References
- Aggarwal A, Hunter WJ 3rd, Aggarwal H, Silva ED, Davey MS, Murphy RF, Agrawal DK (2010) Expression of leukemia/lymphoma‐related factor (LRF/POKEMON) in human breast carcinoma and other cancers. Exp Mol Pathol 89: 140–148 [DOI] [PMC free article] [PubMed] [Google Scholar]
- Akiri G, Cherian MM, Vijayakumar S, Liu G, Bafico A, Aaronson SA (2009) Wnt pathway aberrations including autocrine Wnt activation occur at high frequency in human non‐small‐cell lung carcinoma. Oncogene 28: 2163–2172 [DOI] [PMC free article] [PubMed] [Google Scholar]
- Alam H, Tang M, Maitituoheti M, Dhar SS, Kumar M, Han CY, Ambati CR, Amin SB, Gu B, Chen T‐Y et al (2020) KMT2D deficiency impairs super‐enhancers to confer a glycolytic vulnerability in lung cancer. Cancer Cell 37: 599–617 [DOI] [PMC free article] [PubMed] [Google Scholar]
- Allis CD, Berger SL, Cote J, Dent S, Jenuwien T, Kouzarides T, Pillus L, Reinberg D, Shi Y, Shiekhattar R et al (2007) New nomenclature for chromatin‐modifying enzymes. Cell 131: 633–636 [DOI] [PubMed] [Google Scholar]
- Ang SY, Uebersohn A, Spencer CI, Huang Y, Lee JE, Ge K, Bruneau BG (2016) KMT2D regulates specific programs in heart development via histone H3 lysine 4 di‐methylation. Development 143: 810–821 [DOI] [PMC free article] [PubMed] [Google Scholar]
- Augustin I, Dewi DL, Hundshammer J, Erdmann G, Kerr G, Boutros M (2017) Autocrine Wnt regulates the survival and genomic stability of embryonic stem cells. Sci Signal 10: eaah6829 [DOI] [PubMed] [Google Scholar]
- Bafico A, Liu G, Goldin L, Harris V, Aaronson SA (2004) An autocrine mechanism for constitutive Wnt pathway activation in human cancer cells. Cancer Cell 6: 497–506 [DOI] [PubMed] [Google Scholar]
- Bailey TL, Boden M, Buske FA, Frith M, Grant CE, Clementi L, Ren J, Li WW, Noble WS (2009) MEME SUITE: tools for motif discovery and searching. Nucleic Acids Res 37: W202–W208 [DOI] [PMC free article] [PubMed] [Google Scholar]
- Barski A, Cuddapah S, Cui K, Roh TY, Schones DE, Wang Z, Wei G, Chepelev I, Zhao K (2007) High‐resolution profiling of histone methylations in the human genome. Cell 129: 823–837 [DOI] [PubMed] [Google Scholar]
- Benhaj K, Akcali KC, Ozturk M (2006) Redundant expression of canonical Wnt ligands in human breast cancer cell lines. Oncol Rep 15: 701–707 [PubMed] [Google Scholar]
- Bernascone I, González T, Barea MD, Carabaña C, Hachimi M, Bosch‐Fortea M, Santamaria S, Martin R, Tarnick J, Garcia‐Sanz JA et al (2019) Sfrp3 modulates stromal‐epithelial crosstalk during mammary gland development by regulating Wnt levels. Nat Commun 10: 2481 [DOI] [PMC free article] [PubMed] [Google Scholar]
- Bleckmann A, Conradi LC, Menck K, Schmick NA, Schubert A, Rietkotter E, Arackal J, Middel P, Schambony A, Liersch T et al (2016) beta‐catenin‐independent WNT signaling and Ki67 in contrast to the estrogen receptor status are prognostic and associated with poor prognosis in breast cancer liver metastases. Clin Exp Metastasis 33: 309–323 [DOI] [PMC free article] [PubMed] [Google Scholar]
- Bulun SE, Lin Z, Zhao H, Lu M, Amin S, Reierstad S, Chen D (2009) Regulation of aromatase expression in breast cancer tissue. Ann N Y Acad Sci 1155: 121–131 [DOI] [PubMed] [Google Scholar]
- Castagnoli L, Cancila V, Cordoba‐Romero SL, Faraci S, Talarico G, Belmonte B, Iorio MV, Milani M, Volpari T, Chiodoni C et al (2019) WNT signaling modulates PD‐L1 expression in the stem cell compartment of triple‐negative breast cancer. Oncogene 38: 4047–4060 [DOI] [PMC free article] [PubMed] [Google Scholar]
- Castro‐Piedras I, Sharma M, den Bakker M, Molehin D, Martinez EG, Vartak D, Pruitt WM, Deitrick J, Almodovar S, Pruitt K (2018) DVL1 and DVL3 differentially localize to CYP19A1 promoters and regulate aromatase mRNA in breast cancer cells. Oncotarget 9: 35639–35654 [DOI] [PMC free article] [PubMed] [Google Scholar]
- Castro‐Piedras I, Vartak D, Sharma M, Pandey S, Casas L, Molehin D, Rasha F, Fokar M, Nichols J, Almodovar S et al (2020) Identification of novel MeCP2 cancer‐associated target genes and post‐translational modifications. Front Oncol 10: 576362 [DOI] [PMC free article] [PubMed] [Google Scholar]
- Chiang C, Ayyanathan K (2013) Snail/Gfi‐1 (SNAG) family zinc finger proteins in transcription regulation, chromatin dynamics, cell signaling, development, and disease. Cytokine Growth Factor Rev 24: 123–131 [DOI] [PMC free article] [PubMed] [Google Scholar]
- Clevers H, Loh KM, Nusse R (2014) Stem cell signaling. An integral program for tissue renewal and regeneration: Wnt signaling and stem cell control. Science 346: 1248012 [DOI] [PubMed] [Google Scholar]
- Consortium EP (2012) An integrated encyclopedia of DNA elements in the human genome. Nature 489: 57–74 [DOI] [PMC free article] [PubMed] [Google Scholar]
- de La Coste A, Freitas AA (2006) Notch signaling: distinct ligands induce specific signals during lymphocyte development and maturation. Immunol Lett 102: 1–9 [DOI] [PubMed] [Google Scholar]
- Creyghton Mp, Cheng Aw, Welstead Gg, Kooistra T, Carey Bw, Steine Ej, Hanna J, Lodato Ma, Frampton Gm, Sharp Pa et al (2010) Histone H3K27ac separates active from poised enhancers and predicts developmental state. Proc Natl Acad Sci USA 107: 21931–21936 [DOI] [PMC free article] [PubMed] [Google Scholar]
- Dass RA, Sarshad AA, Carson BB, Feenstra JM, Kaur A, Obrdlik A, Parks MM, Prakash V, Love DK, Pietras K et al (2016) Wnt5a Signals through DVL1 to Repress Ribosomal DNA Transcription by RNA Polymerase I. PLoS Genet 12: e1006217 [DOI] [PMC free article] [PubMed] [Google Scholar]
- Davis CA, Hitz BC, Sloan CA, Chan ET, Davidson JM, Gabdank I, Hilton JA, Jain K, Baymuradov UK, Narayanan AK et al (2018) The Encyclopedia of DNA elements (ENCODE): data portal update. Nucleic Acids Res 46: D794–D801 [DOI] [PMC free article] [PubMed] [Google Scholar]
- Dhar SS, Zhao D, Lin T, Gu B, Pal K, Wu SJ, Alam H, Lv J, Yun K, Gopalakrishnan V et al (2018) MLL4 is required to maintain broad H3K4me3 peaks and super‐enhancers at tumor suppressor genes. Mol Cell 70: 825–841 [DOI] [PMC free article] [PubMed] [Google Scholar]
- DiMeo TA, Anderson K, Phadke P, Fan C, Perou CM, Naber S, Kuperwasser C (2009) A novel lung metastasis signature links Wnt signaling with cancer cell self‐renewal and epithelial‐mesenchymal transition in basal‐like breast cancer. Cancer Res 69: 5364–5373 [DOI] [PMC free article] [PubMed] [Google Scholar]
- Dose M, Emmanuel Ao, Chaumeil J, Zhang J, Sun T, Germar K, Aghajani K, Davis Em, Keerthivasan S, Bredemeyer Al et al (2014) beta‐Catenin induces T‐cell transformation by promoting genomic instability. Proc Natl Acad Sci USA 111: 391–396 [DOI] [PMC free article] [PubMed] [Google Scholar]
- Dreijerink KMA, Groner AC, Vos ESM, Font‐Tello A, Gu L, Chi D, Reyes J, Cook J, Lim E, Lin CY et al (2017) Enhancer‐mediated oncogenic function of the menin tumor suppressor in breast cancer. Cell Rep 18: 2359–2372 [DOI] [PMC free article] [PubMed] [Google Scholar]
- Dumont N, Wilson MB, Crawford YG, Reynolds PA, Sigaroudinia M, Tlsty TD (2008) Sustained induction of epithelial to mesenchymal transition activates DNA methylation of genes silenced in basal‐like breast cancers. Proc Natl Acad Sci USA 105: 14867–14872 [DOI] [PMC free article] [PubMed] [Google Scholar]
- Etheridge SL, Ray S, Li S, Hamblet NS, Lijam N, Tsang M, Greer J, Kardos N, Wang J, Sussman DJ et al (2008) Murine dishevelled 3 functions in redundant pathways with dishevelled 1 and 2 in normal cardiac outflow tract, cochlea, and neural tube development. PLoS Genet 4: e1000259 [DOI] [PMC free article] [PubMed] [Google Scholar]
- Fabregat A, Sidiropoulos K, Viteri G, Forner O, Marin‐Garcia P, Arnau V, D'Eustachio P, Stein L, Hermjakob H (2017) Reactome pathway analysis: a high‐performance in‐memory approach. BMC Bioinformatics 18: 142 [DOI] [PMC free article] [PubMed] [Google Scholar]
- Froimchuk E, Jang Y, Ge K (2017) Histone H3 lysine 4 methyltransferase KMT2D. Gene 627: 337–342 [DOI] [PMC free article] [PubMed] [Google Scholar]
- Gammons M, Bienz M (2018) Multiprotein complexes governing Wnt signal transduction. Curr Opin Cell Biol 51: 42–49 [DOI] [PubMed] [Google Scholar]
- Gan XQ, Wang JY, Xi Y, Wu ZL, Li YP, Li L (2008) Nuclear Dvl, c‐Jun, beta‐catenin, and TCF form a complex leading to stabilization of beta‐catenin‐TCF interaction. J Cell Biol 180: 1087–1100 [DOI] [PMC free article] [PubMed] [Google Scholar]
- Gao C, Chen YG (2010) Dishevelled: the hub of Wnt signaling. Cell Signal 22: 717–727 [DOI] [PubMed] [Google Scholar]
- Gardner KE, Allis CD, Strahl BD (2011) Operating on chromatin, a colorful language where context matters. J Mol Biol 409: 36–46 [DOI] [PMC free article] [PubMed] [Google Scholar]
- Gavin BJ, McMahon AP (1992) Differential regulation of the Wnt gene family during pregnancy and lactation suggests a role in postnatal development of the mammary gland. Mol Cell Biol 12: 2418–2423 [DOI] [PMC free article] [PubMed] [Google Scholar]
- Gaviraghi M, Vivori C, Pareja Sanchez Y, Invernizzi F, Cattaneo A, Santoliquido BM, Frenquelli M, Segalla S, Bachi A, Doglioni C et al (2018) Tumor suppressor PNRC1 blocks rRNA maturation by recruiting the decapping complex to the nucleolus. EMBO J 37: e99179 [DOI] [PMC free article] [PubMed] [Google Scholar]
- Gentzel M, Schambony A (2017) Dishevelled paralogs in vertebrate development: redundant or distinct? Front Cell Dev Biol 5: 59 [DOI] [PMC free article] [PubMed] [Google Scholar]
- Geyer FC, Lacroix‐Triki M, Savage K, Arnedos M, Lambros MB, MacKay A, Natrajan R, Reis‐Filho JS (2011) beta‐Catenin pathway activation in breast cancer is associated with triple‐negative phenotype but not with CTNNB1 mutation. Mod Pathol 24: 209–231 [DOI] [PubMed] [Google Scholar]
- Goldman MJ, Craft B, Hastie M, Repečka K, McDade F, Kamath A, Banerjee A, Luo Y, Rogers D, Brooks AN et al (2020) Visualizing and interpreting cancer genomics data via the Xena platform. Nat Biotechnol 38: 675–678 [DOI] [PMC free article] [PubMed] [Google Scholar]
- Guo C, Chen LH, Huang Y, Chang C‐C, Wang P, Pirozzi CJ, Qin X, Bao X, Greer PK, McLendon RE et al (2013) KMT2D maintains neoplastic cell proliferation and global histone H3 lysine 4 monomethylation. Oncotarget 4: 2144–2153 [DOI] [PMC free article] [PubMed] [Google Scholar]
- Habas R, Dawid IB (2005) Dishevelled and Wnt signaling: is the nucleus the final frontier? J Biol 4: 2 [DOI] [PMC free article] [PubMed] [Google Scholar]
- Hadjihannas MV, Bruckner M, Jerchow B, Birchmeier W, Dietmaier W, Behrens J (2006) Aberrant Wnt/beta‐catenin signaling can induce chromosomal instability in colon cancer. Proc Natl Acad Sci USA 103: 10747–10752 [DOI] [PMC free article] [PubMed] [Google Scholar]
- Hanahan D, Weinberg RA (2011) Hallmarks of cancer: the next generation. Cell 144: 646–674 [DOI] [PubMed] [Google Scholar]
- Holloway KR, Calhoun TN, Saxena M, Metoyer CF, Kandler EF, Rivera CA, Pruitt K (2010) SIRT1 regulates Dishevelled proteins and promotes transient and constitutive Wnt signaling. Proc Natl Acad Sci USA 107: 9216–9221 [DOI] [PMC free article] [PubMed] [Google Scholar]
- Hulsen T, de Vlieg J, Alkema W (2008) BioVenn ‐ a web application for the comparison and visualization of biological lists using area‐proportional Venn diagrams. BMC Genom 9: 488 [DOI] [PMC free article] [PubMed] [Google Scholar]
- Hyun K, Jeon J, Park K, Kim J (2017) Writing, erasing and reading histone lysine methylations. Exp Mol Med 49: e324 [DOI] [PMC free article] [PubMed] [Google Scholar]
- Imajo M, Miyatake K, Iimura A, Miyamoto A, Nishida E (2012) A molecular mechanism that links Hippo signalling to the inhibition of Wnt/beta‐catenin signalling. EMBO J 31: 1109–1122 [DOI] [PMC free article] [PubMed] [Google Scholar]
- Itoh K, Brott BK, Bae GU, Ratcliffe MJ, Sokol SY (2005) Nuclear localization is required for Dishevelled function in Wnt/beta‐catenin signaling. J Biol 4: 3 [DOI] [PMC free article] [PubMed] [Google Scholar]
- Jassal B, Matthews L, Viteri G, Gong C, Lorente P, Fabregat A, Sidiropoulos K, Cook J, Gillespie M, Haw R et al (2020) The reactome pathway knowledgebase. Nucleic Acids Res 48: D498–D503 [DOI] [PMC free article] [PubMed] [Google Scholar]
- Jiang L, Siu MK, Wong OG, Tam KF, Lam EW, Ngan HY, Le XF, Wong ES, Chan HY, Cheung AN (2010) Overexpression of proto‐oncogene FBI‐1 activates membrane type 1‐matrix metalloproteinase in association with adverse outcome in ovarian cancers. Mol Cancer 9: 318 [DOI] [PMC free article] [PubMed] [Google Scholar]
- Kabelitz D, Serrano R, Kouakanou L, Peters C, Kalyan S (2020) Cancer immunotherapy with gammadelta T cells: many paths ahead of us. Cell Mol Immunol 17: 925–939 [DOI] [PMC free article] [PubMed] [Google Scholar]
- Kelly A, Trowsdale J (2019) Genetics of antigen processing and presentation. Immunogenetics 71: 161–170 [DOI] [PMC free article] [PubMed] [Google Scholar]
- Kessenbrock K, Smith P, Steenbeek SC, Pervolarakis N, Kumar R, Minami Y, Goga A, Hinck L, Werb Z (2017) Diverse regulation of mammary epithelial growth and branching morphogenesis through noncanonical Wnt signaling. Proc Natl Acad Sci USA 114: 3121–3126 [DOI] [PMC free article] [PubMed] [Google Scholar]
- Khramtsov AI, Khramtsova GF, Tretiakova M, Huo D, Olopade OI, Goss KH (2010) Wnt/beta‐catenin pathway activation is enriched in basal‐like breast cancers and predicts poor outcome. Am J Pathol 176: 2911–2920 [DOI] [PMC free article] [PubMed] [Google Scholar]
- Klarmann GJ, Decker A, Farrar WL (2008) Epigenetic gene silencing in the Wnt pathway in breast cancer. Epigenetics 3: 59–63 [DOI] [PMC free article] [PubMed] [Google Scholar]
- Klemm F, Bleckmann A, Siam L, Chuang HN, Rietkotter E, Behme D, Schulz M, Schaffrinski M, Schindler S, Trumper L et al (2011) beta‐catenin‐independent WNT signaling in basal‐like breast cancer and brain metastasis. Carcinogenesis 32: 434–442 [DOI] [PubMed] [Google Scholar]
- Ko JY, Oh S, Yoo KH (2017) Functional enhancers as master regulators of tissue‐specific gene regulation and cancer development. Mol Cells 40: 169–177 [DOI] [PMC free article] [PubMed] [Google Scholar]
- Konsavage WM Jr, Yochum GS (2013) Intersection of Hippo/YAP and Wnt/beta‐catenin signaling pathways. Acta Biochim Biophys Sin (Shanghai) 45: 71–79 [DOI] [PubMed] [Google Scholar]
- Lee Y, Kim NH, Cho ES, Yang JH, Cha YH, Kang HE, Yun JS, Cho SB, Lee S‐H, Paclikova P et al (2018) Dishevelled has a YAP nuclear export function in a tumor suppressor context‐dependent manner. Nat Commun 9: 2301 [DOI] [PMC free article] [PubMed] [Google Scholar]
- Li J, Yu B, Deng P, Cheng Y, Yu Y, Kevork K, Ramadoss S, Ding X, Li X, Wang CY (2017) KDM3 epigenetically controls tumorigenic potentials of human colorectal cancer stem cells through Wnt/beta‐catenin signalling. Nat Commun 8: 15146 [DOI] [PMC free article] [PubMed] [Google Scholar]
- Li QL, Wang DY, Ju LG, Yao J, Gao C, Lei PJ, Li LY, Zhao XL, Wu M (2019) The hyper‐activation of transcriptional enhancers in breast cancer. Clin Epigenetics 11: 48 [DOI] [PMC free article] [PubMed] [Google Scholar]
- Li K, Zhang J, Tian Y, He Y, Xu X, Pan W, Gao Y, Chen F, Wei L (2020a) The Wnt/beta‐catenin/VASP positive feedback loop drives cell proliferation and migration in breast cancer. Oncogene 39: 2258–2274 [DOI] [PubMed] [Google Scholar]
- Li Y, Chen F, Shen W, Li B, Xiang R, Qu L, Zhang C, Li G, Xie H, Katanaev VL et al (2020b) WDR74 induces nuclear beta‐catenin accumulation and activates Wnt‐responsive genes to promote lung cancer growth and metastasis. Cancer Lett 471: 103–115 [DOI] [PubMed] [Google Scholar]
- Liao XH, Wang JG, Li LY, Zhou DM, Ren KH, Jin YT, Lv L, Yu JG, Yang JY, Lu Q et al (2016) Long intergenic non‐coding RNA APOC1P1‐3 inhibits apoptosis by decreasing alpha‐tubulin acetylation in breast cancer. Cell Death Dis 7: e2236 [DOI] [PMC free article] [PubMed] [Google Scholar]
- Lin‐Shiao E, Lan Y, Coradin M, Anderson A, Donahue G, Simpson CL, Sen P, Saffie R, Busino L, Garcia BA et al (2018) KMT2D regulates p63 target enhancers to coordinate epithelial homeostasis. Genes Dev 32: 181–193 [DOI] [PMC free article] [PubMed] [Google Scholar]
- Liu X, Mazanek P, Dam V, Wang Q, Zhao H, Guo R, Jagannathan J, Cnaan A, Maris JM, Hogarty MD (2008) Deregulated Wnt/beta‐catenin program in high‐risk neuroblastomas without MYCN amplification. Oncogene 27: 1478–1488 [DOI] [PubMed] [Google Scholar]
- Liu T, Ortiz JA, Taing L, Meyer CA, Lee B, Zhang Y, Shin H, Wong SS, Ma J, Lei Y et al (2011) Cistrome: an integrative platform for transcriptional regulation studies. Genome Biol 12: R83 [DOI] [PMC free article] [PubMed] [Google Scholar]
- Liu J, Zhao M, Yuan B, Gu S, Zheng M, Zou J, Jin J, Liu T, Feng XH (2018) WDR74 functions as a novel coactivator in TGF‐beta signaling. J Genet Genomics 45: 639–650 [DOI] [PubMed] [Google Scholar]
- Longo KA, Kennell JA, Ochocinska MJ, Ross SE, Wright WS, MacDougald OA (2002) Wnt signaling protects 3T3‐L1 preadipocytes from apoptosis through induction of insulin‐like growth factors. J Biol Chem 277: 38239–38244 [DOI] [PubMed] [Google Scholar]
- Matsuda Y, Schlange T, Oakeley EJ, Boulay A, Hynes NE (2009) WNT signaling enhances breast cancer cell motility and blockade of the WNT pathway by sFRP1 suppresses MDA‐MB‐231 xenograft growth. Breast Cancer Res 11: R32 [DOI] [PMC free article] [PubMed] [Google Scholar]
- Messier TL, Gordon JA, Boyd JR, Tye CE, Browne G, Stein JL, Lian JB, Stein GS (2016) Histone H3 lysine 4 acetylation and methylation dynamics define breast cancer subtypes. Oncotarget 7: 5094–5109 [DOI] [PMC free article] [PubMed] [Google Scholar]
- Mlodzik M (2016) The Dishevelled protein family: still rather a mystery after over 20 years of molecular studies. Curr Top Dev Biol 117: 75–91 [DOI] [PMC free article] [PubMed] [Google Scholar]
- Molehin D, Castro‐Piedras I, Sharma M, Sennoune SR, Arena D, Manna PR, Pruitt K (2018) Aromatase acetylation patterns and altered activity in response to sirtuin inhibition. Mol Cancer Res 16: 1530–1542 [DOI] [PMC free article] [PubMed] [Google Scholar]
- Pandey S, Simmons GE Jr, Malyarchuk S, Calhoun TN, Pruitt K (2015) A novel MeCP2 acetylation site regulates interaction with ATRX and HDAC1. Genes Cancer 6: 408–421 [DOI] [PMC free article] [PubMed] [Google Scholar]
- Pruitt K, Zinn RL, Ohm JE, McGarvey KM, Kang SH, Watkins DN, Herman JG, Baylin SB (2006) Inhibition of SIRT1 reactivates silenced cancer genes without loss of promoter DNA hypermethylation. PLoS Genet 2: e40 [DOI] [PMC free article] [PubMed] [Google Scholar]
- Pruitt K (2016) Molecular and cellular changes during cancer progression resulting from genetic and epigenetic alterations. Prog Mol Biol Transl Sci 144: 3–47 [DOI] [PubMed] [Google Scholar]
- Qu H, Qu D, Chen F, Zhang Z, Liu B, Liu H (2010) ZBTB7 overexpression contributes to malignancy in breast cancer. Cancer Invest 28: 672–678 [DOI] [PubMed] [Google Scholar]
- Rao RC, Dou Y (2015) Hijacked in cancer: the KMT2 (MLL) family of methyltransferases. Nat Rev Cancer 15: 334–346 [DOI] [PMC free article] [PubMed] [Google Scholar]
- Rasha F, Mims BM, Castro‐Piedras I, Barnes BJ, Grisham MB, Rahman RL, Pruitt K (2020) The versatility of Sirtuin‐1 in endocrinology and immunology. Front Cell Dev Biol 8: 589016 [DOI] [PMC free article] [PubMed] [Google Scholar]
- Rieger ME, Sims AH, Coats ER, Clarke RB, Briegel KJ (2010) The embryonic transcription cofactor LBH is a direct target of the Wnt signaling pathway in epithelial development and in aggressive basal subtype breast cancers. Mol Cell Biol 30: 4267–4279 [DOI] [PMC free article] [PubMed] [Google Scholar]
- Rothenberg EV (2019) Programming for T‐lymphocyte fates: modularity and mechanisms. Genes Dev 33: 1117–1135 [DOI] [PMC free article] [PubMed] [Google Scholar]
- Salz T, Li G, Kaye F, Zhou L, Qiu Y, Huang S (2014) hSETD1A regulates Wnt target genes and controls tumor growth of colorectal cancer cells. Cancer Res 74: 775–786 [DOI] [PMC free article] [PubMed] [Google Scholar]
- Santos‐Rosa H, Schneider R, Bannister AJ, Sherriff J, Bernstein BE, Emre NC, Schreiber SL, Mellor J, Kouzarides T (2002) Active genes are tri‐methylated at K4 of histone H3. Nature 419: 407–411 [DOI] [PubMed] [Google Scholar]
- Saxena M, Dykes SS, Malyarchuk S, Wang AE, Cardelli JA, Pruitt K (2015) The sirtuins promote Dishevelled‐1 scaffolding of TIAM1, Rac activation and cell migration. Oncogene 34: 188–198 [DOI] [PMC free article] [PubMed] [Google Scholar]
- Schlange T, Matsuda Y, Lienhard S, Huber A, Hynes NE (2007) Autocrine WNT signaling contributes to breast cancer cell proliferation via the canonical WNT pathway and EGFR transactivation. Breast Cancer Res 9: R63 [DOI] [PMC free article] [PubMed] [Google Scholar]
- Sharma M, Castro‐Piedras I, Simmons GE Jr, Pruitt K (2018) Dishevelled: A masterful conductor of complex Wnt signals. Cell Signal 47: 52–64 [DOI] [PMC free article] [PubMed] [Google Scholar]
- Sharma M, Molehin D, Castro‐Piedras I, Martinez EG, Pruitt K (2019) Acetylation of conserved DVL‐1 lysines regulates its nuclear translocation and binding to gene promoters in triple‐negative breast cancer. Sci Rep 9: 16257 [DOI] [PMC free article] [PubMed] [Google Scholar]
- Sharma M, Pruitt K (2020) Wnt pathway: an integral hub for developmental and oncogenic signaling networks. Int J Mol Sci 21: 8018 [DOI] [PMC free article] [PubMed] [Google Scholar]
- Shlyueva D, Stampfel G, Stark A (2014) Transcriptional enhancers: from properties to genome‐wide predictions. Nat Rev Genet 15: 272–286 [DOI] [PubMed] [Google Scholar]
- Simmons GE Jr, Pandey S, Nedeljkovic‐Kurepa A, Saxena M, Wang A, Pruitt K (2014) Frizzled 7 expression is positively regulated by SIRT1 and beta‐catenin in breast cancer cells. PLoS One 9: e98861 [DOI] [PMC free article] [PubMed] [Google Scholar]
- Sreekumar A, Toneff MJ, Toh E, Roarty K, Creighton CJ, Belka GK, Lee D‐K, Xu J, Chodosh LA, Richards JS et al (2017) WNT‐mediated regulation of FOXO1 constitutes a critical axis maintaining pubertal mammary stem cell homeostasis. Dev Cell 43: 436–448 [DOI] [PMC free article] [PubMed] [Google Scholar]
- Sun C, Zhou Z, Shi H, Li F, Zhang G (2019) Identification of long noncoding RNA APOC1P1 as an oncogene in clear cell renal cell carcinoma. Dis Markers 2019: 2814058 [DOI] [PMC free article] [PubMed] [Google Scholar]
- Sundqvist A, Morikawa M, Ren J, Vasilaki E, Kawasaki N, Kobayashi M, Koinuma D, Aburatani H, Miyazono K, Heldin CH et al (2018) JUNB governs a feed‐forward network of TGFbeta signaling that aggravates breast cancer invasion. Nucleic Acids Res 46: 1180–1195 [DOI] [PMC free article] [PubMed] [Google Scholar]
- Tang F, Yang Z, Tan Y, Li Y (2020) Super‐enhancer function and its application in cancer targeted therapy. NPJ Precis Oncol 4: 2 [DOI] [PMC free article] [PubMed] [Google Scholar]
- Torres MA, Nelson WJ (2000) Colocalization and redistribution of dishevelled and actin during Wnt‐induced mesenchymal morphogenesis. J Cell Biol 149: 1433–1442 [DOI] [PMC free article] [PubMed] [Google Scholar]
- (US) NRC (2011) Guide for the care and use of laboratory animals. National Academies Press, Washington (DC), USA; [PubMed] [Google Scholar]
- Vallianatos CN, Iwase S (2015) Disrupted intricacy of histone H3K4 methylation in neurodevelopmental disorders. Epigenomics 7: 503–519 [DOI] [PMC free article] [PubMed] [Google Scholar]
- Varelas X, Miller BW, Sopko R, Song S, Gregorieff A, Fellouse FA, Sakuma R, Pawson T, Hunziker W, McNeill H et al (2010) The Hippo pathway regulates Wnt/beta‐catenin signaling. Dev Cell 18: 579–591 [DOI] [PubMed] [Google Scholar]
- Vyborova A, Beringer DX, Fasci D, Karaiskaki F, van Diest E, Kramer L, de Haas A, Sanders J, Janssen A, Straetemans T et al (2020) gamma9delta2T cell diversity and the receptor interface with tumor cells. J Clin Invest 130: 4637–4651 [DOI] [PMC free article] [PubMed] [Google Scholar]
- Wang L, Wildt KF, Castro E, Xiong Y, Feigenbaum L, Tessarollo L, Bosselut R (2008) The zinc finger transcription factor Zbtb7b represses CD8‐lineage gene expression in peripheral CD4+ T cells. Immunity 29: 876–887 [DOI] [PMC free article] [PubMed] [Google Scholar]
- Wang W, Li X, Lee M, Jun S, Aziz KE, Feng L, Tran MK, Li N, McCrea PD, Park JI et al (2015) FOXKs promote Wnt/beta‐catenin signaling by translocating DVL into the nucleus. Dev Cell 32: 707–718 [DOI] [PMC free article] [PubMed] [Google Scholar]
- Weitzman JB (2005) Dishevelled nuclear shuttling. J Biol 4: 1 [DOI] [PMC free article] [PubMed] [Google Scholar]
- Wielenga VJ, Smits R, Korinek V, Smit L, Kielman M, Fodde R, Clevers H, Pals ST (1999) Expression of CD44 in Apc and Tcf mutant mice implies regulation by the WNT pathway. Am J Pathol 154: 515–523 [DOI] [PMC free article] [PubMed] [Google Scholar]
- Wildt KF, Sun G, Grueter B, Fischer M, Zamisch M, Ehlers M, Bosselut R (2007) The transcription factor Zbtb7b promotes CD4 expression by antagonizing Runx‐mediated activation of the CD4 silencer. J Immunol 179: 4405–4414 [DOI] [PubMed] [Google Scholar]
- Wu B, Crampton SP, Hughes CC (2007) Wnt signaling induces matrix metalloproteinase expression and regulates T cell transmigration. Immunity 26: 227–239 [DOI] [PMC free article] [PubMed] [Google Scholar]
- Wu H, Nord AS, Akiyama JA, Shoukry M, Afzal V, Rubin EM, Pennacchio LA, Visel A (2014) Tissue‐specific RNA expression marks distant‐acting developmental enhancers. PLoS Genet 10: e1004610 [DOI] [PMC free article] [PubMed] [Google Scholar]
- Xiao Q, Wu J, Wang WJ, Chen S, Zheng Y, Yu X, Meeth K, Sahraei M, Bothwell ALM, Chen L et al (2018) DKK2 imparts tumor immunity evasion through beta‐catenin‐independent suppression of cytotoxic immune‐cell activation. Nat Med 24: 262–270 [DOI] [PMC free article] [PubMed] [Google Scholar]
- Xu J, Suzuki M, Niwa Y, Hiraga J, Nagasaka T, Ito M, Nakamura S, Tomita A, Abe A, Kiyoi H et al (2008) Clinical significance of nuclear non‐phosphorylated beta‐catenin in acute myeloid leukaemia and myelodysplastic syndrome. Br J Haematol 140: 394–401 [DOI] [PMC free article] [PubMed] [Google Scholar]
- Zhang Z, Deb A, Zhang Z, Pachori A, He W, Guo J, Pratt R, Dzau VJ (2009) Secreted frizzled related protein 2 protects cells from apoptosis by blocking the effect of canonical Wnt3a. J Mol Cell Cardiol 46: 370–377 [DOI] [PMC free article] [PubMed] [Google Scholar]
- Zhang M, Atkinson RL, Rosen JM (2010) Selective targeting of radiation‐resistant tumor‐initiating cells. Proc Natl Acad Sci USA 107: 3522–3527 [DOI] [PMC free article] [PubMed] [Google Scholar]
- Zhang Z, Lee J‐H, Ruan H, Ye Y, Krakowiak J, Hu Q, Xiang Yu, Gong J, Zhou B, Wang Li et al (2019) Transcriptional landscape and clinical utility of enhancer RNAs for eRNA‐targeted therapy in cancer. Nat Commun 10: 4562 [DOI] [PMC free article] [PubMed] [Google Scholar]
- Zhu Y, Sun L, Chen Z, Whitaker JW, Wang T, Wang W (2013) Predicting enhancer transcription and activity from chromatin modifications. Nucleic Acids Res 41: 10032–10043 [DOI] [PMC free article] [PubMed] [Google Scholar]
- Zou YF, Xie CW, Yang SX, Xiong JP (2017) AMPK activators suppress breast cancer cell growth by inhibiting DVL3‐facilitated Wnt/beta‐catenin signaling pathway activity. Mol Med Rep 15: 899–907 [DOI] [PubMed] [Google Scholar]
Associated Data
This section collects any data citations, data availability statements, or supplementary materials included in this article.
Supplementary Materials
Expanded View Figures PDF
Table EV1
Table EV2
Table EV3
Table EV4
Source Data for Expanded View
Review Process File
Source Data for Figure 6
Data Availability Statement
The datasets produced in this study are available in the following databases:
ChIP‐seq data: Gene Expression Omnibus (GSE165774) https://www.ncbi.nlm.nih.gov/geo/query/acc.cgi?acc=GSE165774
RNA‐Seq data: Gene Expression Omnibus (GSE165773) https://www.ncbi.nlm.nih.gov/geo/query/acc.cgi?acc=GSE165773