Abstract
Circulating branched chain amino acid (BCAA) levels are elevated in obese humans and genetically obese rodents. However, the relationship of BCAAs to insulin resistance in diet-induced obese mice, a commonly used model to study glucose homeostasis, is still ill-defined. Here we examined how high-fat high-sucrose (HFHS) or high-fat diet (HFD) feeding, with or without BCAA supplementation in water, alters the metabolome in serum/plasma and tissues in mice and whether raising circulating BCAA levels worsens insulin resistance and glucose intolerance. Neither HFHS nor HFD feeding raised circulating BCAA levels in insulin-resistant diet-induced obese mice. BCAA supplementation raised circulating BCAA and branched-chain α-keto acid levels and C5-OH/C3-DC acylcarnitines (AC) in muscle from mice fed an HFHS diet or HFD, but did not worsen insulin resistance. A set of short- and long-chain acyl CoAs were elevated by diet alone in muscle, liver, and white adipose tissue (WAT), but not increased further by BCAA supplementation. HFD feeding reduced valine and leucine oxidation in WAT but not in muscle. BCAA supplementation markedly increased valine oxidation in muscle from HFD-fed mice, while leucine oxidation was unaffected by diet or BCAA treatment. Here we establish an extensive metabolome database showing tissue-specific changes in mice on 2 different HFDs, with or without BCAA supplementation. We conclude that mildly elevating circulating BCAAs and a subset of ACs by BCAA supplementation does not worsen insulin resistance or glucose tolerance in mice. This work highlights major differences in the effects of BCAAs on glucose homeostasis in diet-induced obese mice versus data reported in obese rats and in humans.
Keywords: BCAAs, acylcarnitines, metabolomics, insulin resistance, diet-induced obesity, metabolic syndrome
Levels of branched chain amino acids (BCAAs [valine, leucine, and isoleucine)] and the aromatic amino acids (phenylalanine and tyrosine) were first reported to be increased in obese humans (1). Plasma BCAAs are also elevated in rodent models of genetic obesity (2–5). Furthermore, gastric bypass surgery markedly reduces the elevated plasma BCAA levels in morbidly obese patients, and this is associated with improved glucose homeostasis and increased expression of BCAA catabolic enzymes in white adipose tissue (2, 6, 7). Changes in the expression of BCAA catabolic enzymes (the branched chain aminotransferase [BCATm], the branched chain alpha-ketoacid dehydrogenase [BCKDH], and the branched chain ketoacid dehydrogenase kinase [BDK]) in adipose tissue and liver play an important role in regulating circulating BCAA levels (2). In addition, meta-analysis studies reveal a strong association between BCAA levels and a single nucleotide polymorphism near the PPM1K gene, which encodes the phosphatase that dephosphorylates and activates BCKDH (8).
More recently, comprehensive metabolic profiling has shown that these amino acids and their metabolic by-products strongly associate with insulin resistance and are predictive of diabetes and cardiovascular disease development and intervention outcomes (8–11). The relevance of metabolomics-based findings for human disease pathogenesis has been brought to the forefront by genetic studies (3, 8, 11). Genetic variants that cause insulin resistance and dyslipidemia in human populations strongly associate with increased circulating BCAAs (12, 13). However, variants that primarily raise BCAAs, including those in the PPM1K gene, do not appear to demonstrate “reverse causality” by associating with insulin resistance, although some variants associate with increased Type 2 Diabetes risk (2, 13). A unifying hypothesis suggests that obesity and insulin resistance drive elevations in BCAAs, which when increased in obesity can contribute to cardiometabolic disease pathogenesis (13).
This hypothesis has been tested in rodent studies involving supplementation or restriction of dietary BCAAs, resulting in inconsistent findings. Variables that may influence divergent results include species (mouse versus rat), genetic model, experimental design (BCAA supplementation vs depletion, number of BCAAs that are manipulated, BCAA administration in food versus water), and gender. Despite the fact that human studies demonstrate clear differences in BCAA levels and BCAA metabolites in males vs females (14–17), most rodent studies investigating BCAA effects on metabolism have been performed in male animals. Leucine supplementation alone improves insulin sensitivity in mice, but results in lowering levels of the other 2 BCAAs isoleucine and valine (18), thus failing to serve as a model of human obesity, in which all 3 BCAAs are increased. In contrast, supplementing all 3 BCAAs in HFD-fed rats exacerbates glucose intolerance, although pair feeding may confound the interpretation (10).
Dietary restriction of all 3 BCAAs improves insulin sensitivity in several rodent models of obesity (3, 5, 19, 20). However, replenishing dietary BCAAs to obese mice only partially reversed the benefits of BCAA restriction (5). Altogether, these studies suggest that the effects of dietary BCAAs on glucose metabolism and how BCAAs are metabolized vary among rodent models. This is demonstrated more recently in in vivo isotopic tracing studies showing that whole-body BCAA oxidation and substrate flux into metabolic pathways and tissues differ between db/db and diet-induced obese (DIO) mice (21). This may be due to differences in baseline circulating BCAA levels (2, 3, 5), expression levels of BCAA catabolic genes (2), and/or differences in transcriptomic response networks between rats and mice. For example, recent studies have shown that Carbohydrate Response Element Binding Protein (ChREBP) has a binding site in the enhancer region of the BDK gene that is conserved in rats, nonhuman primates, and humans, but not in mice (22). Better understanding of the impact of BCAAs on glucose homeostasis is needed across these divergent models.
Most studies do not directly address whether raising circulating BCAAs causes or worsens diabetes in DIO mice. Here, we tested the effects of a high-fat high-sucrose (HFHS) diet or a high-fat diet (HFD) on BCAA levels, with and without additional BCAA supplementation, on glucose homeostasis in C57BL/6J mice. We also performed metabolomics analyses of serum and tissues from these mice. We find that while some BCAA supplementation effects reported in rats are also observed in mice in the current study, including mild elevations in circulating BCAAs and BCAA-derived muscle metabolites such as C5-OH/C3-DC acylcarnitine (AC), these changes did not worsen insulin resistance in a commonly used mouse model of dietary obesity.
Materials and Methods
Animals
Four- to 6-week-old male and female C57BL/6J wild-type mice (Jackson Laboratories, Bar Harbor, ME, USA) were subject to a 14/10-hour light-dark cycle. Male mice were singly housed and female mice were group housed. All mice had ad libitum access to chow (5008 Formulab Diet; Purina Mills, MI, USA), high-fat high-sucrose (HFHS, D12079Bi; Research Diets, NJ, USA), or high-fat diet (HFD, Td93075; Harlan Teklad, Envigo RMS Inc., IN, USA), with free access to deiodonized water supplemented with or without BCAAs (0.75% leucine, 0.48% isoleucine, 0.53% valine) at a dose that does not cause decreased food intake (18). All studies in HFHS diet-fed mice were performed in female mice (Fig. 1–4 and Figs. S1–S4) (23). Studies in HFD-fed mice were performed in male (Fig. 5–8 and Figs. S6–S8) (23) and female (Fig. S5) (23) mice. Body weight and food and water intake were measured weekly. The indicated number of weeks for in vivo measurements refers to the number of weeks mice were maintained on an HFHS diet or HFD. Plasma was collected from the tail vein of HFHS diet-fed mice for BCAA measurements. Body composition was measured by magnetic resonance imaging. Mice were sacrificed by decapitation without prior sedation for serum collection, and tissues were harvested, snap frozen in liquid nitrogen, and stored at -80°C. All aspects of animal care were in accordance with federal guidelines and approved by the Institutional Animal Care and Use Committee of Beth Israel Deaconess Medical Center and Harvard Medical School.
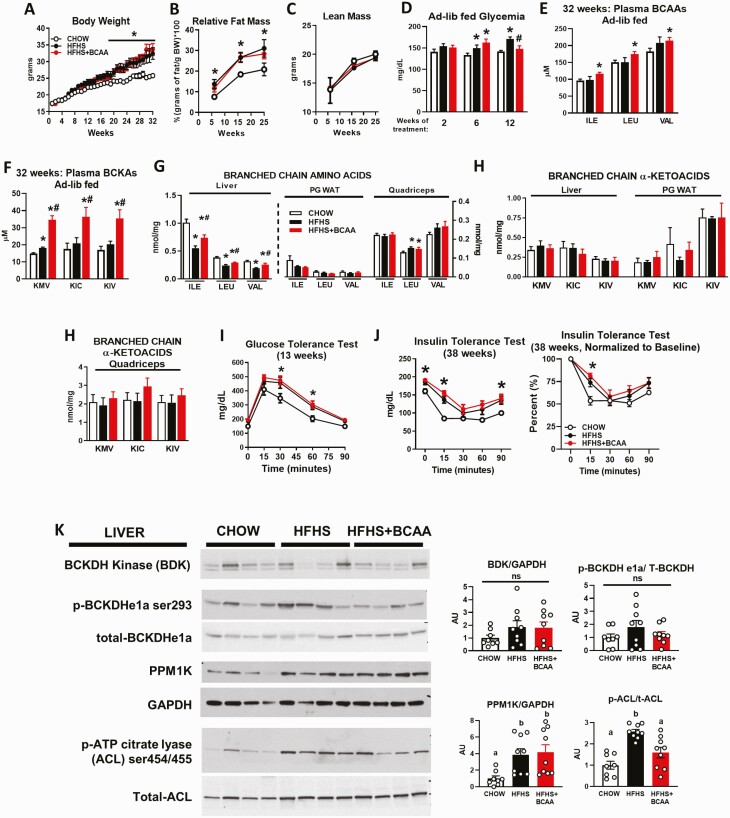
Figure 1.
Effect of BCAA supplementation on circulating BCAA levels and insulin resistance in HFHS diet-fed mice. Body weight (A), relative fat mass (B), lean mass (C), and ad libitum-fed glycemia (D) from wild-type female mice fed chow or an HFHS diet with or without BCAA supplementation in water. Chow n = 11, HFHS n = 11, HFHS + BCAA n = 12. Ad libitum-fed plasma BCAAs (isoleucine [ILE], leucine [LEU], and valine [VAL]) (E) and plasma BCKAs (alpha-keto-beta-methylvalerate [KMV], alpha-ketoisocaproate [KIC], and alpha-ketoisovalerate [KIV]) (F) measured at 32 weeks of HFHS diet feeding. Levels of BCAAs (G), and BCKAs (H) from liver, PG WAT, and quadriceps collected from the same mice as profiled in panels A–F. Mice were fasted overnight and refed an HFHS diet for 6 hours prior to the studies. E–H: Chow n = 6, HFHS n = 6, HFHS + BCAA n = 6. I: Glucose tolerance test (13 weeks of treatment) and insulin tolerance test (38 weeks of treatment) (J: left panel, raw values; right panel, normalized to starting glucose levels) performed after a 5-hour food removal in mice fed chow or an HFHS diet with or without BCAA supplementation in water. These are the same mice profiled in panels A–H. Chow n = 6–11, HFHS n = 6–11, HFHS + BCAA n = 6–12. K: Western blots showing protein levels of enzymes that regulate BCAA catabolism with corresponding quantitation by densitometry. Two different blots were run for each protein on a total of 8 to 9 mice. *P < 0.05 vs chow; #P < 0.05 vs HFHS; a, b indicates P < 0.05; ns = not significant. Abbreviations: ACL, ATP citrate lyase; ad-lib, ad libitum; BCAA, branched-chain amino acid; BCKA, branched-chain α-keto acid; BDK, branched-chain α-ketoacid dehydrogenase kinase; GAPDH, glyceraldehyde 3-phosphate dehydrogenase; HFHS, high-fat high sucrose; ns, not significant; p-ACL, phosphorylated ATP citrate lyase; p-ATP, phosphorylated adenosine triphosphate; p-BCKDH, phosphorylated Branched-chain α-ketoacid dehydrogenase; PPM1K, protein phosphatase, Mg2+/Mn2+ Dependent 1K; t-ACL, total ATP citrate lyase; T-BCKDH, total Branched-chain α-ketoacid dehydrogenase.
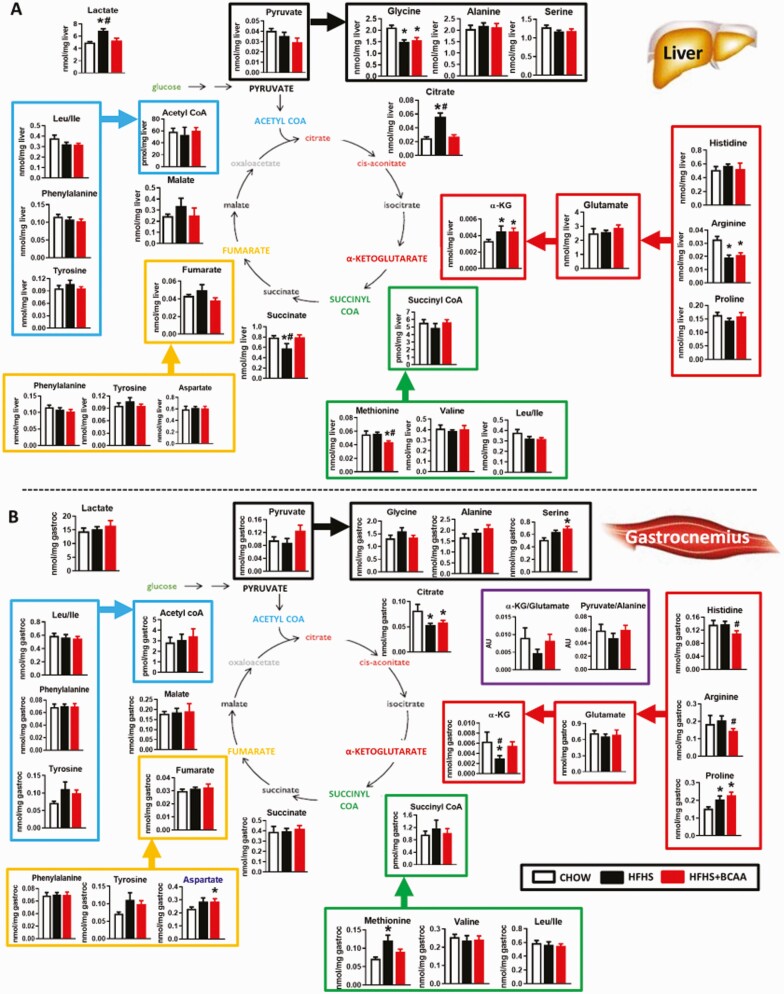
Figure 4.
Effect of BCAA supplementation on TCA cycle intermediate levels in metabolic tissues. Amino acids and TCA cycle analytes from liver (A) and gastrocnemius (B) from chow or HFHS-fed wild-type female mice with or without BCAAs supplemented in water (same mice as in Figs. 1–3). Mice were fasted overnight and tissues were collected following 6 hours of re-feeding. n = 6/group. *P < 0.05 vs chow; #P < 0.05 vs HFHS. Abbreviations: BCAA, branched-chain amino acid; TCA, tricarboxylic acid.
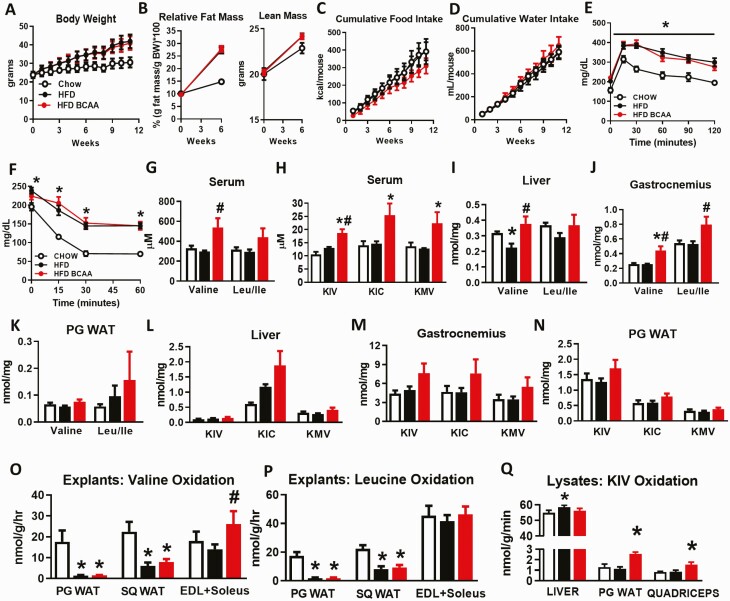
Figure 5.
BCAA supplementation in another model of diet-induced obese mice does not worsen glucose homeostasis. Body weight (A), relative fat and lean mass (B), cumulative food intake (C), and cumulative water intake (D) from wild-type male mice fed chow and an HFD with or without BCAA supplementation in water. Glucose tolerance test (9 weeks of treatment) (E) and insulin tolerance test (14 weeks of treatment) (F) performed in mice following a 5-hour food removal. A–F: Chow n = 5, HFD and HFD + BCAA n = 12 per group. Terminal serum levels of BCAAs (valine and leu/ile) (G) and BCKAs (KIV, KIC, and KMV) (H) from 19-week-old mice fasted overnight and refed HFD for 6 hours prior to studies. BCAA levels from liver (I), gastrocnemius (J), and PG WAT (K), and BCKA levels from liver (L), gastrocnemius (M), and PG WAT (N) collected from mice in the 6-hour re-fed state following an overnight fast. G–N: Chow n = 4; HFD and HFD + BCAA n = 6 per group. *P < 0.05 vs chow, #P < 0.05 vs HFD. Oxidation of valine (O) and leucine (P) in PG WAT, SQ WAT, and EDL and soleus muscle explants. O–P: Chow n = 4–8, HFD and HFD + BCAA n = 6–12 per group. Q: KIV oxidation in liver, PG WAT, and quadriceps lysates. n = 11–12 per group. *P < 0.05 vs chow; #P < 0.05 vs HFD. Abbreviations: BCAA, branched-chain amino acid; BCKAs, branched-chain α-ketoacids; EDL, extensor digitorum longus; HFD, high fat diet; KIC, alpha-ketoisocaproic acid; KIV, alpha-ketoisovalerate; KMV, alpha-keto-beta-methylvalerate; leu/ile, leucine/isoleucine; PG WAT, perigonadal white adipose tissue; SQ WAT, subcutaneous white adipose tissue.
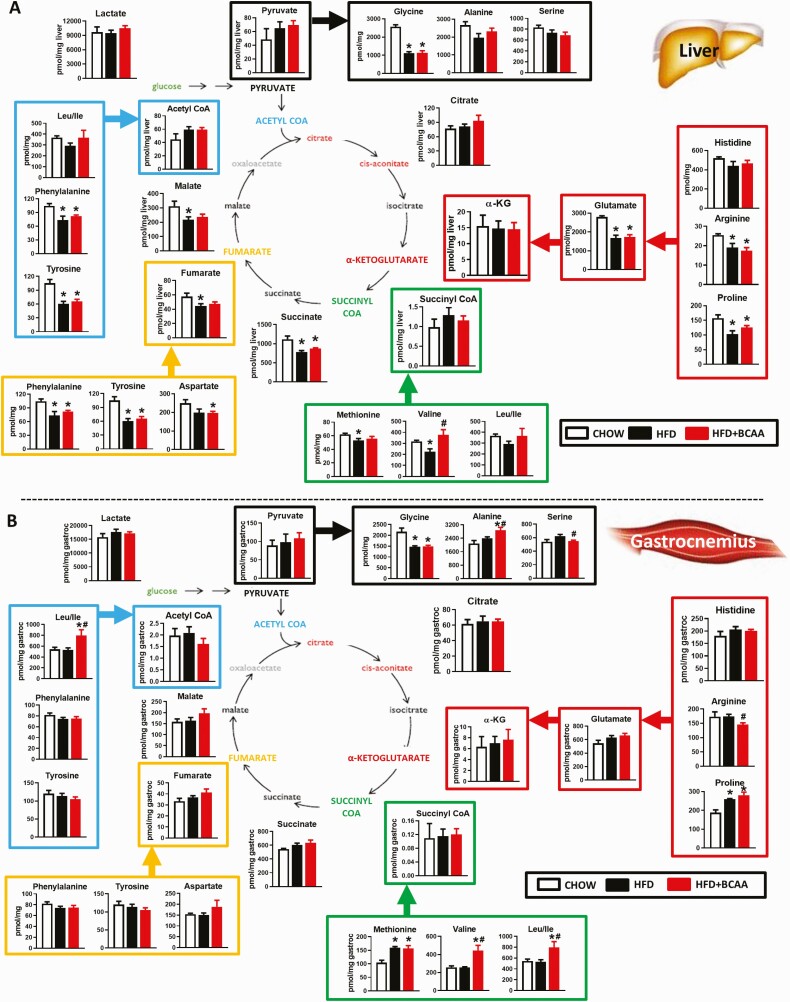
Figure 8.
Effect of BCAA supplementation on levels of TCA cycle intermediates in HFD-fed mice. Amino acids and TCA cycle analytes from liver (A) and gastrocnemius (B) from chow or HFD-fed wild-type female mice supplemented with or without BCAAs in water (same mice as in Figs. 5–7). Mice were fasted overnight and tissues were collected following 6 hours of re-feeding. Chow n = 4, HFD and HFD + BCAA n = 6 per group. *P < 0.05 vs chow; #P < 0.05 vs HFD. Abbreviations: BCAA, branched-chain amino acid; HFD, high fat diet; TCA, tricarboxylic acid.
Chemicals and reagents
BCAAs (leucine, isoleucine, and valine) were purchased from Sigma-Aldrich (St. Louis, MO, USA) and dissolved in deionized water. Radioactive 14C-valine and 14C-leucine were purchased from PerkinElmer, MA, USA.
Glucose and insulin tolerance tests
For glucose and insulin tolerance tests, food was removed for 5 hours prior to intraperitoneal injection with glucose (1 g/kg) or insulin (0.5-0.8 U/kg where indicated; Humulin R; Eli Lilly, Indianapolis, IN, USA). Glycemia was measured before the insulin/glucose bolus and at indicated time points by glucometer.
Western blotting
Liver lysates were processed in radioimmunoprecipitation assay buffer with antiphosphatase inhibitors. A total of 50 µg of protein was loaded per sample and probed for the following proteins: BDK (#sc374425; Santa Cruz, CA, USA; RRID AB_10988235), phospho-BCKDH ser293 (#ab200577; Abcam, MA, USA; RRID AB_2687944), total-BCKDHe1a (#sc67200; Santa Cruz; RRID AB_2290343), Protein phosphatase, Mg2+/Mn2+ Dependent 1K (PPM1K) (#ab135286; Abcam; RRID AB_2889377), glyceraldehyde 3-phosphate dehydrogenase (#5174; Cell Signaling, MA, USA; RRID AB_10622025), p-adenosine triphosphate (ATP) citrate lyase ser454/455 (#4331; Cell Signaling, MA, USA; RRID AB_2257987), and total ATP citrate lyase (#PA5-29495; ThermoFisher, MA, USA; RRID AB_2546971).
BCKA oxidation assay
Tissues (liver, perigonadal white adipose tissue [PG WAT], muscle) frozen in liquid nitrogen and stored at -80˚C, were placed in buffer H (mM [30 KPi monobasic pH 7.5; 3 EDTA; 5 DTT; 1 KIV], 3% fetal bovine serum, 5% Triton X-100, 1 µM leupeptin, and 143 uM cold KIV in distilled water) and lysed for 1 minute. Samples were centrifuged at 10 000 g for 10 minutes at 4°C and 50 µL supernatant was added to 300 µL reaction master mix (50 mM HEPES pH7.5, 30 mM KPi [monobasic pH 7.5]; 0.4M CoA; 3 mM NAD+; 5% fetal bovine serum; 2 mM thiamine pyrophosphate; 2 mM MgCl2) with 5.2 µM 1-14C KIV in distilled water. Eppendorf tubes, fitted with wet (200 µL 1M NaOH) filter papers to trap CO2, were incubated in a shaking water bath (30 minutes, 37°C). Tubes were transferred onto ice, 100 µL 70% perchloric acid was added and shaken at room temperature for 1 hour. NaOH traps were placed into scintillation vials with 4 mL scintillation liquid for counting, and 200 µL of reaction mixture was used to determine total radiation per reaction normalized to specific activity.
Ex vivo valine and leucine oxidation assays
PG WAT, subcutaneous (SQ) WAT, brown adipose tissue, and muscle (extensor digitorum longus [EDL] and soleus combined) were harvested from ad libitum–fed male and female C57BL/6J mice maintained on chow or HFD with or without BCAA water for 8 to 12 weeks. Tissues were minced with scissors in 0.5 mL KRP buffer and explants placed in 10 mL plastic round bottom tubes containing 1 mL 160 µCi/mmol [1-14C] valine in KRP-HEPES incubation buffer (1X KRP buffer, 20 mM HEPES, 200 nM adenosine, 0.5% fatty acid free-BSA, 5 mM 10% glucose, 1 mM valine). Tubes were sealed with rubber stoppers fitted with hanging center wells and incubated with shaking at 37°C for 2 hours. 100 µL 25% 1N trichloroacetic acid was injected into the explant fraction and 300 µL of 1 M benzethonium hydroxide injected into the center wells followed by 1 hour incubation at 37°C. Center wells were collected and placed into glass tubes containing a scintillation cocktail to measure 14CO2 production.
Metabolomics
Plasma was collected for BCAA and branched-chain α-keto acid (BCKA) measurements from ad libitum HFHS diet-fed mice between 10:00 am to 12:00 pm. Serum was collected from male HFD-fed mice after overnight fasting followed by 6-hour refeeding. Freeze-clamped tissues (liver, quadriceps or gastrocnemius muscle, and PG WAT) were collected, pulverized in liquid nitrogen, homogenized in 50% aqueous acetonitrile containing 0.3% formic acid for 30 seconds, and stored at -80°C for targeted metabolomics from female mice fed an HFHS diet for 40 weeks and male mice fed a HFD after an overnight fast followed by 6-hour refeeding. We performed these studies in the 6-hour re-fed state because re-feeding was shown to uncover differences in skeletal muscle ACs in mice (24). For mice fed an HFHS diet, plasma and freeze-clamped tissue (liver, quadriceps, PG WAT) BCAAs were measured by liquid chromatography-mass spectrometry and BCKAs were measured by ultrafast liquid chromatography-mass spectrometry (UFLC-MS) in the Lynch Lab (Fig. 1) (25). For HFD-fed mice, leucine/isoleucine (leu/ile) were measured together, valine was measured separately, and BCKAs were measured using methods of the Newgard lab in serum and tissues (liver, gastrocnemius, PG WAT) (Fig. 5). The samples were used for targeted metabolomics analyses of amino acids, ACs, organic acids, and acyl CoA metabolites as described previously (26, 27). Acylcarnitines were measured as described (28, 29). Acyl CoAs were further purified by solid phase extraction (30).
Statistics
Data are presented as means ± standard error of the mean, with P < 0.05 considered statistically significant. Heat maps representing metabolomics data were created using the QluCore Omics Explorer (Qlucore, Lund, Sweden). All data were analyzed by t-test, 1-way or 2-way analysis of variance (ANOVA) where appropriate using Prism GraphPad v6.0 (GraphPad Software, San Diego, CA, USA) or QluCore Omics Explorer. Figures 2 and 6 show ACs and acyl CoAs that are significantly different in response to treatment analyzed using the following criteria: filtering by variance, one-way ANOVA with P < 0.05, and a q-value = 0.05 (false discovery rate adjusted P-value) (31).
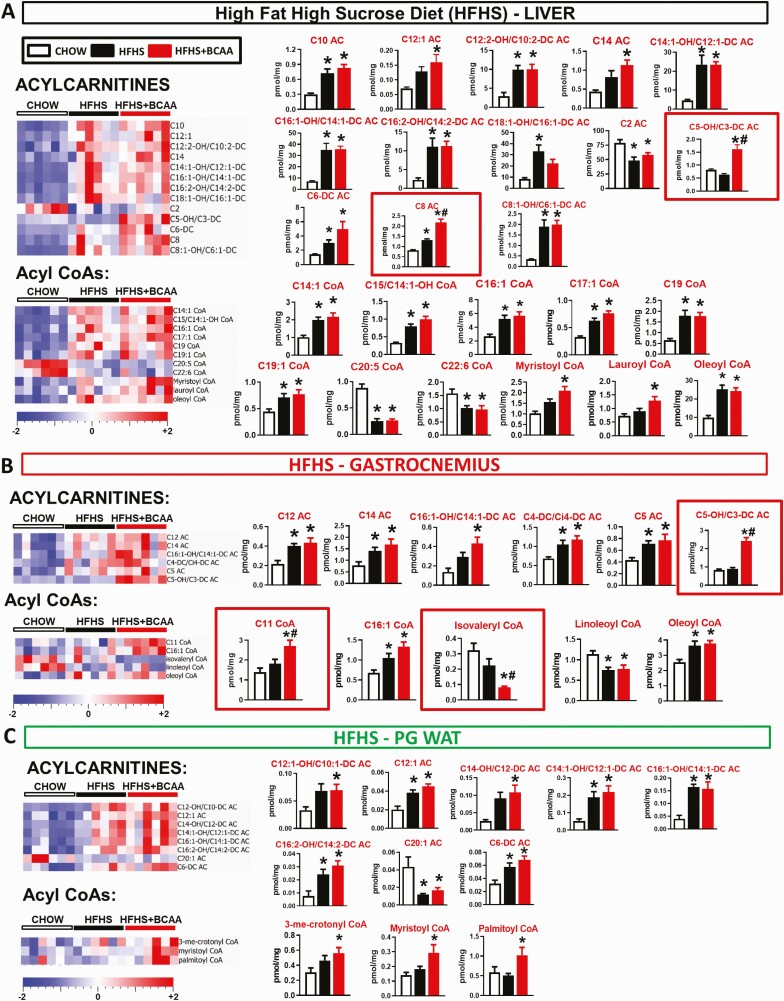
Figure 2.
Effect of BCAA supplementation on acylcarnitine and acyl CoA levels in metabolic tissues. Levels of acylcarnitines and acyl CoAs in liver (A), gastrocnemius (B), and PG WAT (C) from chow and HFHS-fed wild-type female mice with or without supplemented BCAAs in water (same mice as in Fig. 1, which were on chow and an HFHS diet for 40 weeks). Only metabolites that were significantly changed are shown. Mice were fasted overnight and tissues collected following a 6-hour re-feeding period. n = 6/group. *P < 0.05 vs chow, #P < 0.05 vs HFHS by 1-way ANOVA adjusted for FDR. Abbreviations: ANOVA, analysis of variance; BCAA, branched-chain amino acid; FDR, false discovery rate; PG WAT, perigonadal white adipose tissue.
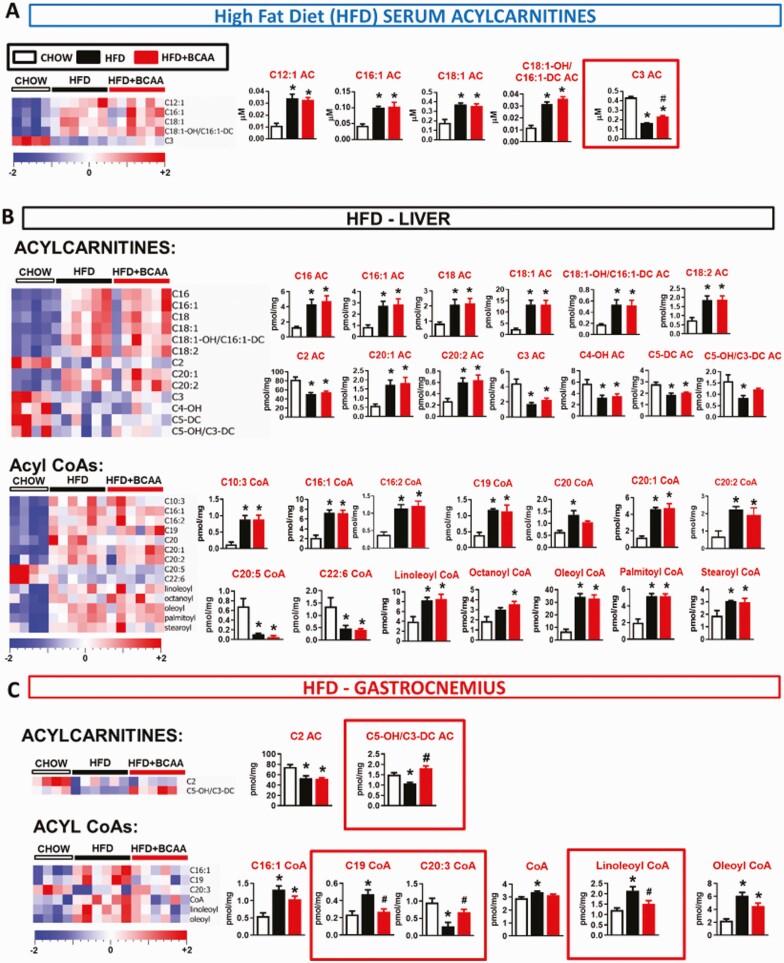
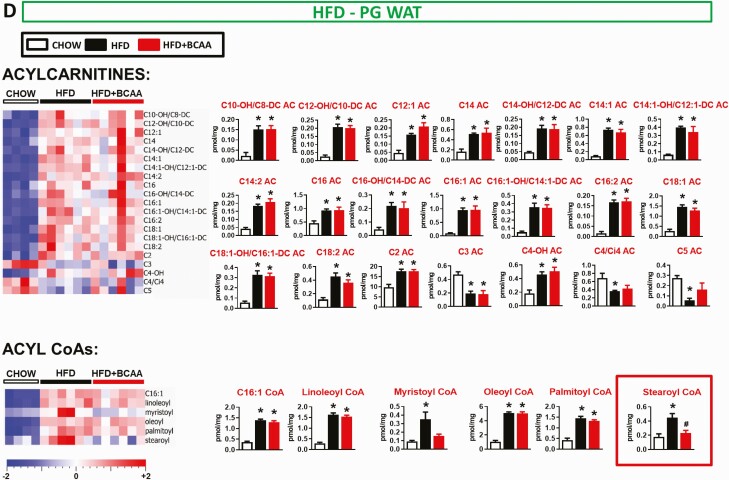
Figure 6.
Effect of BCAA supplementation on acylcarnitine and acyl CoA levels in serum and metabolic tissues from HFD-fed mice. Levels of acylcarnitines and acyl CoAs in serum (A), liver (B), gastrocnemius (C), and PG WAT (D) from chow and HFD-fed wild-type male mice supplemented with or without BCAAs in water. Mice were fasted overnight and tissues were collected following a 6-hour re-feeding period. Chow n = 4, HFD and HFD + BCAA n = 6 per group. *P < 0.05 vs chow; #P < 0.05 vs HFD. One-way ANOVA adjusted for FDR. Abbreviations: ANOVA, analysis of variance; BCAA, branched-chain amino acid; FDR, false discovery rate; HFD, high fat diet.
Results
Elevating circulating BCAA and BCKA levels does not worsen insulin resistance in C57BL/6J female HFHS-fed mice
The HFHS diet resulted in greater weight gain (Fig. 1A) and adiposity (Fig. 1B) but no change in lean mass (Fig. 1C) compared with the chow-fed control mice. Supplementation of the HFHS diet with BCAAs in the drinking water had no additional effects on body weight, adiposity, lean mass, or caloric intake compared with HFHS controls receiving normal water (Fig. 1A–1C, Fig. S1A–S1C) (23). Mice fed an HFHS diet for at least 6 weeks had slightly elevated glucose levels in the ad libitum–fed state vs chow controls. BCAA supplementation did not further elevate glycemia and actually decreased glucose levels at 12 weeks of treatment (Fig. 1D). After 32 weeks, the HFHS diet had no effect on circulating levels of the 3 BCAAs vs chow-fed mice (Fig. 1E), consistent with previous studies in DIO mice (5). BCAA supplementation of HFHS diet-fed mice marginally increased circulating BCAAs vs chow-fed mice but not the HFHS diet-fed control mice (Fig. 1E). HFHS feeding did not affect circulating levels of the transamination products of BCAAs, the BCKAs, except for a 10% increase in alpha-keto-methylvalerate (KMV) compared with the chow controls (Fig. 1F). In contrast, BCAA supplementation of a HFHS diet caused a robust 50% to 75% increase in all 3 circulating BCKAs compared with the HFHS diet alone (Fig. 1F).
Next, we measured BCAA and BCKA levels in liver, PG WAT, and muscle (quadriceps and gastrocnemius). An HFHS diet decreased levels of all 3 BCAAs in liver compared with chow feeding, whereas BCAA supplementation of HFHS-fed mice increased hepatic BCAA levels towards the chow levels (Fig. 1G). In contrast, there was no effect of an HFHS diet or BCAA supplementation on BCAA levels in PG WAT and quadriceps in mice (Fig. 1G), with the exception of a modest increase in leucine levels in quadriceps with HFHS feeding, which was not affected by BCAA supplementation. Unlike in plasma, neither HFHS diet nor BCAA supplementation of HFHS diet changed BCKA levels in liver, PG WAT, or quadriceps (Fig. 1H).
Mice fed an HFHS diet had mild glucose intolerance (Fig. 1I), increased glycemia 5 hours following food removal (time 0 minutes of insulin tolerance test), and mild insulin resistance (Fig. 1J, Fig. S1D) (23) compared with chow controls. Despite causing mild elevations of plasma BCAA levels and substantial elevations in plasma BCKA levels, supplementing HFHS diet-fed mice with BCAAs did not worsen glucose tolerance or insulin sensitivity compared with the HFHS diet control mice (Fig. 1I and 1J, Fig. S1D) (23).
Lack of effect of HFHS diet on enzymes regulating BCAA metabolism in liver
Obese humans and preclinical models of monogenic obesity such as ob/ob mice or Zucker Fatty Rats (ZFRs) exhibit changes in the expression of enzymes that regulate BCAA metabolism in liver and adipose tissue (2). Specifically, ob/ob mice and ZFRs have increased expression of the kinase (BDK) that phosphorylates and inhibits the branched chain ketoacid dehydrogenase (BCKDH) complex in the liver. Because it is unclear if mouse models of diet-induced obesity undergo the same changes, we performed immunoblot analyses of key proteins in the liver from the same female mice in which we measured BCAA and BCKA levels. Feeding of a HFHS diet in mice, with or without BCAA supplementation, had no effect on hepatic BDK protein expression (Fig. 1K). Consistent with this finding, HFHS feeding, with or without BCAA supplementation, had no effect on hepatic levels of phosphorylated BCKDH. However, HFHS feeding, with or without BCAA supplementation, increased the levels of the BCKDH phosphatase, PPM1K. This increase was not accompanied by a diet-mediated change in BCKDH phosphorylation status. Finally, phosphorylation of ATP-citrate lyase (ACL), a recently identified substrate of BDK and PPM1K (22), increased in response to HFHS feeding, and BCAA supplementation suppressed this effect. This change in ACL phosphorylation did not correlate with changes in BDK or PPM1K expression, but it could reflect allosteric inhibition of BDK achieved by BCAA-mediated elevations in circulating BCKA. Alternatively, this finding may suggest that BCAA supplementation lowers the activity of other kinases known to phosphorylate ACL, such as Akt (32, 33), although ACL phosphorylation by BDK was found to be independent of Akt in rat hepatoma cells in vitro (22). In sum, the responses of key BCAA metabolic enzymes to an HFHS diet in this mouse model of dietary obesity are very different to what has been recently reported in genetically obese rats or rats fed a high fructose diet, in which BDK is induced, PPM1K is suppressed, and phosphorylation of both BCKDH and ACL is increased (22). This could potentially explain the seemingly disparate effects of BCAA supplementation on glycemia and insulin sensitivity reported in prior rat studies compared with the current mouse studies.
Metabolomics: Effects of an HFHS diet with and without BCAA supplementation in female mice on tissue lipid metabolism
The development of insulin resistance in rodents has been linked to the accumulation of long-chain AC and acyl CoA species in tissues, which has been suggested to reflect incomplete oxidation of fatty acids, contributing to mitochondrial fuel overload (24, 34). To investigate the possible relevance of this mechanism in the current study, we measured these analytes in tissues from mice fed chow, an HFHS diet, and an HFHS diet with BCAA supplementation in water.
In liver from the same mice for which data is shown in Fig. 1, HFHS feeding, with or without BCAA supplementation, increased multiple ACs and acyl CoA species compared with chow feeding (Fig. 2A, Fig. S2A) (23). This included acyl CoAs and ACs derived from the major circulating fatty acid species, including palmitate (C16), palmitoleate (C16:1), and oleate (C18:1) (Fig. 2A). HFHS feeding, with or without BCAA supplementation, decreased C2 (acetyl) AC; low levels of this metabolite could possibly reflect incomplete oxidation of fatty acids to the level of acetyl CoA in insulin resistant, HFHS diet-fed animals (Fig. 2A). The unique effects of HFHS + BCAA compared with HFHS or chow feeding were to increase C5-OH/C3-DC and C8-AC species (Fig. 2A).
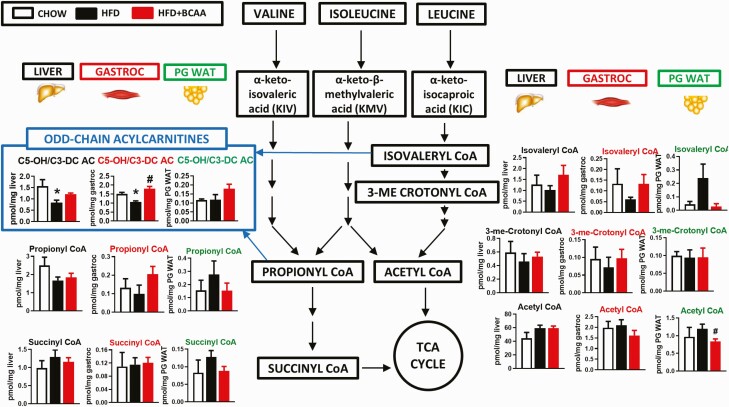
In skeletal muscle, HFHS feeding increased levels of only a few ACs and acyl CoAs compared with the chow controls (Fig. 2B). The only effects of BCAA supplementation were to increase C5-OH/C3-DC AC and C11 CoA, and to decrease isovaleryl CoA levels vs the HFHS controls (Fig. 2B). The elevation of C5-OH/C3-DC AC in muscle is consistent with the report that BCAA-derived C5 and C3 ACs are influenced by the modulation of dietary BCAA supply (10). In PG WAT, all changes in AC and CoA species occurred in response to an HFHS diet and not BCAA supplementation.
Taken together, these data are consistent with previous studies showing that HFHS feeding increases the levels of lipid-derived acyl CoA and AC species in metabolic tissues, and that these changes may be associated with impaired glucose tolerance and insulin resistance (24). The main effect of BCAA supplementation was to raise the levels of C5-OH/C3-DC ACs in liver and muscle.
BCAA metabolites in female HFHS diet-fed mice treated with or without BCAAs in water
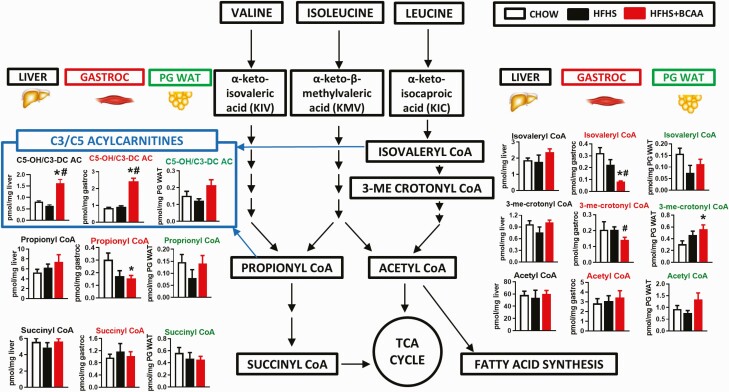
To further investigate the metabolic fates of BCAAs under the different dietary regimens, we measured metabolites generated by catabolism of BCAAs in liver, gastrocnemius muscle, and PG WAT. HFHS + BCAA treatment decreased levels of the Val/Ile metabolite propionyl CoA and reduced the leu metabolites isovaleryl CoA and 3-methyl crotonyl CoA specifically in skeletal muscle relative to chow-fed levels (Fig. 3). The only other metabolite and tissue for which a significant change occurred was an increase in 3-methyl crotonyl CoA in PG WAT in HFHS + BCAA-fed mice (Fig. 3).
Figure 3.
Effect of BCAA supplementation on analytes derived from BCAA catabolism in HFHS diet-fed mice. BCAAs and downstream analytes in liver, gastrocnemius, and PG WAT from chow or HFHS-fed wild-type female mice with or without BCAAs supplemented in water (same mice as in Fig. 1, which were on a chow and HFHS diet for 40 weeks). Mice were fasted overnight and tissues collected following 6 hours of re-feeding. n = 6/group. *P < 0.05 vs chow; #P < 0.05 vs HFHS. Abbreviations: BCAA, branched-chain amino acid; HFHS, high-fat high sucrose; PG WAT, perigonadal white adipose tissue; TCA, tricarboxylic acid cycle.
Profiling of amino acids and organic acids revealed discrete effects of the different diets on liver and muscle. In liver, glycine and arginine were decreased and α-ketoglutarate was increased with an HFHS diet with or without BCAA supplementation, whereas citrate and lactate were increased and succinate decreased by an HFHS diet but not HFHS + BCAA (Fig. 4A). The only metabolite that changed uniquely in liver from HFHS + BCAA mice was a modest decrease in methionine levels (Fig. 4A). Several of these same metabolites were affected by the diet in skeletal muscle (Fig. 4B) but with different response patterns than observed in liver. α-ketoglutarate was decreased and methionine was increased by an HFHS diet in the absence but not the presence of BCAA supplementation, whereas citrate was decreased and proline increased by an HFHS diet both in the presence and absence of BCAA supplementation (Fig. 4B). Modest changes observed in muscle specific to HFHS + BCAA feeding were a decrease in histidine and arginine and an increase in aspartate and serine (Fig. 4B). The decrease in citrate and α-ketoglutarate in muscle of HFHS-fed insulin resistant mice is consistent with a previous report that used HF feeding in rats as the obesogenic condition (24). Overall, the effects of BCAA supplementation on amino acid and organic acid levels were subtle at best, consistent with the generally modest effect of added BCAAs on fatty acid-derived AC and acyl CoA metabolites in this mouse model (Fig. 2).
BCAA supplementation does not worsen glucose homeostasis in male or female C57BL/6J mice fed an alternate (high fat without high sucrose) obesigenic diet
Not all HFDs have the same impact on glucose intolerance and insulin resistance in mice (35). Because the effect of an HFHS diet on inducing insulin resistance in mice was mild (Fig. 1J, Fig. S1D) (23), we asked whether feeding male or female mice of the same strain (C57BL/6J) with the hydrogenated vegetable oil and corn oil HFD (Table S1) (23) would reveal the effects of BCAA supplementation on glucose homeostasis. Male mice fed an HFD had increased body weight and adiposity, but no change in lean mass or caloric (food and BCAA supplemented water) intake compared with chow mice (Fig. 5A–5D; the same parameters are shown for female mice in Fig. S5A and S5B) (23). As expected, mice fed an HFD were more glucose intolerant and insulin resistant compared with chow-fed mice (Fig. 5E and 5F). However, there was no additive effect of BCAA supplementation relative to HFD feeding alone on any of these parameters (Fig. 5A–5F, Fig. S5C) (23). Similar to HFHS diet-fed mice (Fig. 1D and 1E), circulating BCAA and BCKA levels were not different between chow- and HFD-fed mice (Fig. 5G and 5H). Serum valine and BCKAs were raised only when the HFD was supplemented with BCAAs (Fig. 5G and 5H). Similarly, a HFD did not increase tissue (liver, gastrocnemius, PG WAT) BCAA, or BCKA levels (Fig. 5I–5N), whereas BCAA supplementation increased or trended to increase these metabolites in liver, muscle, and PG WAT (Fig. 5I–5N).
To determine how dietary regimen affects BCAA oxidative capacities in various tissues, we studied the oxidation of 14C-labeled valine, leu, and KIV to 14CO2 in tissue explants and lysates. HFD feeding with or without BCAA supplementation decreased valine and leu oxidation in PG and SQ WAT (Fig. 5O and 5P). By contrast, HFD had no effect on valine or leucine oxidation in EDL and soleus muscles (incubated together) ex vivo from HFD-BCAA mice. There was a marked increase in valine, but not leucine oxidation, in muscle explants from HFD-BCAA male mice (Fig. 5O and 5P). Similar results were also observed in female mice fed the same HFD supplemented with BCAAs (Fig. S5D) (23). Because liver has low transamination capacity, KIV oxidation to CO2 was measured as an index of BCKDH activity in liver, WAT, and quadriceps muscle lysates. As reported previously (3), liver BCKDH activity was substantially higher compared with PG WAT or skeletal muscle (Fig. 5Q). In our study, HFD feeding increased BCKDH activity slightly in liver but had no effect on BCKDH activity in PG WAT or quadriceps (Fig. 5Q). BCAA supplementation of HFD raised BCKDH activity in PG WAT and quadriceps but not in liver. Altogether, these data in HFD-fed male mice show that (1) raising circulating BCAA and BCKA levels in the context of a second HFD does not worsen insulin resistance, and (2) diet influences BCAA catabolism in a tissue-specific manner.
Metabolic profile in mice fed an HFD with or without BCAA supplementation
Similar to findings in HFHS diet-fed mice, HFD feeding increased an array of fatty acid-derived long and medium chain ACs and acyl CoAs. There was a minimal effect of BCAA supplementation of HFD on levels of these same metabolites (Fig. 6, Table S2) (23). Different from what was observed with HFHS diet-fed mice (Fig. 2), but consistent with prior reports in rats fed a different high fructose diet (10), the HFD (Table S2) (23) in our study decreased liver C3 and C5 AC levels and serum C3 AC levels, effects that were partially reversed by BCAA supplementation (Fig. 6, Table S2) (23). HFD feeding also decreased C3 AC in PG WAT, but this was not reversed by BCAA supplementation. Similar to HFHS feeding, one clear and striking effect of BCAA supplementation of an HFD was to increase C5-OH/C3-DC AC levels in muscle (Figs. 6C and 7) compared with HFD-fed mice.
Figure 7.
Effect of BCAA supplementation on analytes derived from BCAA catabolism in HFD-fed mice. BCAAs and downstream analytes in liver, gastrocnemius, and PG WAT from chow and HFD-fed wild-type male mice with or without BCAAs supplemented in water. Mice were fasted overnight and tissues were collected following a 6-hour re-feeding period. Chow n = 4, HFD and HFD + BCAA n = 6 per group. *P < 0.05 vs chow; #P < 0.05 vs HFD. Abbreviations: BCAA, branched-chain amino acid; HFD, high fat diet; PG WAT, perigonadal white adipose tissue.
In liver, a HFD decreased the levels of some amino acids and 3 late tricarboxylic acid cycle substrates fumarate, succinate, and malate (Fig. 8A). Similar to HFHS diet-fed mice, liver glycine and arginine levels were also reduced in HFD-fed mice (Figs. 3A and 8A). These are consistent with the observation that obese humans and ZFRs have decreased serum glycine levels (1, 10, 19). The only HFD-BCAA effect in liver was an increase in valine levels (Figs. 5I and 8A). In gastrocnemius, HFD-fed mice had decreased glycine levels and increased levels of proline and methionine (Fig. 8B), whereas HFD + BCAA feeding increased muscle levels of alanine, valine, and leu/ile, but decreased serine and arginine levels (Figs. 5J and 8B). Overall, feeding of an HFHS diet or HFD have significant effects on the metabolome of key metabolic tissues, but BCAA supplementation in either diet has only modest additional impact.
Discussion
Elevated circulating BCAAs are consistently observed in obese humans and genetically obese rodent models (1, 10, 11, 36). However, the extent to which elevated BCAAs are biomarkers or cause insulin resistance remains unclear. We show that an HFHS diet or HFD is not sufficient to raise circulating or tissue BCAA levels (except a marginal increase in muscle leucine with HFHS feeding). BCAA supplementation at a dose that does not cause decreased food intake in dietary obesity mouse models raises some tissue and circulating BCAA and BCKA levels as well as a subset of ACs in muscle and liver, but this does not worsen glucose tolerance or insulin sensitivity. Therefore, despite mildly elevated BCAAs, and raising tissue C5-OH/C3-DC AC levels and circulating BCKAs, these effects are not sufficient to worsen insulin resistance in mice fed an HFHS diet or HFD.
A number of important factors may contribute to whether excess BCAAs affect glucose homeostasis. First is the type of obesity model under investigation (genetic versus diet-induced). In murine genetic models of obesity (db/db, ob/ob, New Zealand obese mice) and in ZFRs, baseline circulating BCAAs are elevated (2, 5, 19). In contrast, we show that in wild-type mice fed 2 commonly-used HFDs, circulating BCAA levels are not elevated, which is consistent with observations in Wistar rats (10) and wild-type C57BL/6N mice fed a different HFD (5). In support of differences in BCAA metabolism with genetic vs dietary obesity, tissue BCAA flux using stable isotopes was different between db/db and HFD-fed mice (21). This may explain why BCAA supplementation did not worsen glucose homeostasis in the 2 DIO mouse models.
A second important factor is differences in mice vs rats and humans. A regulatory motif containing a ChREBP binding site is present in the BDK gene in humans and rats, but not in mice (22). This indicates that BDK, which regulates BCKDH activity, may be responsive to carbohydrate-rich diets in rat and human liver but not in mice. Indeed, we observed no increase in liver BDK levels in HFHS diet-fed mice compared with chow, whereas feeding of a high fructose diet or overexpression of ChREBP-β in liver in normal rats induced BDK expression and suppressed PPM1K (21). Since reduced hepatic BCAA oxidation may contribute to elevated circulating BCAA levels in insulin-resistant rodents (2, 21), this may explain why BCAAs are not elevated in response to dietary obesity in our studies. This does not rule out the possibility of a ceiling effect with HFD feeding on insulin resistance and glucose homeostasis that may have masked the potential BCAA supplementation effects. Although the BCAA dose we used did not markedly raise circulating BCAAs, which may be necessary to worsen insulin resistance and glucose intolerance in DIO mice, it did raise circulating BCKAs and C3 AC as well as muscle C5-OH/C3-DC AC, which are key components of the BCAA-related metabolic signature that is highly associated with insulin resistance. In addition, the modest increase in BCAAs is similar to the ~20% increase in valine and ~14% increase in leu/ile in plasma of obese humans compared with lean humans (10). Therefore, our study is informative about the level of plasma BCAA elevation seen with obesity in humans. Overall, interspecies differences are an important factor to consider when studying BCAA effects on glucose metabolism.
A third important factor is the route of BCAA administration. Supplementing BCAAs in the diet worsened glucose tolerance in HFD-fed Wistar rats compared with pair-fed controls (10), supporting the idea that BCAAs play a causal role in impairing glucose metabolism (36). However, in these studies, BCAA supplementation in food caused the rats to eat less food and gain less weight than rats fed an HFD alone (10). Thus, a pair-fed control group was required (10), which could affect BCAA metabolism and glucose tolerance due to the reduced calorie intake, attenuated weight gain, and stress. Despite the lower body weight of the rats fed HFD + BCAA, they were equally glucose intolerant as the heavier animals fed HFD alone. In our study, BCAAs supplemented in drinking water did not affect food intake or body weight and raised circulating BCAA levels but did not worsen insulin resistance or glucose tolerance.
We also considered whether sex differences could account for different BCAA effects on glucose metabolism. The majority of studies testing the causality of BCAAs on glucose intolerance or insulin resistance have been performed in male rodents (2, 4, 5, 10, 19–22). Although we did not perform metabolomics in both sexes on both diets, we find the following consistent results in both HFD-fed male and HFHS diet-fed female mice: (1) HFD feeding (HFHS diet and HFD) is not sufficient to raise circulating BCAA levels, (2) insulin resistance is not worsened even when circulating BCAA levels are mildly elevated with BCAA supplementation, (3) BCAA supplementation elevates a small subset of ACs but does not worsen glucose tolerance or insulin resistance, and (4) HFD + BCAA treatment increases valine oxidation in muscle. Valine oxidation in adipose tissue was markedly reduced in HFD-fed male mice and tended to decrease in HFD-fed female mice. This is consistent with reduced levels and activity of BCAT and BCKDH enzymes in fat from obese mice and humans (2, 37). Sex-specific differences, including adipose tissue depot heterogeneity, body composition, and expression of key genes such as leptin, may explain the more significant decrease in valine oxidation in adipose tissue in male mice (38). Altogether, our data strongly indicate that irrespective of sex, mildly elevating BCAAs does not worsen glucose metabolism in DIO mice.
Our data suggests that muscle from HFD-fed mice supplemented with BCAAs may increase valine oxidation in an attempt to offset elevations in circulating levels of BCAAs. These data are consistent with increased valine oxidation in quadriceps muscle of db/db mice, which have elevated plasma BCAA levels (21). It is unknown whether increased valine oxidation in muscle affects glucose homeostasis. However, one study showed that treatment with a BDK inhibitor increased BCKDH activity (which would increase BCAA oxidation) in multiple tissues, including muscle and WAT, from DIO mice (3). This was associated with improved glucose tolerance and insulin sensitivity in DIO mice (3) and in genetically obese ZFR (22).
Our study is one of the first to report multitissue metabolomes from mice fed diets high in fat with or without BCAA supplementation in water. We find that the diet composition has different effects on the metabolome. Feeding of an HFD (fat derived from hydrogenated vegetable oil, 9.05% sucrose [Table S1]) (23) altered more AC and acyl CoA species in serum, liver, gastrocnemius, and PG WAT compared with feeding of an HFHS diet (fat derived from butter, 35% sucrose [Table S1]) (23). Of the multiple metabolites measured in muscle and liver, only 3 acyl CoA species (C16:1, oleoyl, C22:6) responded similarly to feeding of both high fat diets. BCAA supplementation raised C5-OH/C3-DC AC levels in liver and skeletal muscle of HFHS-fed mice and muscle of HFD-fed mice compared to controls, which may reflect increased BCAA oxidation in these tissues (4). This finding is consistent with the decrease in C5-OH/C3-DC AC levels in liver and muscle tissue from Zucker lean or Zucker fatty rats fed a BCAA-restricted diet (19).
Our work provides insight into whether BCAAs are a causal agent in the development of metabolic disease in commonly used mouse models. We found that despite raising circulating BCAA levels and muscle odd-chain ACs, BCAA supplementation does not worsen insulin resistance in mice fed diets high in fat. It is important to note that our model was not restrictive of BCAAs prior to supplementation, which is a common protocol for BCAA intervention in some rodent studies, demonstrating causality of BCAAs in insulin resistance (5, 19). The studies reported here provide a comprehensive metabolome analysis characterizing the effects of high fat diets, with and without BCAA supplementation, in serum and metabolic tissues in DIO mice, which are different from the changes in rat studies (10). This work does not challenge the long-standing observation that BCAAs are a biomarker for obesity and impaired glucose metabolism, or the evidence suggesting causality in rodent studies involving alterations in dietary BCAA content or activation of BCKDH (3, 10, 20, 22). The current study highlights key factors that need to be considered when investigating the effects of excess BCAAs on metabolism in mice.
Acknowledgments
We thank Dr Malcolm Watford for his scientific input and review of the manuscript, Dr Anna Santoro for comments on the manuscript, and Dr Odile Peroni, Kerry Wellenstein and Marlee Jackson for scientific input and technical assistance.
Financial Support: Supported by grants from the National Institutes of Health 5T32DK007516 (BBK and JL); JPB Foundation (BBK), NIH R01 DK43051 (BBK); K01 DK114162 (JL); NIH R01 DK121710 (CBN); American Diabetes Association Pathway to Stop Diabetes 1-16-INI-17 (PJW).
Additional Information
Disclosures: The authors have nothing to disclose.
Data Availability
Some or all data generated or analyzed during this study are included in this published article or in the data repositories listed in the References section.
References
- 1. Felig P, Marliss E, Cahill GF Jr. Plasma amino acid levels and insulin secretion in obesity. N Engl J Med. 1969;281(15):811–816. [DOI] [PubMed] [Google Scholar]
- 2. She P, Van Horn C, Reid T, Hutson SM, Cooney RN, Lynch CJ. Obesity-related elevations in plasma leucine are associated with alterations in enzymes involved in branched-chain amino acid metabolism. Am J Physiol Endocrinol Metab. 2007;293(6):E1552–E1563. [DOI] [PMC free article] [PubMed] [Google Scholar]
- 3. Zhou M, Shao J, Wu CY, et al. Targeting BCAA catabolism to treat obesity-associated insulin resistance. Diabetes. 2019;68(9):1730–1746. [DOI] [PMC free article] [PubMed] [Google Scholar]
- 4. Giesbertz P, Padberg I, Rein D, et al. Metabolite profiling in plasma and tissues of ob/ob and db/db mice identifies novel markers of obesity and type 2 diabetes. Diabetologia. 2015;58(9):2133–2143. [DOI] [PubMed] [Google Scholar]
- 5. Maida A, Chan JSK, Sjøberg KA, et al. Repletion of branched chain amino acids reverses mTORC1 signaling but not improved metabolism during dietary protein dilution. Mol Metab. 2017;6(8):873–881. [DOI] [PMC free article] [PubMed] [Google Scholar]
- 6. Laferrère B, Reilly D, Arias S, et al. Differential metabolic impact of gastric bypass surgery versus dietary intervention in obese diabetic subjects despite identical weight loss. Sci Transl Med. 2011;3(80):80re2. [DOI] [PMC free article] [PubMed] [Google Scholar]
- 7. Magkos F, Bradley D, Schweitzer GG, et al. Effect of Roux-en-Y gastric bypass and laparoscopic adjustable gastric banding on branched-chain amino acid metabolism. Diabetes. 2013;62(8):2757–2761. [DOI] [PMC free article] [PubMed] [Google Scholar]
- 8. Lotta LA, Scott RA, Sharp SJ, et al. Genetic predisposition to an impaired metabolism of the branched-chain amino acids and risk of type 2 diabetes: a mendelian randomisation analysis. Plos Med. 2016;13(11):e1002179. [DOI] [PMC free article] [PubMed] [Google Scholar]
- 9. Shah SH, Crosslin DR, Haynes CS, et al. Branched-chain amino acid levels are associated with improvement in insulin resistance with weight loss. Diabetologia. 2012;55(2):321–330. [DOI] [PMC free article] [PubMed] [Google Scholar]
- 10. Newgard CB, An J, Bain JR, et al. A branched-chain amino acid-related metabolic signature that differentiates obese and lean humans and contributes to insulin resistance. Cell Metab. 2009;9(4):311–326. [DOI] [PMC free article] [PubMed] [Google Scholar]
- 11. Wang TJ, Larson MG, Vasan RS, et al. Metabolite profiles and the risk of developing diabetes. Nat Med. 2011;17(4):448–453. [DOI] [PMC free article] [PubMed] [Google Scholar]
- 12. Mahendran Y, Jonsson A, Have CT, et al. Genetic evidence of a causal effect of insulin resistance on branched-chain amino acid levels. Diabetologia. 2017;60(5):873–878. [DOI] [PubMed] [Google Scholar]
- 13. Wang Q, Holmes MV, Davey Smith G, Ala-Korpela M. Genetic support for a causal role of insulin resistance on circulating branched-chain amino acids and inflammation. Diabetes Care. 2017;40(12):1779–1786. [DOI] [PMC free article] [PubMed] [Google Scholar]
- 14. Perng W, Rifas-Shiman SL, Hivert MF, Chavarro JE, Oken E. Branched chain amino acids, androgen hormones, and metabolic risk across early adolescence: a prospective study in project viva. Obesity (Silver Spring). 2018;26(5):916–926. [DOI] [PMC free article] [PubMed] [Google Scholar]
- 15. Newbern D, Gumus Balikcioglu P, Balikcioglu M, et al. Sex differences in biomarkers associated with insulin resistance in obese adolescents: metabolomic profiling and principal components analysis. J Clin Endocrinol Metab. 2014;99(12):4730–4739. [DOI] [PMC free article] [PubMed] [Google Scholar]
- 16. Connelly MA, Wolak-Dinsmore J, Dullaart RPF. Branched chain amino acids are associated with insulin resistance independent of leptin and adiponectin in subjects with varying degrees of glucose tolerance. Metab Syndr Relat Disord. 2017;15(4):183–186. [DOI] [PubMed] [Google Scholar]
- 17. Patel MJ, Batch BC, Svetkey LP, et al. Race and sex differences in small-molecule metabolites and metabolic hormones in overweight and obese adults. Omics. 2013;17(12):627–635. [DOI] [PMC free article] [PubMed] [Google Scholar]
- 18. Nairizi A, She P, Vary TC, Lynch CJ. Leucine supplementation of drinking water does not alter susceptibility to diet-induced obesity in mice. J Nutr. 2009;139(4):715–719. [DOI] [PMC free article] [PubMed] [Google Scholar]
- 19. White PJ, Lapworth AL, An J, et al. Branched-chain amino acid restriction in Zucker-fatty rats improves muscle insulin sensitivity by enhancing efficiency of fatty acid oxidation and acyl-glycine export. Mol Metab. 2016;5(7):538–551. [DOI] [PMC free article] [PubMed] [Google Scholar]
- 20. Fontana L, Cummings NE, Arriola Apelo SI, et al. Decreased consumption of branched-chain amino acids improves metabolic health. Cell Rep. 2016;16(2):520–530. [DOI] [PMC free article] [PubMed] [Google Scholar]
- 21. Neinast MD, Jang C, Hui S, et al. Quantitative analysis of the whole-body metabolic fate of branched-chain amino acids. Cell Metab. 2019;29(2):417–429.e4. [DOI] [PMC free article] [PubMed] [Google Scholar]
- 22. White PJ, McGarrah RW, Grimsrud PA, et al. The BCKDH kinase and phosphatase integrate BCAA and lipid metabolism via regulation of ATP-citrate lyase. Cell Metab. 2018;27(6):1281–1293.e7. [DOI] [PMC free article] [PubMed] [Google Scholar]
- 23. Lee J, Vijayakumar A, White PJ, et al. Effects of BCAA supplementation in mice with diet-induced obesity alters the metabolome without impairing glucose homeostasis. Dryad. Dataset. doi: 10.5061/dryad.fqz612jrt. https://datadryad.org/stash/share/fqK_erBqDYk-AZS2kR6hUeLC10a7AleQ5YkKCl9nd2s. Deposited December 31, 2020. [DOI] [PMC free article] [PubMed] [Google Scholar]
- 24. Koves TR, Ussher JR, Noland RC, et al. Mitochondrial overload and incomplete fatty acid oxidation contribute to skeletal muscle insulin resistance. Cell Metab. 2008;7(1):45–56. [DOI] [PubMed] [Google Scholar]
- 25. Olson KC, Chen G, Lynch CJ. Quantification of branched-chain keto acids in tissue by ultra fast liquid chromatography-mass spectrometry. Anal Biochem. 2013;439(2):116–122. [DOI] [PMC free article] [PubMed] [Google Scholar]
- 26. Chace DH, Hillman SL, Millington DS, Kahler SG, Roe CR, Naylor EW. Rapid diagnosis of maple syrup urine disease in blood spots from newborns by tandem mass spectrometry. Clin Chem. 1995;41(1):62–68. [PubMed] [Google Scholar]
- 27. Ferrara CT, Wang P, Neto EC, et al. Genetic networks of liver metabolism revealed by integration of metabolic and transcriptional profiling. Plos Genet. 2008;4(3):e1000034. [DOI] [PMC free article] [PubMed] [Google Scholar]
- 28. An J, Muoio DM, Shiota M, et al. Hepatic expression of malonyl-CoA decarboxylase reverses muscle, liver and whole-animal insulin resistance. Nat Med. 2004;10(3):268–274. [DOI] [PubMed] [Google Scholar]
- 29. Haqq AM, Lien LF, Boan J, et al. The study of the effects of diet on metabolism and nutrition (STEDMAN) weight loss project: rationale and design. Contemp Clin Trials. 2005;26(6):616–625. [DOI] [PubMed] [Google Scholar]
- 30. Minkler PE, Kerner J, Ingalls ST, Hoppel CL. Novel isolation procedure for short-, medium-, and long-chain acyl-coenzyme A esters from tissue. Anal Biochem. 2008;376(2):275–276. [DOI] [PMC free article] [PubMed] [Google Scholar]
- 31. Benjamini Y, Drai D, Elmer G, Kafkafi N, Golani I. Controlling the false discovery rate in behavior genetics research. Behav Brain Res. 2001;125(1-2):279–284. [DOI] [PubMed] [Google Scholar]
- 32. Berwick DC, Hers I, Heesom KJ, Moule SK, Tavare JM. The identification of ATP-citrate lyase as a protein kinase B (Akt) substrate in primary adipocytes. J Biol Chem. 2002;277(37):33895–33900. [DOI] [PubMed] [Google Scholar]
- 33. Das S, Morvan F, Jourde B, et al. ATP citrate lyase improves mitochondrial function in skeletal muscle. Cell Metab. 2015;21(6):868–876. [DOI] [PubMed] [Google Scholar]
- 34. Muoio DM, Newgard CB. Fatty acid oxidation and insulin action: when less is more. Diabetes. 2008;57(6):1455–1456. [DOI] [PubMed] [Google Scholar]
- 35. Lang P, Hasselwander S, Li H, Xia N. Effects of different diets used in diet-induced obesity models on insulin resistance and vascular dysfunction in C57BL/6 mice. Sci Rep. 2019;9(1):19556. [DOI] [PMC free article] [PubMed] [Google Scholar]
- 36. White PJ, Newgard CB. Branched-chain amino acids in disease. Science. 2019;363(6427):582–583. [DOI] [PMC free article] [PubMed] [Google Scholar]
- 37. Estrada-Alcalde I, Tenorio-Guzman MR, Tovar AR, et al. Metabolic fate of branched-chain amino acids during adipogenesis, in adipocytes from obese mice and C2C12 myotubes. J Cell Biochem. 2017;118(4):808–818. [DOI] [PubMed] [Google Scholar]
- 38. Montague CT, Prins JB, Sanders L, Digby JE, O’Rahilly S. Depot- and sex-specific differences in human leptin mRNA expression: implications for the control of regional fat distribution. Diabetes. 1997;46(3):342–347. [DOI] [PubMed] [Google Scholar]
Associated Data
This section collects any data citations, data availability statements, or supplementary materials included in this article.
Data Availability Statement
Some or all data generated or analyzed during this study are included in this published article or in the data repositories listed in the References section.


