Abstract
Although the current COVID-19 crisis is felt globally, at the local level, COVID-19 has disproportionately affected poor, highly segregated African American communities in Chicago. To understand the emerging pattern of racial inequality in the effects of COVID-19, we examined the relative burden of social vulnerability and health risk factors. We found significant spatial clusters of social vulnerability and risk factors, both of which are significantly associated with the increased COVID-19-related death rate. We also found that a higher percentage of African Americans was associated with increased levels of social vulnerability and risk factors. In addition, the proportion of African American residents has an independent effect on the COVID-19 death rate. We argue that existing inequity is often highlighted in emergency conditions. The disproportionate effects of COVID-19 in African American communities are a reflection of racial inequality and social exclusion that existed before the COVID-19 crisis.
Keywords: African American, emergency, general terms, GIS, health disparities, health equity, neighborhood, place, population groups, risk and crisis communication
Since the first confirmed case was reported in Chicago, Illinois, on January 24, 2020, the number of COVID-19 cases and deaths have increased exponentially over the past 3 months. As of April 20, there are 31,508 confirmed cases and 1,349 deaths in Illinois (Illinois Department of Public Health, n.d.). The current pandemic, however, is shown to affect communities of color, particularly African American communities. As of April 20, there were 13,000 confirmed cases in Chicago. Of those cases, 45.6% were African American and 20.4% were White. Concerning the COVID-19-related deaths, 56% of the 538 people who have died were African American, and 15.8% were White (Chicago Department of Public Health, n.d.). These numbers stand in contrast to the racial make-up of the city of Chicago, which is 30.1% non-Hispanic African American and 32.8% White (U.S. Census Bureau, n.d.-b).
Vulnerability is a key concept to understanding risk exposure and outcomes associated with disasters and hazards. Risk as a technical term is narrowly defined, as value neutral. However, vulnerability of an area is shaped by social, economic, political context, and practices. Thus, even natural disasters are not quite “natural” (Dyson, 2006; Logan, 2009; O’Keefe et al., 1976). Since the early 1980s, scholars have considered vulnerability as a condition of a system that exists before it encounters a hazard, and certain social factors exacerbate the effects of disasters (Bergstrand et al., 2015; Ge et al., 2017). Consequently, vulnerability to natural disasters such as COVID-19 is socially constructed (Burton et al., 2018; Cutter, 1996; Pelling, 2003). Social vulnerability highlights social, economic, demographic, and geographic characteristics that determine not only risk exposure but also community capacity to deal with, respond to, and recover from natural disasters and hazards.
Structural factors affecting disaster outcomes, such as the uneven distribution of resources, social exclusion, poverty, and discrimination, have been examined since the 1970s (O’Keefe et al., 1976). O’Keefe et al. (1976) argue that there is nothing “natural” about natural disasters. While hurricanes, earthquakes, and pandemics, such as COVID-19, occur naturally, these seeming natural disasters unveil the interconnectedness between natural events and existing vulnerability of populations (Cutter, 2005; Cutter et al., 2003). Indeed, vulnerability is embedded in social structures, thus risk and the uneven distribution of risk exposure is a social concept (Fordham et al., 2013). Social vulnerability reflects the pattern of social stratification, thus both physical and social conditions need to be examined to explain differential outcomes.
Methods
In this article, we examined the effects of social vulnerability and health risk factors on the spatial distribution of the COVID-19-related deaths. We obtained the COVID-19 mortality data from the Cook County Medical Examiner’s Case Archive (Cook County Medical Examiner’s Office, n.d.). We then geocoded the incident location information using the ArcGIS, geographic information systems (GIS) software.
There are just over 800 census tracts in the City of Chicago, and census tracts are tied to 77 Chicago Community Areas (CCA), which are well-defined geographic boundaries. Initially 76 community areas were proposed by the Social Science Research Committee at the University of Chicago in the 1920s. O’Hare airport was added in the 1950s and in the 1980s, Edgewater was separated out from Uptown, making a total of 77 community areas (Seligman, n.d.; University of Chicago Library, n.d.). Racial/ethnic residential segregation by CCAs has been well documented (Burgess & Park, 1984; Margellos et al., 2004; Orsi et al., 2010; Sampson, 2012). Currently, 17 of 77 CCAs have over 90% of African American residents, which are located city’s south and west sides.
We created a social vulnerability index (SVI) using sociodemographic characteristics of the city’s 77 CCAs, to quantify the level of social vulnerability. We retrieved indicator variables from the U.S. Census American Community Survey (ACS) 5-year estimates between 2014 and 2018, including the percentage of poverty, the percentage of less than high school education, the percentage of female-headed households with children, median household income, and employment ratio (U.S. Census Bureau, n.d.-a). We then performed principal component analysis (PCA) to derive a composite score for the SVI. While racial composition is often included in the SVIs, we examined the percentage of African Americans, the percentage of Whites, and the percentage of Latinx separately to estimate independent effects of race/ethnicity.
Health risk factor score was created using several comorbidities from the Chicago Health Atlas data at the CCA level (Chicago Health Atlas, n.d.). The health risk score included the rates of heart-related death, stroke deaths, asthma, hypertension, diabetes, obesity, and smoking (CDC COVID-19 Response Team, 2020). Similar to SVI, we performed PCA to create a risk score using the rates of these comorbidities.
We employed ArcGIS to conduct hotspot analysis at the CCA level to identify clusters of areas and compute bivariate local autocorrelations. Bivariate correlation (Moran’s I) ranges from −1 to 1, where 0 being no correlation, while +1 indicates perfect positive correlation and −1 suggests perfect negative correlation. Finally, to examine the total effects of SVI, risk score, and the percentage of African American residents, we ran a structural equation model that reflects our conceptual understanding of the relationships between race, social vulnerability, and health risks. We present the total effects of SVI, risk score, and the percentage of African Americans on COVID-related deaths.
Results
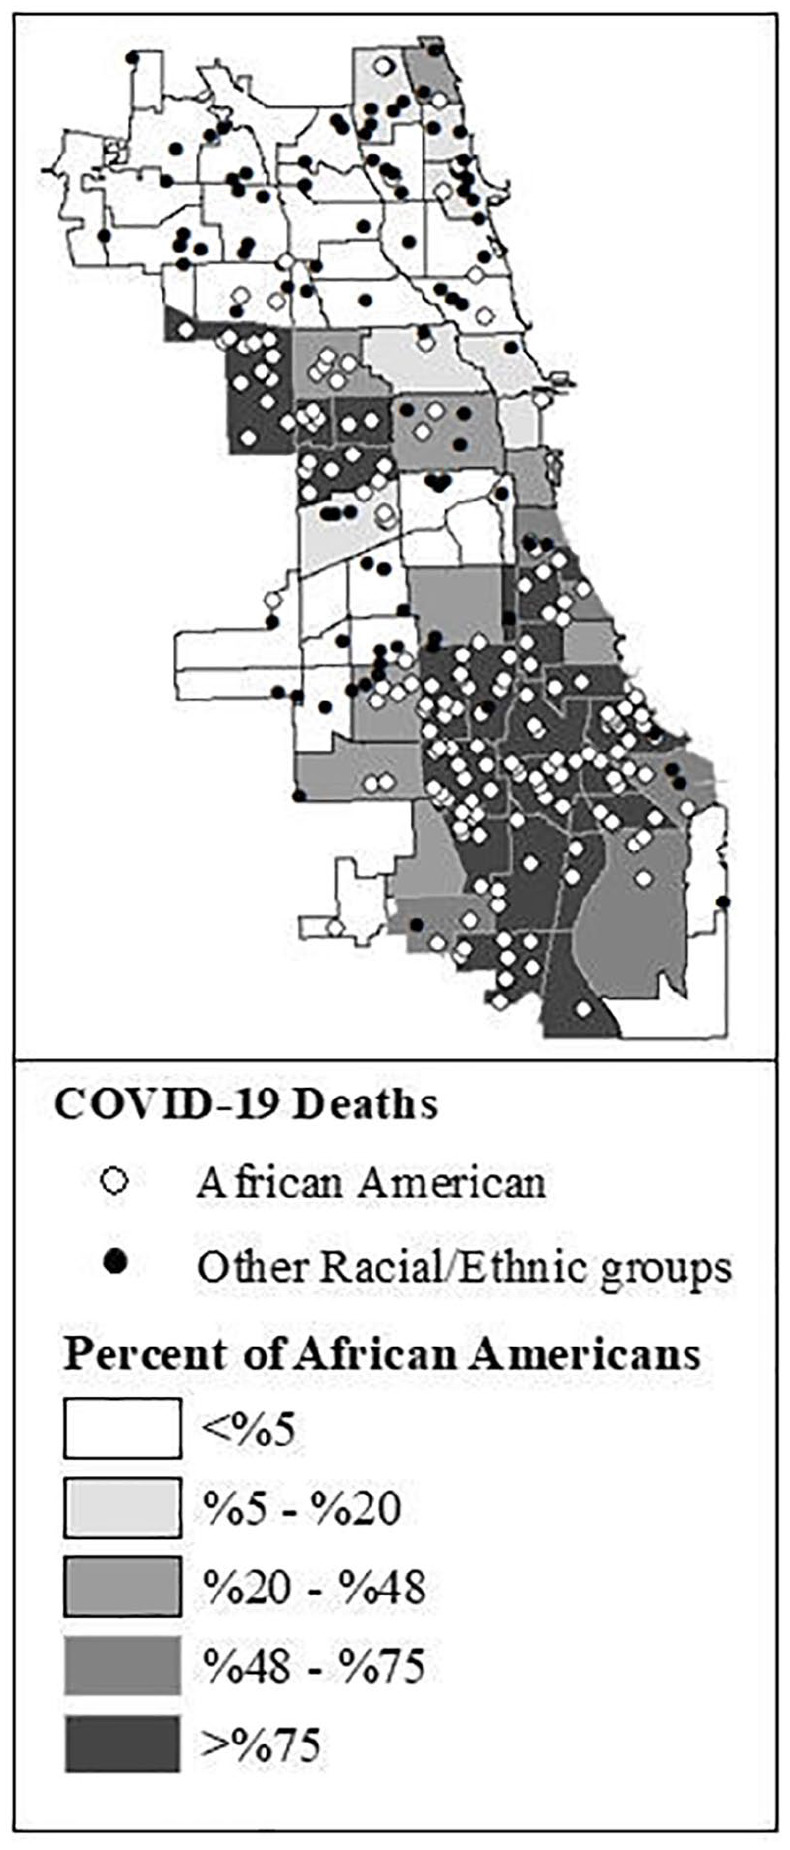
Figure 1 depicts the COVID-related deaths in Chicago. White dots indicate African Americans and black dots indicate other racial/ethnic groups. Of the 269 deaths recorded in the medical examiner’s archive data, 62.8% were African Americans. As shown, COVID-19 deaths were clustered on the south and west side of the city, and the majority of deaths in these areas were African Americans.
Figure 1.

The distributions of COVID-19-related deaths by race and percentage of African Americans in 77 Chicago Community Areas (N = 269).
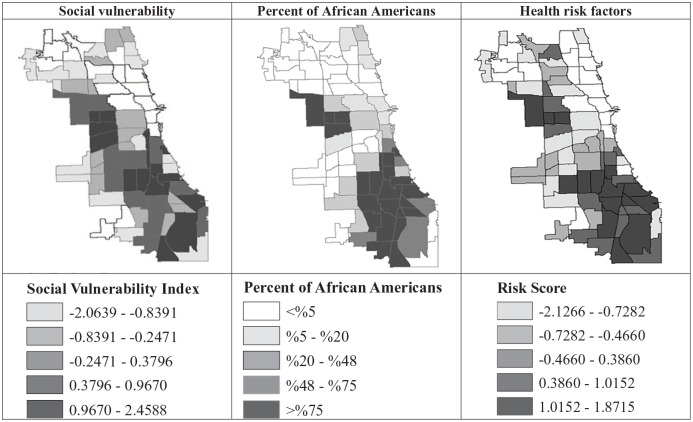
Figure 2 compares the distributions of SVI, risk factor score, and the percentage of African American residents at the CCA level. The south and west sides of Chicago are highly segregated, predominantly African American communities, which also show higher levels of social vulnerability as well as risk factor scores. SVI ranged between −2.0640 and 2.4859, and the risk score ranged between −2.1266 and 1.8715.
Figure 2.
The spatial distributions of social vulnerability, health risk factors, and the percentage of African American residents in Chicago Community Areas.
Note. Social vulnerability index ranged from −2.0640 to 2.4859; Risk Score ranged from −2.1266 to 1.8715.
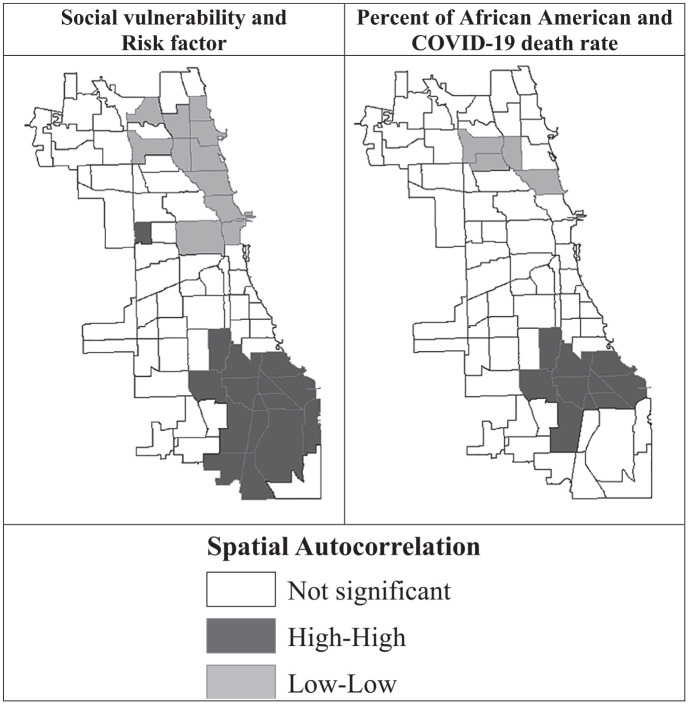
Bivariate correlation Moran’s I between the percentage of African American residents and SVI was 0.48, while Moran’s I was −0.49 between the percentage of White residents and SVI. Similarly, the bivariate autocorrelation between the percentage of African Americans and the risk score was at 0.53, while it was −0.56 between the percentage of White residents and the risk score. Moran’s I was 0.38 between SVI and the risk score was 0.52. Autocorrelation between the percentage of African American residents and the COVID death rate was 0.41 for the percentage of White residents, −0.33. Figure 3 visualizes the hotspots (black) between high SVI and high risk score and high percentage of African American residents and the COVID death rate.
Figure 3.
Local spatial autocorrelation between social vulnerability and health risk factor score; and the percentage of African American residents and the rate of COVID-19-related deaths in Chicago Community Areas.
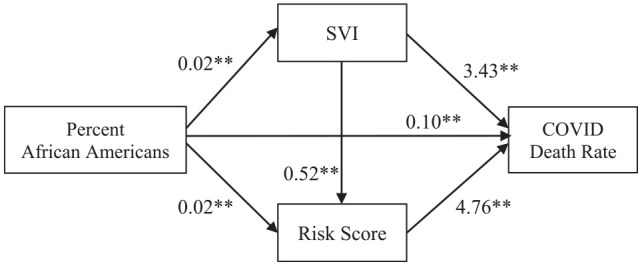
Figure 4 describes our structural equation model that depicts the conceptualization and the total effects of race/ethnicity, social vulnerability, and health risk factors on the COVID-19 death rate. Overall, Chicago community areas with a higher percentage of African Americans were associated with higher levels of SVI and risk factor scores. Community areas with higher levels of SVI and risk factor score had a significantly higher COVID death rate. For the most part, the effect of social vulnerability on the death rate was medicated through health risk factors.
Figure 4.

Structural equation model results: Unstandardized regression coefficients for the correlation between the percentage of African Americans, social vulnerability, health risk factors, and the COVID-19 death rate.
Note. SVI = social vulnerability index.
*p < .05. **p < .01.
Discussion
Social vulnerability provides a useful framework for understanding unequal outcomes of disasters and health crises, such as COVID-19, by linking social conditions and risk exposure. Structural factors, such as poverty, segregation, and discrimination, affect community’s exposure to risk and ability to recover from disaster events. We showed that COVID-19 deaths were clustered on the south and west sides of Chicago, which are predominantly African American communities. One of the reasons for such racial disparities could be the fact that African American communities are disproportionately affected by multiple chronic diseases before the COVID-19 pandemic. Additionally, persisting social inequities, including poverty, racial discrimination, and spatial exclusion, have dismantled community capacity. As a result, residents in highly segregated, disfranchised neighborhoods are disproportionately exposed to social and health risks. And these social factors result in health disparities as we see in our own city. Increased social vulnerability is associated with health inequality. And together, existing structural vulnerability and health risks produce the current racial inequality in the COVID-19 outcomes.
Existing inequalities are highlighted in moments of crisis, such as the current pandemic. Because social vulnerability is embedded in social structures, we see clustered vulnerability in not only the current COVID-19 crisis, but all other disaster events, including the Chicago Heat wave in 1995, Hurricane Katrina in 2005, and Hurricane Maria in 2017. Spatial clusters of COVID-related deaths are due to existing spatial stratification, including spatial concentration of poverty, social exclusion, and racial segregation (Sampson, 2012), which then results in spatial patterns of health inequality (Browning et al., 2006; Wodtke et al., 2012). As dismaying and painful as racial disparities in the COVID-19 mortality rates are, such racial inequality has been observed in a myriad of health outcomes for decades (Arcaya & Figueroa, 2017). Racial/ethnic social and economic inequalities have also dismantled community capacity to deal with natural and man-made disasters (Holifield, 2001; Logan, 2009), such as the COVID-19, leaving entire communities vulnerable to disproportionate exposure, as well as more severe outcomes postdisaster (Goldmann & Galea, 2014).
Chicago, one of the most segregated cities in the United States, may show how racial/ethnic residential segregation intensifies disparities in the COVID-19 outcomes (Massey & Denton, 1993). As we respond to minimize such uneven burden of the COVID-19 pandemic, health policies need to pay close attention to broader structural inequities. Public health can only be protected by mitigating social vulnerability of all communities.
Footnotes
Declaration of Conflicting Interests: The authors declared no potential conflicts of interest with respect to the research, authorship, and/or publication of this article.
Funding: The authors disclosed receipt of the following financial support for the research, authorship, and/or publication of this article: CHER Chicago is funded by the National Institute on Minority Health and Health Disparities, National Institutes of Health (U54MD012523).
ORCID iD: Sage J. Kim  https://orcid.org/0000-0001-8939-5157
References
- Arcaya M., Figueroa J. (2017). Emerging trends could exacerbate health inequities in the United States. Health Affairs, 36(6), 992–998. 10.1377/hlthaff.2017.0011 [DOI] [PubMed] [Google Scholar]
- Bergstrand K., Mayer B., Brumback B., Zhang Y. (2015). Assessing the relationship between social vulnerability and community resilience to hazards. Social Indicators Research, 122(2), 391–409. 10.1007/s11205-014-0698-3 [DOI] [PMC free article] [PubMed] [Google Scholar]
- Browning C., Feinberg S., Wallace D., Cagney K. (2006). Neighborhood social processes, physical conditions, and disaster-related mortality: The case of the 1995 Chicago heat wave. American Sociological Review, 71(4), 661–678. 10.1177/000312240607100407 [DOI] [Google Scholar]
- Burgess E. W., Park R. E. (1984). The city. University of Chicago Press. [Google Scholar]
- Burton C., Rufat S., Tate E. (2018). Social vulnerability: Conceptual foundations and geospatial modeling. In Fuchs S., Thaler T. (Eds.), Vulnerability and resilience to natural hazards (pp. 53–81). Cambridge University Press. [Google Scholar]
- CDC COVID-19 Response Team. (2020). Preliminary estimates of the prevalence of selected underlying health conditions among patients with Coronavirus disease 2019—United States, February 12–March 28, 2020. Morbidity and Mortality Weekly Report, 69(13), 382–386. 10.15585/mmwr.mm6913e2 [DOI] [PMC free article] [PubMed] [Google Scholar]
- Chicago Department of Public Health. (n.d.). Latest data. https://www.chicago.gov/city/en/sites/covid-19/home/latest-data.html
- Chicago Health Atlas. (n.d.). Indicators. https://www.chicagohealthatlas.org/
- Cook County Medical Examiner’s Office. (n.d.). Medical examiner case archive. Cook County Government. https://datacatalog.cookcountyil.gov/Public-Safety/Medical-Examiner-Case-Archive-Manner-of-Death-Char/jjtx-2ras [Google Scholar]
- Cutter S. L. (1996). Vulnerability to environmental hazards. Progress in Human Geography, 20(4), 529–539. 10.1177/030913259602000407 [DOI] [Google Scholar]
- Cutter S. L. (2005). The geography of social vulnerability: Race, class, and catastrophe. In Understanding Katrina: Perspectives from the social sciences. Social Science Research Council. [Google Scholar]
- Cutter S. L., Boruff B. J., Shirley W. L. (2003). Social vulnerability to environmental hazards. Social Science Quarterly, 84(2), 242–261. 10.1111/1540-6237.8402002 [DOI] [Google Scholar]
- Dyson M. E. (2006). Unnatural disasters: Race and poverty. In Come hell or high water: Hurricane Katrina and the color of disaster (pp. 1–14). Basic Books. [Google Scholar]
- Fordham M., Lovekamp W., Thomas D., Phillips B. (2013). Understanding social vulnerability. In Thomas D., Phillips B., Lovekamp W., Fothergill A. (Eds.), Social vulnerability to disasters (2nd ed., pp. 1–32). Taylor & Francis. [Google Scholar]
- Ge Y., Dou W., Zhang H. (2017). A new framework for understanding urban social vulnerability from a network perspective. Sustainability, 9(10), Article 1723. 10.3390/su9101723 [DOI] [Google Scholar]
- Goldmann E., Galea S. (2014, March). Mental health consequences of disasters. Annual Review of Public Health, 35, 169–183. 10.1146/annurev-publhealth-032013-182435 [DOI] [PubMed] [Google Scholar]
- Holifield R. (2001). Defining environmental justice and environmental racism. Urban Geography, 22(1), 78–90. 10.2747/0272-3638.22.1.78 [DOI] [Google Scholar]
- Illinois Department of Public Health. (n.d.). Coronavirus disease 2019 (COVID-19). https://dph.illinois.gov/covid19
- Logan J. (2009). Unnatural disaster: Social impacts and policy choices after Katrina. In Bullard R., Wright B. (Eds.), Race, place, and environmental justice after Hurricane Katrina: Struggles to reclaim, rebuild, and revitalize New Orleans and the Gulf Coast (pp. 249–264). Westview Press. 10.4324/9780429497858-12 [DOI] [Google Scholar]
- Margellos H., Silva A., Whitman S. (2004). Comparison of health status indicators in Chicago: Are Black-White disparities worsening? American Journal of Public Health, 94(1), 116–121. 10.2105/AJPH.94.1.116 [DOI] [PMC free article] [PubMed] [Google Scholar]
- Massey D., Denton N. (1993). American apartheid. Harvard University Press. [Google Scholar]
- O’Keefe P., Westgate K., Wisner B. (1976). Taking the naturalness out of natural disasters. Nature, 260(5552), 566–567. 10.1038/260566a0 [DOI] [Google Scholar]
- Orsi J., Margellos-Anast H., Whitman S. (2010). Black–White health disparities in the United States and Chicago: A 15-year progress analysis. American Journal of Public Health, 100(2), 349–356. 10.2105/AJPH.2009.165407 [DOI] [PMC free article] [PubMed] [Google Scholar]
- Pelling M. (2003). Tracing the roots of urban risk and vulnerability. In Pelling M. (Ed.), The vulnerability of cities: Natural disasters and social resilience (pp. 3–10). Taylor & Francis. [Google Scholar]
- Sampson R. J. (2012). Great American city: Chicago and the enduring neighborhood effect. University of Chicago Press. 10.7208/chicago/9780226733883.001.0001 [DOI] [Google Scholar]
- Seligman A. (n.d.). Community areas. http://www.encyclopedia.chicagohistory.org/pages/319.html
- United States Census Bureau. (n.d.-a). Census data. https://data.census.gov/cedsci/
- United States Census Bureau. (n.d.-b). Quick facts. https://www.census.gov/quickfacts/chicagocityillinois
- University of Chicago Library. (n.d.). Spatially referenced census data for the city of Chicago. http://www.lib.uchicago.edu/e/collections/maps.moved/censusinfo.html
- Wodtke G., Elwert F., Harding D. (2012). Poor families, poor neighborhoods: How family poverty intensifies the impact of concentrated disadvantage (Report No. 12-776). Population Studies Center. https://www.psc.isr.umich.edu/pubs/abs/7739 [Google Scholar]


