Abstract
Diabetic kidney disease (DKD) has become the major contributor to end-stage renal disease with high incidence and mortality. The functional roles and exact mechanisms of long noncoding RNA (lncRNA)-associated competing endogenous RNA (ceRNA) network in DKD are still largely unknown. This study sought to discover novel potential biomarkers and ceRNA network for DKD.
The candidate differentially expressed genes (DEGs), lncRNAs and microRNAs (miRNAs) in human glomerular and tubular tissues derived from Gene Expression Omnibus database were systematically selected and analyzed. Functional enrichment analysis and protein-protein interaction network analysis were conducted to identify hub genes and reveal their regulatory mechanisms involved in DKD. Following this, the integrated ceRNA network was constructed by bioinformatics methods.
A total of 164 DEGs, 6 lncRNAs and 18 miRNAs correlated with DKD were finally filtered and identified. It is noteworthy that the global lncRNA-associated ceRNA network related to DKD was constructed, among which lnc-HIST2H2AA4-1, VCAN-AS1 and MAGI2-AS1 were identified as the 3 key lncRNAs, and VCAN, FN1, CCL2, and KNG1 were identified as the predominant genes. Consistent with that observed in the training set, 3 of the key genes also showed significant differences in the 2 validation datasets. Integrating with functional enrichment analysis results, these key genes in the ceRNA network were mainly enriched in the immune and inflammation-related pathways.
This study first identified key lncRNAs, miRNAs and their targets, and further revealed a global view of lncRNA-associated ceRNA network involved in DKD by using whole gene transcripts analysis.
Keywords: competing endogenous RNA, diabetic kidney disease, long noncoding RNA
1. Introduction
Diabetic kidney disease (DKD) is the major microvascular implication of diabetes mellitus, as approximately 30% to 40% of patients with diabetes mellitus will develop DKD.[1,2] In addition, DKD has become the major contributor to end-stage renal disease (ESRD) with high incidence and mortality especially in developed countries.[3]Although certain advances associated with pathological mechanism of DKD have been made to date, our understanding about this multifactorial and complicated disease remains limited, and current treatments are still not completely effective in preventing or delaying progression to ESRD. Consequently, identification of novel potential diagnostic and therapeutic biomarkers and exploration of the pathogenic mechanisms of DKD is urgently needed to prevent the occurrence and progression of this debilitating disease.
Emerging evidence has existed to highlight the key role for certain specific non-coding RNAs in the pathogenesis and therapeutic interventions of DKD.[4–6] microRNAs (miRNAs), a class of short non-codingRNAs, are approximately composed of 19 to 25 nucleotides, which function in the regulation of cellular activities and gene expression by binding to the selected sequences of target mRNAs.[7] Regarding kidney diseases, previous studies showed that miRNAs play a key role in renal fibrosis and glomerular and tubular dysfunction.[8,9] At present, several important miRNAs have been identified that are involved in DKD, including miR-21, miR-192, miR-29a, miR-137 and miR-let-7d.[10–12] In addition, long noncoding RNAs (lncRNAs), another kind of non-coding RNAs which are a class of transcripts longer than 200 nucleotides, are reported to be centrally involved in diverse biological processes, including mRNA transcription, DNA methylation, chromatin modification, and regulation of cellular signaling.[13] Although more and more lncRNAs remain to be characterized, evidence suggests that some specific lncRNAs may serve as key early diagnostic and therapeutic biomarkers for DKD, such as EA15, LINC00472, and lncRNA HOTAIR.[14,15] More importantly, recent studies have revealed that lncRNAs can function as competing endogenous RNAs (ceRNAs) via competing with the specific miRNAs, thus altering the expression of the downstream key genes and participating in posttranscriptional regulatory networks in the development of disease. Such lncRNA-associated ceRNA regulatory networks have been found in some important biological processes in the initiation and progression of certain tumors.[16,17] However, the functional roles and exact mechanisms of their involvement in DKD are still largely unknown, and it remains some deficiencies with no lncRNA or miRNA matures, verifiable repeatability, risk assessment and model validation in the context of DKD. Moreover, single lncRNA or miRNA molecule is rarely the only reason of this complication, but the combined effect of multiple key non-coding RNAs signatures and their ceRNA regulatory networks based on statistically robust analysis should be probed and emphasized to further elucidate the biological mechanisms of DKD. Combined with the above, regulating specific non-coding RNAs especially lncRNA-miRNA-mRNA ceRNA networks are expected to open up attractive avenues for preventing and treating DKD.
In the present study, we investigated, verified and assessed key lncRNAs, miRNAs, mRNAs and their ceRNA regulatory networks in DKD by using whole genetranscripts analysis. The candidate differentially expressed mRNAs, lncRNAs and miRNAs in human glomerular and tubular tissues derived from Gene Expression Omnibus (GEO) database were systematically selected and analyzed. Functional enrichment analysis as well as protein-protein interaction (PPI) network analysis were conducted to identify hub genes and reveal their potential biological functions and regulatory mechanisms in DKD. Following this, the integrated lncRNA-associated ceRNA network involved in DKD was constructed by bioinformatics methods. Using these comprehensive analyses, this study aimed to discover novel potential biomarkers and lncRNA-associated ceRNA network for DKD and provide novel evidence for the molecular mechanisms of DKD.
2. Materials and methods
2.1. Chip data resources
The chip data used for bioinformatics analysis was downloaded from the online NCBI Gene Expression Omnibus (GEO) database (https://www.ncbi.nlm.nih.gov/geo/). We used “diabetic kidney disease,” “diabetic nephropathy,” and “Homo sapiens” as search terms to retrieve datasets. After careful screening, the independent chip dataset GSE96804 was selected as the training set for subsequent analysis.[18] The dataset GSE96804 consisted a total of 61 human glomeruli tissue samples. The glomeruli samples were from 41 DKD patients (DKD group) and 20 healthy controls (Control group). In addition, 2 more human chip datasets GSE104948 and GSE30122 in both glomerular and tubular tissues were used as the validation sets.[19,20] The detection platforms used in this study were Affymetrix Human Transcriptome 2.0 Array and Affymetrix Human Genome U133A 2.0 Array for the training and validation sets respectively. Ethical approval was unnecessary in this study because the chip data was downloaded from GEO database and we do not conduct new experiments in patients or animals.
2.2. Identification of differentially expressed genes (DEGs) in DKD
Raw data was pre-processed, normalized and background adjusted by using the Limma package.[21] The DEGs between DKD and the control group were identified based on the fold change and adjusted P value. The aforementioned criteria for significant DEGs selection were corrected fold change ≥1.5 and adjusted P value <.05. In addition, the pheatmap package (https://mirror.lzu.edu.cn/CRAN/) were utilized to visualize these expression differences.
2.3. Functional enrichment analyses
The functional enrichment analyses of the overlapping DEGs were assessed by using the online functional annotation tools of gene ontology (GO) database and Kyoto Encyclopedia of Genes and Genomes (KEGG) Pathway database, in combination with the STRING, DAVID database and the q value R language package.[22,23] The statistically significant cutoff values for functional enrichment analyses were gene count ≥2 and q value <.05.
2.4. Construction of the PPI network
The PPI network based on the STRING database[22] was constructed to probe into the potential interactions of the overlapping DEGs at the protein level. The parameters for the PPI network establishment were medium confidence ≥0.4. Score of a node in the PPI network was calculated and those nodes with high degrees were considered as the hub nodes, and their results were visualized by using the Cytoscape software (http://cytoscape.org/). Then, the PPI network relationship was clarified and the hub genes in the network were identified using the Cytoscape and cytoHubba Cytoscape plug-in software (http://cytoscape.org/).
2.5. Validation of the hub genes
To validate the hub genes identified in the training set, 2 more human chip datasets GSE104948 and GSE30122 were used subsequently. To testify the accuracy and stability of our results, 25 renal glomerular tissue samples (7 DKD patients vs 18 healthy controls) from GSE104948 and 34 renal tubular tissue samples (10 DKD patients vs 24 healthy controls) from GSE30122 were selected for validation analysis.[19,20] After batch effects removal, the differential expression analysis of the hub genes using the same method above was carried out in the 2 validation sets.
2.6. Identification of lncRNAs and miRNAs and construction of ceRNA regulatory network
The candidate differentially expressed lncRNAs and miRNAs between DKD and the control group were identified based on the fold change and P value using the same method above. The aforementioned criteria were corrected fold change ≥1.5 and adjusted P value <.05, and the pheatmap package (https://mirror.lzu.edu.cn/CRAN/) were utilized to visualize these expression differences. MiRcode database (http://www.mircode.org/) was used to predict the lncRNA-miRNA interactions, and another 4 databases including TargetScan, miRDB, miRTarbase and StarBase were used to predict the interactions between miRNAs and the hub genes related to DKD. Furthermore, the primary lncRNA-miRNA-mRNA ceRNA regulatory networks in the progression of DKD were integrated and constructed by combining these results with the findings of KEGG pathway analysis through the qvalue R language package.[24] Pathway with a q value <.05 and P value <.05 was considered significantly enriched for the hub genes targeted by the miRNAs and lncRNAs signatures. The Cytoscape software (http://cytoscape.org/) was utilized to merge and visualize the ceRNA regulatory networks.
3. Results
3.1. Identification of DEGs in DKD
Following pre-processing of chip data, the DEGs were then identified from GSE96804 according to the filter criteria. The DEGs between 2 groups were shown in volcano plot (Fig. 1) and clustered and illustrated in heatmap (Fig. 2). After intersecting the above DEGs in DKD group compared with control group, and removing potential irrelevant genes, a total of 164 candidate DEGs were finally filtered and selected in the GSE96804, of which 83 were up regulated and 81 were down regulated (Fig. 2).
Figure 1.
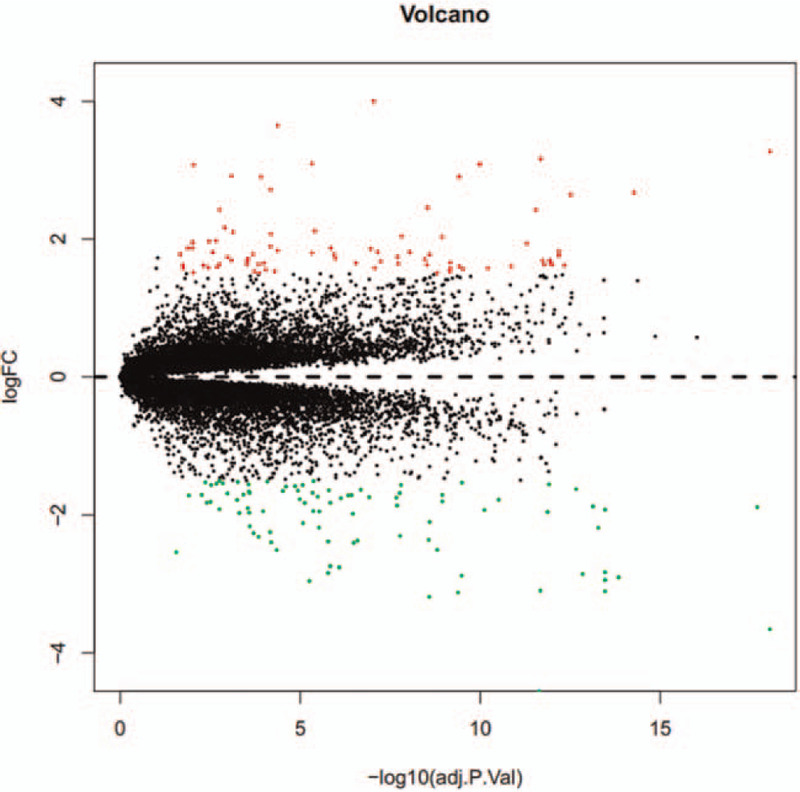
Volcano plot of the differential expressed genes (DEGs) between diabetic kidney disease (DKD) and control group in the training dataset GSE96804. x axis represents –log10 adjusted P value, and y axis represents transformed fold change (logFC).
Figure 2.
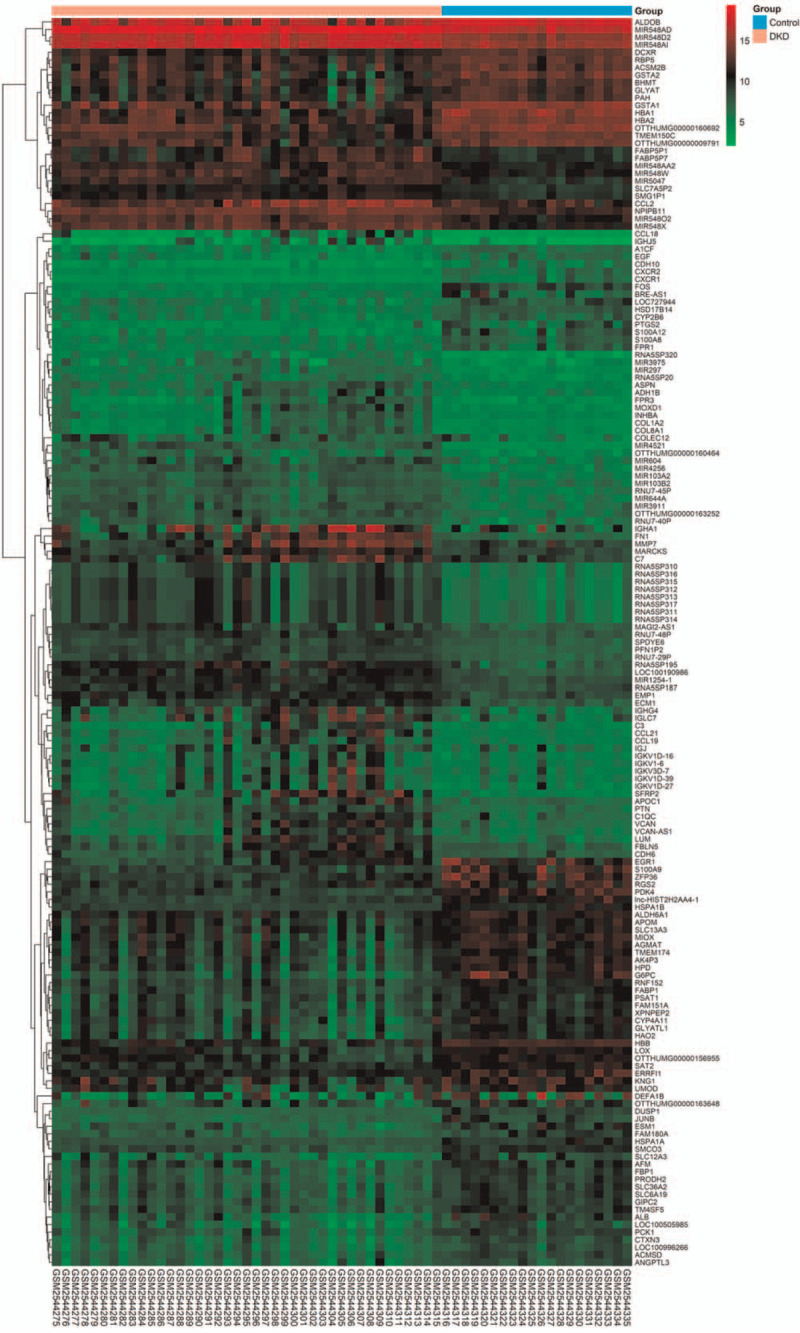
Heatmap of the expression profiles including DEGs, lncRNAs, and miRNAs between DKD and control group in the training dataset GSE96804.
3.2. Functional enrichment analyses of the DEGs
To probe into the biological functions of these candidate DEGs from GSE96804 and the possible regulatory mechanisms they may be involved in DKD, GO functional enrichment analysis as well as KEGG pathway analysis were conducted on these DEGs associated with DKD. The GO functional enrichment analysis of the DEGs in the GSE96804 was conducted from the aspects of molecular functions (MF), biological processes (BP), and cell components (CC). The GO enrichment analysis results revealed that there were a total of 320 functional items, including 64 MF, 237 BP, and 19 CC. As shown in Figure 3A, in the MF analysis, the top 5 enrichment items were organic acid binding, antioxidant activity, fatty acid binding, monocarboxylic acid binding, and RAGE receptor binding. In the BP analysis, the top 5 significant items were cellular oxidant detoxification, receptor-mediated endocytosis, cellular detoxification, cellular response to toxic substance, and neutrophil migration as shown in Figure 3B. Meanwhile, the GO CC analysis results revealed that the top 5 enrichment items were blood microparticle, collagen-containing extracellular matrix, collagen trimer, secretory granule lumen, and cytoplasmic vesicle lumen (Fig. 3C). Whereas in KEGG pathway enrichment results, 32 significant pathways were enriched for the DEGs, among which the top 5 were prion diseases, staphylococcus aureus infection, glycolysis/gluconeogenesis, phenylalanine metabolism, and IL-17 signaling pathway as shown in Table 1.
Figure 3.
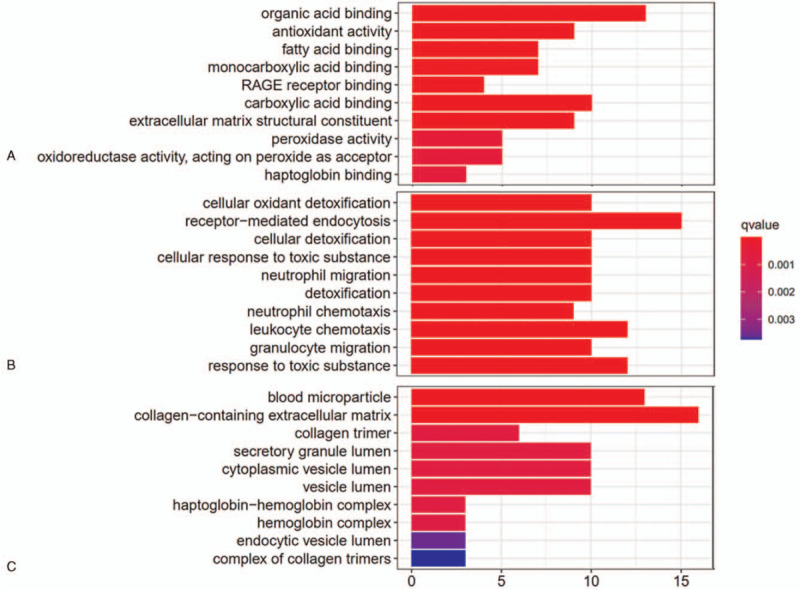
The gene ontology (GO) enrichment analysis of the DEGs in DKD in the training dataset GSE96804. The GO analysis of the DEGs from the aspects of MF (A), BP (B), and CC (C) with significant enrichment (top 10). Color of the bar chart indicates q value, and x axis indicates count of the DEGs in the GO function items. BP = biological processes, CC = cell components, MF = molecular functions.
Table 1.
KEGG pathway analysis of the DEGs.
| ID | Term | P value | DEGs |
| hsa05020 | Prion diseases | .000256006 | EGR1,C7,HSPA1A,C1QC |
| hsa05150 | Staphylococcus aureus infection | .000349668 | C3,FPR1,FPR3,DEFA1B,C1QC |
| hsa00010 | Glycolysis/Gluconeogenesis | .000349668 | G6PC,ADH1B,ALDOB,PCK1,FBP11 |
| hsa00360 | Phenylalanine metabolism | .000429976 | PAH,GLYAT,HPD |
| hsa04657 | IL-17 signaling pathway | .001458378 | CCL2,FOS,PTGS2,S100A9,S100A8 |
| hsa00980 | Metabolism of xenobiotics by | .004299684 | CYP2B6,ADH1B,GSTA2,GSTA1 |
| cytochrome P450 | |||
| hsa05204 | Chemical carcinogenesis | .006187546 | ADH1B,GSTA2,GSTA1,PTGS2 |
| hsa04062 | Chemokine signaling pathway | .007173479 | CXCR1,CCL21,CXCR2,CCL2, CCL19, CCL18 |
| hsa05418 | Fluid shear stress and atherosclerosis | .008143607 | DUSP1,GSTA2,GSTA1,CCL2,FOS |
| hsa00330 | Arginine and proline metabolism | .00946077 | SAT2,PRODH2,AGMAT |
| hsa04933 | AGE-RAGE signaling pathway | .012269268 | EGR1,COL1A2,FN1,CCL2 |
| hsa03008 | Ribosome biogenesis in eukaryotes | .012688633 | SNORD3B-2,SNORD3B-1 |
| SNORD3C, SNORD3A | |||
| hsa00983 | Drug metabolism | .015881308 | CYP2B6,ADH1B,GSTA2,GSTA1 |
| hsa04060 | Cytokine-cytokine receptor interaction | .016421793 | CXCR1,CCL21,CXCR2,CCL2, A;CCL19;CCL18 |
| interaction | INHBA, CCL19, CCL18 | ||
| hsa04668 | TNF signaling pathway | .016877923 | CCL2,FOS,PTGS2,JUNB |
3.3. PPI network of the hub genes
Using the filter criteria, a PPI network was then constructed, containing 102 nodes and 273 interactions as shown in Figure 4A. In selected modules, the DEGs from the GSE96804 were ranked by using the abovementioned formula and the top 10 nodes with high degrees in PPI network were identified as the hub genes, including 3 up regulated genes (FN1, CCL2, and C3) and 7 down regulated genes (ALB, KNG1, EGF, PTGS2, CXCR2, FOS, and CXCR1) (Table 2 and Fig. 4B).
Figure 4.
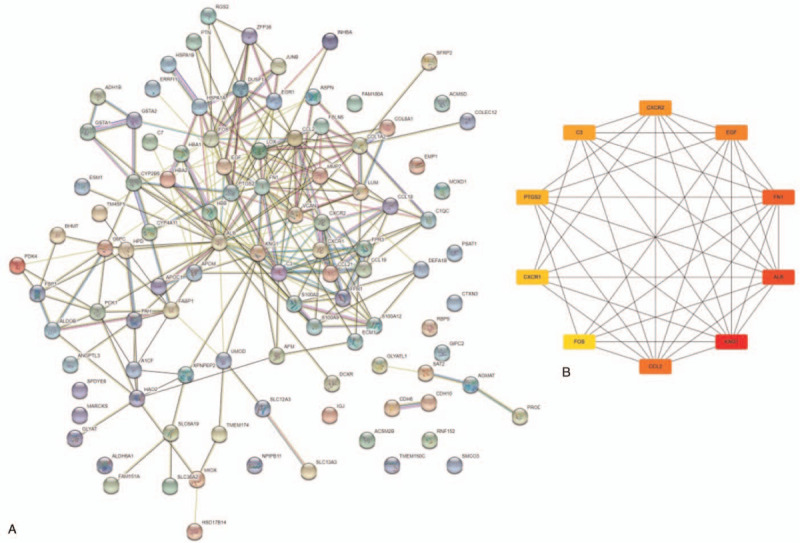
The protein-protein interaction (PPI) network analysis in the training dataset GSE96804. (A) The PPI network of the DEGs in DKD. (B) The PPI network of the hub genes in DKD. Network nodes indicate proteins, and edges indicate PPI. Darker color represents a higher level of interaction, and lighter color represents a lower level of interaction.
Table 2.
The hub genes of DKD.
| Regulation | Gene Symble sSymbleSymble | Gene Title | Degree | logFC | P value |
| Upregulation | FN1 | Fibronectin 1 | 21 | 4.00264072 | 9.10E-08 |
| CCL2 | C-C Motif Chemokine Ligand 2 | 17 | 1.71435445 | .000284852 | |
| C3 | Complement C3 | 15 | 1.97677666 | .002204951 | |
| Downregulation | ALB | Albumin | 35 | −2.75887 | 8.31E-07 |
| KNG1 | Kininogen 1 | 23 | −1.91301 | .00175948 | |
| EGF | Epidermal Growth Factor | 17 | −1.50573 | 4.27E-06 | |
| PTGS2 | Prostaglandin-Endoperoxide Synthase 2Synthase 2 | 15 | −2.50535 | 1.57E-09 | |
| CXCR2 | C-X-C Motif Chemokine Receptor 2Receptor 2 | 15 | −1.91982 | 3.42E-14 | |
| FOS | Fos Proto-Oncogene, AP-1 Transcription Factor Subunit | 15 | −3.65627 | 9.07E-19 | |
| CXCR1 | C-X-C Motif Chemokine Receptor 1 | 14 | −1.95441 | 1.35E-12 |
3.4. Validation of the hub genes related to DKD
To further validate the hub genes identified from the training set, we then compared them with the DEGs in the GSE104948 and GSE30122 datasets which were used as the validation sets. The box plots of the hub genes were presented in Figure 5, among which C3, CCL2, EGF, FN1, and VCAN simultaneously showed significant differences again in the 2 validation datasets, consistent with that observed in the training set.
Figure 5.
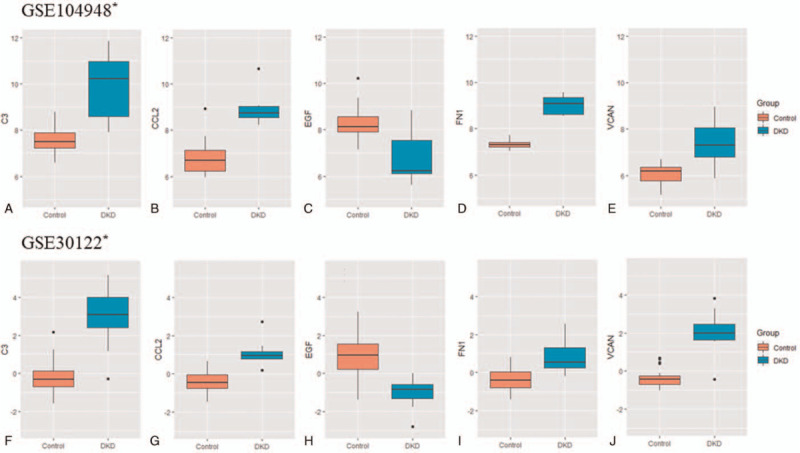
Validation of the hub genes related to DKD. The box plots of the key hub genes (C3, CCL2, EGF, FN1 and VCAN) showed significant differences between DKD and control group in the 2 validation datasets GSE104948 and GSE30122. Up: GSE104948. Down: GSE30122. ∗corrected P < .05.
3.5. Identification of lncRNAs and miRNAs signatures in DKD
The candidate lncRNAs and miRNAs signatures which may regulate the DEGs were finally identified from GSE96804 respectively based on the differential expressions. The differentially expressed lncRNAs and miRNAs between 2 groups were clustered and illustrated in heatmap (Fig. 2). Our results revealed that a total of 6 lncRNAs (lnc-HIST2H2AA4-1, LOC100190986, MAGI2-AS1, BRE-AS1, LOC100505985, and VCAN-AS1) and 18 miRNAs (MIR4521, MIR4256, MIR548AD, MIR548D2, MIR548AI, MIR1254-1, et al) were finally identified respectively, indicating their vital roles in the pathogenesis of DKD (Table 3).
Table 3.
The differentially expressed lncRNAs and miRNAs (top 6) in DKD.
| Regulation | lncRNA/miRNA | logFC | P value |
| lncRNA | |||
| Upregulation | LOC100190986 | 2.42579516 | 2.86E-12 |
| MAGI2-AS1 | 1.87166756 | .00000141 | |
| VCAN-AS1 | 1.5936535 | .002055793 | |
| Downregulation | lnc-HIST2H2AA4-1 | −2.1844679 | |
| −2.1844679 | |||
| 5.27E-14 | |||
| BRE-AS1 | −2.3814417 | .00000167 | |
| LOC100505985 | −1.9642697 | .00026086 | |
| miRNA | |||
| Upregulation | MIR4521 | 3.27223852 | 9.06E-19 |
| MIR4256 | 2.67496149 | 5.36E-15 | |
| MIR548AD | 1.61659718 | 4.59E-13 | |
| MIR548D2 | 1.76061403 | 6.51E-13 | |
| MIR548AI | 1.63952248 | 1.14E-12 | |
| MIR1254-1 | 1.69400033 | 1.17E-12 | |
| Downregulation | |||
| None | |||
3.6. Construction of the integrated lncRNA-associated ceRNA network related to DKD
The integrated lncRNA-associated ceRNA regulatory network related to DKD was constructed, which revealed that single lncRNA could target multiple miRNAs and their target genes, and that single miRNA or gene was regulated by multiple lncRNAs or miRNA separately. As indicated in such integrated regulatory network, lnc-HIST2H2AA4-1, VCAN-AS1 and MAGI2-AS1 were identified as the 3 key lncRNAs, and each regulatory network contained at least 1 identified lncRNA which formed close connections with other miRNAs as well as mRNAs (Fig. 4A). Among this, there were 2 miRNAs connected with lnc-HIST2H2AA4-1, and 12 miRNAs linked with VCAN-AS1. At the same time, there were 5 miRNAs related to MAGI2-AS1 in the integrated regulatory network. It is of note that VCAN, FN1, CCL2, and KNG1 were identified as the predominant genes in this lncRNA-associated ceRNA network, indicating their pivotal roles in regulation of DKD (Fig. 6). Integrating with the KEGG pathway enrichment results, these key hub genes were mainly enriched in the immune and inflammation-related pathways, including IL-17 signaling pathway, TNF signaling pathway, cell adhesion molecules, complement and coagulation cascades, chemokine signaling pathway, and cytokine-cytokine receptor interaction. Furthermore, AGE-RAGE signaling pathway was intensively enriched, suggesting a vital role in the occurrence and progression of DKD (Fig. 7).
Figure 6.
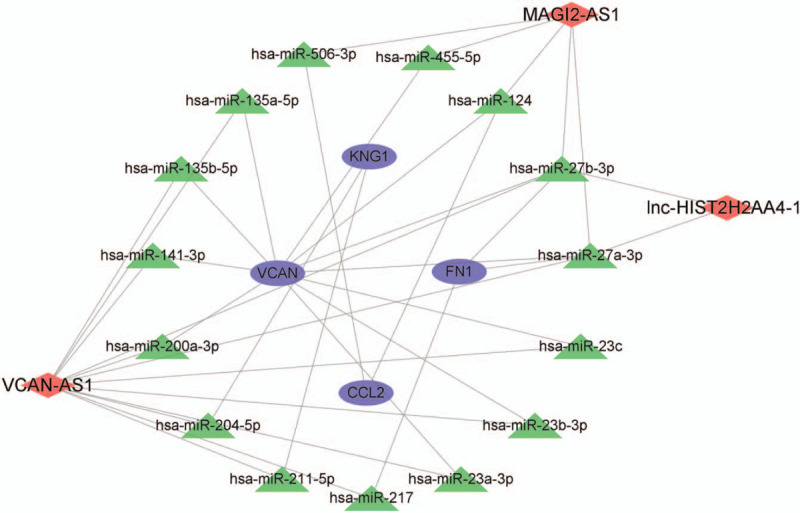
The lncRNA-associated ceRNA regulatory networks in DKD. Red color represents the key lncRNA, green color represents miRNA, and bule color represents the predominant genes. miR = miRNA, lncRNA = long noncoding RNA.
Figure 7.
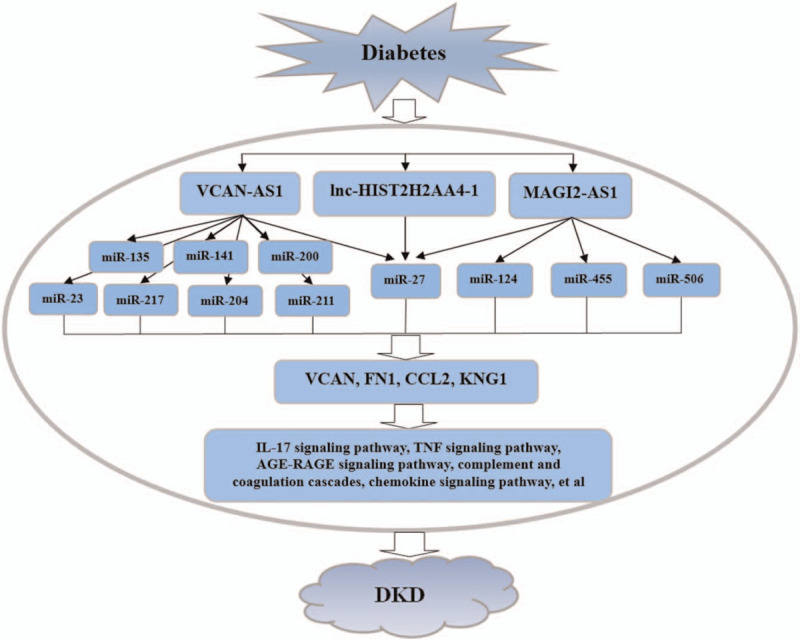
Schematic diagram of the integrated lncRNA-associated ceRNA regulatory networks in DKD. miR = miRNA, ceRNA = competing endogenous RNA.
4. Discussion
At present, DKD has become the major cause of ESRD with high incidence and mortality, seriously affecting the survival quality of patients.[3] Although certain advances associated with the pathological mechanism of DKD have been made to date, our understanding about this complicated disease remains limited, and current treatments are still not completely effective in preventing or delaying progression to ESRD. Urinary microalbumin has been considered to be an early basic diagnostic marker for DKD up to now, yet its sensitivity is still not enough.[25] Therefore, identification of novel potential diagnostic and therapeutic biomarkers with high sensitivity and specificity is of great significance.
In this study, a total of 164 DEGs correlated with DKD were finally filtered and selected from the independent human chip dataset GSE96804 in GEO, and the hub genes were further identified and selected in all comparative conditions, including 3 upregulated genes (FN1, CCL2, and C3) and 7 down regulated genes (ALB, KNG1, EGF, PTGS2, CXCR2, FOS, and CXCR1). Furthermore, the candidate lncRNAs and miRNAs signatures that may regulate the DEGs associated with DKD were finally identified respectively based on the differential expressions, including 6 lncRNAs (lnc-HIST2H2AA4-1, LOC100190986, MAGI2-AS1, BRE-AS1, LOC100505985, and VCAN-AS1) and 18 miRNAs (MIR4521, MIR4256, MIR548AD, MIR548D2, MIR548AI, MIR1254-1, et al), indicating their vital roles in DKD. It is noteworthy that since previous studies have mostly focused on biological function of either a single type of markers or limited number of molecules, but the combined effect of the integrated lncRNA-miRNA-mRNA-signaling pathways should be further emphasized in the pathogenesis of DKD. Strikingly, another important finding in this study is that the lncRNA-associated ceRNA regulatory network related to DKD was constructed, reflecting a comprehensive understanding of molecular interactions in key lncRNA-miRNA-mRNA-signaling pathways involved in DKD. Among which, lnc-HIST2H2AA4-1, VCAN-AS1 and MAGI2-AS1 were identified as the 3 key lncRNAs, suggesting that the above lncRNAs might be potential biomarkers for DKD. On the other hand, VCAN, FN1, CCL2, and KNG1 were identified as the predominant genes in this lncRNA-associated ceRNA network, indicating their pivotal roles in regulation of DKD. What is worth noticing is that consistent with that observed in the training set, 3 of the key genes (VCAN, FN1, and CCL2) also showed significant differences in the 2 validation datasets in both glomeruli and tubules, suggesting the robustness and stability of these differences among datasets and renal tissues. Integrating with the KEGG pathway enrichment results, these key hub genes were mainly enriched in the immune and inflammation-related pathways. Combined with the above, since lncRNA was reported to be a new target for managing inflammation response in some diseases,[26,27] this study once again supported and emphasized that certain specific lncRNA-associated ceRNA regulatory networks were involved in immune and inflammation processes of DKD, which may be expected to provide us promising novel targets for the diagnosis and treatment of DKD.
In terms of the key lncRNAs we identified, VCAN-AS1, located in 5q14.3, has been found to be upregulated in gastric cancer (GC) tissues and cell lines which contributed to the progression of GC via a p53-dependent pathway.[28] Nevertheless, the involvement and underlying biological mechanisms of VCAN-AS1 in DKD remains unclear. Additionally, these lncRNAs are just only the tip of iceberg, and lnc-HIST2H2AA4-1 and MAGI2-AS1 are also two novel lncRNAs that has never been identified and explored before. To our knowledge, this is the first study to identify the above novel lncRNAs and reveal a global view of integrated lncRNA-associated ceRNA regulatory network in DKD based on whole gene transcripts analysis. This study makes a significant contribution to the identification of novel lncRNAs, miRNAs, and their ceRNA regulatory network in DKD and provide novel evidence for the underlying molecular mechanisms of DKD.
On the other hand, 1 limitation existed in the present study was that it lacked further experimental validation of the lncRNA-associated ceRNA regulatory networks to confirm their functional roles in DKD. Along with the progress of genome-sequencing technology, elucidation of the precise molecular mechanisms of their involvement in DKD progression will be performed in our future study.
5. Conclusions
In summary, this study identified and validated key lncRNAs, miRNAs and their targets, and further revealed a global view of lncRNA-associated ceRNA regulatory network involved in DKD by using whole gene transcripts analysis. These findings have significant value for early diagnosis and therapy of DKD and may provide new insights into the pathogenesis of DKD. New scientific discoveries and molecular biological experiments are needed to confirm the function of these novel lncRNAs, miRNAs and their ceRNA regulatory network responsible for DKD and further translate these findings to clinical application.
Acknowledgments
The authors gratefully acknowledge the Scientific Research Project of Hubei Province Health Commission for the funding support (No. WJ2019Q021, No. WJ2018H202).
Author contributions
Conceptualization: Cheng Xu.
Formal analysis: Jie Tan.
Funding acquisition: Ya Wang.
Methodology: Jie Tan, Cheng Xu.
Project administration: Jie Tan, Hongyan Wu.
Software: Youshan Zhang.
Supervision: Ying Xiong, Cunjian Yi.
Validation: Youshan Zhang.
Writing – original draft: Ya Wang.
Writing – review & editing: Ya Wang, Ying Xiong, Cunjian Yi.
Footnotes
Abbreviations: ceRNA = competing endogenous RNA, DEGs = differentially expressed genes, DKD = diabetic kidney disease, lncRNA = long noncoding RNA.
How to cite this article: Wang Y, Tan J, Xu C, Wu H, Zhang Y, Xiong Y, Yi C. Identification and construction of lncRNA-associated ceRNA network in diabetic kidney disease. Medicine. 2021;100:22(e26062).
YW and JT contributed equally to this paper.
This study is supported by the Scientific Research Project of Hubei Province Health Commission, China (No. WJ2019Q021, No. WJ2018H202).
The authors have no conflicts of interests to disclose.
The datasets generated during and/or analyzed during the current study are publicly available.
DEGs = differentially expressed genes, KEGG = Kyoto Encyclopedia of Genes and Genomes.
DKD = diabetic kidney disease.
lncRNA = long noncoding RNAs, miRNAs = microRNAs, DKD = diabetic kidney disease.
References
- [1].Umanath K, Lewis JB. Update on diabetic nephropathy: core Curriculum 2018. Am J Kidney Dis 2018;71:884–95. [DOI] [PubMed] [Google Scholar]
- [2].Alicic RZ, Rooney MT, Tuttle KR. Diabetic kidney disease: challenges, progress, and possibilities. Clin J Am Soc Nephrol 2017;12:2032–45. [DOI] [PMC free article] [PubMed] [Google Scholar]
- [3].Fu H, Liu S, Bastacky SI, Wang X, Tian XJ, Zhou D. Diabetic kidney diseases revisited: a new perspective for a new era. Mol Metab 2019;30:250–63. [DOI] [PMC free article] [PubMed] [Google Scholar]
- [4].Dewanjee S, Bhattacharjee N. MicroRNA: a new generation therapeutic target in diabetic nephropathy. Biochem Pharmacol 2018;155:32–47. [DOI] [PubMed] [Google Scholar]
- [5].Sankrityayan H, Kulkarni YA, Gaikwad AB. Diabetic nephropathy: the regulatory interplay between epigenetics and microRNAs. Pharmacol Res 2019;141:574–85. [DOI] [PubMed] [Google Scholar]
- [6].Simpson K, Wonnacott A, Fraser DJ, Bowen T. MicroRNAs in diabetic nephropathy: from biomarkers to therapy. Curr Diab Rep 2016;16:35. [DOI] [PMC free article] [PubMed] [Google Scholar]
- [7].Lu TX, Rothenberg ME. MicroRNA. J Allergy Clin Immunol 2018;141:1202–7. [DOI] [PMC free article] [PubMed] [Google Scholar]
- [8].Lv W, Fan F, Wang Y, et al. Therapeutic potential of microRNAs for the treatment of renal fibrosis and CKD. Physiol Genomics 2018;50:20–34. [DOI] [PMC free article] [PubMed] [Google Scholar]
- [9].Shaffi SK, Galas D, Etheridge A, Argyropoulos C. Role of MicroRNAs in renal parenchymal diseases-a new dimension. Int J Mol Sci 2018;19:1797. [DOI] [PMC free article] [PubMed] [Google Scholar]
- [10].Assmann TS, Recamonde-Mendoza M, de Souza BM, Bauer AC, Crispim D. MicroRNAs and diabetic kidney disease: systematic review and bioinformatic analysis. Mol Cell Endocrinol 2018;477:90–102. [DOI] [PubMed] [Google Scholar]
- [11].Wang Y, Le Y, Xue JY, et al. Let-7d miRNA prevents TGF-(1-induced EMT and renal fibrogenesis through regulation of HMGA2 expression. Biochem Biophys Res Commun 2016;479:676–82. [DOI] [PubMed] [Google Scholar]
- [12].Han F, Wang S, Chang Y, et al. Triptolide prevents extracellular matrix accumulation in experimental diabetic kidney disease by targeting microRNA-137/Notch1 pathway. J Cell Physiol 2018;233:2225–37. [DOI] [PubMed] [Google Scholar]
- [13].Jia Guo, Zhangsuo Liu, Rujun Gong. Long noncoding RNA: an Emerging Player in Diabetes and Diabetic Kidney Disease. Clin Sci (Lond) 2019;133:1321–39. [DOI] [PubMed] [Google Scholar]
- [14].Wang YZ, Zhu DY, Xie XM, et al. EA15, MIR22, LINC00472 as diagnostic markers for diabetic kidney disease. J Cell Physiol 2019;234:8797–803. [DOI] [PubMed] [Google Scholar]
- [15].Majumder S, Hadden MJ, Thieme K, et al. Dysregulated expression but redundant function of the long non-coding RNA HOTAIR in diabetic kidney disease. Diabetologia 2019;62:2129–42. [DOI] [PubMed] [Google Scholar]
- [16].Liye Wang, Kwang Bog Cho, Yan Li, et al. Long noncoding RNA (lncRNA)-mediated competing endogenous RNA networks provide novel potential biomarkers and therapeutic targetsfor colorectal cancer. Int J Mol Sci 2019;20:5758. [DOI] [PMC free article] [PubMed] [Google Scholar]
- [17].Jing Zhao, Li Li, ZhongYing Han, et al. Long noncoding RNAs, emerging and versatile regulators of tumor-induced angiogenesis. Am J Cancer Res 2019;9:1367–81. [PMC free article] [PubMed] [Google Scholar]
- [18].Pan Y, Jiang S, Hou Q, et al. Dissection of glomerular transcriptional profile in patients with diabetic nephropathy: SRGAP2a protects podocyte structure and function. Diabetes 2018;67:717–30. [DOI] [PubMed] [Google Scholar]
- [19].Grayson PC, Eddy S, Taroni JN, et al. Metabolic pathways and immunometabolism in rare kidney diseases. Ann Rheum Dis 2018;77:1226–33. [DOI] [PMC free article] [PubMed] [Google Scholar]
- [20].Woroniecka KI, Park AS, Mohtat D, et al. Transcriptome analysis of human diabetic kidney disease. Diabetes 2011;60:2354–69. [DOI] [PMC free article] [PubMed] [Google Scholar]
- [21].Ritchie ME, Phipson B, Wu D, et al. limma powers differential expression analyses for RNA-sequencing and microarray studies. Nucleic Acids Res 2015;43:47. [DOI] [PMC free article] [PubMed] [Google Scholar]
- [22].Szklarczyk D, Gable AL, Lyon D, et al. STRING v11: protein-protein association networks with increased coverage, supporting functional discovery in genome-wide experimental datasets. Nucleic Acids Res 2019;47:607–13. [DOI] [PMC free article] [PubMed] [Google Scholar]
- [23].Huang da W, Sherman BT, Lempicki RA. Bioinformatics enrichment tools: paths toward the comprehensive functional analysis of large gene lists. Nucleic Acids Res 2009;37:01–13. [DOI] [PMC free article] [PubMed] [Google Scholar]
- [24].Yu G, Wang LG, Han Y, He QY. clusterProfiler: an R package for comparing biological themes among gene clusters. OMICS 2012;16:284–7. [DOI] [PMC free article] [PubMed] [Google Scholar]
- [25].Colhoun HM, Marcovecchio ML. Biomarkers of diabetic kidney disease. Diabetologia 2018;61:996–1011. [DOI] [PMC free article] [PubMed] [Google Scholar]
- [26].Mathy NW, Chen XM. Long non-coding RNAs (lncRNAs) and their transcriptional control of inflammatory responses. J Biol Chem 2017;292:12375–82. [DOI] [PMC free article] [PubMed] [Google Scholar]
- [27].Meng Du, Lin Yuan, Xin Tan, et al. The LPS-inducible lncRNA Mirt2 is a negative regulator of inflammation. Nat Commun 2017;8:2049. [DOI] [PMC free article] [PubMed] [Google Scholar]
- [28].Li Feng, Jian Li, Fan Li, et al. Long noncoding RNA VCAN-AS1 contributes to the progression of gastric cancer via regulating p53 expression. J Cell Physiol 2020;235:4388–98. [DOI] [PubMed] [Google Scholar]


