

Abstract
Purpose
Forkhead box protein O1 (FOXO1) and paired box gene 3 (PAX3) have been reported to play an imported role in human cancers, but their role in cervical cancer has not yet been clarified. In this study, we evaluated the functional role of FOXO1 in cervical cancer cells and investigated the expression and clinical significance of FOXO1 and PAX3 in cervical lesions.
Methods
In vitro assessment of cell function by cell viability, migration, and invasion assays were performed on FOXO1-knockdown cervical cancer cells. Immunohistochemical (IHC) staining analyses of FOXO1 and PAX3 were performed with a tissue microarray (TMA). The clinical significance was evaluated by comparing the data with various clinicopathologic characteristics, including survival of patients with cervical cancer.
Results
In vitro results revealed that knockdown of FOXO1 is associated with decreased cell viability (p < 0.001), migration (p < 0.001), and invasion (p < 0.05), supporting the oncogenic role of FOXO1 in cervical cancer. FOXO1 and PAX3 expression was significantly higher in CIN (both p < 0.001) and cancer tissue (both p < 0.001) than in normal tissue. Multivariate analysis indicated that FOXO1 expression (hazard ratio 4.01 [95% CI 1.22–13.10], p = 0.021) and an advanced FIGO stage (hazard ratio 3.89 [95% CI 1.35–11.19], p = 0.012) were independent prognostic factors for overall survival.
Conclusions
This study reveals increased FOXO1 and PAX3 expression in cervical cancers and indicates an oncogenic role of FOXO1 in cervical cancer cells that correlates with poor patient survival.
Keywords: Cervical cancer, FOXO1, PAX3, Biomarker, Prognosis, Tissue microarray
Introduction
Cervical cancer is the second most common tumor in developing countries and the fourth most common malignant tumor affecting women worldwide, causing an estimated 265,700 deaths annually [1]. Persistent high-risk human papillomavirus (HPV) infection plays a key role in cervical carcinogenesis and effective cancer screening with prevention strategies including HPV immunization has shown to decrease the cancer rate. On the other hand, considering the treatment options for cervical cancer, although satisfied survival rate can be achieved form radical surgery and concurrent chemoradiation treatment for early-stage cervical cancer, there lack effective strategies for treating locoregionally advanced disease and warrant further development [2]. Currently, the clinicoprognostic parameters that are integrated into clinical practice are limited for cervical cancer. Advanced International Federation of Obstetrics and Gynecology (FIGO) stage, large tumor size, lymph-node metastasis, deep cervical stromal invasion, and lymphovascular space invasion are the parameters that are used to predict poor prognosis and in spite of these well-established prognostic factors, the relapse rates for advanced stage cervical cancers are high, with insufficient treatment strategies against recurrent disease. Thus, the necessity to identify novel biomarkers that can contribute to predict prognosis and develop effective treatment strategies against recurrence is crucial [3, 4].
FOXO1 (forkhead box protein O1) belongs to the forkhead family of transcription factors involving in various intracellular signaling pathways, glucose metabolism, apoptosis, cell-cycle arrest, DNA damage repair, and resistance to oxidative stress [5–7]. FOXO1 is often considered as a tumor suppressor, but the role of this gene in cervical cancer is controversial [8–10]. PAX3 (Paired box gene 3) is a member of the paired box family of transcriptional factors and is critical to the formation of tissues and organs during embryonic development. Overexpression of PAX3 protein was reported for glioblastomas, neuroblastomas, rhabdomyosarcomas, Ewing sarcomas, melanomas, and gastric cancers, suggesting its oncogenic potential. In thyroid cancer, however, PAX3 was found to be a tumor suppressor [11–13]. The role of PAX3 in cervical cancer is still unclear.
In the present study, we evaluated the functional role of FOXO1 in cervical cancer cells. The expression levels of FOXO1 and PAX3 were subsequently measured using a tissue microarray (TMA) with immunohistochemical staining. Furthermore, we evaluated clinical significance of increased FOXO1 and PAX3 expression by correlating it with various clinicopathologic characteristics.
Materials and methods
Patient tumor samples and medical record data
Primary tumor specimens were obtained from 209 cervical cancer and 496 cervical intraepithelial neoplasia (CIN) patients undergoing primary surgery at Gangnam Severance Hospital, Yonsei University College of Medicine between 1996 and 2010. All tumor tissues were histologically revised, and only specimens with a sufficient presence of tumor cells were included in the TMA construction. Staging was performed according to the FIGO staging system. Primary treatment of cervical cancer consisted of type 3 radical hysterectomy with pelvic lymph-node dissection. In case of increased risk of relapse, such as positive resection margins, positive lymph nodes, or parametrial invasion, platinum-based concurrent chemoradiation was added. Data including age, stage, treatment response, and survival status were obtained from medical records. Therapeutic response was assessed according to the Response Evaluation Criteria in Solid Tumors (RECIST; version 1.1), either by magnetic resonance imaging or computed tomography [14]. Data on cell type, tumor size, tumor grade, and lymph-node metastases were reviewed from pathology reports. This study was approved by the Institutional Review Boards (IRBs) of Gangnam Severance Hospital.
Cell lines
The human cervical cancer cell line CaSki and non-tumorigenic human embryonic kidney 293 (HEK 293) cells were obtained from the American Type Culture Collection (ATCC, Manassas, VA, USA). Cervical cancer cell line SUN-17 was obtained from the Korean Cell Line Bank (KCLB, Seoul, Korea). The CaSki and SNU-17 cells were grown in Roswell Park Memorial Institute (RPMI) medium supplemented with 10% fetal bovine serum, 1% penicillin, and 1% streptomycin, and cultured at 37 °C in an atmosphere containing 5% CO2.
Real-time PCR
Gene expression levels of FOXO1 were analyzed using real-time PCR (RT-quantitative PCR). Briefly, total RNA was extracted from HEK 293, CaSki, and SNU-17 cells using TRIzol reagent (Thermo Fisher Scientific, Waltham, MA, USA), and then, cDNA was synthesized using Moloney Murine Leukemia Virus (M-MuLV) reverse transcriptase (Thermo Fisher Scientific). Real-time PCR reactions were performed using 7300 real-time PCR systems (Applied Biosystems, Foster City, CA, USA) with TOPreal™ qPCR 2 × PreMIX (Enzynomics, Daejeon, Korea). All experiments were performed in duplicate, and relative changes in gene expression were calculated by the 2−ΔΔCT method using glyceraldehyde-3-phosphate dehydrogenase (GAPDH) as an internal control [15]. The primer sequences for FOXO1 and GAPDH were as follows: FOXO1 forward 5′-CCGAGC TGCCAAGAAGAAAG-3′, FOXO1 reverse 5′-ATGCAC ATCCCCTTCTCCAA-3′ and GAPDH forward 5′-ATCACT GCCACCC AGAAGACT-3′, GAPDH reverse 5′-CATGCC AGTGAGCTTCCCGTT-3′.
siRNA constructs
FOXO1-knockdown cells were generated using small interfering RNAs (siRNAs). Synthetic siRNAs specific for FOXO1 were purchased from Bioneer (Bioneer, Daejeon, Korea) and their target sequences were as follows: FOXO1–1 5′-GU CCA AGA CAU AGC UGG UU-3′ (sense) 5′-AA CCA GCU AUG UCU UGG ACC-3′ (antisense), FOXO1–2 5′-GA GGG UUA GUG AGC AGG UU-3′ (sense), and 5′-AA CCU GCU CAC UAA CCC UC-3′ (antisense). For in vitro delivery, cancer cells on a 6-well plate were transfected with 100 pmol of the synthesized siRNAs using the Lipofectamine™ RNAiMAX reagent (Invitrogen, Carlsbad, CA, USA), according to the manufacturer’s instructions. The siRNA-treated cells were collected 48 h after transfection for western blot analysis, cell viability assay, cell migration/ invasion assay, and colony formation assay.
Immunoblotting
Total cell lysates were isolated using a cell lysis buffer (50 mM Tris pH 7.4, 150 mM NaCl, 0.5% Triton X-100, and 1 mM EDTA) supplemented with protein inhibitors (Roche, Nutley, NJ, USA). The lysates were then centrifuged at 13,500g for 30 min, and 30 μg of each protein extract was separated using sodium dodecyl sulfate polyacrylamide gel electrophoresis (SDS-PAGE). Protein concentration was determined using a bicinchoninic acid (BCA) kit (Sigma-Aldrich, St. Louis, MO, USA) according to the manufacturer’s protocol. Immunoblotting analysis was performed using anti-α-tubulin (Santa Cruz Biotechnology, Santa Cruz, CA, USA, Cat.# sc-5286) and anti-FOXO1 (Santa Cruz Biotechnology, Cat. # sc-374427) primary antibodies and a horseradish peroxidase (HRP)-conjugated secondary antibody. Protein bands were detected using a luminol reagent (Santa Cruz Biotechnology).
Cell viability assay
Cell viability was evaluated using an EZ-Cytox cell viability assay kit (DoGenBio, Seoul, Korea), according to the manufacturer’s protocol. In brief, control and siRNA-transfected cells were seeded in 96-well plates at a density of 1 × 10⁴ cells per well with 100 μL of complete medium. After cultivation for a given period, 10 μL of the EZ-CYTOX reagent (DoGenBio) was added and the plates were incubated at 37 °C for 60 min. Cell growth was analyzed on days 0, 2, and 4, by measuring absorbance at 450 nm using a VERSA max™ microplate reader (Molecular Devices, Sunnyvale, CA, USA).
Colony formation assay
Cells were seeded in a 12-well dish (125 cells/well) and cultured in the RPMI medium for 2 weeks to allow colonies to develop. The cells were then fixed with 3.7% paraformaldehyde with sucrose, stained with 0.5% crystal violet for 30 min, and washed with distilled water to remove excess stain. The absorbance of the crystal violet cell extract was measured at 595 nm using the VERSA max™ microplate reader (Molecular Devices).
Migration and invasion assay
Cell migration and invasion were measured using a Boyden chamber assay in a 48-well Micro Chemotaxis Chamber (Neuro Probe, Inc., Gaithersburg, MD, USA). Briefly, control or siRNA-transfected cells were seeded in 48-well plates at a density of 1 × 10⁵ cells per well, with the upper chamber composed of 8 μm pore-size polycarbonate membrane filters (Neuro Probe, Inc.). Migration assay was conducted without a Matrigel-coated membrane, and the lower chamber was filled with 27 μL RPMI supplemented with 10% FBS as a chemoattractant. The chambers were incubated at 37 °C for 48 h and non-migrating cells in the upper chamber were wiped away using a cotton-tipped swab, while invading cells were fixed and stained with a Diff-Quik kit (Sysmex, Kobe, Japan). For the invasion assay, the same procedure was carried out using the polycarbonate membrane coated with Matrigel (BD Biosciences, San Jose, CA, USA); invaded cells on the underside of the membrane were fixed, stained, and counted in five random fields under a light microscope (× 200).
Tissue microarray construction
TMAs were constructed from 824 formalin-fixed, paraffin-embedded tissue specimens, including 328 nonadjacent normal epithelial tissues. Some of the paraffin blocks were provided by the Korea Gynecologic Cancer Bank through the Bio & Medical Technology Development Program of the Ministry of the National Research Foundation (NRF) funded by the Korean government (MSIT) (NRF-2017M3A9B8069610). Briefly, to define representative tumor areas, an institutional pathologist reviewed the hematoxylin and eosin (H&E)-stained whole-mount sections to define representative tumor areas. Furtherly, after retrieval of four 1.0 mm-diameter tissue cores from the formalin-fixed paraffin-embedded tissue blocks of which consisted matched tumor specimens and normal epithelial tissues, they were arrayed on a 38 × 25 mm recipient paraffin block using an MTA-1 manual tissue arrayer (Beecher Instruments Inc., Silver Spring, MD, USA). 5 µm sections were cut on a microtome and placed on glass slides. The presence of tumor tissue on the sections was verified by H&E staining.
Immunohistochemistry
The TMA sections were deparaffinized and rehydrated using xylene and ethanol solutions of descending alcohol gradient. All slides were quenched for 10 min in 3% H2O2 to block the endogenous peroxidase. Heat-induced antigen retrieval was performed in an antigen retrieval buffer of pH 9 (Dako, Carpinteria, CA, USA) for FOXO1 and pH 6 (Dako) for PAX3, in a steam pressure cooker for 10 min (Pascal, Dako). The slides were then stained with an anti-FOXO1 antibody (Abcam, Cambridge, MA, USA; rabbit antibody, clone# EP927Y, 1:400) and an anti-PAX3 antibody (Abcam, rabbit polyclonal antibody, Cat.# Ab216683, 1:200) for 1 h at room temperature in a Dako Autostainer Plus slide stainer (Dako). The antigen–antibody reaction was detected with the Dako EnVision + Dual Link System-HRP (Dako) and DAB+ (3,3′-diaminobenzidine; Dako).
Evaluation of IHC staining
The stained TMA sections were digitized using a high-resolution NanoZoomer 2.0 HT optical scanner (Hamamatsu Photonics K.K., Japan). Digital analysis of the stained sections was performed using the Visiopharm Integrator System v6.5.0.2303 software (VIS; Visiopharm, Hørsholm, Denmark). After training the system by digitally “painting” nuclei in the images, an algorithm for nuclei-specific signal selection was manually designed. The cytoplasm was further defined by outlining the defined nucleus. The DAB intensity of each defined image was used for quantification, and was categorized as follows: 0 = negative, 1 = weak, 2 = moderate, and 3 = strong. An overall immunostaining score was calculated by multiplying the staining intensity and percentage of positive cells (possible range 0–300), and the optimal cut-off values of histoscores were determined by considering the distribution and prognostic significance of the values.
Statistical analysis
Statistical analyses of FOXO1 and PAX3 expression were performed using the Mann–Whitney test or the Kruskal–Wallis test, when appropriate. Kaplan–Meier method was used to calculate the total and disease-free survival curves and further survival analysis was performed using the log-rank test. The Cox proportional hazard model was used to estimate hazard ratios and confidence intervals in both univariate and multivariate models. Statistical analyses were performed using SPSS version 23.0 (SPSS Inc., Chicago, IL, USA). p < 0.05 was considered statistically significant.
Results
FOXO1 gene expression is elevated in cervical cancer cell lines
The relative expression of FOXO1 mRNA was elevated in cervical cancer cell lines in real-time PCR. The average 2−ΔΔCT values were 1048.63 ± 0.19 (standard error) for CaSki cells and 1580.86 ± 0.25 for SNU-17 cells, compared to the non-tumorigenic HEK 293 cell reference (Fig. 1a).
Fig. 1.
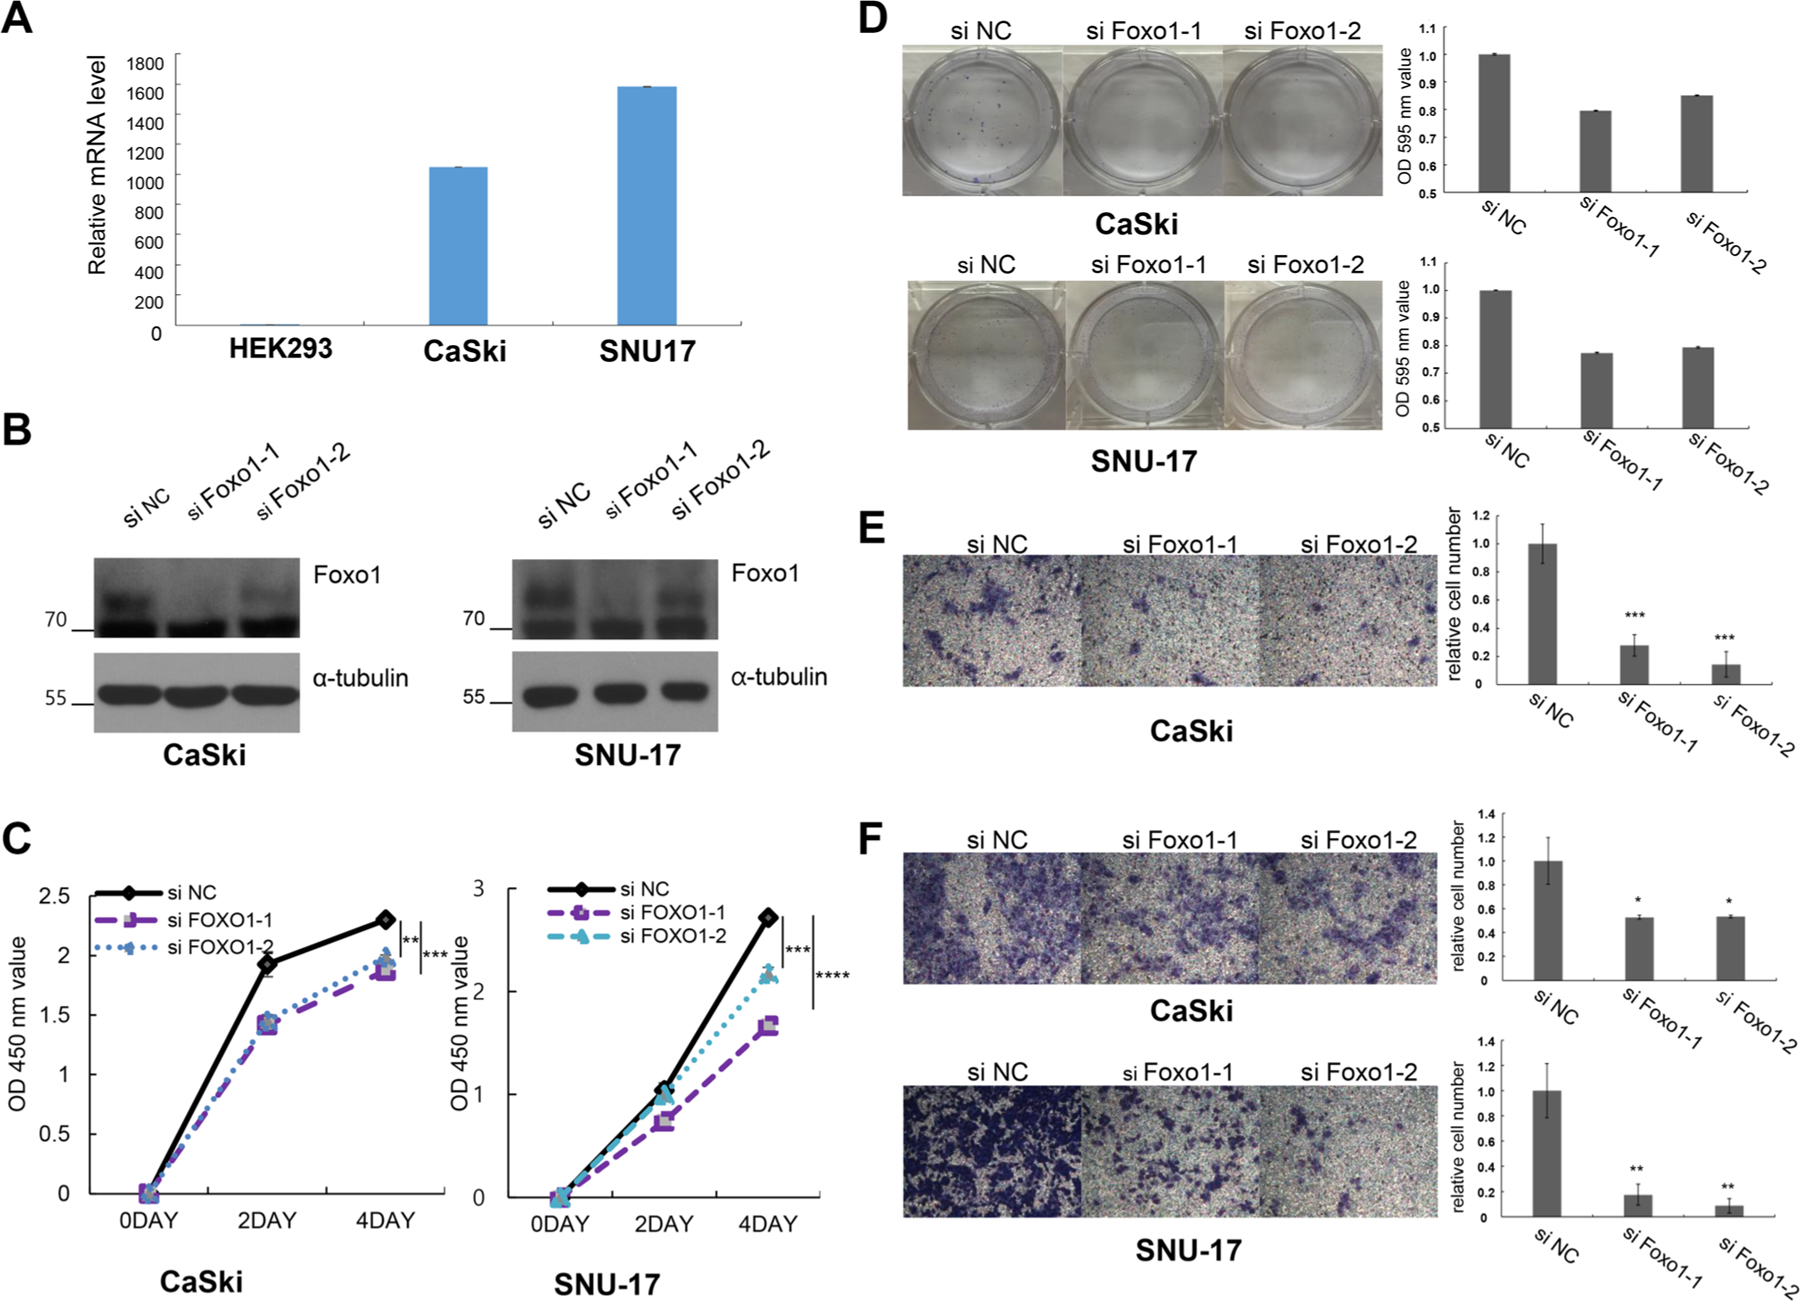
FOXO1 expression is elevated in cervical cancer cells, and knockdown of FOXO1 elicits decreased cell viability, migration, and invasion. a Expression of FOXO1 mRNA was higher in CaSki and SNU-17 cells than in HEK 293 cells according to real-time PCR. b Western blot analysis of FOXO1 knockdown by siRNA (siFOXO1) in CaSki and SNU-17 cells reveals decreased protein expression compared to the negative control group (siNC). α-Tubulin served as an internal loading control. c Cell viability curves for siFOXO1 in CaSki and SNU-17 cells at various indicated time points. Knockdown of FOXO1 results in decrease of cell viability. d Colony-forming assay for siFOXO1 in CaSki and SNU-17 cells. Left panel shows representative images, and right panel shows quantification of colonies. Cell migration analyses of siFOXO1 in CaSki cells (e) and cell invasion assay of siFOXO1 in CaSki (f: upper) and SNU-17 (f: lower) cells. Left panel: representative images of migration and invasion assays. Right panel: quantitative results of migration and invasion experiments. Cell migration and invasion analyzed by chamber assay shows that FOXO1 knockdown (siFOXO1) results in decreased migration (e) and invasion (f), compared to the negative control group (siNC). The number of asterisks (*) indicates the level of significance: *p < 0.05; **p < 0.005; ***p < 0.001; ****p < 0.0001. Bars represent mean ± SE
FOXO1 repression reveals decreased cell viability, colony formation, migration, and invasion
Knockdown experiments performed on the CaSki and SNU-17 cells revealed decreased protein levels of FOXO1 in the FOXO1 siRNA-treated groups compared with the negative control group (siNC) (Fig. 1b). siRNA FOXO1-treatment also reduced cell growth rates for both cell lines compared with siNC (both p < 0.001) (Fig. 1c), and similar results were also observed in colony formation assays (Fig. 1d). In the Boyden chamber assay, which was conducted to investigate the role of FOXO1 in migration and invasion, knockdown of FOXO1 expression resulted in decreased motility of CaSki cells in the migration assay (p < 0.001) (Fig. 1e). Cell invasion analysis also revealed that the relative cell number in the FOXO1-transfected groups was significantly lower than in the control group (siNC), both for CaSki (p < 0.05) and SNU-17 cells (p < 0.005) (Fig. 1f). Overall, these results suggest that FOXO1 has an oncogenic role in cervical cancer.
FOXO1 and PAX3 expression is elevated in CIN and cervical cancer
Since automated digital image analysis can provide more reproducible and objective measurements, digital analysis of IHC staining was performed on cervical neoplasia and cancer specimens to determine whether FOXO1 and PAX3 expression is linked to various clinicopathologic features. The TMA contained 824 cervical neoplasias or normal epithelial tissues, but due to the complexity of the sectioning and staining, as well as the heterogeneity of the samples, 429 FOXO1 samples and 562 PAX3 samples were evaluated. The scoring results from the IHC analyses are summarized in Table 1 and representative IHC expression of FOXO1 and PAX3 is shown in Fig. 2a. The scoring results from IHC analysis revealed that FOXO1 and PAX3 expression was higher in CIN (both p < 0.001) and cancer tissues (both p < 0.001) than in normal cervical epithelial tissues (Fig. 2b). Although FOXO1 and PAX3 expression was higher in cervical cancer than in low-grade CIN (p = 0.046, p = 0.024), neither FOXO1 nor PAX3 expression levels differed significantly between low-grade and high-grade CIN (p = 0.526 and p = 0.974 respectively, data not shown). Furthermore, Spearman’s rank correlation analysis revealed that FOXO1 expression shows significant correlation with PAX3 expression in cervical cancer (Spearman’s ρ = 0.377, p < 0.001) (Fig. 3), but not in low-grade CIN or high-grade CIN (p = 0.302 and p = 0.730 respectively, data not shown). Among cervical cancers, IHC analysis reveals that FOXO1 expression was significantly correlated with an advanced FIGO stage (p = 0.032) and squamous cell carcinoma-type cervical cancer (p = 0.032). For the treatment response, FOXO1 expression revealed a trend of positive correlation with cervical cancer resistance to chemoradiation therapy (p = 0.056) (Table 1).
Table 1.
Expression of FOXO1 and PAX3 in relation to clinicopathologic characteristics in IHC analysis
| No | FOXO1 |
No | PAX3 |
|||
|---|---|---|---|---|---|---|
| Mean score [95% CI] | p value | Mean score [95% CI] | p value | |||
| All study subjects | 489 | 231.9 [227.7–236.1] | 562 | 218.2 [214.4–222.0] | ||
| Diagnostic category | ||||||
| Normal | 161 | 201.8 [195.6–208.1] | < 0.001 | 212 | 194.6 [189.1–200.2] | < 0.001 |
| Low-grade CIN | 48 | 233.7 [220.8–246.7] | 57 | 223.4 [215.7–231.2] | ||
| High-grade CIN | 139 | 244.1 [238.1–250.2] | 159 | 227.3 [219.9–234.7] | ||
| Cancer | 141 | 253.5 [245.7–261.2] | 134 | 242.5 [235.4–249.5] | ||
| FIGO stage | 0.032 | 0.988 | ||||
| I | 95 | 247.6 [237.2–258.0] | 86 | 242.5 [234.3–250.7] | ||
| II–IV | 46 | 265.5 [255.6–275.4] | 48 | 242.4 [228.9–255.9] | ||
| Tumor grade | 0.680 | 0.137 | ||||
| Well/moderate | 92 | 252.0 [242.1–261.9] | 84 | 237.2 [227.9–246.6] | ||
| Poor | 45 | 255.6 [241.7–269.5] | 46 | 248.5 [237.4–259.6] | ||
| Cell type | < 0.001 | 0.156 | ||||
| SCC | 119 | 259.5 [252.2–266.8] | 113 | 244.6 [237.0–252.3] | ||
| Others | 22 | 220.8 [192.4–249.1] | 21 | 230.7 [211.6–249.9] | ||
| Tumor size | 0.513 | 0.601 | ||||
| ≤ 4 cm | 91 | 251.6 [242.7–260.5] | 84 | 243.9 [235.2–252.6] | ||
| > 4 cm | 50 | 257.0 [241.8–272.1] | 50 | 240.0 [227.7–252.4] | ||
| LN metastasis | 0.90 | 0.162 | ||||
| No | 84 | 252.4 [241.6–263.1] | 78 | 241.2 [232.4–249.9] | ||
| Yes | 27 | 251.1 [234.5–267.8] | 26 | 228.8 [213.0–244.5] | ||
| Chemoradiation response | 0.056 | 0.117 | ||||
| Good | 42 | 247.3 [230.5–264.1] | 41 | 230.7 [217.2–244.2] | ||
| Bad | 19 | 272.7 [260.5–284.9] | 19 | 249.0 [230.4–267.6] | ||
| SCC antigen | 0.605 | 0.396 | ||||
| Negative | 68 | 262.0 [253.8–270.3] | 63 | 248.7 [239.6–257.9] | ||
| Positive | 40 | 257.8 [241.8–273.9] | 41 | 241.7 [226.9–256.5] | ||
| HPV test in CIN | 0.181 | 0.220 | ||||
| Negative | 16 | 251.6 [234.1–269.1] | 20 | 219.6 [199.6–239.6] | ||
| Positive | 127 | 237.2 [229.9–244.4] | 149 | 231.3 [224.9–237.6] | ||
Protein expression was determined by analyzing an immunohistochemically stained tissue array, as described in the materials and methods section
SCC, squamous cell carcinoma; FIGO, International Federation of Gynecology and Obstetrics; LN metastasis, lymph-node metastasis
Fig. 2.
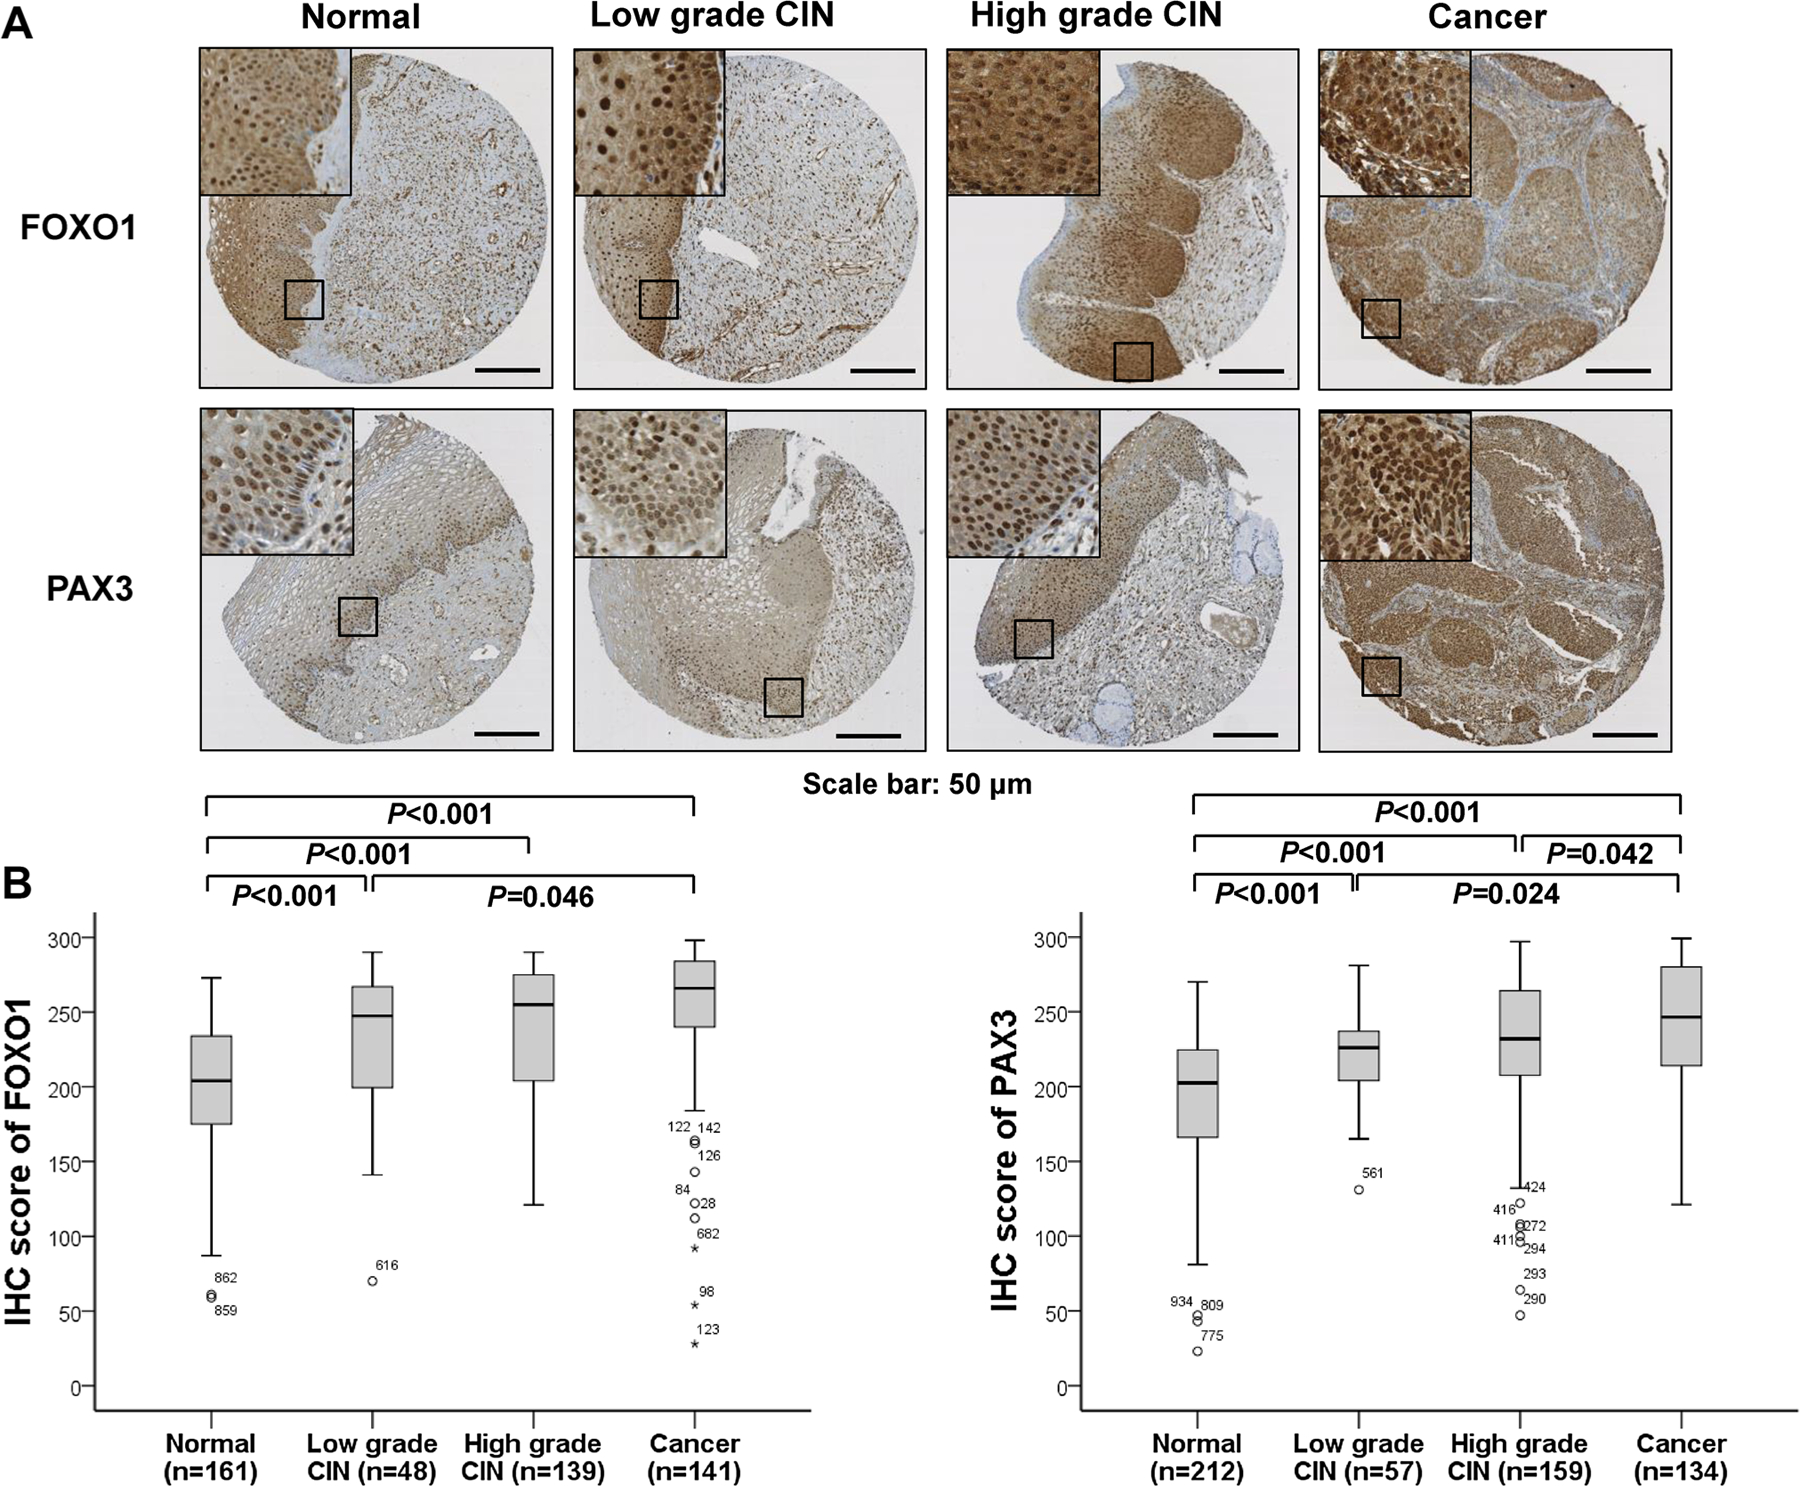
Immunohistochemical staining of FOXO1 and PAX3 in cervical neoplasia samples. a Representative staining images of FOXO1 and PAX3 in normal, low-grade CIN, high-grade CIN, and cervical cancer tissues. Bars: 50 µm. b IHC staining scores of FOXO1 and PAX3 were significantly higher in CIN and cervical cancers than in normal cervical epithelial samples (all p < 0.001)
Fig. 3.
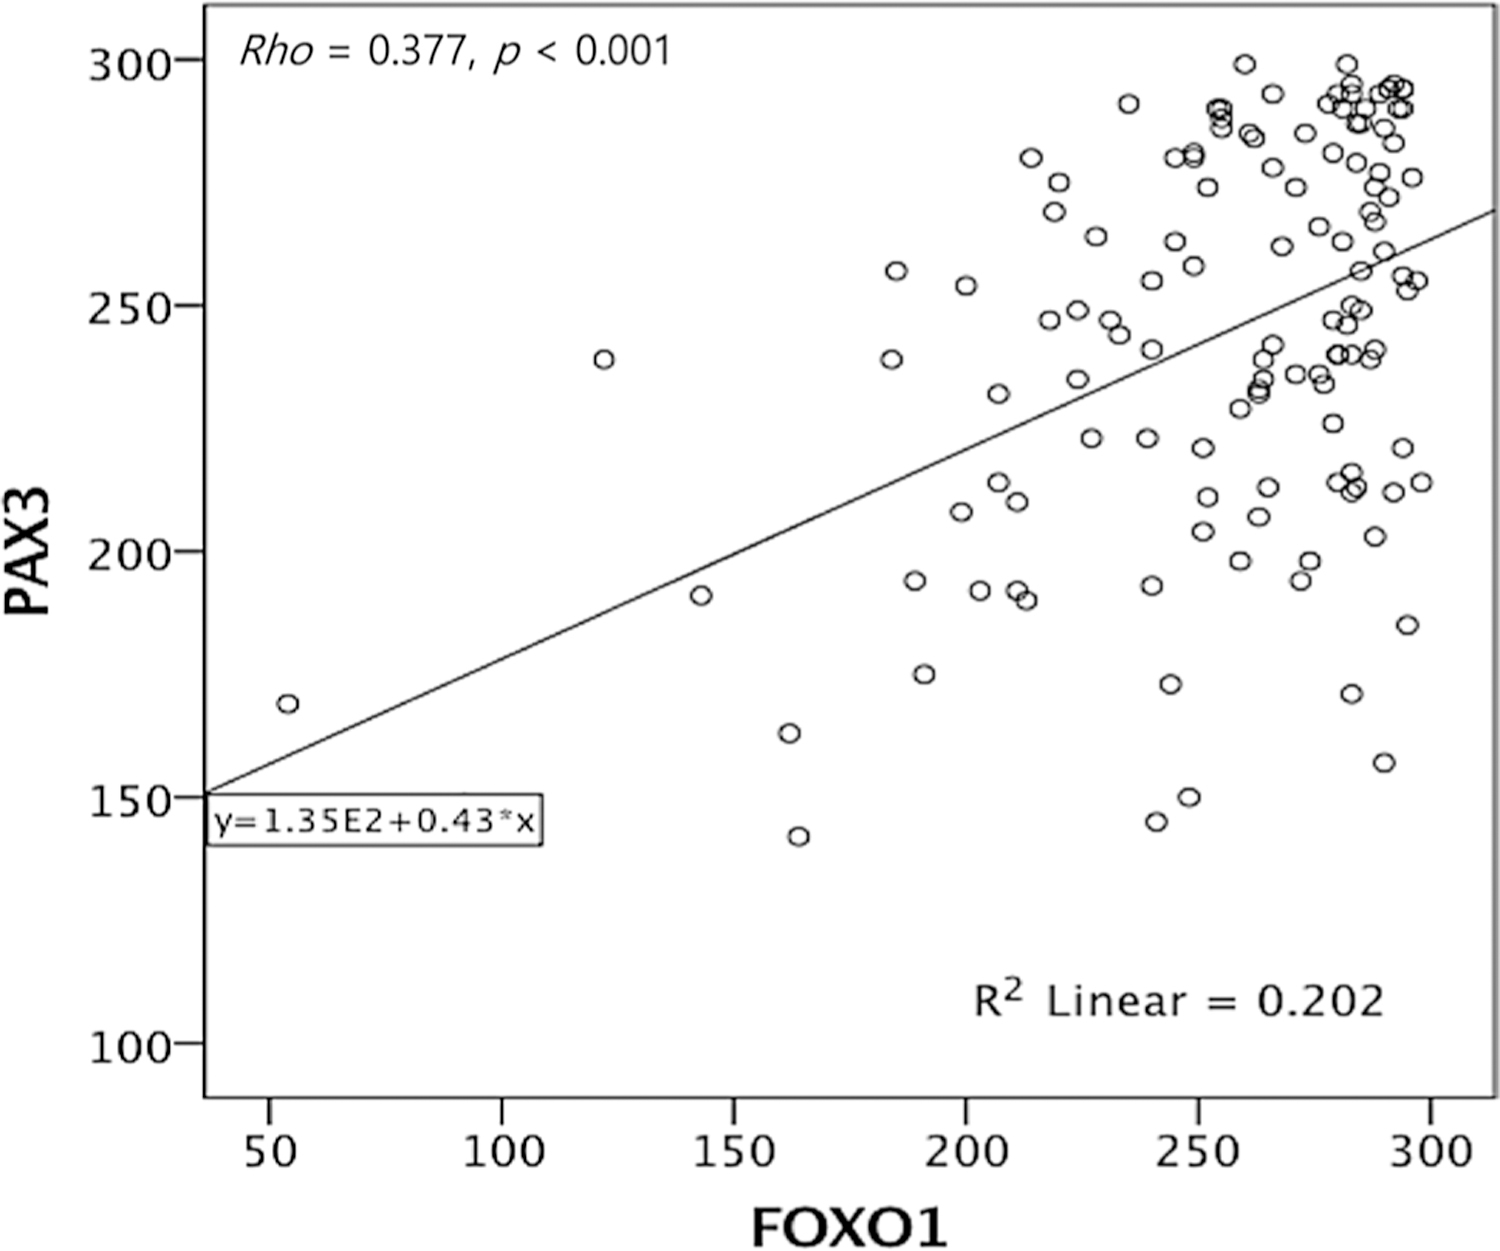
Spearman’s rank correlation analysis of FOXO1 and PAX3 expression. FOXO1 expression shows significant correlation with PAX3 expression in cervical cancer (Spearman’s ρ = 0.377, p < 0.001)
High FOXO1 and PAX3 expression correlates with poor prognosis in cervical cancer
To investigate the relationship between FOXO1 and PAX3 expression and the prognostic significance of survival in cervical cancer, the prognostic value of FOXO1 and PAX3 expression on overall and disease-free survival was analyzed. Kaplan–Meier plots demonstrated that patients with high FOXO1 expression (cut-off value: 278) or high PAX3 expression (cut-off value: 239) experienced significantly shorter disease-free survival (log-rank p = 0.002, p = 0.001 respectively) (Fig. 4a). When analyzed for overall survival, patients with high FOXO1 (log-rank p = 0.001) expression showed significant survival disadvantages, whereas patients with high PAX3 (log-rank p = 0.207) showed a trend toward poor survival (Fig. 4b). Furthermore, survival of patients with dual expression of FOXO1 and PAX3 revealed a significant difference on both disease-free (p < 0.005, Fig. 4a) and overall survival (p = 0.023, Fig. 4b) compared with those of dual negative patients. Cox multivariate proportional hazard analysis indicated that the cancer stage above FIGO IIB (hazard ratio 3.89 [95% CI, 1.35–11.19], p = 0.012) and high expression of FOXO1 (hazard ratio 4.01 [95% CI, 1.22–13.10], p = 0.021) are independent prognostic factors for poor overall survival (Table 2).
Fig. 4.
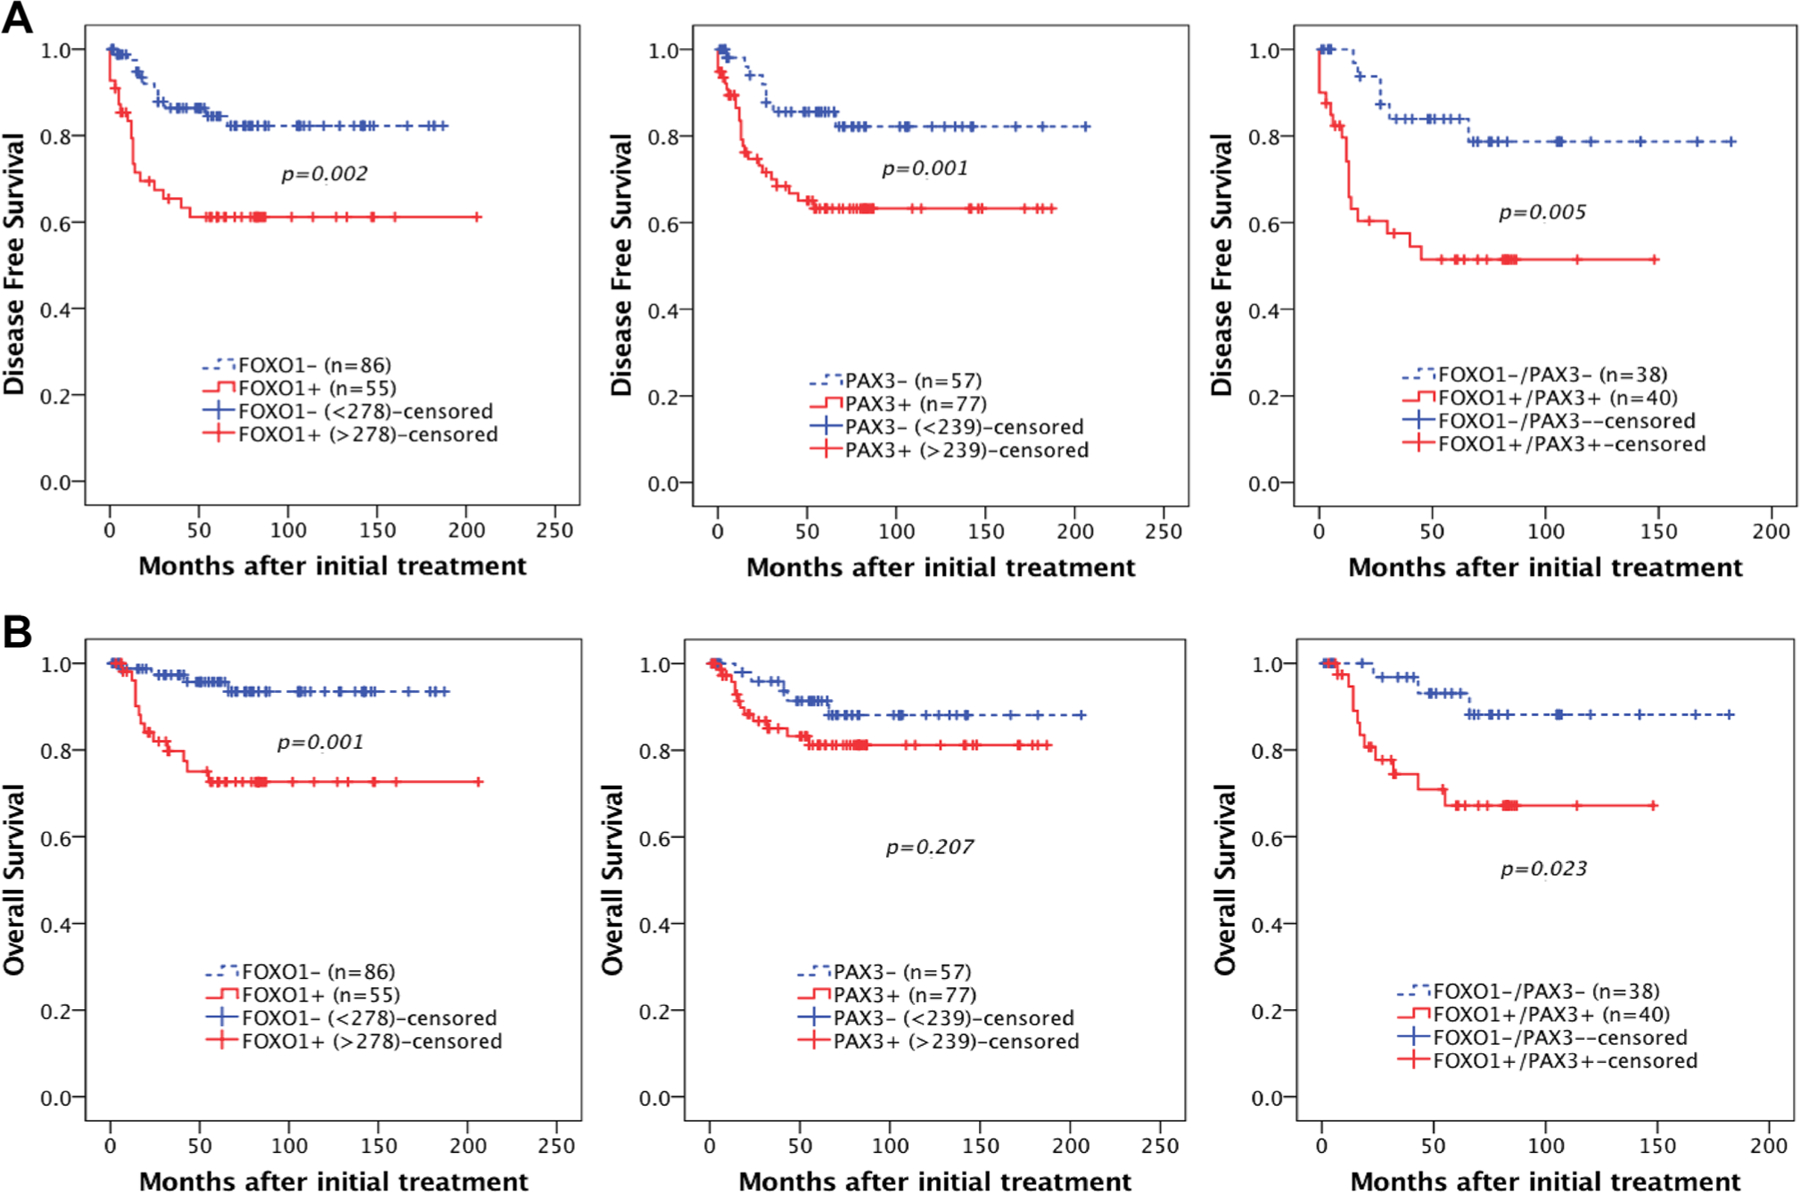
Kaplan–Meier plots for disease-free survival (a), and overall survival (b), according to FOXO1 and PAX3 expression levels in cervical cancer. FOXO 1 expression is associated with significantly poor DSF (a, left: p = 0.002) and OS (b, left: p = 0.001). PAX3 expression is associated with significantly poor DSF (a, middle: p = 0.001) and a tendency towards poor OS (b, middle: p = 0.207). Combined expression of both FOXO1 and PAX 3 shows significantly poor DSF (a, right: p = 0.005) and OS (b, right: p = 0.023). The cut-off value for FOXO1+ was an IHC score greater than 278, and the cut-off value for PAX3+ was an IHC score greater than 239
Table 2.
Univariate and multivariate analyses of overall survival in cervical cancer patients
| Variables | Univariate analysis |
Multivariate analysis |
||
|---|---|---|---|---|
| Hazard ratio [95% CI] | p value | Hazard ratio [95% CI] | p value | |
| Age (> 50) | 0.88 [0.32–2.40] | 0.816 | NA | |
| FIGO stage (> IIB) | 3.81 [1.46–9.91] | 0.006 | 3.89 [1.35–11.19] | 0.012 |
| Grade (poor) | 1.66 [0.64–4.32] | 0.293 | NA | |
| Cell type (non-SCC) | 2.65 [0.93–7.56] | 0.067 | NA | |
| Tumor size (> 4 cm) | 1.84 [0.71–4.78] | 0.208 | NA | |
| LN metastasis | 1.82 [0.61–5.45] | 0.281 | NA | |
| SCC Ag+ | 2.40 [0.83–6.93] | 0.105 | NA | |
| FOXO1+a | 5.38 [1.75–16.52] | 0.003 | 4.01 [1.22–13.10] | 0.021 |
| PAX3+b | 1.93 [0.68–5.49] | 0.216 | NA | |
| FOXO1+/PAX3+ | 3.93 [1.09–14.12] | 0.036 | 3.64 [0.89–14.91] | 0.072 |
CI, confidence interval; FIGO, International Federation of Gynecology and Obstetrics; LN, lymph node; NA, not applicable
Cut-off value for FOXO1+ is an IHC score of over 278
Cut-off value for PAX3+ is an IHC score of over 239
Discussion
This study reveals a correlation between FOXO1 and PAX3 expressions in cervical neoplasias and poor prognosis in cervical cancer patients. FOXO1 plays an important role in apoptosis, glucose metabolism, cell-cycle progression, and differentiation [6]. There is evidence of FOXO1 being a tumor suppressor in some cancers, including prostate cancer [16], bladder cancer [17], and breast cancer and melanoma [18]; however, its specific function has not yet been fully characterized [19]. Regarding cervical cancer, there is controversy concerning the role of FOXO1 in carcinogenesis. Among previously reported studies, Zhang et al. suggested a tumor suppressor role for FOXO1, unlike our study. They reported that FOXO1 expression was reduced in proliferative cells and gradually decreased with progression of tumor stage [9]. Another suppressive role was also reported by Prasad et al. who revealed that cervical cancer cell lines show overexpression of PIK3 and AKT with downregulation of FOXO1, suggesting that functional inactivation of FOXO1 may be due to post-translational modifications in cervical cancer [20]. On the contrary, Haung et al. proposed an oncogenic role of FOXO1 in cervical carcinoma, which was similar to our results. They indicated that FOXO1 promoted proliferation and epithelial–mesenchymal transition through the PI3K-AKT signal pathway and that increases in FOXO1 were correlated with poor prognosis in cervical cancer [10]. In addition, considering the interesting viral etiology and carcinogenesis of cervical cancer, FOXO1 is suspected to play an oncogenic role in viral immune evasion. As is well known, the major etiological factor of cervical cancer is persistent high-risk HPV infection and where the progression to cervical cancer occurs in a multistep process with the virus evading immune surveillance [4, 21]. A supportive explanation for the role of FOXO1 in immune evasion of chronic viral infection comes from a study with chronic lymphocytic choriomeningitis virus infection by Staron et al. [22]. They revealed that FOXO1 functions as a transcriptional activator of programmed cell death protein 1 (PD-1) acting with it through a positive-feedback pathway 1 and desensitizing virus-specific cytotoxic T lymphocytes (CTLs) during chronic viral infection. Considering these previously reported functions of FOXO1, we propose an oncogenic role for FOXO1 in cervical cancer. The in vitro results of this study demonstrated that knockdown of FOXO1 decreases cell viability, migration, and invasion, which supports our hypothesis of FOXO1 playing an oncogenic role. Thus, despite previous reports on FOXO1 having a suppressive role in several cancers, whether FOXO1 exhibits suppressive or oncogenic potential in cervical cancer warrants further study. Meanwhile, PAX genes play a critical role in the formation of tissues during embryonic development and translocation of the PAX3 gene with FOXO1-PAX3 has been shown to be associated with alveolar rhabdomyosarcoma. Other than as being a part of the PAX3-FOXO1 fusion protein, PAX3 is also present in other cancer types with no relationship to developmental lineages, such as osteosarcoma and breast carcinoma [11]. The oncogenic potential of PAX3 has been studied in several cancers, and some clinical studies have suggested that PAX3 expression may be associated with worse prognosis, as in glioma [23] and gastric carcinoma [24]. However, the role of PAX3 has not been fully clarified yet.
In this study, we also investigated FOXO1 and PAX3 expression within precancerous lesions in addition to cervical cancer. FOXO1 and PAX3 expression levels were significantly higher in both CIN (p < 0.001) and cancer tissue (p < 0.001) than in normal tissue. Among cervical neoplasias, FOXO1 and PAX3 expression levels were significantly higher in cervical cancer compared with low-grade CIN (p = 0.046 and p = 0.024, respectively). Interestingly, expression of both biomarkers did not significantly differ between low-grade and high-grade CIN, suggesting that these proteins may be reliable for detection of invasive cervical cancers. In the same manner, PAX3 expression positively correlated with FOXO1 expression in cervical cancer (Spearman’s ρ = 0.377, p < 0.001), while the same correlation was absent in pre-invasive cervical lesions. This finding could be of clinical importance to the treatment of cervical neoplasias. Low-grade CINs can spontaneously regress and can be managed expectantly, while high-grade CINs can be cured with simple excision. On the contrary, invasive cancer is a fatal disease that requires radical hysterectomy and further chemoradiation therapy or chemotherapy. Therefore, it would be clinically useful to distinguish cancer reliably from CIN or non-neoplastic disease.
One of the main objectives of this study was to evaluate the prognostic value of FOXO1 and PAX3 expression in cervical cancer. Results from the survival analysis revealed that FOXO1 expression and an advanced FIGO stage are independent prognostic factors for overall survival after adjusting for known prognostic parameters in cervical cancer. Patients with high levels of FOXO1 had increased probability of poor prognosis (hazard ratio 4.01, p = 0.021), and although combined expression of FOXO1 and PAX3 was not a significant prognostic factor in multivariate analysis, it showed a trend toward poor prognosis (p = 0.072). These results are consistent with previous studies correlating FOXO1 expression levels with bad prognosis of cervical cancer [10], gastric cancer [25], and non-small cell lung cancer [26]. Although the pathophysiological role and the prognostic value of FOXO1 within human cancers have not been fully determined, its role in promoting cell survival by modulating anti-oxidative defense was previously reported, in addition to its potential oncogenic role, described above [5, 19, 27]. Together with our survival results, these data propose FOXO1 as a candidate prognostic marker of survival in cervical cancer, which warrants further investigation.
Considering the further subgroup evaluation using clinicopathologic parameters, FOXO1 expression was significantly associated with squamous cell carcinoma (p = 0.032) and it showed a trend toward positive correlation with cervical cancer resistance to chemoradiation therapy (p = 0.056). These findings are of clinical importance, since the majority of cervical cancers are squamous cell carcinomas (more than 80%) and resistance to chemoradiation is a critical problem responsible for treatment failure [4]. Concurrent platinum-based chemoradiation is the standard backbone in the treatment of locally advanced cervical cancers, and currently, there is no known molecular marker that can accurately predict the treatment response to platinum-based chemoradiation or the outcome in cervical cancer [2, 28]. Previous in vitro studies support the involvement of FOXO1 in drug resistance, like in cisplatin-resistant gastric cancer cells [29], adriamycin-resistant breast cancer cells [30], and paclitaxel-resistant ovarian cancer cells [31]. These findings suggest FOXO1 as a potential predictive biomarker for chemoradiation treatments in cervical cancer, a suggestion that can have profound clinical implications.
Finally, protein expressions of FOXO1 and PAX3 were evaluated using automated digital image analysis in this study. Manually interpreting IHC staining can be highly subjective and is prone to intra- and inter-pathologist inconsistency, causing discrepant results between studies. In such cases, application of automated digital image analysis can reduce the inconsistent results and provide a more reproducible, objective and quantitative measurements [32]. For example, due to the predictable ability against treatment response to targeted therapy, the assessment in measuring human epidermal growth factor receptor 2 (HER2) expressions has been applied into the diagnostic workup in breast cancer. To clarify equivocal results of manually determined HER2 expression, fluorescence in situ hybridization (FISH) is commonly used, and nevertheless, it was reported that the results of automated digital image analysis excellently corresponded with FISH. Furthermore, the use of automated digital image analysis revealed advantages like more user-friendly and less time consumptive for HER2 interpretation and thereby was considerable for the substitution of FISH among equivocal cases [33]. Eventually, while digital image analysis has not been widely applied beyond breast cancer despite the above-mentioned advantages, it is expected to provide improved expression analysis from IHC staining in the fields of gynecologic cancer studies also.
There are limitations to this study. One is the relatively small sample size of low-grade CINs, compared to high-grade CINs and invasive cervical cancer, and this can act as a limited factor in identifying regressive or progressive cervical disease. In addition, HPV genotyping was not performed in this study, and the absence of different genotypic immunoreactivities can act as a source of bias in revealing the multistage carcinogenesis of cervical cancer. Another limitation was the small number of lymph-node metastasis cases, which showed a non-significant association with FOXO1 expression and cancer prognosis. Further investigation with a larger number of metastasis cases and long-term outcome data may be warranted to conclude this aspect.
In conclusion, this study reveals a correlation between expression levels of FOXO1 and PAX3 and clinicopathologic variables, including survival of cervical cancer patients. The results from this study suggest a promising potential of FOXO1 as a prognostic and survival marker, also provoking further studies about the biological function of FOXO1 and the associated linkage against the pathogenesis of cervical cancer.
Footnotes
Conflict of interest The authors have no conflict of interest to declare.
Ethical approval All procedures performed in studies involving human participants were in accordance with the ethical standards of the institutional and/or national research committee and with the 1964 Helsinki declaration and its later amendments or comparable ethical standards.
Informed consent Informed consent was obtained from all individual participants included in the study.
References
- 1.Torre LA, Bray F, Siegel RL et al. (2015) Global cancer statistics, 2012. CA Cancer J Clin 65:87–108 [DOI] [PubMed] [Google Scholar]
- 2.Duenas-Gonzalez A, Campbell S (2016) Global strategies for the treatment of early-stage and advanced cervical cancer. Curr Opin Obstet Gynecol 28:11–17 [DOI] [PubMed] [Google Scholar]
- 3.Small W Jr, Bacon MA, Bajaj A et al. (2017) Cervical cancer: a global health crisis. Cancer 123:2404–2412 [DOI] [PubMed] [Google Scholar]
- 4.Lea JS, Lin KY (2012) Cervical cancer. Obstet Gynecol Clin N Am 39:233–253 [DOI] [PubMed] [Google Scholar]
- 5.Xing YQ, Li A, Yang Y et al. (2018) The regulation of FOXO1 and its role in disease progression. Life Sci 193:124–131 [DOI] [PubMed] [Google Scholar]
- 6.Wang Y, Zhou Y, Graves DT (2014) FOXO transcription factors: their clinical significance and regulation. Biomed Res Int 2014:925350. [DOI] [PMC free article] [PubMed] [Google Scholar]
- 7.Lu H, Huang H (2011) FOXO1: a potential target for human diseases. Curr Drug Targets 12:1235–1244 [DOI] [PMC free article] [PubMed] [Google Scholar]
- 8.Fu Z, Tindall DJ (2008) FOXOs, cancer and regulation of apoptosis. Oncogene 27:2312–2319 [DOI] [PMC free article] [PubMed] [Google Scholar]
- 9.Zhang B, Gui LS, Zhao XL et al. (2015) FOXO1 is a tumor suppressor in cervical cancer. Genet Mol Res 14:6605–6616 [DOI] [PubMed] [Google Scholar]
- 10.Huang L, Huang Z, Fan Y et al. (2017) FOXC1 promotes proliferation and epithelial-mesenchymal transition in cervical carcinoma through the PI3K-AKT signal pathway. Am J Transl Res 9:1297–1306 [PMC free article] [PubMed] [Google Scholar]
- 11.Boudjadi S, Chatterjee B, Sun W et al. (2018) The expression and function of PAX3 in development and disease. Gene 666:145–157 [DOI] [PMC free article] [PubMed] [Google Scholar]
- 12.Wang XD, Morgan SC, Loeken MR (2011) Pax3 stimulates p53 ubiquitination and degradation independent of transcription. PLoS ONE 6:e29379. [DOI] [PMC free article] [PubMed] [Google Scholar]
- 13.Liu W, Sui F, Liu J et al. (2016) PAX3 is a novel tumor suppressor by regulating the activities of major signaling pathways and transcription factor FOXO3a in thyroid cancer. Oncotarget 7:54744–54757 [DOI] [PMC free article] [PubMed] [Google Scholar]
- 14.Eisenhauer EA, Therasse P, Bogaerts J et al. (2009) New response evaluation criteria in solid tumours: revised RECIST guideline (version 1.1). Eur J Cancer 45:228–247 [DOI] [PubMed] [Google Scholar]
- 15.Livak KJ, Schmittgen TD (2001) Analysis of relative gene expression data using real-time quantitative PCR and the 2(−Delta Delta C(T)) method. Methods 25:402–408 [DOI] [PubMed] [Google Scholar]
- 16.Li R, Erdamar S, Dai H et al. (2007) Forkhead protein FKHR and its phosphorylated form p-FKHR in human prostate cancer. Hum Pathol 38:1501–1507 [DOI] [PMC free article] [PubMed] [Google Scholar]
- 17.Zhang Y, Jia L, Zhang Y et al. (2017) Higher expression of FOXOs correlates to better prognosis of bladder cancer. Oncotarget 8:96313–96322 [DOI] [PMC free article] [PubMed] [Google Scholar]
- 18.Coomans de Brachene A, Demoulin JB (2016) FOXO transcription factors in cancer development and therapy. Cell Mol Life Sci 73:1159–1172 [DOI] [PMC free article] [PubMed] [Google Scholar]
- 19.Zhang Y, Gan B, Liu D et al. (2011) FoxO family members in cancer. Cancer Biol Ther 12:253–259 [DOI] [PubMed] [Google Scholar]
- 20.Prasad SB, Yadav SS, Das M et al. (2014) Down regulation of FOXO1 promotes cell proliferation in cervical cancer. J Cancer 5:655–662 [DOI] [PMC free article] [PubMed] [Google Scholar]
- 21.Crosbie EJ, Einstein MH, Franceschi S et al. (2013) Human papil-lomavirus and cervical cancer. Lancet 382:889–899 [DOI] [PubMed] [Google Scholar]
- 22.Staron MM, Gray SM, Marshall HD et al. (2014) The transcription factor FoxO1 sustains expression of the inhibitory receptor PD-1 and survival of antiviral CD8(+) T cells during chronic infection. Immunity 41:802–814 [DOI] [PMC free article] [PubMed] [Google Scholar]
- 23.Chen J, Xia L, Wu X et al. (2012) Clinical significance and prognostic value of PAX3 expression in human glioma. J Mol Neurosci 47:52–58 [DOI] [PubMed] [Google Scholar]
- 24.Zhang L, Xia L, Zhao L et al. (2015) Activation of PAX3-MET pathways due to miR-206 loss promotes gastric cancer metastasis. Carcinogenesis 36:390–399 [DOI] [PubMed] [Google Scholar]
- 25.Xu Y, Shao QS, Yao HB et al. (2014) Overexpression of FOXC1 correlates with poor prognosis in gastric cancer patients. Histopathology 64:963–970 [DOI] [PubMed] [Google Scholar]
- 26.Wei LX, Zhou RS, Xu HF et al. (2013) High expression of FOXC1 is associated with poor clinical outcome in non-small cell lung cancer patients. Tumour Biol 34:941–946 [DOI] [PubMed] [Google Scholar]
- 27.Tothova Z, Kollipara R, Huntly BJ et al. (2007) FoxOs are critical mediators of hematopoietic stem cell resistance to physiologic oxidative stress. Cell 128:325–339 [DOI] [PubMed] [Google Scholar]
- 28.Dasari S, Wudayagiri R, Valluru L (2015) Cervical cancer: biomarkers for diagnosis and treatment. Clin Chim Acta 445:7–11 [DOI] [PubMed] [Google Scholar]
- 29.Park J, Ko YS, Yoon J et al. (2014) The forkhead transcription factor FOXO1 mediates cisplatin resistance in gastric cancer cells by activating phosphoinositide 3-kinase/Akt pathway. Gastric Cancer 17:423–430 [DOI] [PubMed] [Google Scholar]
- 30.Han CY, Cho KB, Choi HS et al. (2008) Role of FoxO1 activation in MDR1 expression in adriamycin-resistant breast cancer cells. Carcinogenesis 29:1837–1844 [DOI] [PubMed] [Google Scholar]
- 31.Goto T, Takano M, Hirata J et al. (2008) The involvement of FOXO1 in cytotoxic stress and drug-resistance induced by paclitaxel in ovarian cancers. Br J Cancer 98:1068–1075 [DOI] [PMC free article] [PubMed] [Google Scholar]
- 32.Grunkin M, Raundahl J, Foged NT (2011) Practical considerations of image analysis and quantification of signal transduction IHC staining. Methods Mol Biol 717:143–154 [DOI] [PubMed] [Google Scholar]
- 33.Tawfik OW, Kimler BF, Davis M et al. (2006) Comparison of immunohistochemistry by automated cellular imaging system (ACIS) versus fluorescence in-situ hybridization in the evaluation of HER-2/neu expression in primary breast carcinoma. Histopathology 48:258–267 [DOI] [PubMed] [Google Scholar]