

Abstract
Background
Ectopic cycle length (ECL) and the distribution patterns of ventricular bigeminy and trigeminy, expressed as their postextrasystolic intervals (PEIs) and interectopic intervals (IEIs), have been poorly pursued.
Objective
Based on modulation theory, we hypothesized that the PEIs of bigeminy and trigeminy determine their IEIs and ECL.
Methods
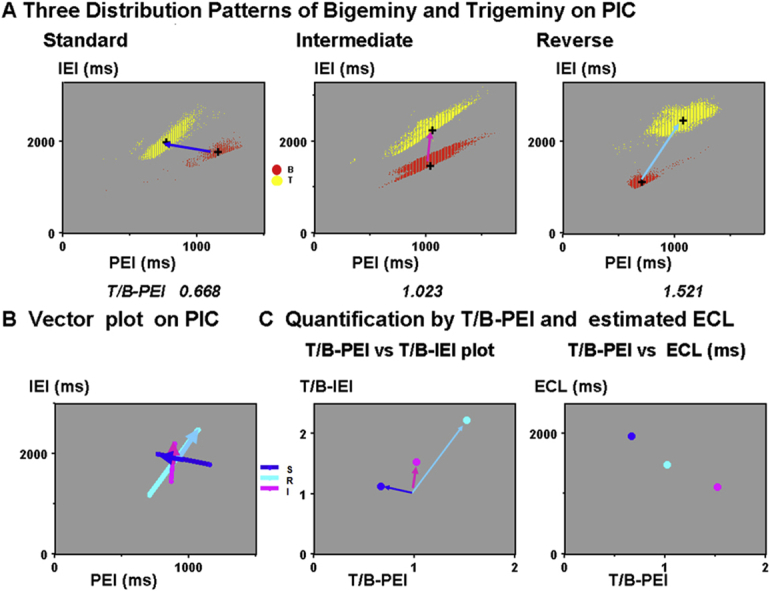
Ambulatory electrocardiograms of 1290 patients with ventricular premature complexes (≥3000/day) were studied. To quantify their distribution pattern on the PEI vs IEI curve (PIC), we introduced the following 2 ratios: PEI of trigeminy to PEI of bigeminy ratio (T/B-PEI) and IEI of trigeminy to IEI of bigeminy ratio (T/B-IEI). Distribution patterns were divided into 3 types by T/B-PEI: standard type (<0.90), intermediate type (between 0.90 and 1.20), and reverse type (>1.20). ECL was defined as the average of the bigeminy and trigeminy intervals in the standard type, and bigeminy intervals in the other 2 types.
Results
T/B-IEI disclosed significant linear relationship with T/B-PEI (P < .0001). ECLs were longest in the standard type (1905 ± 347 ms; n = 426), followed by the intermediate type (1520 ± 239 ms; n = 607) and reverse type (1317 ± 227 ms; n = 227) (P < .0001). Trigeminy PEI/ECL in the standard type (0.450 ± 0.074) was significantly shorter than that of the other 2 types (P < .0001).
Conclusion
We confirmed that T/B-PEI determines T/B-IEI and ECL by discriminating the 3 distribution patterns. Among them, trigeminy PEI/ECL decided the 2 types of modulation by the first sinus QRS, starting at the early delay phase or the later acceleration phase.
Keywords: Bigeminy, Ectopic cycle length, Modulation, Pattern recognition, Trigeminy, Ventricular premature complex
Graphical abstract
Key Findings.
-
▪
Significant linear relationship between 2 ratios, the postextrasystolic interval (PEI) of trigeminy to PEI of bigeminy ratio (T/B-PEI) and the interectopic interval (IEI) of trigemini to IEI of bigeminy interval, was observed. T/B-PEI (<0.9 and >1.2) discriminated the 3 distribution patterns (standard, intermediate, and reverse type) and corresponded to their slow, intermediate, and fast ectopic cycle length (ECL).
-
▪
Our simple quantification for the distribution patterns using T/B-PEI strongly supports the modulation theory. ECL can be applied for the evaluation of ventricular premature complexes.
Introduction
Roles of the ectopic foci in ventricular premature complexes (VPCs) have not been established, while foci in the pulmonary veins have become the major target for the elimination of atrial fibrillation.1 Recently, several parameters have been proposed for VPC risk stratification, including VPC burden or coupling intervals (CI).2,3 However, information on ectopic cycle length (ECL) is quite limited except for parasystole.4,5 Since the development of modulation theory,6 specific distribution patterns of bigeminy and trigeminy corresponding to the phase response curve (PRC) in the experimental study have been graphically reported in simulation studies and in clinical cases, where the ECL, ECL/sinus cycle length (SCL), postextrasystolic interval (PEI), heart rate (HR), or mean SCL (mSCL) were used as the abscissa.7, 8, 9, 10, 11, 12
In 2008, we reported a relation between the PEI and ECL based on a simulation study and clinical data.13 Distribution patterns of bigeminy and trigeminy on the PEI histogram can be classified into 2 types: the standard type (trigeminy-to-bigeminy order of appearance with increasing PEI) and the reverse type. These 2 patterns are determined by PEI/ECL, and the standard type was reproduced at the smaller ratio (<0.5), while the latter was seen at the larger ratio (>0.5). These distributions can be displayed on the PEI vs interectopic interval (IEI) curve (PIC), and can be reproduced by simulation (Figures 4 and 5 in ref. 13). We documented an additional overlapped type, where concealed bigeminy played a role.14 This type was renamed as intermediate type hereafter. We also found its special form showing repetitive interpolation, where strong modulation was suspected.15 These patterns, expressed by 4 parameters for abscissa and ordinate each for bigeminy and trigeminy, were recognized by visual inspection of the PIC and have not yet been quantified.16,17
Figure 4.

A: Standard type (case 1, same as Figures 1A and 2A). The main panel shows the postextrasystolic interval vs interectopic interval curve (PIC). Right panel: interectopic interval (IEI) histogram. Middle panel: postextrasystolic interval (PEI) histogram. Bottom panel: Heart rate (HR) histogram, where white dots indicate the total ventricular premature complexes. B: Reverse type (case 2, same as Figures 1B and 2B). The main panel shows the PIC. Right, middle, and bottom histograms show IEI, PEI and HR, respectively. B = bigeminy; T = trigeminy.
Figure 5.

A: Intermediate type (case 3, same as Figures 1C and 2C). In main panel, PIC shows trigeminy overlapping bigeminy. The IEI histogram shows their separated peaks. PEI and HR histograms show trigeminy overlapping bigeminy. B: Mixed subtype (case 4). The main panel and 3 histograms show the trigeminy located on both sides of the bigeminy. Abbreviations are the same as in Figure 4.
In this study, we hypothesized, according to our report,13 that the PEIs of bigeminy and trigeminy determine their IEIs and resultant ECL. To express the complex distribution patterns of bigeminy and trigeminy, we introduced their simple ratio for PEI and IEI.13 Quantification using these ratios instantly discriminates their distribution patterns and determines the ECLs. We suspect that the ECL plays a dominant role in VPCs and determines their fundamental structure, as shown by the PRC or its clinical version, PIC. However, in the real world, the usefulness of ECL has not been tested for the classification of VPCs or for the risk stratification of sudden cardiac death.
Methods
Study population
We retrospectively analyzed digitalized ambulatory electrocardiograms (ECGs) from 1290 patients (aged 56 ± 19 years, 615 women) showing frequent VPCs (≥3000/day). Patients with implanted pacemakers, polymorphic VPC (>10%), and frequent couplets were excluded. Patients with organic heart disease and atrial fibrillation were included if their precise details were available. The present study was performed from January 2001 to December 2018 and approved by the Review Board of Dokkyo Medical University, Saitama Medical Center. All patients provided written informed consent. The research reported in this paper adhered to human research guidelines (revised version of Helsinki Declaration, 2013).
ECG analysis with PIC display
The analysis system for this study was the same as in the previous report.12, 13, 14, 15 VPC total counts and CI with standard deviations and coefficients of variance (CV) were measured for a full day. In addition, individual PEIs and IEIs, including bigeminy and trigeminy, were measured and plotted on a full-day PIC. SCL indicates a full-day average of mSCL. Each R-R interval was measured at its peak of the R wave including VPC with 8-ms time resolution. Data are expressed as the mean and standard deviation. For the analysis, conventional statistical methods, including analysis of variance, were applied using StatView 5.0 (Abacus Concepts, Berkeley, CA).
ECGs in the left columns in Figure 1A through 1C show representative bigeminy (red) and trigeminy (yellow) in 3 types. In the right columns, bigeminy and trigeminy intervals were plotted against their PEIs on PICs. They were connected by bars. Those procedures were repeated for a full day and are shown in Figure 2A through 2C. We used our previous analysis system with the same designation; normal QRS was expressed as N and VPC as X.13 Bigeminy is expressed as X1N1X2 and trigeminy as X1N1N2X2, as shown in Figure 3. For the intermediate type, further discrimination of the compensatory VPC (PEI > mSCL) and interpolated VPC (PEI < mSCL) was necessary (details in Supplementary Material).
Figure 1.

Electrocardiograms in the left columns show the bigeminy (red arrows) and trigeminy (yellow arrows). Right columns show their postextrasystolic interval (PEI) vs interectopic interval (IEI) curves. A: Standard type (case 1). B: Reverse type (case 2). C: Intermediate type (case 3).
Figure 2.

A–C: Three postextrasystolic interval vs interectopic interval curves (PICs) in Figure 1 are expanded for a full day. Crosses indicate the centers of bigeminy and trigeminy. A: Standard type (case 1). Centers of bigeminy (1154, 1772 ms) and trigeminy (771, 1980 ms). Trigeminy-to-bigeminy (T/B) postextrasystolic interval ratio (PEI) = 0.668 and T/B interectopic interval ratio (IEI) = 1.117. B: Reverse type (case 2). C: Intermediate type (case 3). D–F: Quantification process. D: Three bars connected the crosses in the PICs. E: T/B-PEI vs IEI plot. F: T/B-PEI vs T/B-IEI plot.
Figure 3.

A: Trigeminy constitution based on the effect of N1 and N2 in the 3 types. B: Schema of the trigeminy in the standard type with the assumed phase response curve. N1 delays the automaticity, while N2 accelerates the automaticity.
Recognition of the 3 distribution patterns by comparing bigeminy and trigeminy PEIs
In full-day PIC, we defined the standard type as a trigeminy-to-bigeminy order of appearance with increasing PEI, as shown in Figure 2-A.13,14 A bigeminy-to-trigeminy order was defined as the reverse type (Figure 2B). We introduced the intermediate type, where the trigeminy was located above the bigeminy, as shown in Figure 2C.14 Crosses in PICs indicated the averages of PEI and IEI for bigeminy and trigeminy. Here, we defined the distribution patterns of bigeminy and trigeminy as follows. They are the abscissa and ordinate of the averaged bigeminy and trigeminy centers. In case 1 (Figure 2A), they are 1154, 1772 ms for bigeminy and 771, 1980 ms for trigeminy, respectively. On PIC, slope of the bigeminy regression line was measured as a bigeminy slope, corresponding to the parameter b.13
Two types of modulation were expressed using symbols {a} for the delay and {b} for the acceleration. Using these symbols, bigeminy was expressed as {bX} and 3 types of trigeminy were represented as {abX} in the standard type, {b.aX} in the reverse type, and {b.bX} in the intermediate type, as shown in Figure 3.13 Delay and acceleration effects of 2 normal beats, N1 and N2, in the standard-type trigeminy are schematically displayed.
Since the distribution pattern of bigeminy and trigeminy needed 4 parameters, we introduced their ratios to precisely recognize the distribution patterns in Figure 2A through 2C by the following procedure and minimized the 2 parameters. First, pairs of crosses in panels A–C were connected with arrows in panel D. We normalized these arrows so that they can start from the common center of bigeminy. For this, we introduced a new ratio for the abscissa: the PEI of the trigeminy to the PEI of the bigeminy ratio (T/B-PEI). Bigeminy and trigeminy intervals were replotted against this ratio in panel E. Finally, we introduced the IEI of the trigeminy to the IEI of the bigeminy ratio (T/B-IEI) for the ordinate, which was plotted against T/B-PEI in panel F. Here, we show the relative locations of trigeminy viewed from the common center of bigeminy (1.0, 1.0). Clusters of dots (panels A–C) and 3 arrows (panels D and E) are now summarized as 3 dots. This plot, using these 2 ratios, instead of the 4 parameters, was named the “2 ratios plot” (TRP). Quantified distribution pattern was thus plotted T/B-IEI against T/B-PEI.
Finally, we set 2 T/B-PEI cut-off values for classification into 3 types, as follows: standard type (T/B-PEI < 0.90), intermediate type (between 0.90 and 1.20), and reverse type (> 1.20). Details in Figure 2A through 2C and their subtypes are shown in Figures 4 and 5 with PEIs, IEIs, and HR histograms.
Estimation of the ECL
We estimated the ECL in each type according to our logics based on T/B-PEI. In the standard type, ECL was defined as the weighted average of the bigeminy and trigeminy intervals, while in the intermediate and reverse types, it was defined as bigeminy intervals. In patients without bigeminy, ECL was estimated as the weighted average of trigeminy and quadrigeminy intervals. If trigeminy was nil, ECL was the weighted average of the quadrigeminy and pentageminy intervals, and so on. In the standard type, the bigeminy-to-trigeminy transition point was defined as the weighted average of bigeminy PEI and trigeminy PEI. The transition parameter ω was calculated as the transition point/ECL.
Logics for the ratio and transition from bigeminy to trigeminy
We classified 3 distribution patterns of bigeminy and trigeminy according to our logics, as shown in Figure 3. Three distribution patterns were determined by the location of the trigeminy in relation to the bigeminy {bX}. In the standard type, tachycardia-dependent trigeminy {abX} appeared with shortening of PEI or PEI/ECL. In the reverse type, bradycardia-dependent trigeminy {b.aX} from the concealed bigeminy appeared with lengthening of PEI or PEI/ECL, followed by the subsequent delay. In the intermediate type {b.bX}, concealed bigeminy was followed by the subsequent acceleration. In these 2 types, concealed bigeminy was located in the refractory period of N1.13 Finally, we normalized PICs in the 3 types using PEI/ECL and IEI/ECL. VPC distribution patterns could be simulated using 6 parameters.8,9
Results
Patient characteristics and VPC properties
The mean age of the patients was 56.2 ± 18.8 years, 675 (52%) were men, and 232 had heart disease, including ischemic heart disease (77) and nonischemic heart disease (155). In 127 patients, antiarrhythmic agent was administered (class I in 74, class II in 38, class III in 4, and class IV in 11). The total VPC counts were 14,213 ± 10,610 per day. Thirty patients did not show bigeminy at all, and 24 of them showed trigeminy.
Three distribution patterns of bigeminy and trigeminy
Details of the 3 types of distribution with bigeminy (n = 1260) according to our definition are shown in Table 1. Standard, intermediate, and reverse types were observed in 426, 607, and 227 patients, respectively. Significant differences were found in age, CI-CV, bigeminy interval, bigeminy PEI, bigeminy slope, trigeminy counts, trigeminy interval, trigeminy PEI, T/B-PEI, T/B-IEI, ECL, SCL/ECL, X1N1, and T-PEI/ECL between the 3 types. Age and ECL disclosed significant positive relationship only in the reverse type.
Table 1.
Baseline characteristics of ventricular premature complexes in the 3 types
| Type |
P value | |||
|---|---|---|---|---|
| Standard | Intermediate | Reverse | ||
| N | 426 | 607 | 227 | |
| Male/female (n) | 219/207 | 324/283 | 119/108 | .8094 |
| Age (y) | 55.6 ± 19.5 | 58.8 ± 17.2 | 52.7 ± 19.6 | <.0001 |
| Heart disease | 85 | 109 | 38 | .5553 |
| IHD | 26 | 38 | 13 | .9593 |
| Non-IHD | 59 | 71 | 25 | .4763 |
| NYHA ≥ II | 90 | 125 | 41 | .6270 |
| LVEF ≤ 55% | 98 | 122 | 48 | .5334 |
| VPC | ||||
| Counts/day | 14,848 ± 11,615 | 13,918 ± 10,105 | 14,601 ± 10,343 | .3492 |
| Burden (%) | 0.134 ± 0.097 | 0.123 ± 0.085 | 0.133 ± 0.090 | .1245 |
| CI (ms) | 524 ± 70 | 523 ± 79 | 524 ± 89 | .9892 |
| SD (ms) | 55 ± 28 | 51 ± 31 | 53 ± 37 | .1621 |
| CV | 0.103 ± 0.046 | 0.096 ± 0.048 | 0.098 ± 0.051 | .0464 |
| Bigeminy | ||||
| Counts (/day) | 4540 ± 7314 | 4396 ± 7296 | 3693 ± 6699 | .0108 |
| Interval (ms) | 1675 ± 257 | 1520 ± 238 | 1317 ± 227 | <.0001 |
| PEI (ms) | 1128 ± 208 | 996 ± 339 | 809 ± 183 | <.0001 |
| Slope | 1.007 ± 0.170 | 1.070 ± 0.149 | 1.019 ± 0.239 | <.0001 |
| Trigeminy | ||||
| Counts (/day) | 2867 ± 3965 | 2871 ± 3967 | 3039 ± 4655 | .0108 |
| Interval (ms) | 2175 ± 316 | 2330 ± 371 | 2524 ± 440 | <.0001 |
| PEI (ms) | 850 ± 175 | 1020 ± 342 | 1138 ± 222 | <.0001 |
| T/B-PEI | 0.759 ± 0.110 | 1.028 ± 0.082 | 1.432 ± 0.222 | <.0001 |
| T/B-IEI | 1.307 ± 0.141 | 1.536 ± 0.113 | 1.931 ± 0.256 | <.0001 |
| ECL (ms) | 1905 ± 347 | 1521 ± 239 | 1317 ± 227 | <.0001 |
| SCL (ms) | 799 ± 95 | 788 ± 110 | 801 ± 102 | .1122 |
| SCL/ECL | 0.429 ± 0.072 | 0.522 ± 0.057 | 0.619 ± 0.097 | <.0001 |
| X1N1 (ms) | 850 ± 175 | 996 ± 340 | 808 ± 183 | <.0001 |
| T-PEI/ECL | 0.450 ± 0.074 | 0.669 ± 0.162 | 0.872 ± 0.074 | <.0001 |
Values are given as mean ± standard deviation.
CI = coupling interval; CV = coefficient of variation; ECL = ectopic cycle length; IHD = ischemic heart disease; LVEF = left ventricular ejection fraction; PEI = postextrasystolic interval; SCL = sinus cycle length; T/B-PEI = trigeminy-to-bigeminy postextrasystolic interval ratio; T/B-IEI = trigeminy-to-bigeminy interectopic interval ratio; T-PEI/ECL = trigeminy postextrasystolic interval to ectopic cycle length ratio; VPC = ventricular premature complex.
Standard type
In this type, the T/B-PEI was 0.760 ± 0.109. PEI in the trigeminy was 24% shorter than that in the bigeminy (P < .0001). The trigeminy interval (2175 ± 336 ms) was significantly longer than that of the bigeminy (1732 ± 281 ms, P < .0001), expressed as T/B-IEI 1.307 ± 0.141. Bigeminy and trigeminy constituted the first peak on the IEI histogram. ECL was longest (1905 ± 348 ms) in the 3 types (P < .0001). Their transition point was 991 ± 169 ms, and ω was 0.512 ± 0.043.
The PIC in Figure 4A (upper left panel; 50-year-old woman with no heart disease) showed trigeminy at the left and bigeminy at the right with a T/B-PEI of 0.668. The transition point and ω were 890 ms and 0.455, respectively. The IEI histogram in the upper right panel shows bigeminy peak at 1772 ms (n = 750) and a dominant trigeminy peak at 1980 ms (n = 5817), with a T/B-IEI of 1.117. Quadrigeminy, pentageminy, and hexageminy constituted a second peak at 3900 ms. The ECL was 1956 ms and the SCL was 693 ms. The PEI histogram (middle panel) and HR histogram (bottom panel) show dominant tachycardia-dependent trigeminy (92 beats per minute [bpm]) and minor bradycardia-dependent bigeminy (70 bpm).
Reverse type
Bigeminy and trigeminy appeared in that order on PIC with a 43% increase of PEI (809 ± 183 vs 1138 ± 222 ms, P < .0001). T/B-PEI was 1.432 ± 0.222. The IEI of the trigeminy was twice that of the bigeminy (2524 ± 441 vs 1317 ± 227 ms) with a T/B-IEI of 1.931 ± 0.256. ECL was shortest (1317 ± 227 ms) in the 3 types (P < .0001).
In the upper left panel in Figure 4B (43-year-old woman with no heart disease), the trigeminy was located in an upper right zone away from the bigeminy. The IEI histogram in the right panel shows a bigeminy peak at 1110 ms (n = 2384) and a dominant trigeminy peak at 2467 ms (n = 7666) with a T/B-IEI of 2.223. Her ECL was 1110 ms and SCL was 714 ms. The PEI histogram shows a T/B-PEI of 1.521, where the transition from bigeminy to trigeminy occurred at a PEI of 780 ms. The HR histogram shows bradycardia-dependent trigeminy.
Intermediate type
In this type, PEI of bigeminy was slightly shorter than that in trigeminy (996 ± 339 vs 1020 ± 342 ms, P < .0001) and T/B-PEI was 1.028 ± 0.082. T/B-IEI was 1.536 ± 0.113. ECL was 1521 ± 239 ms. Compensatory VPCs, including bigeminy, trigeminy, quadrigeminy, and so on, were located on separated linear regression lines without flexion. Interpolated and compensatory trigeminy or more constituted other regression lines with flexion, while interpolated and compensatory bigeminy constituted a single regression line on PIC.15
In Figure 5A (46-year-old man with no heart disease), compensatory trigeminy and quadrigeminy overlapped on the dominant bigeminy (n = 29,934). Traces of interpolated trigeminy and quadrigeminy were observed at PEI of 300 ms. The IEI histogram in the right panel shows bigeminy, trigeminy, and quadrigeminy constituting an interval ratio of approximately 2:3:4. T/B-PEI was 1023 and T/B-IEI was 1.486. The ECL was 1558 ms, and SCL was 779 ms.
Mixed subtypes
Among the several variations of the 3 types, the mixed subtype (n = 44), belonging to the reverse type, showed another feature of the standard type where the small cluster of trigeminy was located at the left side of bigeminy.
The upper left panel in Figure 5B (65-year-old man with no heart disease) shows the major compensatory trigeminy (upper right, n = 1110) and minor compensatory trigeminy (left, n = 204) on both sides of the dominant compensatory bigeminy (n = 17,005). His T/B-PEI was 1.280 and T/B-IEI was 1.845, while ECL was 1524 ms and SCL was 712 ms. Transitions from bigeminy to trigeminy occurred at PEIs of 650 ms and 1.300 ms, respectively.
Normalization of the PICs in the three types
In Figure 6A (i–iv), 4 PICs limited for bigeminy and trigeminy in Figures 4A, 5B, 4B, and 5A are shown. Bigeminy located on the right side in the standard type (i) was gradually shifted to lower-leftward in the mixed type (ii) and reverse type (iii). Compensatory trigeminy located at the left side in panel i decreased in panel ii and disappeared in panel iii, while another trigeminy appeared in the upper right side in panel ii and became dominant in panel iii, with decreasing ECLs from 1956 ms to 1110 ms.
Figure 6.

A: PICs limited for bigeminy and trigeminy from Figures 4 and 5 show their ectopic cycle length (ECL) dependence in (i) standard, (ii) mixed, (iii) reverse, and (iv) intermediate types, respectively. White arrows indicate the PEI of X1N1. Solid arrows on the right indicate ECL. These values in the 4 cases are shown in the right columns. B: PICs in panel A were normalized. Arrows indicate X1N1/ECL with their values in the right columns. Dotted lines show the estimated phase response curves. Abbreviations are the same as in Figure 4.
Those 4 PICs were normalized by their ECLs in panel B, where the location of bigeminy gradually shifted to the right in panels ii–iv. Assumed PRCs in the 4 cases are displayed with dots. The location of ω gradually shifted from the center (0.52) to the left (0.27). The normalized timing of X1N1 in trigeminy, T-PEI/ECL, corresponding to the phase of the ectopic focus, was significantly smaller in the standard type (0.450) compared with the intermediate and reverse types (Table 1).
T/B-PEI as a determinant of T/B-IEI and ECL
Figure 7 summarizes the data in the 3 types. Panel A shows TRP together with the T/B-PEI histogram (bottom) and T/B-IEI histogram (right). TRP revealed a significant positive linear correlation (P < .0001). Dominant peaks of T/B-PEI and T/B-IEI were observed at 1.0 and 1.5, respectively, and both corresponded to the intermediate type. Their distributions were slightly sharper than the normal distribution indicated by red lines. Figure 7B shows the estimated ECL in the 3 types. ECLs were longest in the standard type, followed by the intermediate type and reverse type (P < .0001). Panel C shows the histograms of their bigeminy and trigeminy intervals in the standard, intermediate, and reverse types, where the bigeminy intervals in the reverse and intermediate types were the ECL in panel B. In panel D, bigeminy and trigeminy intervals were plotted against T/B-PEI. Trigeminy intervals were close to bigeminy intervals at a shorter T/B-PEI (<0.90), while they were separated at larger T/B-PEI (>1.20). In the 25 patients without bigeminy and with trigeminy, ECLs were 2817 ± 737 ms, and ECLs in 5 patients without bigeminy or trigeminy were 4302 ± 726 ms. In panel E, ECLs in all patients with bigeminy are plotted against T/B-PEI, showing a significant negative correlation (P < .0001). In panel F, ECLs in all 1290 patients are plotted against their SCL/ECL, showing a significant negative correlation (P < .0001).
Figure 7.

A: Center panel: “Two ratios” (T/B-PEI vs T/B-IEI) plot. Four crosses indicate cases 1–4. Right panel: T/B-IEI histogram. Bottom panel: T/B-PEI histogram. B: Estimated ectopic cycle lengths (ECLs) in the 3 types. C: Upper, middle, and bottom panels indicate bigeminy and trigeminy intervals in the standard, intermediate, and reverse types, respectively. D: T/B-PEI vs IEI. E: T/B-PEI vs ECLs (n = 1260). F: SCL/ECL vs ECLs (n = 1290). In = intermediate type; R = reverse type; S = standard type; SCL = sinus cycle length. Other abbreviations are the same as in Figure 2.
HR dependence of bigeminy and trigeminy
Since HR disclosed a significant negative correlation with PEI, their HR dependence showed inverted distribution to that of PEI, as shown in the bottom panels in Figures 4 and 5. Maximum bigeminy appeared at a slower HR (69 bpm) than trigeminy (83 bpm) in the standard type, while maximum bigeminy was observed at a faster HR (89 bpm) than trigeminy (67 bpm) in the reverse type. In the intermediate type, HR dependence was overlapped.
Discussion
Major findings
To the best of our knowledge, this innovative study is the first to directly investigate ECL from the quantified ratio for the distribution pattern, T/B-PEI, in VPCs by developing our previous logics.8,9,13, 14, 15 The most important finding is that T/B-PEI determines T/B-IEI and ECL. These 2 ratios, instead of the 4 location parameters for bigeminy and trigeminy, show the relative location of trigeminy viewed from the center of bigeminy. Next, PIC and its normalized form can reveal the individual features of the ectopic focus corresponding to the PRC in the 3 types. The delay phase observed in the standard-type trigeminy {abX} was suppressed by ECL shortening, which could introduce acceleration-dominant trigeminy in the reverse {b.aX} and intermediate types {b.bX}, mainly owing to the prolongation of X1N1/ECL. Third, we found almost-normal distributions of T/B-PEI and T/B-IEI (histograms in Figure 7A), suggesting automaticity as their common underlying mechanism. Further details of the 3 types, including their variations, are documented in the Supplemental Material.
Mechanism of the 3 distribution patterns estimated from the PIC
We estimated the mechanism of the 3 types by comparing the PICs in each type (Figure 6) with the simulation, where the locations of the bigeminy and trigeminy at a specific PRC were plotted against SCL/ECL or PEI/ECL.13 The simulation revealed the trigeminy {abX} at the left side of bigeminy {bX}, corresponding to the standard-type and the reverse-type trigeminy {b.aX} at its right side. Trigeminy in the intermediated type {b.bX} could be reproduced at a smaller ω with an interpolated concealed bigeminy (Supplemental Material). Thus, SCL/ECL, PEI/ECL, and ω determined the distribution patterns.
Features of the standard type
This type constitutes the basis of our study because of its bimodal features of PIC that can directly suggest modulation (Figure 4A). Tachycardia-dependent trigeminy was located at a smaller PEI than bigeminy and expressed as T/B-PEI < 0.9. It corresponded to the delay phase and was only seen in this type. Full-day documentation of tachycardia-dependent trigeminy was nil. Estimated ECL in Nilsson’s case 1 could be 1760 ms with a T/B-IEI of 0.95 (Figure 9 in Supplemental Material).7 ECL was first decelerated by N1 and then accelerated by N2. The presence of this delay phase has been suspected, but clear-cut trigeminy was not confirmed.8 The initial delay was strongly affected by the subsequent acceleration.
Features of the intermediate and reverse type
We thought trigeminy observed in these types was first introduced by the initial acceleration by N1. With the increment of PEI during bradycardia, scheduled X2 was captured by the tail of N1’s refractory period and disappeared as a concealed bigeminy (X1Xc) with T/B-PEI > 1.2. Then, subsequent XcN2 determines the next response XcX2 depending on its location.
If XcN2 was located before the transition point, XcX2 will be prolonged as a reverse type {b.aX} and the trigeminy interval will exceed twice that of the bigeminy (T/B-IEI > 2.0). If XcN2 exceeded the transition point, XcX2 will be abbreviated again as an intermediate type {b.bX}.13 These processes were expressed as a T/B-IEI of approximately 1.50. These 2 types were discriminated by the transition point or ω.
On the PIC in the intermediate type, the occasional presence of interpolated bigeminy at the shortest PEI suggested a strong degree of modulation. It constituted a linear regression line with the compensatory bigeminy, as we reported.15 When XcN2 became less than 500 ms, XcX2 decreased to its minimum, which can introduce the shortest X1X2. Cohen and colleagues5 disclosed bigeminy-to-trigeminy transition corresponding to our reverse type and suspected that N1 reset new automaticity. Instead of the reset, we suspected concealed bigeminy, where the activation from X1 protected the scheduled atrioventricular conduction. Subsequent Xc cannot drive the ventricle and allows the conduction of N2.
The mixed subtype showing a bimodal trigeminy distribution, as shown in Figure 5B, is a unique subtype with both features of the reverse and standard types. This subtype was reproduced by simulation, where trigeminy was observed at both sides of the bigeminy with PEI/ECL 0.45 and 0.90 (Figure 6 in ref. 13). This subtype was observed when the PEI/ECL range was wide enough.
Suppression of the delay phase in the reverse and intermediate types
When we compared the normalized PICs with their original forms in Figure 6, we found that the tachycardiac trigeminy at the left gradually became minor, and the dominant bigeminy appeared with ECL abbreviation, while X1N1 in the standard type and reverse type was very close. Normalization (Figure 6B) revealed the difference in the relative phase, expressed as X1N1/ECL. In the standard type, it was located at a delay phase, while in the reverse and intermediate types, it was seen at a later acceleration phase. In those 2 types, ECL shortening shifted the delay phase to the acceleration phase by increasing X1N1/ECL and introduced bradycardiac trigeminy with initial acceleration {b.aX} or {b.bX}. For tachycardiac trigeminy to appear at a delay phase of shorter ECL, abbreviated X1N1 (<500 ms) corresponding to HR > 150 bpm will be required.
Meanwhile, longer ECL could decrease X1N1/ECL and introduce standard-type tachycardiac trigeminy {abX} with initial delay. If the ECL was much longer (>3000 ms), N2 decelerated again, and quadrigeminy {aabX} was introduced.
Our TRP in Figure 7A shows the gradual transitions from the standard to intermediate and to reverse types that are all located on a single regression line. In the intermediate type, strong modulation with a shortest ω of less than 0.30 was suspected from the location of interpolated bigeminy, as we reported.13 The complex HR dependence of total VPCs in Figures 4 and 5 could be owing to the modulation of the ectopic focus.7
Limitations and clinical implications
This study has several limitations. First, a major point exists in the lack of an established definition for ECL. Since our ECL was tentatively defined as the averaged bigeminy or trigeminy intervals, careful examination will be required by comparing the X1X2 interval without a conducted QRS or vagal maneuvers. ECL in the standard type included the delay-phase trigeminy, while trigeminy was excluded in the reverse and intermediate types. Therefore, the use of only bigeminy intervals for ECL can be considered (Table 1). Second, T/B-PEI is useful at a limited range of PEI or SCL, as shown in simulation.13 However, the bimodal distribution of trigeminy, as shown in Figure 5B (mixed subtype) by visual inspection, cannot be discriminated. Third, contrary to the experimental study, measurable PEI range was restricted by the HR range in common daily life (40–140 bpm), refractory periods of the ventricle (<300 ms), and ectopic focus (<400 ms). As a consequence, the delay phase in the reverse type requiring shorter PEI (HR >150 bpm) became invisible. The possibility of reentry or triggered activity still remains.
Despite these limitations, we believe that our ECL based on T/B-PEI has clinical implications because of its simple logic to estimate ECL, which could be a risk factor for sudden cardiac death.18 Among the several hypotheses for the VPC mechanism, we believe the automaticity observed in the guinea pig pulmonary bulbus could be a potent proof for our modulation theory.19 Similar automaticity found in the pulmonary vein is a strong rationale for the catheter ablation of atrial fibrillation.1,20 PIC and its normalized form can clarify the features of the individual VPCs. As we adopted T/B-PEI for the ECL estimation, evaluation of its approximately normal distribution will be needed, especially by discriminating the PEI of interpolated and compensatory bigeminy. Our reverse type corresponded to the classical parasystole,4 while our standard type is another version with slower ECL. Whether ECL, SCL, or T/B-PEI can be an independent risk factor for serious ventricular arrhythmia should be carefully studied in a larger population.17,18 We hope to know if the delay phase in the standard type could truly protect the ectopic focus.5
Conclusion
We confirmed that T/B-PEI determines T/B-IEI and ECL by discriminating the distribution patterns. Depending on our modulation logics using symbols, we stressed the role of normalized PIC subdivided by ECL. When the ECL was short, delay phase observed in the standard type was suppressed, and acceleration phase became dominant, introducing the intermediate and reverse types.
Funding Sources
This research did not receive any specific grant from funding agencies in the public, commercial, or not-for-profit sectors.
Disclosures
The authors have no conflicts to disclose.
Authorship
All authors attest they meet the current ICMJE criteria for authorship.
Patient Consent
All patients provided written informed consent.
Ethics Statement
The present study was approved by the Review Board of Dokkyo Medical University, Saitama Medical Center. The research reported in this paper adhered to human research guidelines (revised version of Helsinki Declaration, 2013).
Footnotes
Supplementary data associated with this article can be found in the online version at https://doi.org/10.1016/j.hroo.2021.03.003.
Appendix. Supplementary data
References
- 1.Haïssaguerre M., Jaïs P., Shah D.C. Spontaneous initiation of atrial fibrillation by ectopic beats originating in the pulmonary veins. N Engl J Med. 1998;339:659–666. doi: 10.1056/NEJM199809033391003. [DOI] [PubMed] [Google Scholar]
- 2.Hamon D., Abehsira G., Gu K. Circadian variability patterns predict and guide premature ventricular contraction ablation procedural inducibility and outcomes. Heart Rhythm. 2018;15:99–106. doi: 10.1016/j.hrthm.2017.07.034. [DOI] [PubMed] [Google Scholar]
- 3.Voskoboinik A., Hadjis A., Alhede C. Predictors of adverse outcome in patients with frequent premature ventricular complexes: The ABC-VT risk score. Heart Rhythm. 2020;17:1066–1074. doi: 10.1016/j.hrthm.2020.02.020. [DOI] [PubMed] [Google Scholar]
- 4.Watanabe Y. Reassessment of parasystole. Am Heart J. 1971;81:451–466. doi: 10.1016/0002-8703(71)90359-0. [DOI] [PubMed] [Google Scholar]
- 5.Cohen H., Langendorf R., Pick A. Intermittent parasystole - mechanism of protection. Circulation. 1973;48:761–774. doi: 10.1161/01.cir.48.4.761. [DOI] [PubMed] [Google Scholar]
- 6.Jalife J., Moe G.K. Effect of electrotonic potentials on pacemaker activity of canine Purkinje fibers in relation to parasystole. Circ Res. 1976;39:801–808. doi: 10.1161/01.res.39.6.801. [DOI] [PubMed] [Google Scholar]
- 7.Moe G.K., Jalife J., Mueller W.J. A mathematical model of parasystole and its application to clinical arrhythmias. Circulation. 1977;56:968–979. doi: 10.1161/01.cir.56.6.968. [DOI] [PubMed] [Google Scholar]
- 8.Ikeda N., Yoshizawa S., Sato T. Difference equation model of ventricular parasystole as an interaction between cardiac pacemakers based on the phase response curve. J Theor Biol. 1983;103:439–465. doi: 10.1016/0022-5193(83)90297-7. [DOI] [PubMed] [Google Scholar]
- 9.Ikeda N., Yamamoto H., Sato T. Pathology of the pacemaker network. Mathematical Modeling. 1986;7:889–904. [Google Scholar]
- 10.Oreto G., Satullo G., Luzza F. Supernormal modulation of ventricular parasystole: the triphasic phase response curve. Am J Cardiol. 1986;57:283–290. doi: 10.1016/0002-9149(86)90063-9. [DOI] [PubMed] [Google Scholar]
- 11.Nilsson G., Bandh S., Ahren T. Distribution patterns of ventricular premature complexes at different heart rates. Am J Cardiol. 1987;59:857–861. doi: 10.1016/0002-9149(87)91106-4. [DOI] [PubMed] [Google Scholar]
- 12.Takayanagi K., Tanaka K., Kamishirado H. Direct discrimination and full-day disclosure of ventricular parasystole on new heart rate tachograms. J Cardiovasc Electrophysiol. 2000;11:168–177. doi: 10.1111/j.1540-8167.2000.tb00316.x. [DOI] [PubMed] [Google Scholar]
- 13.Ikeda N., Takayanagi K., Takeuchi A. Two types of distribution patterns of bigeminy and trigeminy in long-term ECG: a model-based interpretation. Computers in Cardiology. 2008;35:1049–1052. [Google Scholar]
- 14.Takayanagi K., Sakai Y. Mechanism of ventricular premature contractions showing interpolated bigeminy. Strong modulation hypothesis. J Arrhythmia. 2009;25:177–192. [Google Scholar]
- 15.Takayanagi K., Nakahara S., Toratani N. Strong modulation of ectopic focus as a mechanism of repetitive interpolated ventricular bigeminy with heart rate doubling. Heart Rhythm. 2013;10:1433–1440. doi: 10.1016/j.hrthm.2013.06.013. [DOI] [PubMed] [Google Scholar]
- 16.Bishop C.M. Springer; New York: 2006. Pattern Recognition and Machine Learning; pp. 179–224. (Chapter 4; Linear models for classification) [Google Scholar]
- 17.Glass L., Lerma C., Shrier A. New methods for the analysis of heartbeat behavior in risk stratification. Front Physiol. 2011;2:88. doi: 10.3389/fphys.2011.00088. [DOI] [PMC free article] [PubMed] [Google Scholar]
- 18.Lerma C., Gorelick A., Ghanem R.N., Glass L., Huikuri H.V. Patterns of ectopy leading to increased risk of fatal or near-fatal cardiac arrhythmia in patients with depressed left ventricular function after an acute myocardial infarction. Europace. 2013;15:1304–1312. doi: 10.1093/europace/eus415. [DOI] [PubMed] [Google Scholar]
- 19.Arita M., Kawata H., Goto M. Measurement of spontaneous electrical activity in the guinea pig pulmonary bulbus by a microelectrode. Jpn J Physiol. 1969;19:403–419. doi: 10.2170/jjphysiol.19.403. [DOI] [PubMed] [Google Scholar]
- 20.Ito M., Arita M., Saeki K., Tanoue M., Fukushima I. Functional properties of sinocaval conduction. Jpn J Physiol. 1967;17:174–189. doi: 10.2170/jjphysiol.17.174. [DOI] [PubMed] [Google Scholar]
Associated Data
This section collects any data citations, data availability statements, or supplementary materials included in this article.